Contribution of University to Environmental Energy Sustainability in the City


Abstract
:1. Introduction
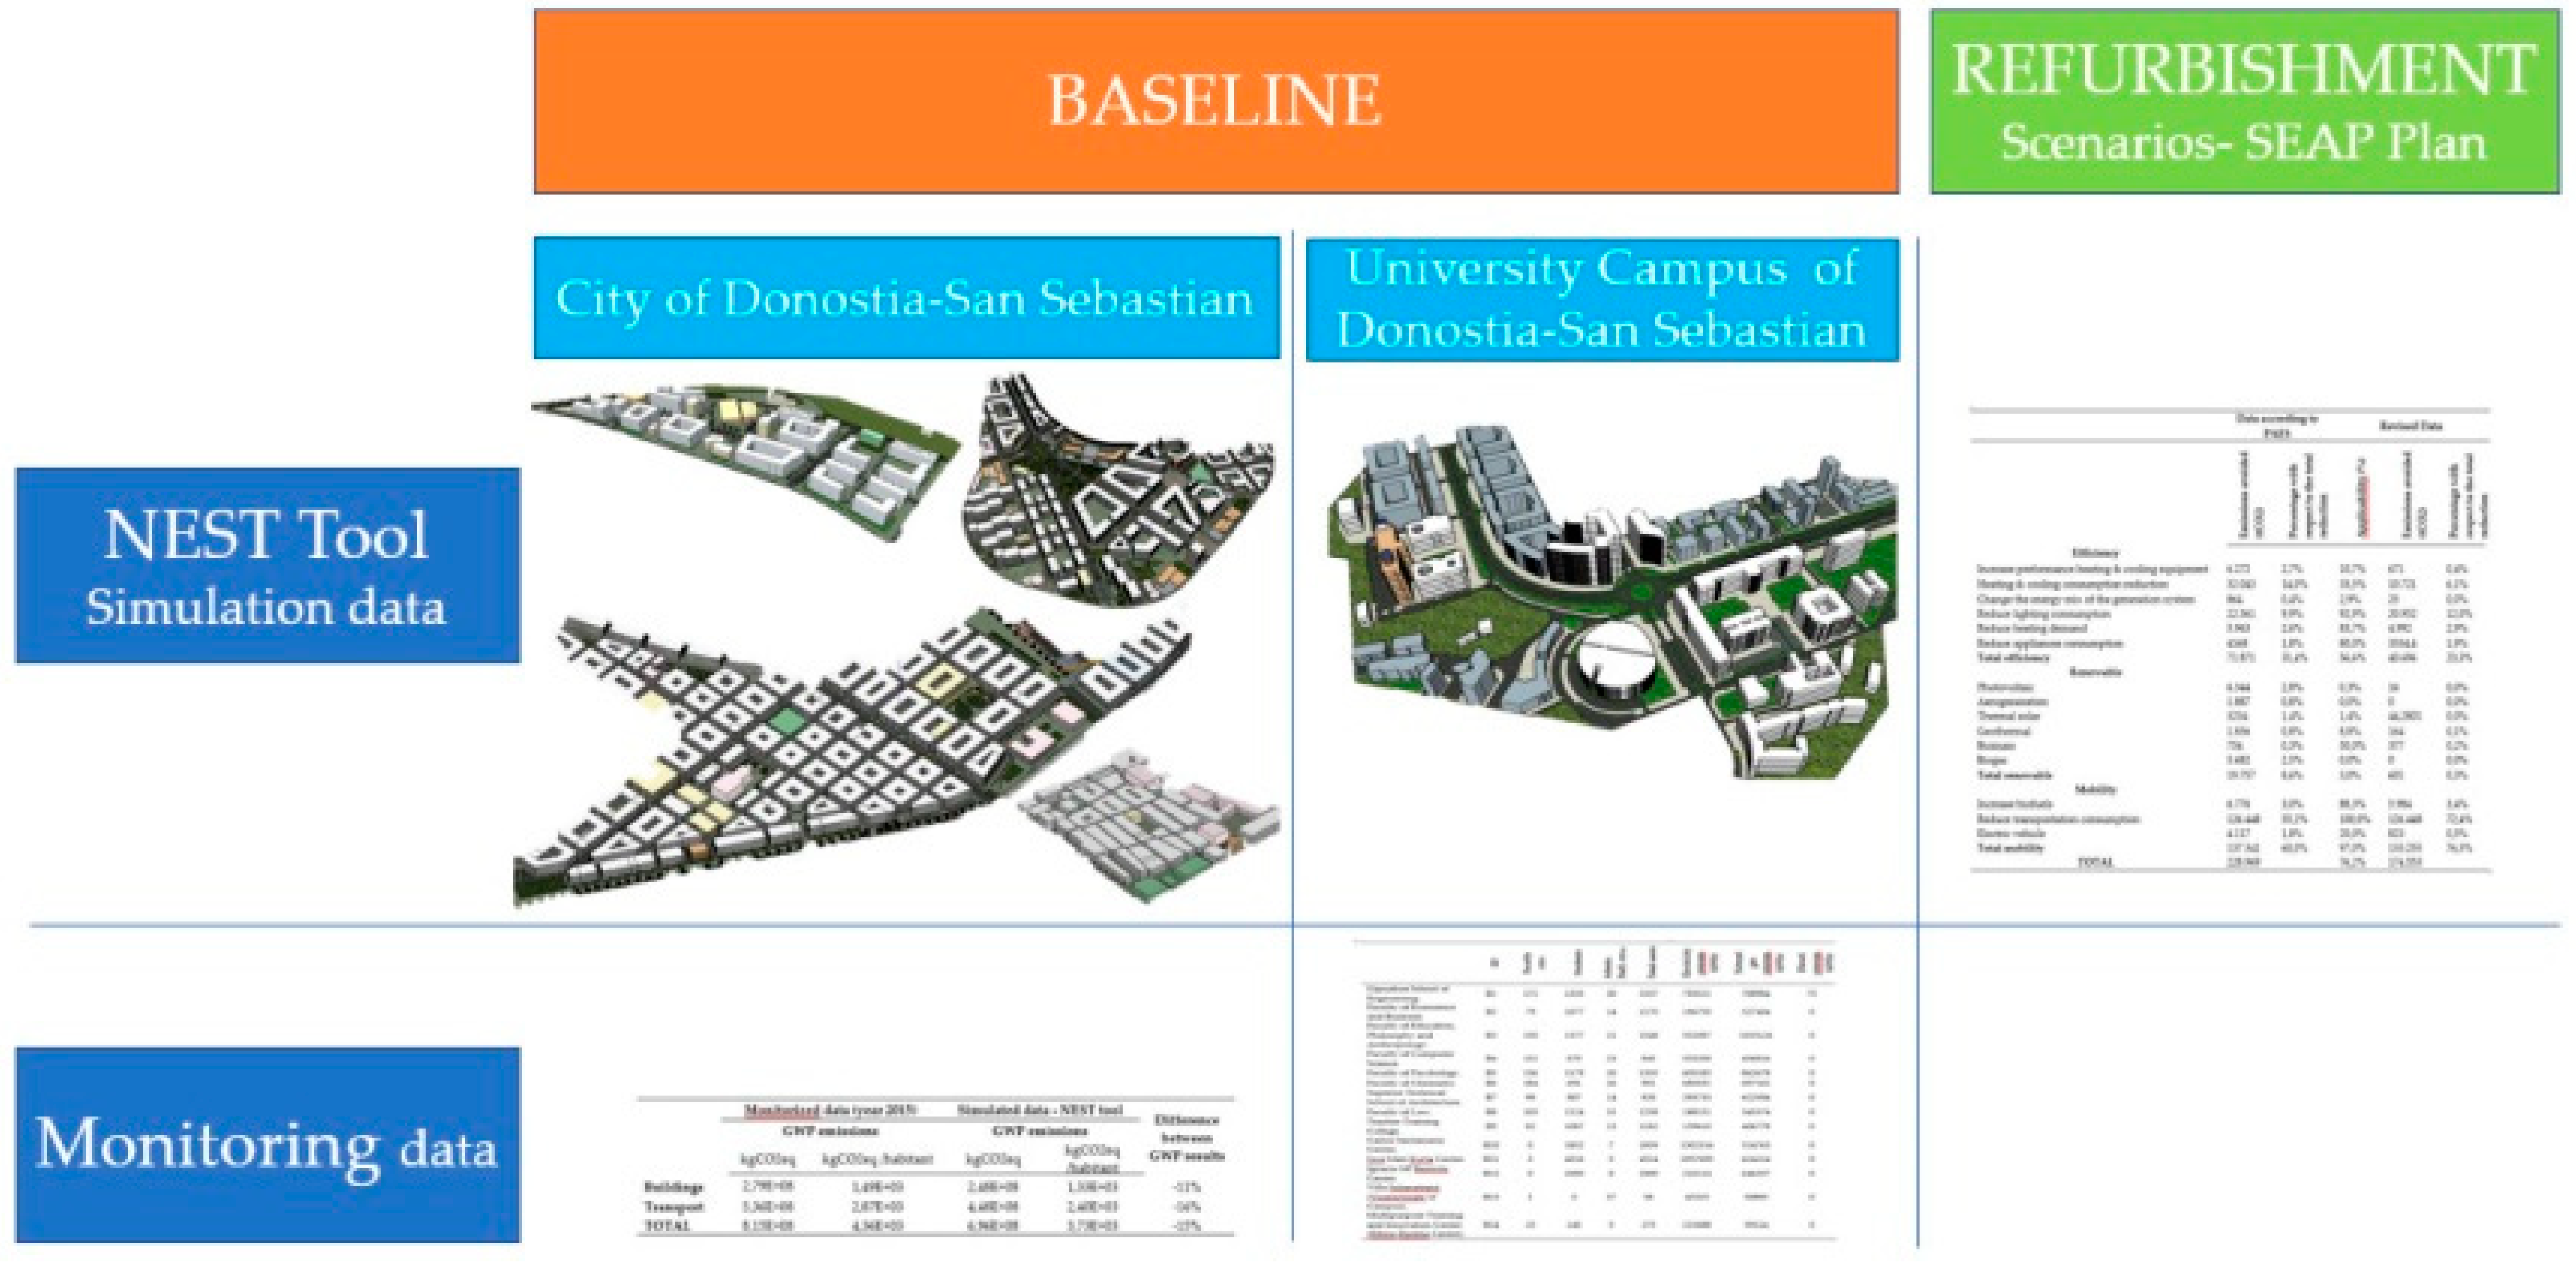
2. Methods
2.1. Study Case: The University Campus and the City
2.1.1. City of Donostia-San Sebastián
2.1.2. Campus of the University of the Basque Country in Donostia-San Sebastián
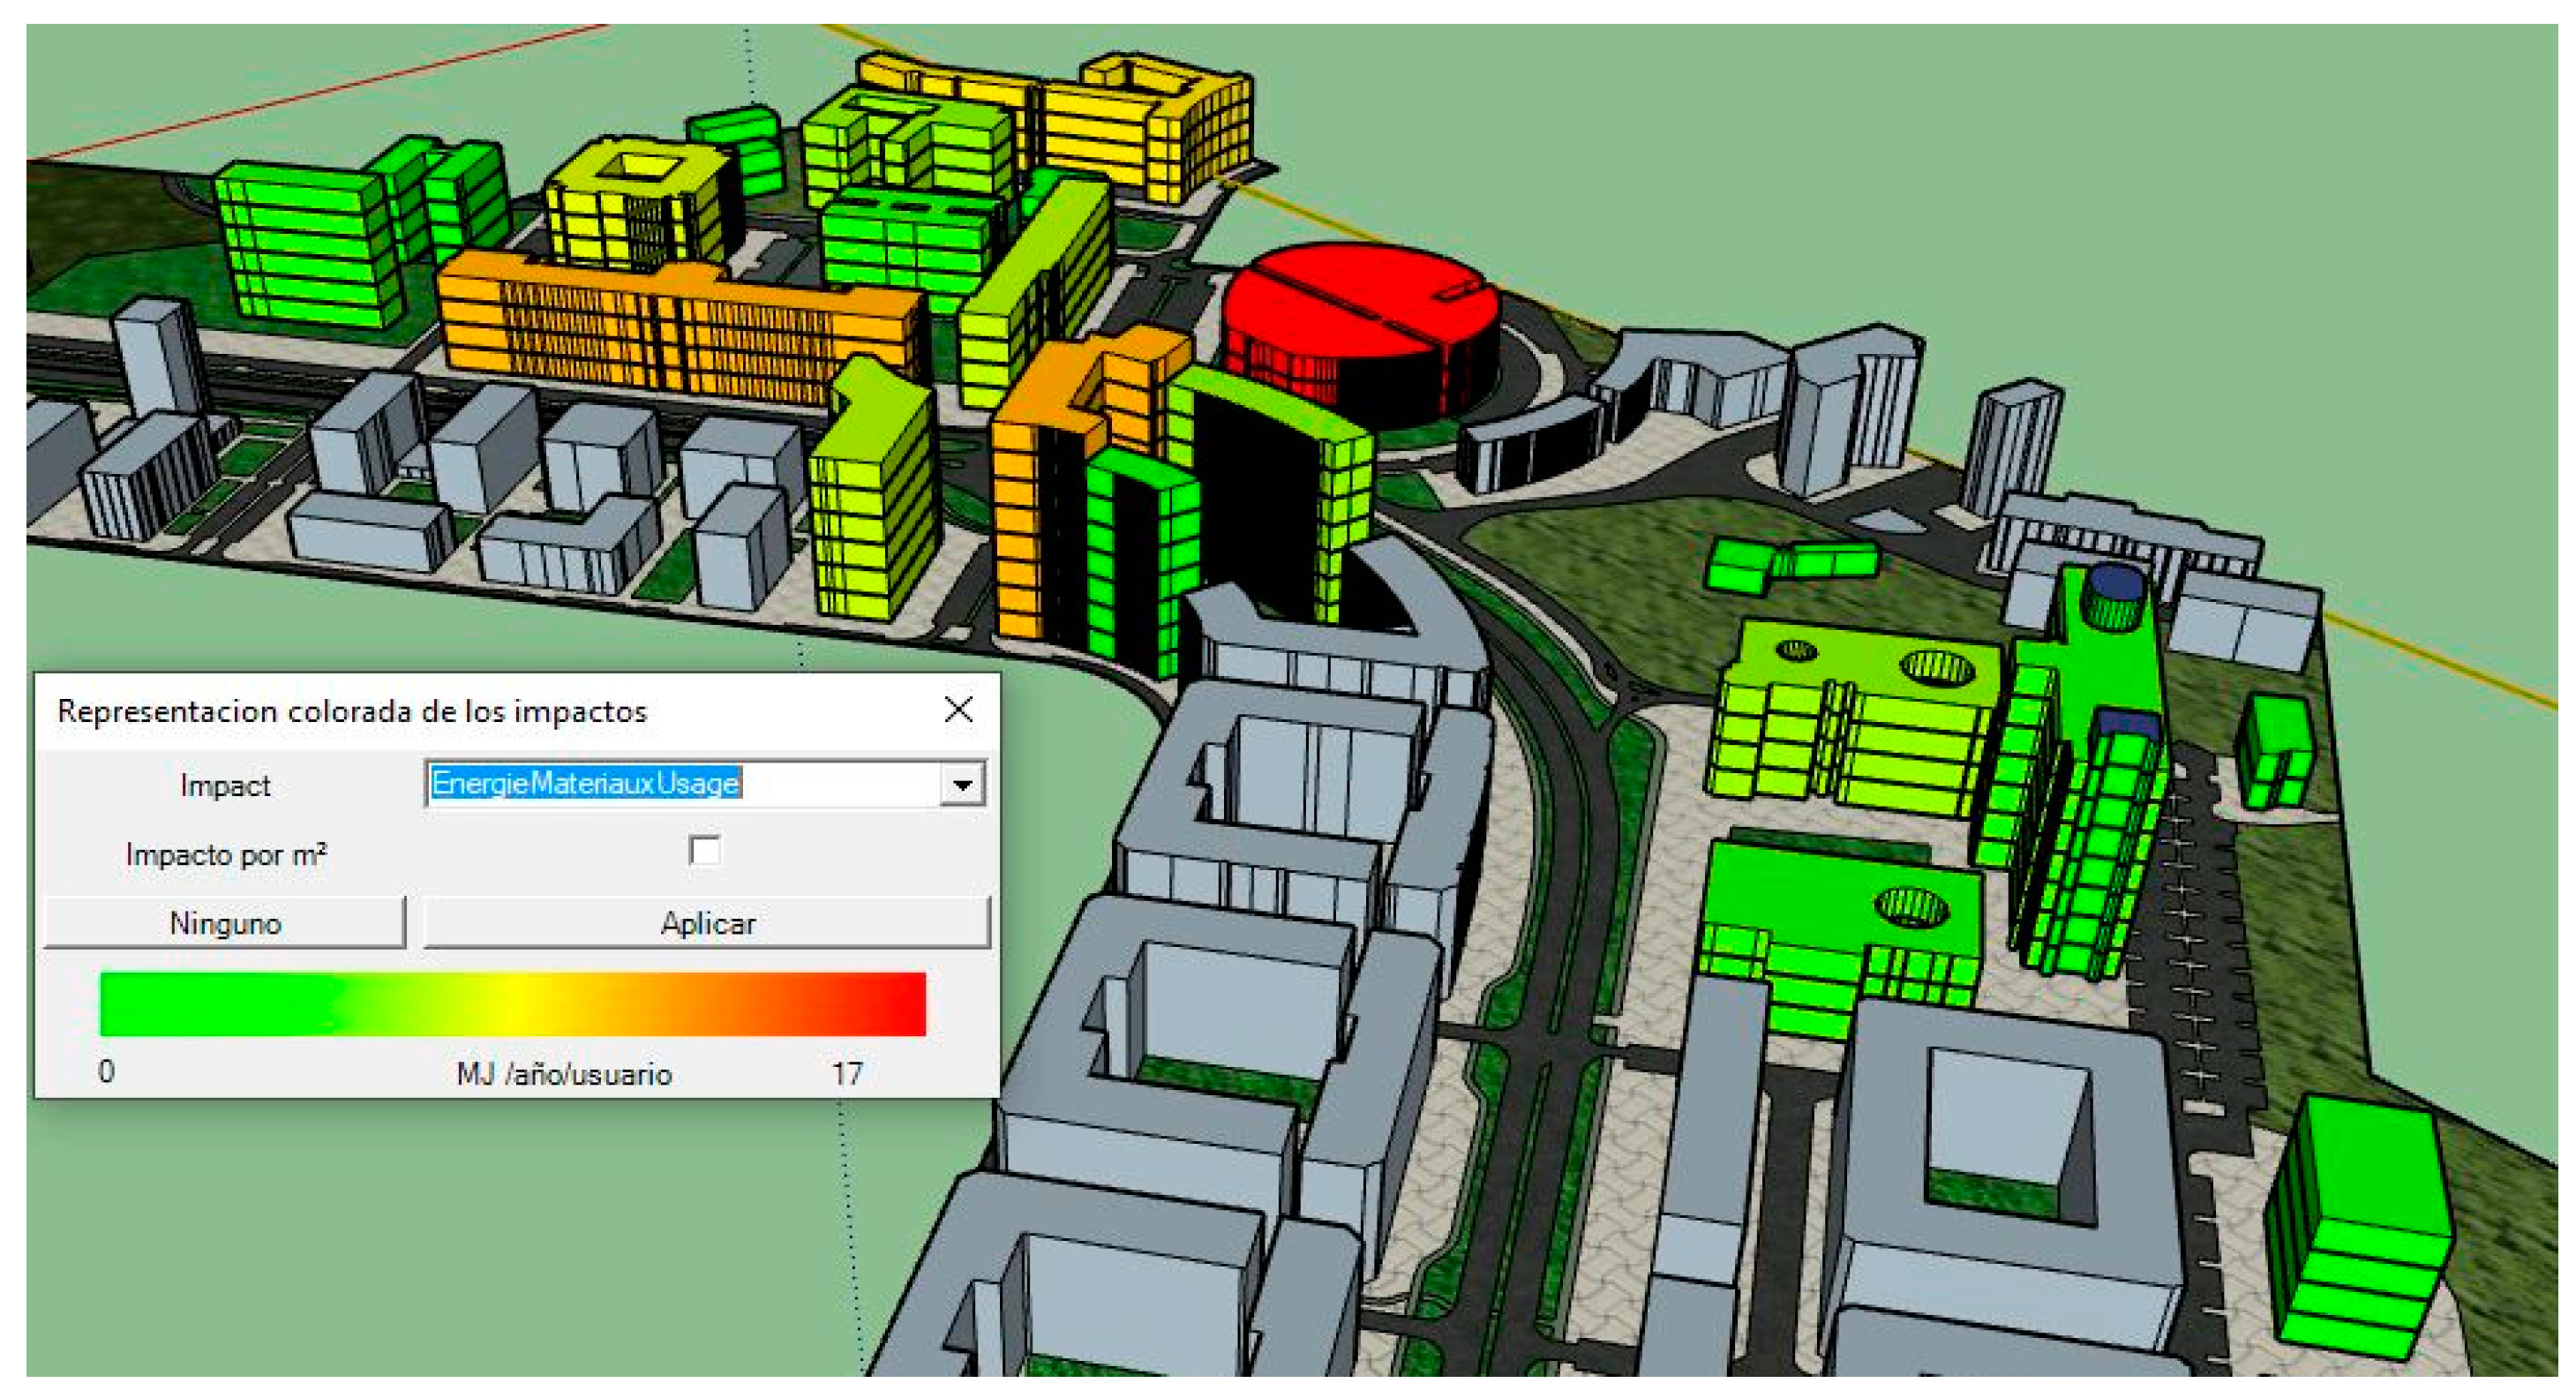
2.2. Assessment Tool: NEST
2.3. Scenarios and Strategies
2.3.1. Baseline
2.3.2. Refurbishment Scenarios
3. Results
3.1. Baseline Scenario
3.1.1. City of Donostia-San Sebastián
3.1.2. Campus of Donostia-San Sebastián
3.2. Refurbishment Scenarios
3.2.1. Joint Plan Scenarios
3.2.2. Results of Joint Refurbishment Scenario
4. Discussion
Author Contributions
Funding
Acknowledgments
Conflicts of Interest
Appendix A

| ID | Faculty (PDI) | Students | Admin. Staff. (PAS) | Total Users | Electricity Consumption (kWh) | Natural Gas Consumption (kWh) | Diesel Consumption (kWh) | |
|---|---|---|---|---|---|---|---|---|
| Gipuzkoa School of Engineering | B1 | 172 | 1335 | 30 | 1537 | 793,521 | 708,984 | 75 |
| Faculty of Economics and Business | B2 | 79 | 1077 | 14 | 1170 | 196,750 | 527,404 | 0 |
| Faculty of Education, Philosophy and Anthropology | B3 | 150 | 1377 | 21 | 1548 | 552,087 | 1,033,126 | 0 |
| Faculty of Computer Science | B4 | 152 | 670 | 23 | 845 | 553,200 | 456,816 | 0 |
| Faculty of Psychology | B5 | 136 | 1179 | 20 | 1335 | 605,183 | 862,678 | 0 |
| Faculty of Chemistry | B6 | 184 | 691 | 26 | 901 | 685,031 | 697,161 | 0 |
| Superior Technical School of Architecture | B7 | 99 | 807 | 14 | 920 | 293,733 | 622,594 | 0 |
| Faculty of Low | B8 | 103 | 1124 | 31 | 1258 | 188,151 | 545,374 | 0 |
| Teacher-Training College | B9 | 82 | 1087 | 13 | 1182 | 159,610 | 406,778 | 0 |
| Carlos Santamaria Center | B10 | 0 | 1852 | 7 | 1859 | 1,302,316 | 524,763 | 0 |
| Joxe Mari Korta Center | B11 | 3 | 4516 | 5 | 4524 | 1,957,695 | 624,214 | 0 |
| Ignacio Ma Barriola Center | B12 | 0 | 1000 | 0 | 1000 | 216,114 | 646,357 | 0 |
| Villa Julianategui (Vicerectorate of Campus) | B13 | 1 | 0 | 57 | 58 | 45,325 | 50,895 | 0 |
| Multipurpose Training and Innovation Center (Elbira Zipitria Center) | B14 | 25 | 245 | 5 | 275 | 215,688 | 59,124 | 0 |
Appendix B
| Energy Saving (kwh) | Emissions Avoided (tCO2-eq) | Percentage of Emissions Avoided with Respect to the Total (%) | Real Application | “Real” Emissions Avoided (tCO2-eq) | |
|---|---|---|---|---|---|
| Increase Performance Heating and Cooling Equipment | |||||
| 1.1.1 Replace 17 boiler (condensation/low temperature) and heat pumps | 1,029,420 | 214 | 0.087% | 94% | 201 |
| 1.1.2 Improve efficiency of 17 emitting systems | 302,670 | 56 | 0.023% | 53% | 30 |
| 1.2.7 Replacement of existing boilers in 15,760 homes | 21,568,943 | 3990 | 1.616% | 6% | 239 |
| 1.3.1 Improve boiler performance of 30% | 10,875,000 | 2012 | 0.815% | 10% | 201 |
| Heating and Cooling Consumption Reduction | |||||
| 1.1.4 Regulation of air conditioning and improvement of insulation of rehabilitation equipment | 6,131,692 | 993 | 0.402% | 100% | 993 |
| 1.1.8 Expand energy telemanagement systems | 3,432,719 | 970 | 0.393% | 35% | 339 |
| 1.1.10 Good practices regarding heating and lighting control | 119,723 | 30 | 0.012% | 100% | 30 |
| 1.1.11. Implement energy management software | 1,837,862 | 517 | 0.209% | 100% | 517 |
| 1.1.14 Training of municipal technical staff | 869,051 | 209 | 0.085% | 100% | 209 |
| 1.2.0 Citizen awareness campaigns | 21,406,433 | 5326 | 2.157% | 100% | 5326 |
| 1.3.6 Energy management of 75% of buildings in the sector | 43,345,000 | 11,220 | 4.544% | 1% | 112 |
| 1.3.8 Preparation of guides with saving measures for the tertiary sector | 42,852,124 | 12,778 | 5.175% | 25% | 3194 |
| Change the Energy Mix of the Generation System | |||||
| 1.2.9 Centralized systems (DH) in residential areas of Asia | 540,738 | 100 | 0.040% | 25% | 25 |
| 1.3.4 Install microcogeneration in the hotel and residential sector of the elderly (34 establishments). The average size of each installation of this type is 35 kWt and 16 kWe | 3,848,891 | 410 | 0.166% | 0% | 0 |
| 1.3.9 Install centralized systems (DH) in the services sector (three systems are considered) | 1,912,100 | 354 | 0.143% | 0% | 0 |
| Reduce Lighting Consumption | |||||
| 1.1.5 Improve the lighting installations of 68 buildings | 879,134 | 334 | 0.135% | 40% | 134 |
| 1.1.15 Replacement mercury vapor lamps | 37,454 | 14 | 0.006% | 100% | 14 |
| 1.1.16 Prevent light pollution, improving the energy efficiency of luminaires | 1,530,000 | 568 | 0.230% | 100% | 568 |
| 1.1.17 Public lighting control system | 20,000 | 7 | 0.003% | 100% | 7 |
| 1.1.18 Energy management software for public lighting | 50,340 | 19 | 0.008% | 100% | 19 |
| 1.1.19 Implement innovative lighting technologies | 39,850 | 15 | 0.006% | 100% | 15 |
| 1.1.20 Lighting system regulation systems | 3,000,000 | 1113 | 0.451% | 80% | 890 |
| 1.2.6 Improve efficiency of the home lighting system (50,000 bulbs) | 2,682,750 | 1020 | 0.413% | 100% | 1020 |
| 1.2.8 Renew electrical installations | 3,900,722 | 1483 | 0.601% | 20% | 297 |
| 1.2.11 Environmental education in the school environment | 2,378,493 | 627 | 0.254% | 100% | 627 |
| 1.3.2 Renew street lighting | 45,675,000 | 17,361 | 7.031% | 100% | 17,361 |
| Reduce Heating Demand | |||||
| 1.1.6 Improve the thermal envelope of buildings with characteristics that allow | 1,888,188 | 349 | 0.141% | 16% | 56 |
| 1.2.1 Implement high-efficiency criteria in new urban developments | 161,039 | 61 | 0.025% | 100% | 61 |
| 1.2.2 Energy certification A in 100% of new public housing | 881,250 | 250 | 0.101% | 50% | 125 |
| 1.2.4 Improve the efficiency of 20% of the windows | 15,988,662 | 2958 | 1.198% | 100% | 2958 |
| 1.2.13 Renovation of 5% of existing homes (3807) with high benefits | 9,341,901 | 1731 | 0.701% | 100% | 1731 |
| 1.3.3 Certification A in 50% of the new tertiary buildings | 3,314,000 | 614 | 0.249% | 10% | 61 |
| Reduce Appliances Consumption | |||||
| 1.2.5 Renew appliances with better energy efficiency in 25% of appliances | 12,921,792 | 4168 | 1.688% | 80% | 3334 |
| Photovoltaic | |||||
| 2.1.1 Install PV of 149,985 m2 (6.82 MWp) in public facilities | Non determin, | 2585 | 1.047% | 0.25% | 6 |
| 2.3.1 Install PV on the sides of the tracks (65,127 m2—2960 kWP) | Non determin, | 1122 | 0.454% | 0% | 3 |
| 2.3.2 Install PV in the buckets of large surfaces (87,682 m2—3980 kWP) | Non determin, | 1511 | 0.612% | 0% | 4 |
| 2.3.3 Install PV in the car parks (2970 kWP) | Non determin, | 1126 | 0.456% | 0% | 3 |
| Aerogenerators | |||||
| 2.1.2 Wind turbine installation. It is planned to install 7.2 MW | Non determin, | 1887 | 0.764% | 0% | 0 |
| Thermal Solar | |||||
| 2.1.3 Ensure the efficient operation of solar thermal systems | Non determin, | 40 | 0.016% | 100% | 40 |
| 2.1.4 Implement ST 2000 m2 on roofs of public buildings | Non determin, | 259 | 0.105% | 0% | 0 |
| 2.2.3 Install 13,000 m2 of ST in the residential sectorl | Non determin, | 1638 | 0.663% | 0% | 0 |
| 2.3.4 Install 10,000 m2 of ST in the service sector | Non determin, | 1297 | 0.525% | 0% | 4 |
| Geotermia | |||||
| 2.1.5 Incorporate nine units with a total of 630 kW of heat production with geothermal systems | Non determin, | 684 | 0.277% | 24% | 164 |
| 2.3.6 Climate systems with geothermal support | Non determin, | 1172 | 0.475% | 0% | 0 |
| Biomass | |||||
| 2.2.1 Forty installations with 3.2 MWt of biomass in the residential sector | Non determin, | 754 | 0.305% | 50% | 377 |
| Biogas | |||||
| 2.2.2 Biogas exploitation biogas plant | Non determin, | 5682 | 2.301% | 0% | 0 |
| Increase Biofuels | |||||
| 3.1.1 Acquire clean vehicles by the town hall | 4,371,335 | 1182 | 0.479% | 33% | 390 |
| 3.1.2 Encourage the use of clean fuels in vehicles that provide public services | 2,185,667 | 591 | 0.239% | 100% | 591 |
| 3.2.1 Acquire clean vehicles by the municipality | 17,823,370 | 3563 | 1.443% | 100% | 3563 |
| 3.2.3 Promotion of clean distribution vehicles | 4,798,600 | 1440 | 0.583% | 100% | 1440 |
| Reduce Transportation Consumption | |||||
| 3.1.3 Development of the sustainable mobility plan | 337,634 | 99 | 0.040% | 100% | 99 |
| 3.2.4 Program to improve and boost pedestrian mobility | 63,208,176 | 12,635 | 5.117% | 100% | 12,635 |
| 3.2.5 Program to improve and boost cycling mobility | 63,208,176 | 12,635 | 5.117% | 100% | 12,635 |
| 3.2.6 Program to improve the competitiveness of public transportation | 221,228,617 | 44,222 | 17.909% | 100% | 44,222 |
| 3.2.7 Private vehicle and freight transport management program | 189,624,529 | 37,905 | 15.351% | 100% | 37,905 |
| 3.2.8 Implement mobility management program | 63,208,176 | 12,635 | 5.117% | 100% | 12,635 |
| 3.2.9 Implement education and communication program in sustainable mobility | 31,604,077 | 6317 | 2.558% | 100% | 6317 |
| Electric Vehicle | |||||
| 3.2.2 Promotion of the electric vehicle | 28,151,007 | 4117 | 1.667% | 20% | 823 |
References
- United Nations. The World’s Cities in 2016: Data Booklet; Economic and Social Affair: New York, NY, USA, 2016. [Google Scholar]
- Khazaei, M.; Razavian, M.T. Sustainable urban development (an innovative approach in the development of cities around the world). Int. Res. J. Appl. Basic Sci. 2013, 4, 1543–1547. [Google Scholar]
- Swilling, M.; Hajer, M.; Baynes, T.; Bergesen, J.; Labbé, F.; Musango, J.K.; Ramaswami, A.; Robinson, B.; Salat, S.; Suh, S.; et al. The Weight of Cities Resource Requirements of Future Urbanization. Available online: https://europa.eu/capacity4dev/unep/documents/weight-cities-resource-requirements-future-urbanization (accessed on 18 December 2019).
- UN Habitat. World Cities Report 2016, Urbanization and Development: Emerging Futures, Key Findings and Messages; UN Habitat: Nairobi, Kenya, 2016. [Google Scholar]
- DESA 2018. Available online: https://www.un.org/development/desa/publications/2018-revision-of-world-urbanization-prospects.html (accessed on 18 December 2019).
- IEA. World Energy Outlook; International Energy Agency: Paris, France, 2016; p. 28. [Google Scholar]
- Muñoz, P.; Morales, P.; Letelier, V.; Muñoz, L.; Mora, D. Implications of life cycle energy assessment of a new school building, regarding the nearly zero energy buildings targets in EU: A case of study. Sustain. Cities Soc. 2017, 32, 142–152. [Google Scholar] [CrossRef]
- Tronchin, L.; Fabbri, K. Energy performance building evaluation in Mediterranean countries: Comparison between software simulations and operating rating simulation. Energy Build. 2008, 40, 1176–1187. [Google Scholar] [CrossRef]
- UNEP. Building Day Brochure; United Nations Environment Programme: Nairobi, Kenyan, 2015. [Google Scholar]
- Dogruyol, K.; Aziz, Z.; Arayici, Y. Eye of Sustainable Planning: A Conceptual Heritage-Led Urban Regeneration Planning Framework. Sustainability 2018, 10, 1343. [Google Scholar] [CrossRef] [Green Version]
- Catherine, C.-V.; Philippe, O. Concevoir et Évaluer un Projet d’éco-Quartier: Avec le Référentiel INDI; Editions du Moniteur: Paris, France, 2012. [Google Scholar]
- Oliver-Solà, J.; Josa, A.; Arena, A.P.; Gabarrell, X.; Rieradevall, J. The GWP-Chart: An environmental tool for guiding urban planning processes. Application to concrete sidewalks. Cities 2011, 28, 245–250. [Google Scholar] [CrossRef]
- Yigitcanlar, T.; Teriman, S. Rethinking sustainable urban development: Towards an integrated planning and development process. Int. J. Environ. Sci. Technol. 2015, 12, 341–352. [Google Scholar] [CrossRef] [Green Version]
- Morais, P.; Camanho, A.S. Evaluation of performance of European cities with the aim to promote quality of life improvements. Omega 2011, 39, 398–409. [Google Scholar] [CrossRef] [Green Version]
- Arundel, J.; Lowe, M.; Hooper, P.; Roberts, R.; Rozek, J.; Higgs, C.; Giles-Corti, B. Creating Liveable Cities in Australia. Mapping Urban Policy Implementation and Evidence-Based National Liveability Indicators; Centre for Urban Research RMIT University: Melbourne, Australia, 2017. [Google Scholar]
- Beatriz, V.A.; Pilar, M.; David, R.G. Sustainable Urban Liveability: A Practical Proposal Based on a Composite Indicator. Sustainability 2019, 11, 86. [Google Scholar]
- Qunxi, G.; Min, C.; Xianli, Z.; Zhigeng, J. Sustainable Urban Development System Measurement Based on Dissipative Structure Theory, the Grey Entropy Method and Coupling Theory: A Case Study in Chengdu, China. Sustainability 2019, 11, 293. [Google Scholar]
- Pingtao, Y.; Weiwei, L.; Danning, Z. Assessment of City Sustainability Using MCDM with Interdependent Criteria Weight. Sustainability 2019, 11, 1632. [Google Scholar]
- Wu, J. Landscape sustainability science: Ecosystem services and human well-being in changing landscapes. Landsc. Ecol. 2013, 28, 999–1023. [Google Scholar] [CrossRef]
- Simón, M.; Cristina, G.; Antonio, H.; Vicente, A. Sustainability Assessment of Constructive Solutions for Urban Spain: A Multi-Objective Combinatorial Optimization Problem. Sustainability 2019, 11, 839. [Google Scholar]
- Lee, W.L. A comprehensive review of metrics of building environmental assessment schemes. Energy Build. 2013, 62, 403–413. [Google Scholar] [CrossRef]
- Reith, A.; Orova, M. Do green neighbourhood ratings cover sustainability? Ecol. Indic. 2015, 48, 660–672. [Google Scholar] [CrossRef]
- Sharifi, A.; Murayama, A. A critical review of seven selected neighborhood sustainability assessment tools. Environ. Impact Assess. Rev. 2013, 38, 73–87. [Google Scholar] [CrossRef]
- Braulio-Gonzalo, M.; Bovea, M.D.; Ruá, M.J. Sustainability on the urban scale: Proposal of a structure of indicators for the Spanish context. Environ. Impact Assess. Rev. 2015, 53, 16–30. [Google Scholar] [CrossRef] [Green Version]
- Xabat, O.; Nekane, H.; Iñaki, P.; Jose Luis, I.; Lara, M.; Panagiotis, S. Automatised and georeferenced energy assessment of an Antwerp district based on cadastral data. Energy Build. 2018, 173, 176–194. [Google Scholar]
- VITO. Dynamic Energy Atlas Tool. Available online: https://geoflex-solutions.eu/c/DEA%20-%20Dynamic%20Energy%20Atlas/ (accessed on 18 December 2019).
- Walter, E.; Kämpf, J.H. A verification of CitySim results using the BESTEST and monitored consumption values. In Proceedings of the 2nd Building Simulation Applications Conference, Bolzano, Italy, 4–6 February 2015; pp. 215–222. [Google Scholar]
- Yepez, G. Construction d’un Outil D’évaluation Environnementale des Écoquartiers: Vers une Méthode Systémique de Mise en Oeuvre de la Ville Durable; Université Bordeaux: Bourdeaux, France, 2011. [Google Scholar]
- Xabat, O.; Maxime, P.; Lara, M.; Alexandre, E.; Iker, M. Sustainability assessment of three districts in the city of Donostia through the NEST simulation tool. Nat. Res. Forum 2016, 40, 156–168. [Google Scholar]
- William, V.-C.; Xavier, P.-P.; Sergio, L.-M. Application of a Smart City Model to a Traditional University Campus with a Big Data Architecture: A Sustainable Smart Campus. Sustainability 2019, 11, 2857. [Google Scholar]
- Ning, A.; Marc, K.; Cynthia, K.-B.; Thomas, L.T. Sustainability assessment of universities as small-scale urban systems: A comparative analysis using Fisher Information and Data Envelopment Analysis. J. Clean. Prod. 2019, 212, 1357–1367. [Google Scholar]
- Alshuwaikhat, H.M.; Abubakar, I. An integrated approach to achieving campus sustainability: Assessment of the current campus environmental management practices. J. Clean. Prod. 2008, 16, 1777–1785. [Google Scholar] [CrossRef] [Green Version]
- Disterheft, A.; da Silva Caeiro, S.S.F.; Ramos, M.R.; de Miranda Azeiteiro, U.M. Environmental Management Systems (EMS) implementation processes and practices in European higher education institutions top-down versus participatory approaches. J. Clean. Prod. 2012, 31, 80–90. [Google Scholar] [CrossRef]
- Chen, S.; Lu, M.; Tan, H.; Luo, X.; Ge, J. Assessing sustainability on Chinese university campuses: Development of a campus sustainability evaluation system and its application with a case study. J. Build. Eng. 2019, 24, 100747. [Google Scholar]
- Nikhat, P.; Avlokita, A. Assessment of sustainable development in technical higher education institutes of India. J. Clean. Prod. 2019, 214, 975–994. [Google Scholar]
- Paola, M.; Federico, O.; Francesco, A.; Claudia, G. Environmental performance of universities: Proposal for implementing campus urban morphology as an evaluation parameter in Green Metric. Sustain. Cities Soc. 2018, 42, 226–239. [Google Scholar]
- Paulo, J.R.; Lígia, M.C.P.; Nuno, G.; Helder, C.; Diogo, A. Sustainability Strategy in Higher Education Institutions: Lessons learned from a nine-year case study. J. Clean. Prod. 2019, 222, 300–309. [Google Scholar]
- Iñigo, L.; Xabat, O.; Cristina, M. Environmental assessment of four Basque University campuses using the NEST tool. Sustain. Cities Soc. 2018, 42, 396–406. [Google Scholar]
- Kottek, M.; Grieser, J.; Beck, C.; Rudolf, B.; Rubel, F. World Map of the Köppen-Geiger climate classification updated. Meteorol. Z. 2006, 15, 259–263. [Google Scholar] [CrossRef]
- IES. IES Virtual Environment. MacroFlo User Guide. Integrated Environmental Solutions Limited, 2014. Available online: http://www.iesve.com/downloads/help/ve2014/Thermal/MacroFlo.pdf (accessed on 18 December 2019).
- Informe anual de sostenibilidad. Donostia/San Sebastián. Observatorio de la Sostenibilidad, 2018. Available online: http://www.cristinaenea.eus/es/mnu/observatorio-de-la-sostenibilidad-informe-anual-de-sostenibilidad (accessed on 18 December 2019).
- Plan de Acción para la Energía Sostenible (PAES-SEAP) del Municipio de Donostia—San Sebastián. Available online: https://www.donostia.eus/ataria/documents/8023875/8050877/Documento+PAES_cas.pdf/b9985321-6696-4ee6-884d-3de59a9851fe (accessed on 18 December 2019).
- Plan de Acción Klima 2050 de Donostia—San Sebastián. Available online: https://www.donostia.eus/ataria/documents/8023875/8246263/Donostiako+Klima+2050+Ekintza+Plana_cas.pdf/d8c6f81c-1873-453d-b688-18b9d93f841b (accessed on 18 December 2019).
- Udalsarea 2030. Red vasca de municipio hacia la sostenibilidad. Datos supramunicipales para el cálculo del inventariado GEI del municipio de Donostia-San Sebastián. Available online: http://www.udalsarea21.net/Usuarios/Acceso.aspx?IdMenu=657A0F24-A6D1-4E5A-9A4E-548A3D551DF0&Idioma=es-ES (accessed on 20 January 2020).
- Plan Foral Gipuzkoa Energía. Diputación de Guipúzcoa. Dirección General de Medio Ambiente y Obras Hidráulicas. Available online: https://www.gipuzkoa.eus/documents/3767975/3808418/Plan+Foral+Gipuzkoa+Energ%C3%ADa.pdf/d162dce1-9eb6-48da-ada3-0dcff7854631 (accessed on 18 December 2019).
- Plan de Movilidad Urbana Sostenible. Donostia/San Sebastián. 2008–2024. Ayuntamiento de Donostia—San Sebastián. Available online: http://www.donostiafutura.com/media/uploads/publicaciones/Plan_Movilidad__Urbana_Sostenible_2008_2024.pdf (accessed on 18 December 2019).
- Agenda Local 21 Donostia—San Sebastián. Diagnóstico ambiental. Ayuntamiento de Donostia—San Sebastián, 2014. Available online: https://www.donostia.eus/ataria/documents/8023875/8050869/Des.pdf/bc9d6508-3963-4020-a874-9b397343c671 (accessed on 18 December 2019).
- Registro de Certificados de Eficiencia Energética del País Vasco. Departamento de Desarrollo Económico e Infraestructuras. Gobierno Vasco. Available online: https://apps.euskadi.eus/y67paUtilidadSeccionWar/utilidadSeccionJSP/y67painicio.do?idDepartamento=51&idioma=es (accessed on 18 December 2019).
- EHU-Aztarna Ecological and Social Footprint of the University of the Basque Country: How to Reduce Our Impact? University of the Basque Country. Available online: https://www.ehu.eus/documents/4736101/13145292/EHU-Aztarna.pdf/6cc5765d-e182-fd80-0cf8-4e9b866f375f (accessed on 18 December 2019).
- Allard, I.; Olofsson, T.; Nair, G. Energy evaluation of residential buildings: Performance gap analysis incorporating uncertainties in the evaluation methods. Build. Simul. 2018, 11, 725–737. [Google Scholar] [CrossRef]
- De Wilde, P. The gap between predicted and measured energy performance of buildings: A framework for investigation. Autom. Constr. 2014, 41, 40–49. [Google Scholar] [CrossRef]
- Jensen, T.; Chappin, É.J.L. Reducing domestic heating demand: Managing the impact of behavior-changing feedback devices via marketing. J. Environ. Manag. 2017, 197, 642–655. [Google Scholar] [CrossRef] [PubMed] [Green Version]
- European Commission. Directive 2012/27/EU of the European Parliament and of the Council of 25 October 2012 on energy efficiency, amending Directives 2009/125/EC and 2010/30/EU and repealing Directives 2004/8/EC and 2006/32/EC. Off. J. Eur. Union 2012, 55, 1–97. [Google Scholar]
- European Commission. EU 20-20-20 Objectives for 2020; Energy Efficiency Plan: Brussels, Belgium, 2011. [Google Scholar]
- Directorate-General for Research and Innovation (European Commission). The Strategic Energy Technology (SET) Plan; Joint Research Centre: Brussels, Belgium, 2018. [Google Scholar]
- European Commission. A Policy Framework for Climate and Energy in the Period From 2020 to 2030. 2014. Available online: https://eur-lex.europa.eu/legal-content/EN/TXT/?uri=CELEX:52014DC0015 (accessed on 18 December 2019).


| Monitored Data (Year 2015) | Simulated Data—NEST Tool | Difference between GWP Results | |||
|---|---|---|---|---|---|
| GWP Emissions | GWP Emissions | ||||
| Kg CO2-eq | Kg CO2-eq/habitant | Kg CO2-eq | Kg CO2-eq/habitant | ||
| Buildings | 2.79 × 10⁸ | 1.49 × 10³ | 2.48 × 10⁸ | 1.33 × 10³ | −11% |
| Transport | 5.36 × 10⁸ | 2.87 × 10³ | 4.48 × 10⁸ | 2.40 × 10³ | −16% |
| TOTAL | 8.15 × 10⁸ | 4.36 × 10³ | 6.96 × 10⁸ | 3.73 × 10³ | −15% |
| Monitored Data (Average 2015–2017 Years) | Simulated Data—NEST Tool | Difference between GWP Results | |||
|---|---|---|---|---|---|
| GWP Emissions | GWP Emissions | ||||
| Kg CO2-eq | Kg CO2-eq/habitant | Kg CO2-eq | Kg CO2-eq/habitant | ||
| Buildings | 4.87 × 10⁶ | 4.40 × 10² | 5.56 × 10⁶ | 5.02 × 10² | 14% |
| Transport | 4.94 × 10⁶ | 4.46 × 10² | 4.12 × 10⁶ | 3.72 × 10² | −21% |
| TOTAL | 1.01 × 10⁶ | 9.11 × 10² | 9.68 × 10⁶ | 8.74 × 10² | −4% |
| Data according to SEAP | Revised Data | ||||
|---|---|---|---|---|---|
| Emissions Avoided (tCO2) | Percentage with Respect to the Total Reduction | Applicability (%) | Emissions Avoided (tCO2) | Percentage with Respect to the Total Reduction | |
| Efficiency | |||||
| Increase performance heating and cooling equipment | 6272 | 2.7% | 10.7% | 671 | 0.4% |
| Heating and cooling consumption reduction | 32,043 | 14.0% | 33.5% | 10,721 | 6.1% |
| Change the energy mix of the generation system | 864 | 0.4% | 2.9% | 25 | 0.0% |
| Reduce lighting consumption | 22,561 | 9.9% | 92.9% | 20,952 | 12.0% |
| Reduce heating demand | 5963 | 2.6% | 83.7% | 4,992 | 2.9% |
| Reduce appliances consumption | 4168 | 1.8% | 80.0% | 3,334 | 1.9% |
| Total efficiency | 71,871 | 31.4% | 56.6% | 40,696 | 23.3% |
| Renewable | |||||
| Photovoltaic | 6344 | 2.8% | 0.3% | 16 | 0.0% |
| Aero generators | 1887 | 0.8% | 0.0% | 0 | 0.0% |
| Thermal solar | 3234 | 1.4% | 1.4% | 44 | 0.0% |
| Geothermal | 1856 | 0.8% | 8.8% | 164 | 0.1% |
| Biomass | 754 | 0.3% | 50.0% | 377 | 0.2% |
| Biogas | 5682 | 2.5% | 0.0% | 0 | 0.0% |
| Total renewable | 19,757 | 8.6% | 3.0% | 601 | 0.3% |
| Mobility | |||||
| Increase biofuels | 6776 | 3.0% | 88.3% | 5,984 | 3.4% |
| Reduce transportation consumption | 126,448 | 55.2% | 100.0% | 126,448 | 72.4% |
| Electric vehicle | 4117 | 1.8% | 20.0% | 823 | 0.5% |
| Total mobility | 137,341 | 60.0% | 97.0% | 133,255 | 76.3% |
| TOTAL | 228,969 | 76.2% | 174,553 | ||
| Strategic Line | Acting Group | Strategy | Strategy to Integrate in NEST | Applicability | |
|---|---|---|---|---|---|
| City of Donostia | University Campus | ||||
| Energy Efficiency | Heating and cooling consumption reduction | Climate control regulation and insulation improvement of rehabilitation equipment | 1-Improve the energy performance of existing equipment of tertiary buildings by 20% | YES | YES |
| Public awareness campaigns | 2-Reduce the energy demand of residential buildings by 25% | YES | NO | ||
| Preparation of guides with saving measures in the tertiary sector | 3-Reduce the energy demand of tertiary buildings by 20% | YES | YES | ||
| Reduce lighting consumption | Lighting system regulation systems | 4-Reduce the lighting consumption of tertiary buildings by 25% | YES | YES | |
| Improve efficiency of the home lighting system | 5-Reduce the lighting consumption of residential buildings by 30% | YES | NO | ||
| Renew street lighting | 6-Reduce the lighting consumption of commercial buildings by 40% | YES | NO | ||
| Reduce heating demand | Improve the efficiency of 20% of the windows | 7-Reduce the heating energy demand of residential buildings by 36% | YES | NO | |
| Renewal of 5% of existing homes with high benefits | |||||
| Mobility | Increase biofuels | Acquire clean vehicles through the town hall | 8-Adapt private car emissions | YES | NO |
| Acquire clean vehicles by public bodies | 9-Adapt the emissions of private cars and buses | YES | YES | ||
| Empowerment of clean distribution vehicles | |||||
| Reduce transport related consumption | Program to improve and boost pedestrian mobility | 10-Adapt the current mobility model of NEST, mainly promoting pedestrians and bicycles and trying to replace the private vehicle as much as possible with the bus or/and the train | YES | YES | |
| Cycle mobility improvement and promotion program | |||||
| Program to improve the competitiveness of public transport | |||||
| Implement mobility management program | |||||
| Implement education and communication program in sustainable mobility | |||||
| Private vehicle and freight transport management program | |||||
| Strategy | GWP Emissions (kg CO2-eq) | GWP Emissions (kg CO2-eq/person) | ||
|---|---|---|---|---|
| City of Donostia | University Campus | City of Donostia | University Campus | |
| 1 | 6.93 × 10⁸ | 9.29 × 10⁶ | 3.71 × 10³ | 8.40 × 10² |
| 2 | 6.89 × 10⁸ | 9.68 × 10⁶ | 3.69 × 10³ | 8.75 × 10² |
| 3 | 6.80 × 10⁸ | 8.57 × 10⁶ | 3.65 × 10³ | 7.74 × 10² |
| 4 | 6.89 × 10⁸ | 9.12 × 10⁶ | 3.69 × 10³ | 8.25 × 10² |
| 5 | 6.92 × 10⁸ | 9.68 × 10⁶ | 3.71 × 10³ | 8.75 × 10² |
| 6 | 6.72 × 10⁸ | 9.68 × 10⁶ | 3.60 × 10³ | 8.75 × 10² |
| 7 | 6.79 × 10⁸ | 9.68 × 10⁶ | 3.64 × 10³ | 8.75 × 10² |
| 8 | 6.93 × 10⁸ | 9.68 × 10⁶ | 3.71 × 10³ | 8.75 × 10² |
| 9 | 6.88 × 10⁸ | 9.56 × 10⁶ | 3.69 × 10³ | 8.64 × 10² |
| 10 | 5.53 × 10⁸ | 8.53 × 10⁶ | 2.96 × 10³ | 7.71 × 10² |
| 11 | 6.19 × 10⁸ | 7.62 × 10⁶ | 3.31 × 10³ | 6.89 × 10² |
| 12 | 5.42 × 10⁸ | 8.40 × 10⁶ | 2.90 × 10³ | 7.59 × 10² |
| 13 | 4.64 × 10⁸ | 6.35 × 10⁶ | 2.49 × 10³ | 5.73 × 10² |
© 2020 by the authors. Licensee MDPI, Basel, Switzerland. This article is an open access article distributed under the terms and conditions of the Creative Commons Attribution (CC BY) license (http://creativecommons.org/licenses/by/4.0/).
Share and Cite
Leon, I.; Oregi, X.; Marieta, C. Contribution of University to Environmental Energy Sustainability in the City. Sustainability 2020, 12, 774. https://doi.org/10.3390/su12030774
Leon I, Oregi X, Marieta C. Contribution of University to Environmental Energy Sustainability in the City. Sustainability. 2020; 12(3):774. https://doi.org/10.3390/su12030774
Chicago/Turabian StyleLeon, Iñigo, Xabat Oregi, and Cristina Marieta. 2020. "Contribution of University to Environmental Energy Sustainability in the City" Sustainability 12, no. 3: 774. https://doi.org/10.3390/su12030774