1. Introduction
When the first free-floating carsharing system (FFCS) was implemented in 2008 in the city of Ulm (Germany), carsharing had already been running for more than three decades, although it was a much more rigid form of mobility as it was based on stations [
1]. Stations were a limitation for carsharing users, as they had to travel to the established points to pick-up or deliver a car. On the contrary, FFCS members are able to pick up and return a car straight from any point on the street, as long as they do it within a specified area of the city (usually called “the service area”). The concept of carsharing defined by Ciari et al [
1] remains the same: “a fleet of cars can be shared by several users, who can drive a car when they need it, without having to own one”, but new information and communication technologies (ICTs) have provided flexibility to the process of renting and using a FFCS car. These FFCS companies offer smartphone apps for the users to search and book a vehicle close to their current location in the city, inside the defined service area, in which they can rent and drop off cars near their final trip origin or destination. In terms of member cost, compared to taxi services or renting a car with a driver (ride-hailing services), prices for FFCS services are usually lower.
The flexibility of this new type of mobility has caused a rapid increase in demand for FFCS in recent years [
2,
3,
4], but there are still many unanswered questions in relation to the impacts generated by FFCS on the urban transportation system: What are the main origins and destinations of these trips? Are FCCS systems used instead of alternative public transportation modes or active travel (e.g., cycling, walking)? How should local administrations deal with this new type of mobility? An FFCS has the opportunity to contribute to a low-carbon mobility transition in the case where the vehicles are electric and if the usage does not displace public transport use or active trips.
Some authors have pointed out that FFCS quality of service depends on the reliability of finding a car to rent near to the trip origin and the possibility of having a parking place near to the final destination [
5,
6]. These two variables depend on the number of vehicles provided by the FFCS companies in a city, the number of on-street parking slots available, and local regulation (some councils usually offer privileged access to street parking space for electric cars or less pollutant cars). Moreover, FFCS would not work in a city with parking restrictions and a poor quality or low-dense public transport system, because in the case a user had already rented a car, the web platform would not guarantee finding another car for the trip home or to his/her next activity. Local administrations could regulate on-street parking in a way to promote or deter FFCS systems, acting as “gatekeepers” of this new form of mobility [
7]. But before implementing a new regulation context, a greater acknowledge and analysis of FFCS demand and flows is needed. This research approach has been conditioned by the scarcity of data provided directly by FFCS operators and, until now, most of the literature on FFCS relies on survey-based methodologies [
8] and simulations [
4,
9,
10]. Revealed web-based data, collected directly from operators’ apps, are starting to be used as an alternative to reproduce origin–destination flows when FFCS data are not provided by operators (or as an external way to check data or figures provided by operators). These web-based methods work with the current position of available FFCS cars (at least when parked and not booked) and focus on various hypotheses to reconstruct the profile and the spatial distribution of trips. Reconstructing trips from booking data by using big data platforms is not an automatic task as stressed by Müller et al. [
11], and more research is needed in this area, where there are only a few previous studies in the literature [
12,
13,
14].
This paper contributes to the existing literature with a detailed analysis of FFCS web-based data obtained for Madrid, paying special attention to the socioeconomic variables of the most demanding districts, the main destinations of the flows, and the parking availability. This is a pioneering experience in Madrid, a city with one of the highest FFCS utilization rates in the world [
15] and a long tradition of public transport, although the implementation of FFCS systems only took place recently in 2015. Madrid is also the only city in Europe, along with Amsterdam, where all FFCS car fleets are electric, while other study cases on Vienna, Berlin, Munich or Stockholm have a mix of electric and fossil fuel-powered vehicles.
This research not only focused on defining spatial and temporal distribution of trips but also on explaining them with regard to parking availability. In order to describe the research as a whole, this paper is organized as follows.
Section 1 presents an introduction with the context and the objective of the study.
Section 2 provides a brief literature review on the evolution of FFCS research.
Section 3 provides the explanation of data sources and methodology used. Results of the study are presented in
Section 4. Finally,
Section 5 presents the main research conclusions.
2. Literature Review
Germany has been the cradle of FFCS and German companies, like Car2go and DriveNow/ReachNow, were, until now, the leaders of the market in FFCS around the world; Car2go provides services in 25 cities and DriveNow/ReachNow in 15. Recently, other major car manufacturers have also designed their own competing FFCS solutions, such as the South Korean Hyundai Motor Company and the French PSA Group. The FFCS operating companies are closely linked to the car manufacturing industry, because the concept of FFCS as “a product service” (i.e., mobility as a service) is being implemented in our cities, and this industry also wants to be an actor in this new scenario. New members of an FFCS company can be initiated in the experience of driving an electric vehicle (which is also a primary target for car manufacturing firms), producing, in addition, positive environmental impacts in cities.
In Germany, from a scientific point of view, it was clear from the beginning that directly transferring the results of the extensive literature on station-based systems to the urban FFCS was not possible [
9]. All the direct effects of station-based carsharing were positive (reduction of total CO
2 emissions and even reduction of vehicle-kilometers travelled individually), but the FFCS price structure and flexibility were so different that its effects probably would not be the same [
16,
17,
18,
19,
20,
21]. In this context, one of the first questions studied on FFCS was how they would affect existing station-based car-sharing systems [
1,
3,
22]. Using simulation techniques, along with surveys, most of studies revealed an apparent complementarity of FFCS and station-based systems, and the new lines of research have rapidly re-focused on the evaluation of FFCS impacts and their principal operational problems which mainly include the possibility of finding a car and parking it near the final destination.
There have been some attempts to link the implementation of FFCS with a new attitude towards car ownership after trying FFCS services, especially an environmentally positive impact based on the willingness to forego a private car purchase in the future [
8], but these results were based on survey data and more reliable research was needed. Real data on flows and users, provided by FFCS companies, seemed a priori the best resource to work with.
But in fact, the literature shows that the number of studies using real data provided directly by companies were very small and mainly focused on German cities. In Munich and Berlin, Schmöller et al. [
23] used two years of booking data and the number of registered members for a shorter period of time (provided by DriveNow and Car2go). Their objective was to describe carsharing usage and to obtain a spatial distribution of flows, identifying the socio-economic factors that influence FFCS demand. Using booking data provided by DriveNow also in the city of Berlin, Müller et al. [
11] studied, a few years later, the influence of land use and census data on FFCS demand through a negative binomial model. Areas’ centrality, districts with citizens having a frequent use of ICTs, and parking availability were revealed as the main determinants which lead to higher demand (higher number of bookings). More recently, in Montreal (Canada), Wielinski et al. [
24] have used Communauto data sets to empirically investigate members’ behavior over time in a FFCS system. These data sets included not only FFCS bookings but also the members ID, so members were labeled according to their usage intensity for various periods of analysis.
Except for a few exceptional studies, already presented and usually financed by FFCS companies, it is very difficult for research teams to obtain real data sets. For that reason and as a way to check the data information provided by operating companies, a new body of research on various forms of passive data streams is being developed. Passive data is obtained by accessing and reading the FFCS operator’s API (application programming interface). The FFCS’ members commonly use this interface through their smartphone apps and are instantly informed with real-time information of available cars distribution in their nearby zone. Each available car has an identification code and shows the status of the electric battery or fuel tank. With this code, FFCS trips can be reconstructed (origin and destination) and we can even make a distinction between bookings and rentals (real trips). Two ideas should be taken into account before reconstructing trips. On the one hand, origin and destination of the available car are not exactly the origin and destination of the user trip since there are walkable distances to access FFCS cars that we ignore. On the other hand, the itinerary of a FFCS trip is not known (although FFCS travel time can be calculated) and, in most studies, it is estimated as a geodistance, namely, the straight-line distance between origin and destination. Müller et al. [
11], after working with FFCS flows data provided by companies, raised an important issue concerning the complexity of using these methodologies to obtain real flow data by reading an operator’s API. Booking data should be analyzed with caution, and this analysis cannot be automatized in order to avoid errors. Scientific hypotheses are necessary to, for example, interpret the (non-)availability of a vehicle on the map, either due to the fact of customer trip or to a service trip which are those made for service reasons such as battery/fuel recharging or relocation strategies. Moreover, the interpretation of the booking data is more complicated when different services are offered by companies in a city (different recharging options, different prices per renting minute, options to rent the FFCS vehicle when is already parked by paying an extra-price, etc.). Public on-street parking conditions and prices also differ from one city to another and this feature is also a determinant variable to study FFCS flows, once they have been estimated through passive data streams.
Despite these difficulties, the comparison of the FFCS trip profile among cities has been the main target among the first published studies using data harvested from the operators’ API. Habibi et al. [
15] and more recently Sprei et al. [
25] are very good examples of this research line. By using data publicly available on the web pages of three different operators, Habibi et al. [
15] compared FFCS trip profiles in 22 cities (both in Europe and the US) between 2014 and 2016. The identification of 27 million vehicle movements revealed a daily usage pattern with a smaller morning peak and a larger afternoon peak, with some exceptions such as New York and Madrid. Madrid and Hamburg had the highest utilization rates, and Madrid differed from other cities by showing an additional peak around lunchtime. The authors did not include an origin–destination trip analysis (except for one example for Stockholm) or a comparison of the on-street parking conditions among cities, probably due to the diversity of situations and different urban structures. Sprei et al. [
25] followed Habibi et al.’s example and collected vehicle availability data between 2014 and 2017 from two different operators in 12 different cities located in Europe and the US. They focused on the study of FFCS travel time and usage patterns, devoting special efforts to analyzing mode displacements (rental times were compared to driving, walking or cycling times). Although their conclusions are quite interesting (for example, FFCS were mainly used for shorter trips with a median rental time of 27 min and actual driving time of around 15 min, FFCS times were generally shorter than walking time but longer than cycling), a disaggregated analysis per city is needed, taking into account the spatial distribution of trips.
Ciociola et al. [
12] developed a spatial FFCS analysis by concentrating their research on the city of Turin, Italy. With the design of a web platform to harvest and analyze FFCS data from two operators (i.e., Car2go and Enjoy), 52 days of operation were observed in real time. Data were stored in a data lake and historical series were built before augmenting and processing them. Although the spatial analysis obtained was very consistent with the urban structure, the authors acknowledged the necessity of conducting user surveys for a better interpretation of results. They also recognized that the data collection and cleaning processes need a complex task of results interpretation, identifying cars undergoing maintenance or recharging, website failures, GPS fix limitations, etc. Ampudia-Renuncio et al. [
14] explored the temporal FFCS distribution of trips in Madrid by using operators´ web data, obtaining results that validate the pattern obtained by Habibi et al. [
15] for this city. The study of Cocciola et al. [
12] also demonstrates the necessity of analyzing spatial FFCS flows in detail after being obtained through passive data streams. As those data depends on the urban structure, the public transport systems, and the availability and conditions of on-street parking, this analysis should be accomplished city by city, also taking into account the progressive implementation of the FFCS companies over time and their different service conditions per company. Ampudia-Renuncio et al. [
14] analyzed spatial distribution of trips in Madrid, and the authors concluded that more research was needed in order to explain the variables that may condition the most frequent origins and destinations.
This paper delves into the analysis of spatial distribution of FFCS trips in Madrid through a web-based platform that tracks FFCS bookings and rentals. This research provides an in-depth examination of Madrid as a case study, a city with a long public transport tradition, and, like other European cities, experiencing a huge rise in free-floating carsharing systems, only implemented since 2015. The next section describes the Madrid case study, as well as information data sources and the methodology used to analyze the collected data.
3. Materials and Methods
The data sources in our research were mainly the websites of Madrid FFCS operating companies. With one of the highest utilization rates for FFCS vehicles and many operating companies, Madrid is a representative case of FFCS operation worldwide. In this research, the data were collected from public information available on the websites of two free-floating carsharing operators in Madrid, Car2go and Emov, which were the first ones to be implemented in the city. Web data were collected during the period between 28 November, 2017 and 12 April, 2018, when Car2go had already been operating in the city for two years and Emov for one, so the “novelty effect” of FFCS systems had already passed. The methodology included the design of a platform to capture data and a process of identification of real FFCS trips. For instance, the platform was able to determine when a car was unavailable, because no information about it was being broadcast. In order to obtain a precise database, we needed to know how a free-floating carsharing system worked and, specifically, the peculiarities of the systems that were already operating in Madrid.
3.1. Madrid Case Study
The Madrid City Council has been promoting low emissions parking policies since 2005 [
26,
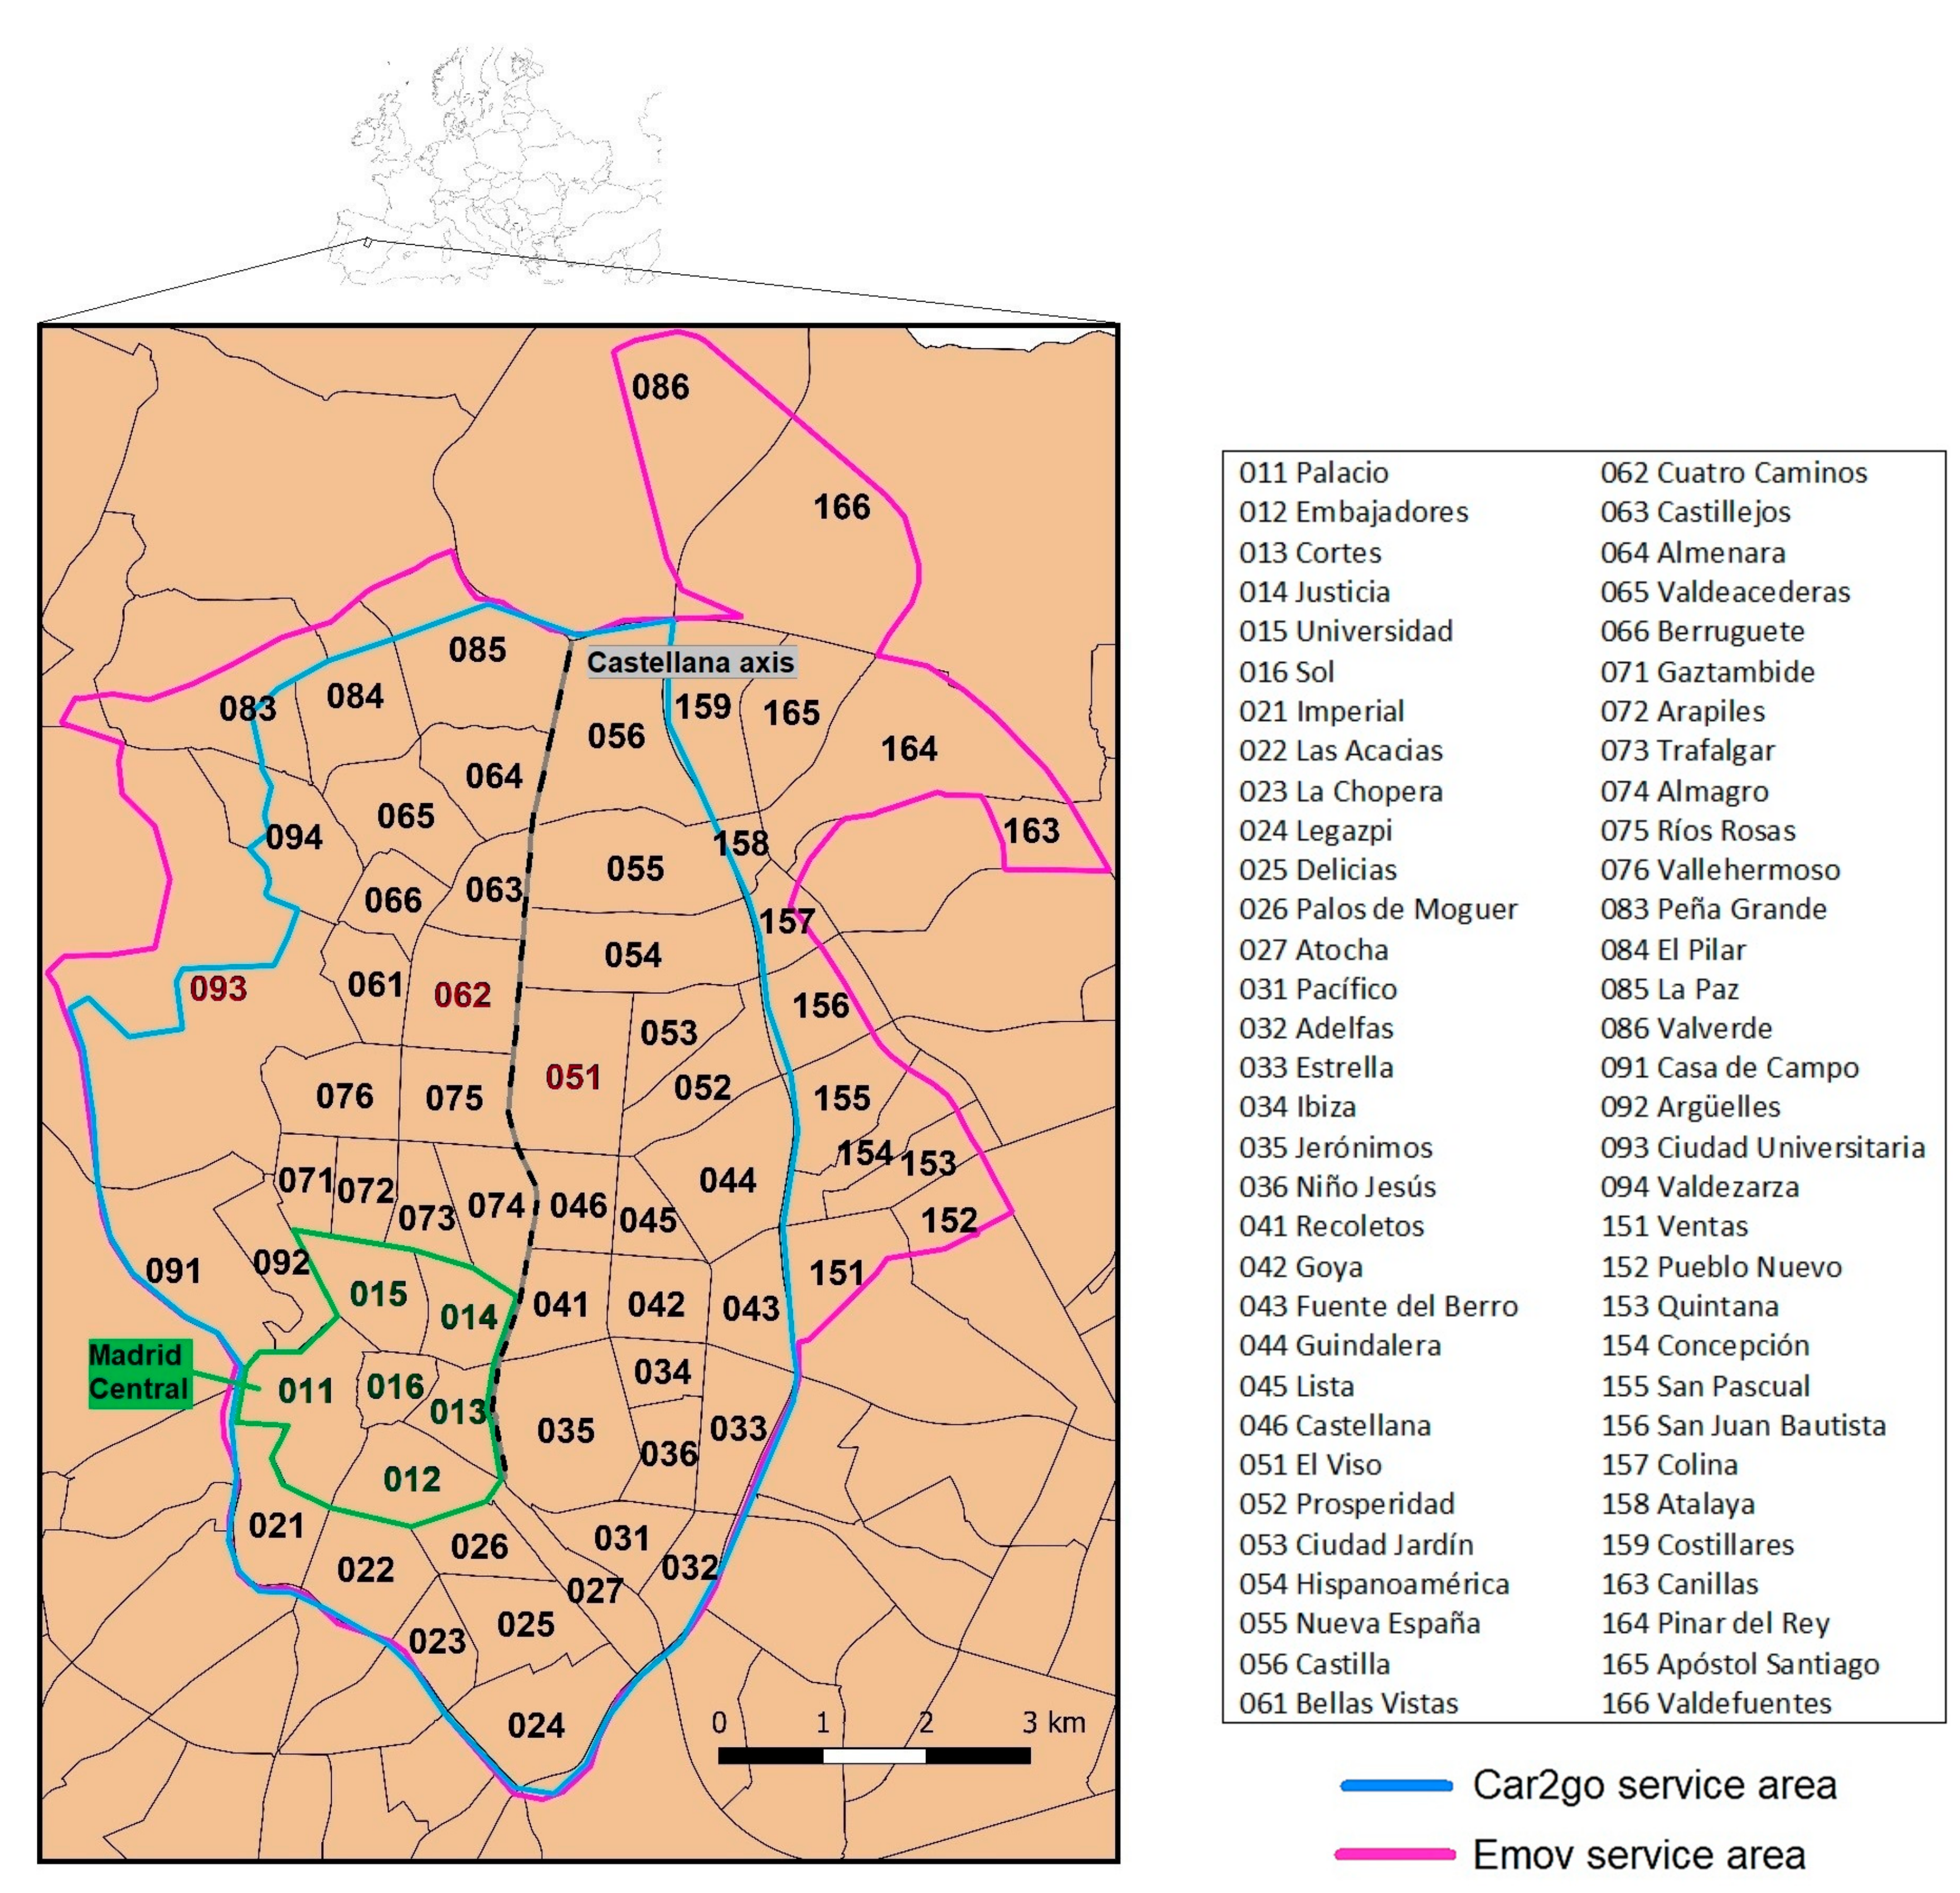
27] under the pressure of air pollution threats. The regulated parking area was limited to the “Central Almond”, the zone within the M-30 ring road which contains most of the central districts. Inside the Central Almond, Paseo de la Castellana and its continuation, Paseo de Recoletos, and Paseo del Prado, is the most important and longest road axis, crossing the city from north to south. This urban axis borders the downtown district in the southern zone, and the main business city areas are located along its northern and central part.
Figure 1 depicts the distribution of the neighborhoods located within the FFCS services’ areas which served as a spatial unit for the analysis performed in this research. The city of Madrid is divided into 21 districts that, in turn, are divided into neighborhoods (each neighborhood is identified by three digits, the first two digits being the code of the district). All districts from 1–7 and some neighborhoods belonging to other districts (8, 9, 15, and 16) are located within the service areas of the operators.
Ten years after low-emission parking policies were implemented, electric FFCS arrived in the city: the first one was Car2go in 2015. In 2018, a low emission area (LEA) was created in the downtown district [
28], a legislation that was unsuccessfully attempted to be repealed in 2019 when the government of the council was changed after municipal elections. This regulation fosters the access, circulation, and parking in this LEA of electric vehicles, among others, and does not allow such privileges to internal combustion engine (ICE) vehicles except in specific circumstances. It aims to cut down on pollution levels in the city but also to reduce congestion, promote more sustainable mobility, and recover public space for pedestrians in the area where most of the tourist attractions are located. However, due to the fact of its recent development, the impact of this regulation on FFCS has hardly been evaluated; however, everything seems to indicate that it is a policy which is supporting the operation of Madrid’s FFCS systems, formed by fully electric fleets [
29].
Starting from the beginning, the first FFCS company to be implemented in Madrid was Car2go which started operating in November 2015 with 500 units of Smart’s two-seater model and offers the lowest rate in the city (currently from €0.19 /min). Car2go initially operated in a confined area, but it expanded, and at the time of data acquisition, its service area corresponded to the Central Almond. Today, electric carsharing has mushroomed in Madrid in different forms: there are several companies operating FFCS fleets, in addition to a public station-based bike-sharing system with 2500 bikes and other companies operating with free-floating motorbike sharing: four companies with more than 2000 electric motorbikes at the time of this research. The second FFCS company to be implemented was Emov, set-up in December 2016 by Eysa and the French car manufacturer PSA Group, with no previous experience elsewhere. The vehicle used was the compact four-seater BEV Citroen C-Zero. Emov currently has a fleet of over 600 units and, at the time of data collection for this research, the rate was €0.24 /min (although it has lately been increased to €0.27 /min).
Once the data acquisition for this research had begun, another two operators of FFCS emerged: Zity, in December 2017, and Wibble, in June 2018. This fact complicated the analysis of the web data, due to the different operation conditions offered by the new companies (new service areas, reserved parking spaces in its service area or offering new features for users such as maintaining the car reservation at a reduced rate while it is parked, etc.). Zity, owned by Ferrovial Group in collaboration with the French carmaker Renault, started with a fleet of 650 Renault Zoe BEVs and expanded the service area to the airport and some nearby municipalities. The rate was €0.26/min rate but, in addition, members are given the opportunity to maintain the rental at a cheaper rate while the car is parked (€0.09/min). Wibble, owned by the South Korean automobile manufacturer Kia and the Spanish Repsol, was the first FFCS company to operate in Madrid with plug-in hybrid electric vehicles (PHEVs) instead of BEVs: 500 Kia Niro model with a rate of €0.28/min.
The evolution of the kind of service offered by FFCS systems implemented in Madrid does not allow an aggregated worldwide comparative analysis. This paper aimed to analyze the first stage of FFCS implementation in Madrid, when the service operation of the two first companies (i.e., Car2go and Emov) was almost homogeneous. The data sources in our research were based on the websites of these two FFCS companies, and for this purpose, a platform to harvest car renting data was designed.
3.2. Methodology
The first step of the methodology was the design of a platform, called
CarTrack, in which two crawlers were built to collect data from the Car2go and Emov websites. The web capture system,
CarTrack, was based on a logical architecture that followed JEE (Java Enterprise Edition) design standards and patterns. The hardware used consisted of two interrelated servers that behaved as if they were only one, which integrated two redundant Ubuntu 16.04 virtual machines. The acquisition and tracking tool that identified vehicle availability was developed in the Python 3.6 language and Pandas libraries. The acquisition data platform was packaged in a Docker container, an open-source tool that allowed us to perform a light virtualization with which to package environments (operating systems) and applications such as the FFCS data acquisition platform. The tool was launched through Marathon, a Docker director, although it can be run manually. The records were stored in a NO-SQL (no relational structured query language) database, Cassandra version 3.0.14, of high availability and consistency.
Figure 2 shows the
CarTrack platform interface (zoom settings enable the location of each parked car to be displayed).
Taking into account that only available cars in the website could be tracked, the platform was able to register the position (latitude, longitude, and address), identification, and energy status of the available and on-street parked FFCS cars. The data acquisition service gathered data every 30 seconds. The period selected for the data used in this study (and for the completion of the final database)) was between 28 November, 2017 and 12 April, 2018. Although data were collected for a more extended period of time, the months that were finally selected corresponded with proper platform functioning, once the operational problems were finally overcome in the pilot stage of CarTrack.
CarTrack created a record each time a car disappeared from the interface and this record ended when the FFCS car appeared again, usually corresponding to a trip. We use the term “usually” because in most of the cases, when the trip ended and the user closed the car, the car became available again for other users (as long as it is above the minimum battery level), but there were some exceptions that should be filtered before analysis. For example, someone could have booked a car without making a trip: the car was booked but not rented in the end (the car was unavailable for some minutes, but the trip should not be registered). The cleaning of the database under specific criteria for the FFCS operation in Madrid was necessary, and the definition of these criteria would allow the identification of real trips (rentals), excluding electric charging, maintenance or cleaning operations, or connectivity problems that make the car be temporarily out of service.
Criteria for identifying trips started with the discrimination between bookings and rentals. Bookings were made of all the records in which the car was unavailable, whether a trip takes place or not. Rentals consisted of all the bookings excluding all trips with no movement. Trips with no movements were identified because their origin and destination neighborhoods were the same and their car battery consumption was null. Therefore, rentals fulfilled one of the following requirements: they started and ended in different neighborhoods, and the battery level at the end of the trip was lower than the initial battery level, or both. In order to be discarded, staff trips for electric charging (car2go and Emov fleets are totally electric) were identified together with maintenance, cleaning, and relocation tasks, which are usually performed at the same time. The criteria to exclude these trips were based on information of the car battery status. When a car had a discharged battery (below the minimum required level) and taken by the operator to charge it, the car was out of service until it had been charged and relocated and could be erroneously counted as a trip. To avoid it, those records whose battery levels were higher at the end than at the beginning were removed. These electric cars must be charged between once a day and once every two days because of their limited autonomy and their high utilization rate. Besides, maintenance and cleaning tasks can be performed in the meantime and, since they use fast chargers, it is estimated to take only 5% of the daily total time.
4. Results and Discussion
Once the database was cleaned and the identification of rentals was carried out, the research focused on temporal distribution of trips. Before obtaining aggregated figures, days with unique behaviors were removed from the database (Easter holidays, Christmas and other national, regional, or local holidays). The remaining days were categorized by day of the week to obtain the average daily profile by type of day.
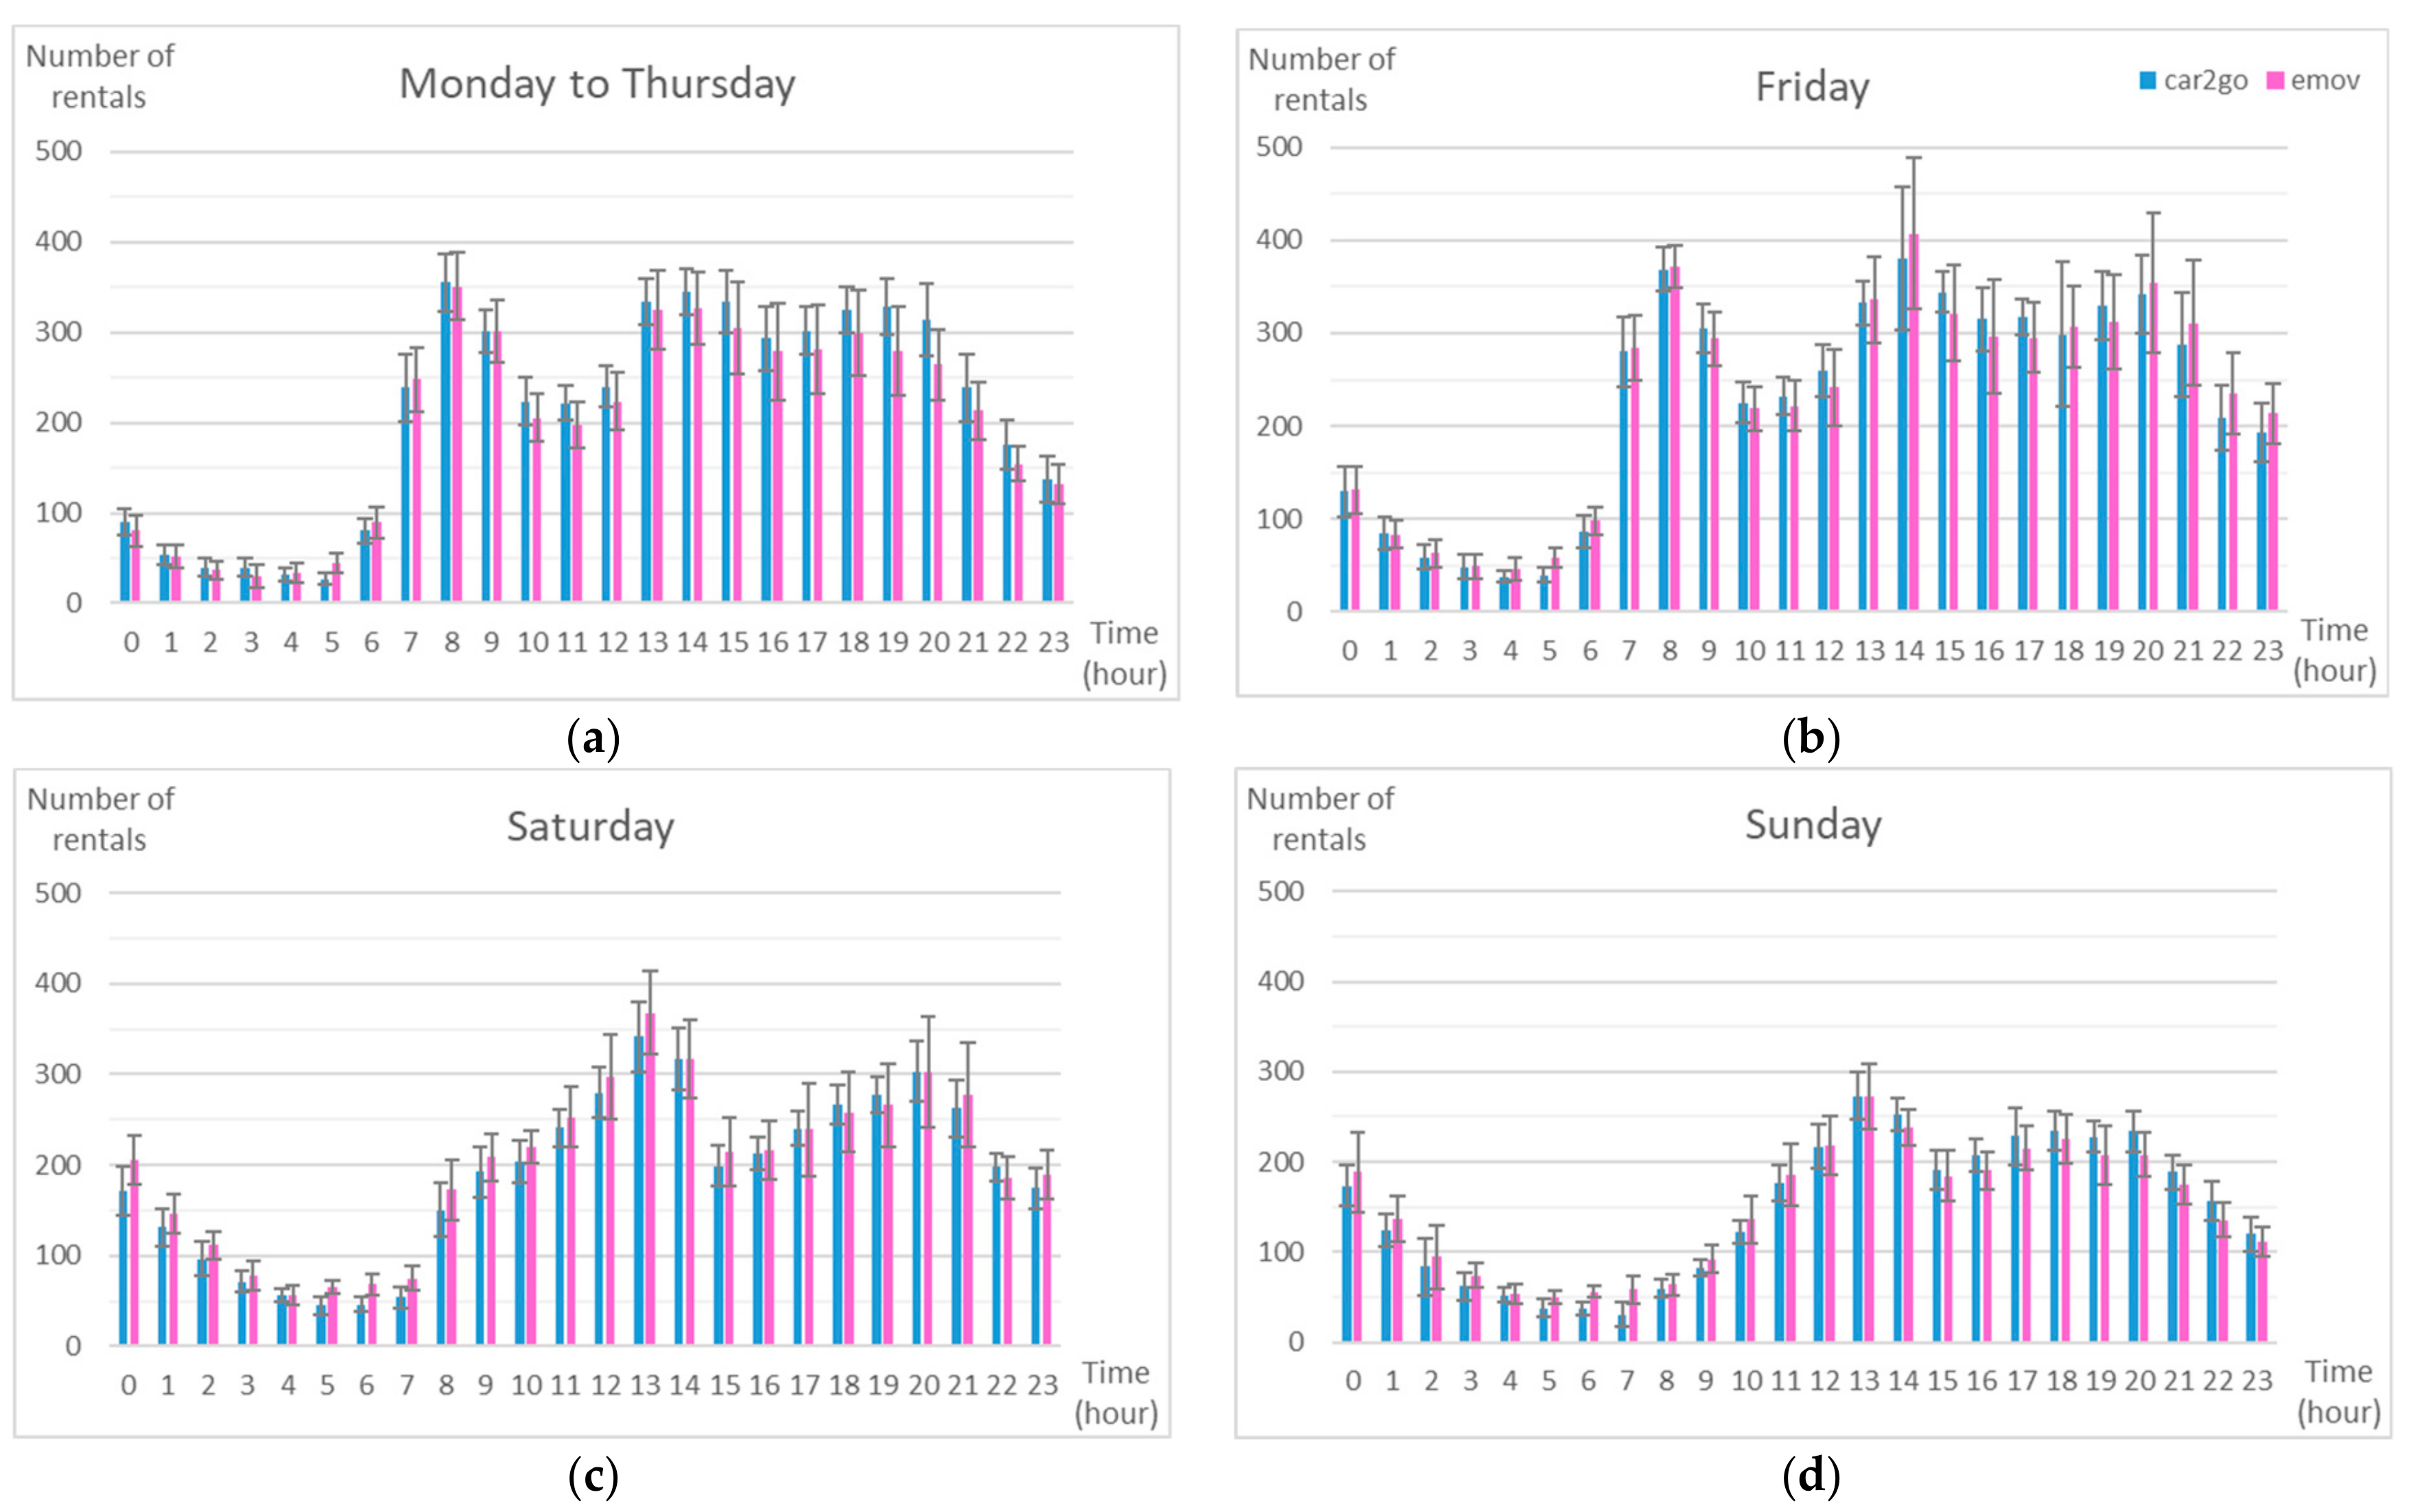
Figure 3 shows the average daily evolution of rentals made every hour categorized by day of the week.
Both Car2go (in blue) and Emov (in pink) behaved the same way with three rental peaks on weekdays. The first peak started at 7 am but lasted longer than conventional morning rush hour because of the increase in the trip cost during more congested periods (until 9:59 am). The second one began around 1 pm and it distinguished Madrid from other cities without this peak at lunchtime as stated by Habibi et al. [
15]. When people return home or go to spare time activities (from 6 pm), the third peak occurred. The distribution of trips on weekends had only two peaks: before lunchtime and in the evening, indicating that the use was different, mainly for leisure activities.
The data obtained also allowed us to carry out a spatial analysis of the origin–destination flows of travel in the FFCS. In order to assess the data in spatial units as homogeneously as possible, administrative delimitation in neighborhoods was chosen.
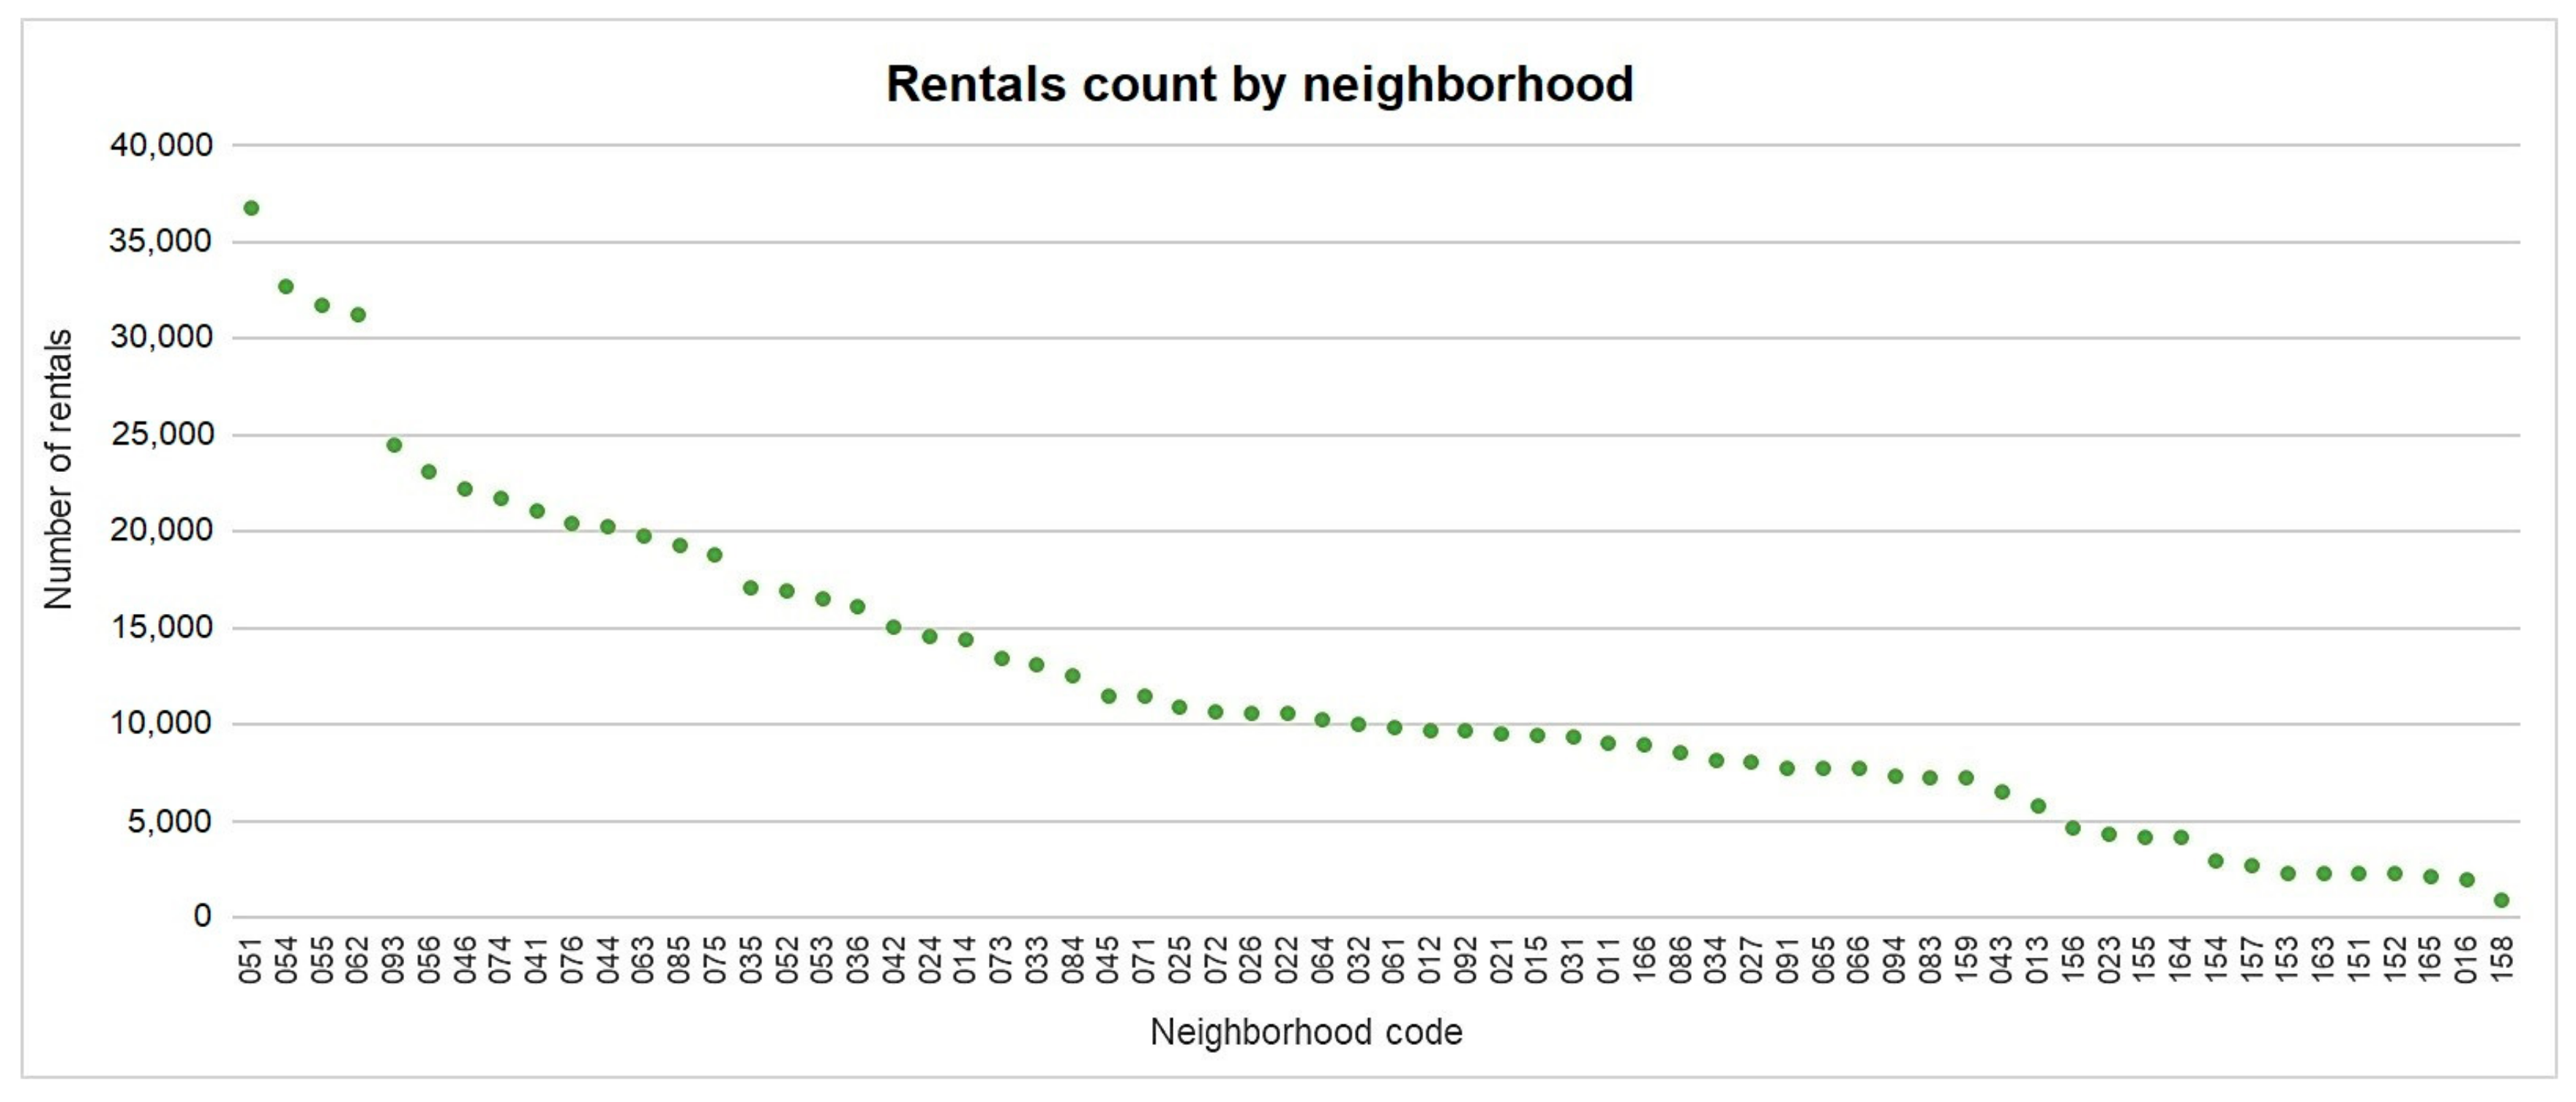
Figure 4 represents the aggregate number of trips that took place in each neighborhood throughout the period analyzed (coding is the one indicated in
Figure 1).
The results show that the most frequent trips occurred to and from neighborhoods located in the northern half of the Central Almond, concentrated near the north–south axis of Paseo de la Castellana. The only exception within the top ones is Ciudad Universitaria (093), a neighborhood placed on the Norwest limit of the Central Almond where the main university campus of the city is located. On the other hand, the districts with the lowest volume of trips were those located on the outskirts (mainly, districts 15 and 16), that is to say, residential areas farther from the points of interest, where only one of the analyzed companies operates. Also, some neighborhoods of the central district (01) were among the last positions due to the difficulties for parking in this area before the implementation of Madrid Central and to the high supply of other transportation modes.
When exploring trip flows, we found that among the most frequent OD pairs (Origin-Destination pairs) were those that had an origin and destination in the same neighborhood. It is worth remembering that those records called “bookings”, in which the trip starts and ends in the same neighborhood and the battery remains at the same level, were already extracted from the database, so those considered here were real trips since there was battery consumption. However, our database lacked the recorded pathway, so we ignored the proportion of those trips which were internal within the neighborhood against those in which the vehicles travelled to another point in the city and then returned to the point of origin during the same reservation.
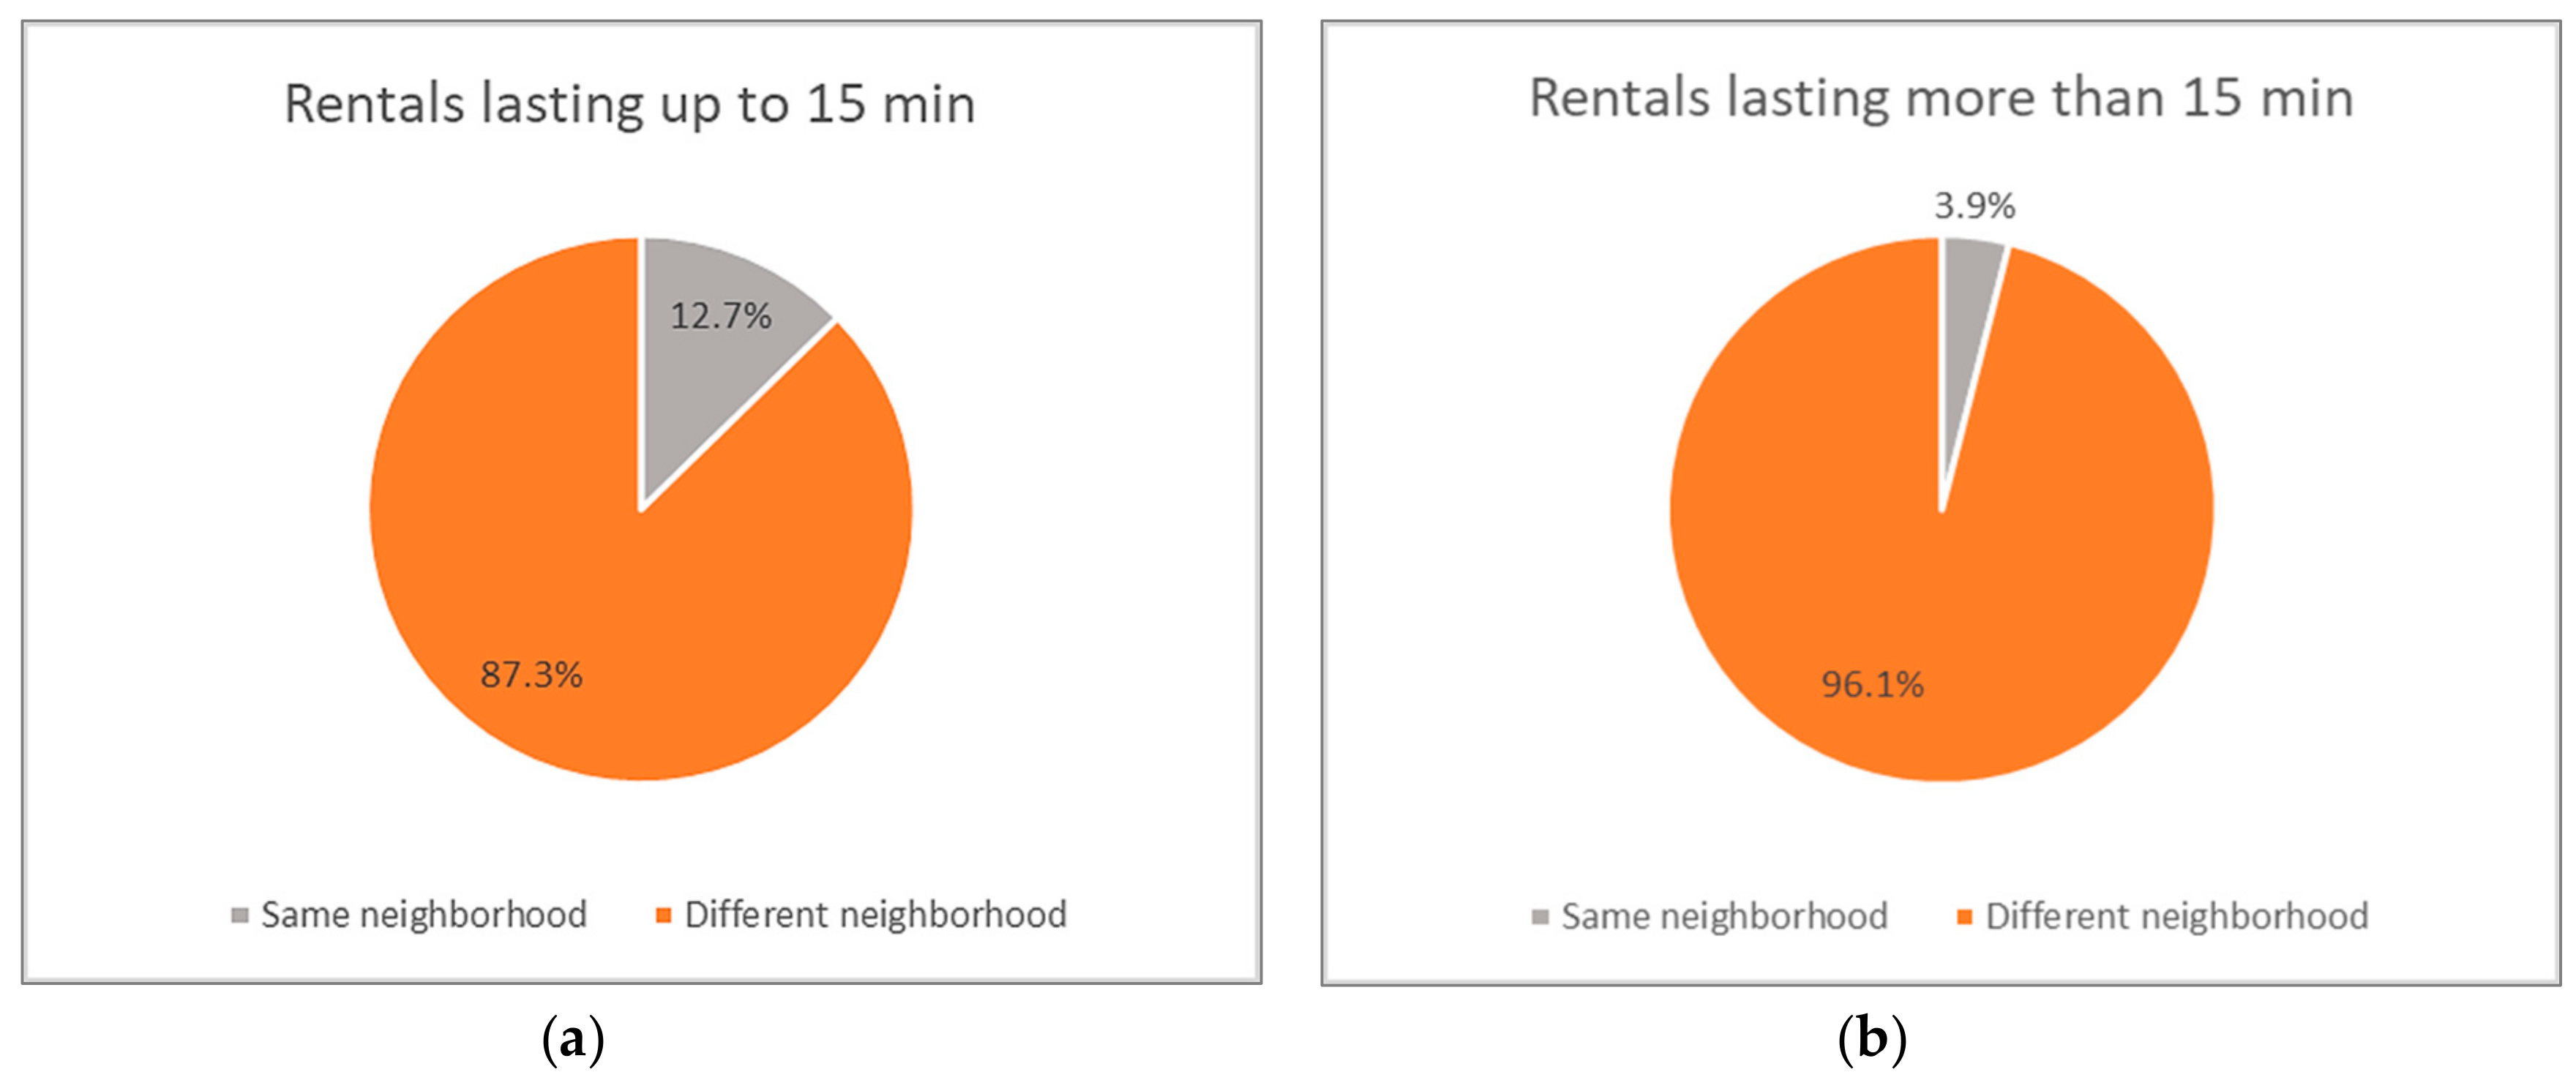
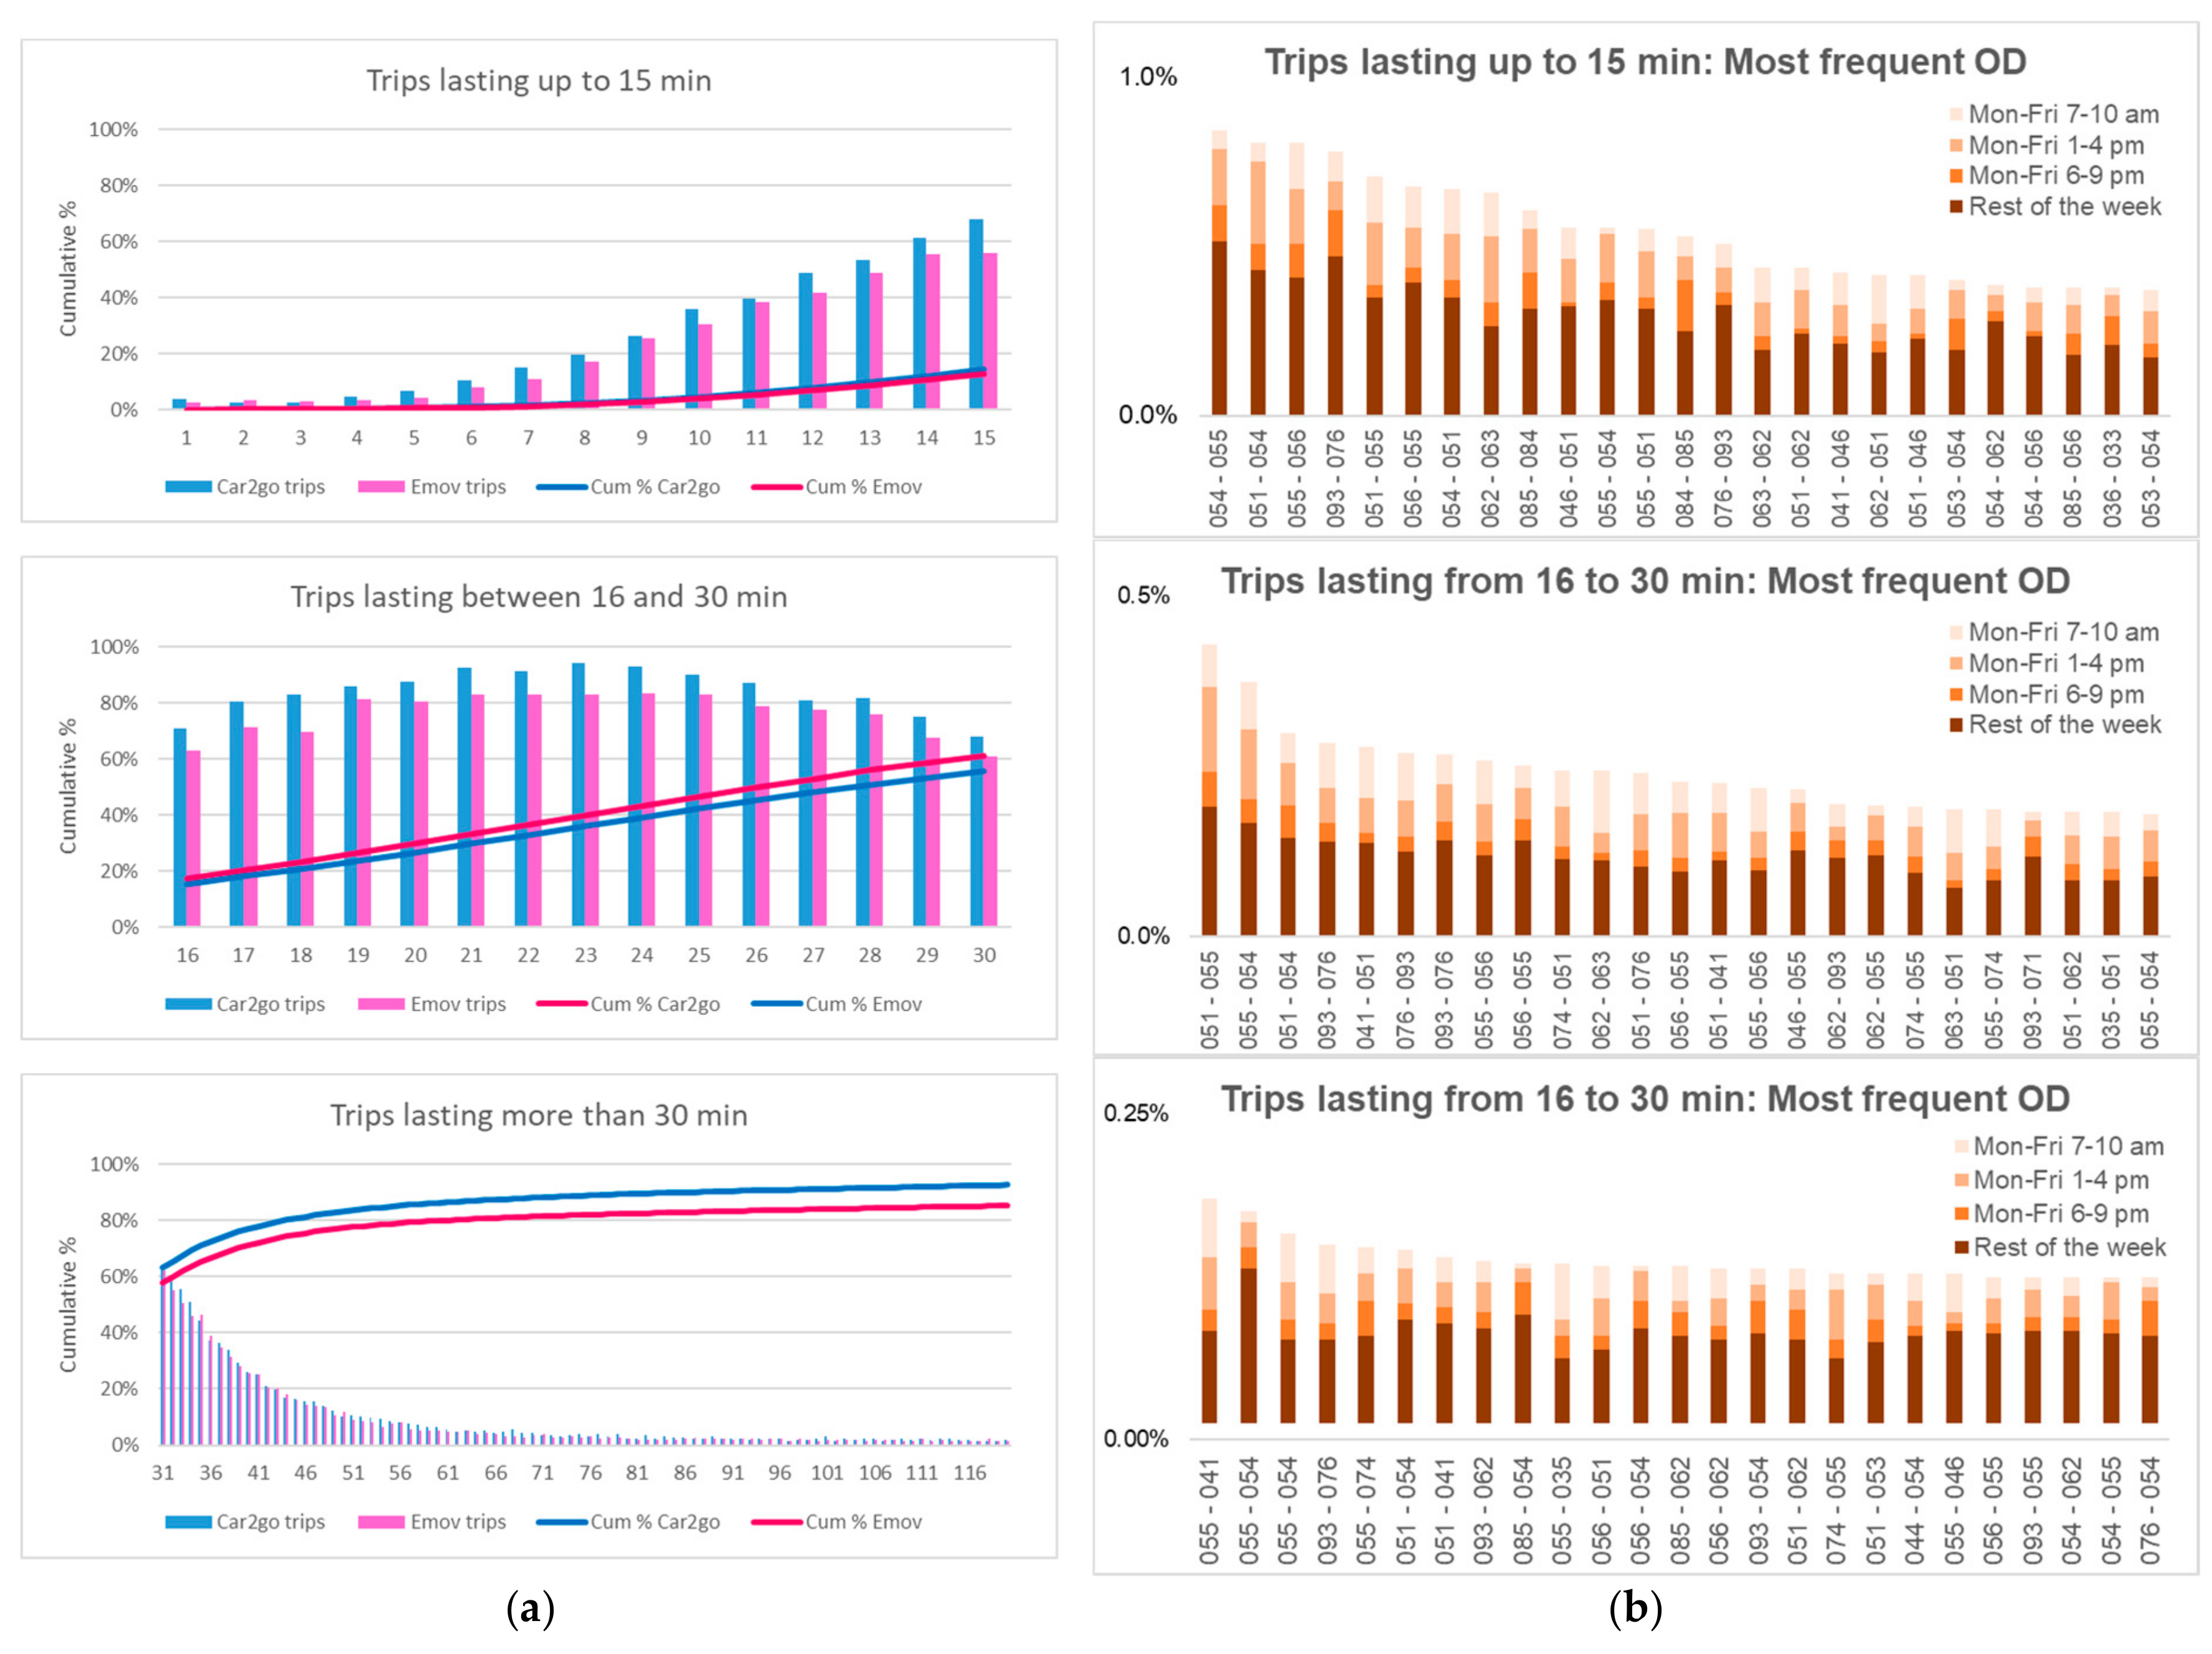
Figure 5 shows that trips of shorter duration were more likely to have an origin and destination in the same neighborhood, indicating that the trend would lean towards “intra-neighborhood” trips. The indicated duration included the entire period of time: from the moment when the car reservation took place until the car was closed after the end of the trip.
Notwithstanding the above, although they were among the most frequent pairs, trips with an origin and destination in the same neighborhood represented a small proportion of total trips: 12.7% of trips lasting up to 15 min and only 3.9% of trips of longer duration. For this reason, the authors decided to delve into the flows that took place from one neighborhood to another, without displaying the trips that begin and finish in the same neighborhood.
With the aim of further analyzing these flows and taking into account the differences shown according to the duration, FFCS trips were disaggregated into three groups: trips lasting less than 15 minutes or equal, trips lasting between 16 and 30 minutes, and trips lasting more than 30 minutes. This type of disaggregation has been used by other authors [
15,
25]. The frequency distribution and the most frequent origin–destination pairs of each group can be seen in
Figure 6. Additionally, three time slots were split off—morning, afternoon, and evening peaks—in order to highlight the periods of greatest demand throughout a weekday as indicated in
Figure 3.
The first group consisted of rentals that lasted up to 15 minutes including both the booking time and the trip itself. In the case of the Madrid FFCS, the maximum booking time was 20 minutes, but the average booking time was around 8 minutes [
6] which led to a reduced trip time. Nevertheless, within this group, practically 20% of the total trips were included. Due to the fact of their shorter duration, these trips were made between very close neighborhoods, and their repetition frequency was relatively high (approximately 0.9% of the trips of this group were in the most frequent origin–destination pairs).
More than 40% of the records were grouped in a duration period between 15 and 30 minutes. This group represents the most likely behavior of trips: the average duration of the entire database was 27 minutes, although the mode was slightly shorter (23 minutes). The dispersion of origin–destination flows was greater than in the previous group as can be seen by the lower frequency of those shown in the graph.
Finally, the third group was formed by those rentals lasting 30 minutes or more. Records with a duration period up to 120 minutes are included in the graph, but there is still a remaining group with a longer duration: over 15% of Emov trips and almost 6% of Car2go ones. This difference was due to the affordable daily rental rates offered by Emov at the time of data acquisition. The dispersion of this group was not only produced in duration but also in the variety of possible origins and destinations. Although it is true that there were trips between farther neighborhoods among the most frequent, each of them only represented approximately 0.20% of the trips of this group.
Regarding the division of graphs into time slots, we found that, although there was variability, around 50% of trips between the most frequent pairs occurred in the three peak periods indicated. Each of them lasted 3 hours a day, from Monday to Friday, so we can say that half of the trips between the most frequent pairs occurred in 27% of week time. This premise was fulfilled by the three groups according to trip duration.
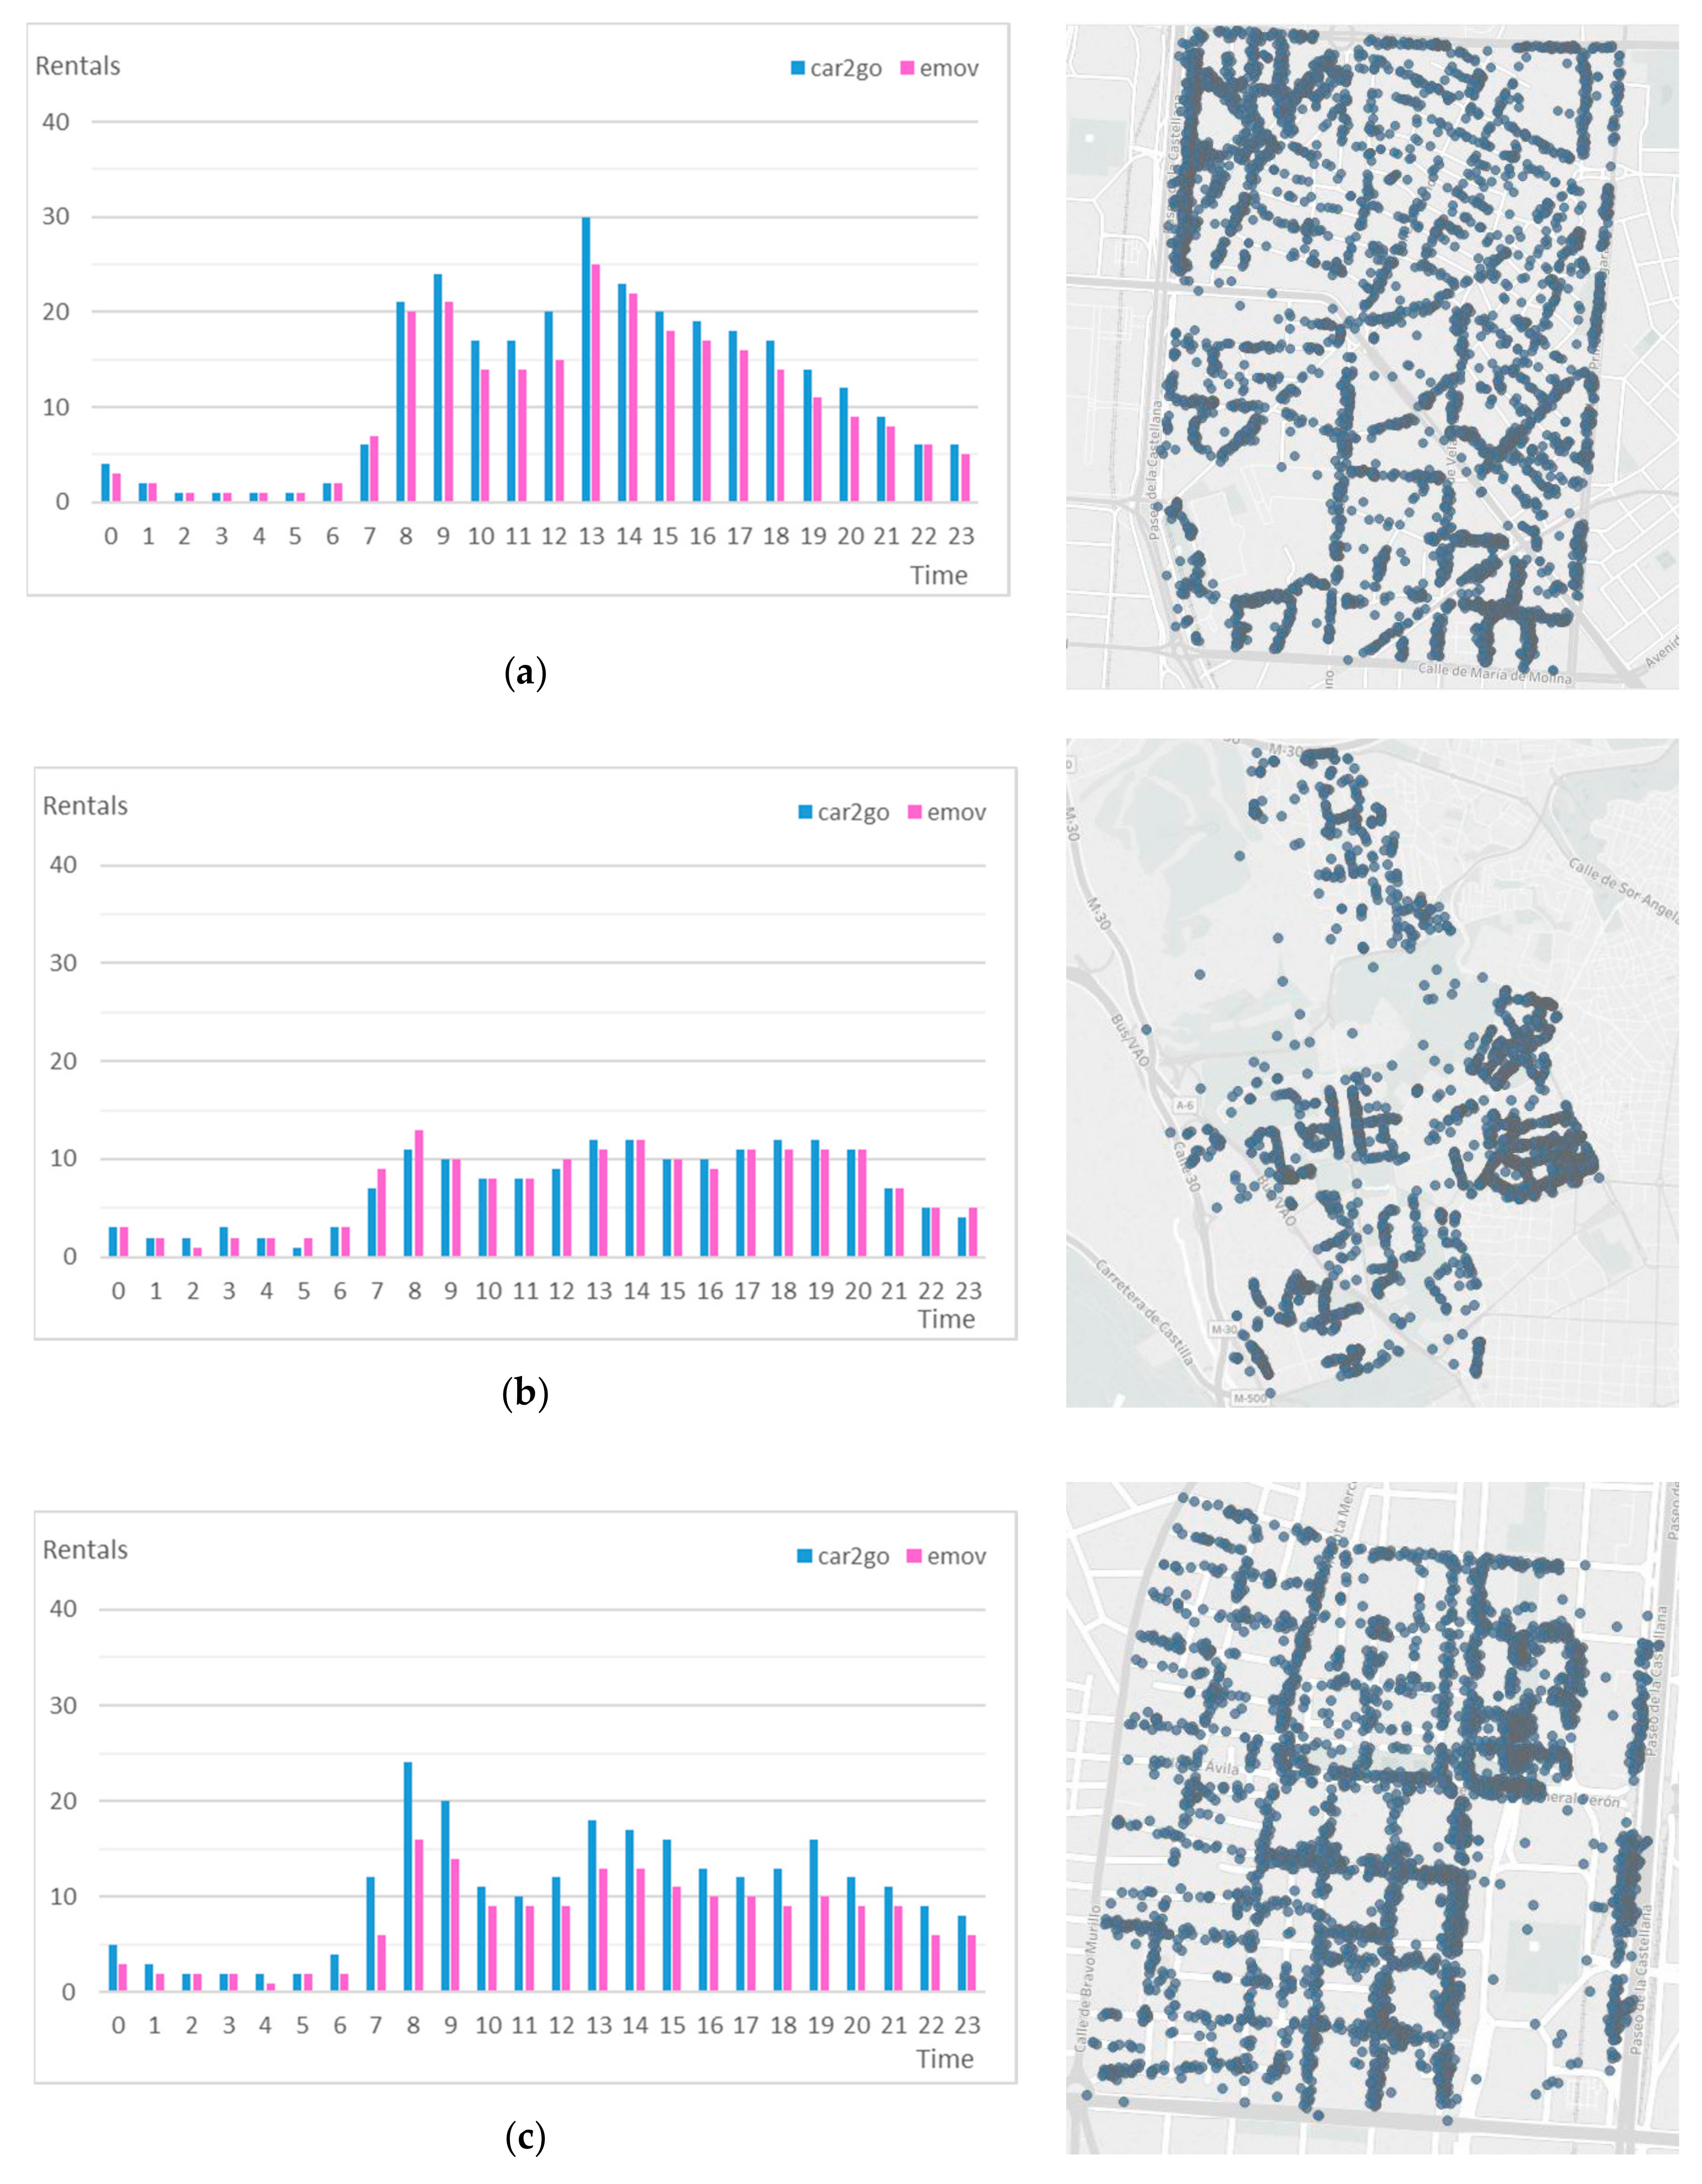
Three neighborhoods that were among the most frequent origins and destinations in the previous graphs were selected in order to develop a more disaggregated analysis: El Viso (051), Ciudad Universitaria (093), and Cuatro Caminos (062) (coding as the one indicated in
Figure 1). The peculiarities that make them generate and attract a larger number of trips are be detailed below, as well as the distribution of vehicles at the time of trip beginning.
Figure 7 depicts the hourly distribution in an average working day of the trips originating in each neighborhood and the starting positions of the trips. In addition, some socioeconomic indicators of these neighborhoods are shown and compared with the Central Almond districts average and the municipality of Madrid average (
Table 1).
El Viso is a neighborhood belonging to the Chamartín district. It is mostly a residential neighborhood with detached houses, something uncommon within the Central Almond of Madrid. For this reason, the population density is lower than in other neighborhoods (100 inhabitants/ha, compared to 158 inhabitants/ha on average in its district and 237 inhabitants/ha on average in the districts belonging to the Central Almond) [
30]. This implies that there is low demand for parking by residents´ vehicles and a lot of space available for FFCS vehicles. Their households have one of the highest average incomes in the city (€ 103,573) which considerably exceeds the average of the districts of the Central Almond (€ 45,389) and the entire city (€ 38,535), which could lead to a higher willingness to pay. Besides this, it is located near important points of interest of the city placed in Paseo de la Castellana, business areas like Azca, or Public Administration buildings like Nuevos Ministerios. This makes El Viso attractive to FFCS users due to the fact of its parking availability, even if the final destination of the trip is not in the neighborhood itself but in nearby places.
On the other hand, Ciudad Universitaria is in Moncloa-Aravaca district. It hosts the most important university campus in the city in its southern area which bears the same name. This area is characterized by university buildings as well as extensive green areas. There is also a large supply of parking areas, either next to the buildings or on public roads, and it is well connected by car with other areas of the city through the M-30 ring road despite not being a central area. However, most trips originated or had a destination in the east side of the neighborhood where student residences and apartment buildings are located. Despite its great extension, this neighborhood only has a population of 16,097 registered inhabitants [
30], but the official figures do not include the students who reside here and who are potential users of the FFCS systems, as they are young people, with a driving license and, in most cases, without own vehicle [
6]. Additionally, there is a lack of public transportation supply that connects it with other points of attraction in the city which makes FFCS vehicles convenient. Attending to the average trip distribution over a working day, the curve was smoother than in the entire city, indicating that trips occur equally throughout the day.
Finally, the third neighborhood analyzed was Cuatro Caminos which belongs to Tetúan district. It is an area with higher population density (289 inhabitants/ha) and lower average income per household than the previous ones (€ 43,306), although it is still above the city average (€ 38,535). Despite being a neighborhood with high population, one of the main business hubs is found in the eastern part of the neighborhood next to Paseo de la Castellana. It is precisely in the on-street parking space of this area where more FFCS cars are parked. The distribution of trips in Cuatro Caminos is similar to that of the entire city, with three peaks throughout a weekday. The first rush hour corresponds to the trips made by the residents in the neighborhood, and those that occur at lunchtime and in the evening correspond to the intense activity of the offices located here.
To sum up, we clearly see how the main points generating and attracting FFCS trips corresponded to predominantly residential neighborhoods with low population density and high income, that a priori would not constitute the traditional nodes of generation of public transport trips. We consider that these districts are not really the trip origins or destination themselves, but thanks to its privileged location near points of attraction (company and public administration headquarters or commercial areas) and near big public transport stations, many users may choose it for its parking availability, although FFCS is only one stage of their trip chain. Although the operators’ APIs are the best source of data we currently have, we are neglecting the real origins and destinations of the trips. Therefore, we emphasize the idea that this kind of data should be analyzed with caution and should not be used to draw conclusions without knowing the particularities of the place.
After displaying the situation in these three neighborhoods, where there is a high sample of trip origins and destinations, it is worth highlighting the importance of the on-street parking characteristics in the performance of FFCS. Parked vehicles tend to group on main streets, which are well connected and where, of course, there is parking supply.
5. Conclusions
The authors deepened the understanding of FFCS operation in the city of Madrid by analyzing temporal and spatial dimensions of the most frequent trips. Data extracted from the websites of the two most established operators in the city during more than four months were used for this purpose. An acquisition platform was designed to collect and archive the available data on both websites in real time. Data processing techniques were applied subsequently with the necessary criteria to identify the records corresponding to real user trips. This research shows that reconstructing trips from booking data by using big data platforms is not an automatic task, as stressed previously Müller et al. [
11], and more research is needed in this area. It would also be convenient to reproduce this study in other cities to make the analysis more robust and check the correct performance of the platform.
The presentation of the most important findings of this research was made from a general to a specific level. Firstly, the temporal profile of trips was shown, highlighting the peculiarities that make the distribution of trips throughout the day different from other cities due to the habits of citizens. Madrid follows the profile defined by Habibi et al. [
15] in a previous study. Then, the travel sample was classified according to its duration, pointing out the differences of each cluster, and it was proven that the longer the trip, the more likely it is to be between more distant points.
Regarding the spatial dimension, an analysis of the city level was carried out at a general level of the city, ranking the neighborhoods based on the rentals made in them. Three neighborhoods, among the most frequent origin and destinations, were selected in order to develop a spatial unit level analysis. After detailing its peculiarities, it can be concluded that more trips were generated and attracted in higher income areas with low population density, high on-street parking availability, and, especially, good connection to the public network and to the main labor and commercial centers.
The decisions driven by the cities policy makers, not only in terms of mobility but also in urban planning and design, strongly impact on the success of emerging forms of mobility such as FFCS. Parking regulations and public transport policies affect the continuity and success of this new transportation mode. Future lines of research should focus on the user profile in order to define the real origin and destination of the trips, and web-based data will not be enough to accomplish this task; survey campaigns and/or FFCS members’ data from companies will be necessary. This idea was already underlined by Cocciola et al. [
12]. Moreover, a detailed information of the current utilization of on-street parking is necessary in order to prioritize the type of vehicle and user that Public Administrations wants to favor, e.g., electric vehicles, district resident users, carsharing users, disable people. Marketing campaigns should back FFCS systems because there is a need to educate and increase people’s awareness of electric vehicles and shared mobility systems. Educating drivers may be challenging since there may be little time to train carsharing clients and social inequities should be avoided. There are only a few papers in the literature dealing with the acceptance to FFCS [
31,
32], and more research is needed. Finally, the implementation of new low-emission areas (like Madrid Central) will need a detailed analysis with the aim of studying its impacts on the environment and the congestion of the city.
Although it is not proven that FFCS has the positive effects generated by traditional carsharing in terms of reduction of owned vehicles and vehicle-kilometers travelled, City Councils should promote its usage in a complementary way to public transport. There is no doubt that in Madrid, with electric vehicle fleets, FFCS are having a positive impact on the environment. However, congestion reduction involves raising public awareness of not relying on their private vehicles and using more public transport combined with other sustainable transportation modes.


