Article

Streamflow Reconstruction and Variation Characteristic Analysis of the Ganjiang River in China for the Past 515 Years

1
Key Laboratory of Poyang Lake Wetland and Watershed Research Ministry of Education, School of Geography and Environment, Jiangxi Normal University, Nanchang 330022, China
2
State Key Laboratory of Lake Science and Environment, Nanjing Institute of Geography and Limnology, Chinese Academy of Sciences, Nanjing 210008, China
3
School of Geography and Environmental Engineering, Gannan Normal University, Ganzhou 341000, China
*
Author to whom correspondence should be addressed.
Sustainability 2020, 12(3), 1168; https://doi.org/10.3390/su12031168
Submission received: 6 December 2019 / Revised: 24 January 2020 / Accepted: 5 February 2020 / Published: 6 February 2020
(This article belongs to the Section Environmental Sustainability and Applications)

Abstract

:
River flow reconstruction under the background of long-term climate change is of great significance for understanding the regional response to future drought and flood disasters, and the sustainable development of water resources. Investigating the basic characteristics and changing trends of the streamflow of the Ganjiang River is scientifically important to mitigate drought and flood disasters in the future. This study reconstructed drought and flood grade series of five regional stations of the Ganjiang River based on spatially explicit and well-dated local chronicle materials and used a linear regression model of modern drought/flood grades and precipitation to reconstruct historical precipitation for the past 515 years. The relationships between the modern precipitation of five regional stations and streamflow of Waizhou Station, which is the last hydrological station of the Ganjiang River were analyzed through principal component regression. The adjusted R2 is 0.909, with a low relative bias of −1.82%. The variation of streamflow from AD 1500 to AD 2014 was reconstructed using the proposed model. Result shows that high flows occur in nine periods and low flows occur in 11 periods. Extremely low stream flow in 515 years appears during the middle and late 17th century. Cumulative anomaly and Mann-Kendall mutation test results reveal that a transition point from predominantly low to high flows occur in AD 1720. Redfit power spectrum analysis result shows that the variation periods of streamflow are 2–5, 7–8 years, and approximately 32 years, where the most significant period is 2–3 years. Continuous wavelet transform indicates that the corresponding relation occurs between streamflow and El Niño/Southern Oscillation for eight years. Streamflow is affected by temperature and East Asian monsoon that is controlled by solar activities. The flood may be related to strong solar activity, monsoon failure, and vice versa. Hydrological frequency curve analysis shows that the streamflow of the Ganjiang River once in a hundred years may reach up to 1031 × 108 m3 for flood or 485 × 108 m3 for drought and the standard of once in a millennium runoff may reach up to 1188 × 108 m3 for flood or 450 × 108 m3 for drought. These results may provide basic hydrological data for the sustainable development of society and serve as a reference for mitigating the impact of drought and flood disasters in the future.

1. Introduction

Extreme climate hydrological events have increasingly occurred [1] under the context of global warming for the past 100 years [2,3]. The Fifth Assessment Report of the Intergovernmental Panel on Climate Change consistently indicates that the extent, intensity, and frequency of extreme climate hydrological events have significantly changed [4,5]. Floods account for more than 40% of the world’s annual economic losses [6], and China is a country with frequent floods [7]. The economic losses and casualties caused by floods rank first among all kinds of natural disasters. In 1998, a large-scale flood disaster occurred in Eastern China [8], causing a huge impact on the Ganjiang River basin and economic losses amounting to approximately 15 billion yuan [9]. Considering that most modern precipitation and hydrological observations range from approximately 50 years to 100 years, the relationship between environmental changes and hydrological conditions under the context of global warming should be investigated at a long-time scale. The transition from the Little Ice Age to the Present Warm Period is an important period in the past 500 years. Understanding the relationship between climate change and extreme hydrological events during this period will help humans mitigate and adapt to droughts and floods in the future [10].
As the seventh-largest tributary, the average annual runoff of the Ganjiang River exceeds that of the Yellow River [11], and its water production per unit area ranks first among all the tributaries of the Yangtze River [12]. At the same time, the Ganjiang River is also the main source of the water supply of Poyang Lake, which is the largest freshwater lake in China, and its drainage area accounts for more than 50% of the Poyang Lake watershed [13]. Thus, the streamflow variation of the Ganjiang River has a great influence on the socioeconomic development of the Poyang Lake basin and the middle and lower reaches of the Yangtze River. With the completion and water storage of the Three Gorges Water Conservancy Project, the Poyang Lake frequently supplies the Yangtze River, and its water level remains low [14]. Relevant studies have shown that the dry season of the Poyang Lake has advanced for approximately one month because of river channel erosion, upstream water reduction, and water storage since the operation of the Three Gorges Water Conservancy Project [15]. How will floods and droughts in the Ganjiang River basin evolve at a long time scale? Will there be extreme water levels beyond the 1998 flood? Under the background of climate change, does the flood control standard of the Ganjiang River needs to be improved? Therefore, investigating the basic characteristics and changing trends of the streamflow of the Ganjiang River is scientifically important to achieve regional sustainable development.
The modern hydrological observation of the Ganjiang River dates back to the 1950s, and the time range of most studies on the streamflow of the Ganjiang River is approximately 50 years [16,17]. Numerous studies have shown that the characteristics of streamflow variation cannot be comprehensively reflected using modern instrumental measurement record [18,19,20,21]. Therefore, a long-time scale variation series of streamflow should be reconstructed, and its variation characteristics should be analyzed by utilizing other climatic proxies. In this way, the new streamflow series can provide basic data for basin water resource management and hydraulic project construction. In recent years, many scholars have reconstructed long-term streamflow variation for some parts of China, especially the Northwest China, by utilizing tree rings [22,23,24,25]. However, a suitable tree ring material is scarce in Eastern China, particularly in the Poyang Lake watershed [26].
Eastern China has been prosperous for a long time, and its historical material on drought and flood disasters are abundant. Jiangxi Province is a good example, with the compilation local of chronicles since the Ming Dynasty (AD 1368-AD 1644), and more than 510 local chronicles have been stored [27]. Detailed drought and flood information found in all kinds of meteorological disaster events may be recorded on these historical files because of its important influence on agricultural activities [28]. Drought and flood historical files, which refer to the exact years and the places in the county scale of disasters, have been frequently used by scholars to reconstruct past climate conditions because of their accuracy [29]. Zhang et al. [30] reconstructed variations of climatic dry/wet alternations of Eastern China for the past 1000 years by using drought and flood historical files derived from local chronicles. Xue et al. [31] reconstructed the precipitation serials of Southern China for the past 500 years. However, some shortcomings are found in the current history of drought and flood research. First, studies using historical records to reconstruct streamflow variation are few. Second, the record of a certain site may be missing because of the certain randomness of drought and flood records. The construction of a continuous drought and flood sequence is challenging. Finally, the drought and flood sequences of different sites cannot be directly synthesized when they are integrated, and collinearity should be considered because of the regional consistency of climate hydrological elements in small regions.
A new method must be developed to reconstruct streamflow series from historical materials to understand the long-term variation in the Ganjiang River streamflow and related factors. In this study, we presented a new protocol to reconstruct the Ganjiang River streamflow series for the past 515 years through drought/flood reconstruction using principal component regression to obtain the total Ganjiang River streamflow. The rest of this paper is organized as follows. Section 2 briefly introduces the study area and historical materials, such as local chronicles; and the reconstruction protocol. Section 3 presents the streamflow reconstruction results and uncertainty analysis. Section 4 discusses the variation characteristics of streamflow series and some key implications. Section 5 provides our conclusions.

2. Study Area and Data Analysis

2.1. Study Area

The Ganjiang River originates from the western foot of the Wuyi Mountains, flowing through Ganzhou, Jian, and Nanchang (Figure 1). It enters Poyang Lake after joining the Xiuhe River in Wucheng, Yongxiu County, which is the northern part of Jiangxi Province. The overall length of the Ganjiang River is 991 km, and its drainage area is 8.22 × 10⁴ km2 [12]. The Ganjiang River basin belongs to subtropical humid monsoon climate zone, and has four distinctive seasons and abundant rainfall from April to October. The annual average temperature is between 16 °C and 19 °C and the annual precipitation is approximately 1600 mm. The landform types in Jiangxi Province are mainly mountainous and hills, followed by plains, with percentages of approximately 50%, 30%, and 20%, respectively. The land use structure of Jiangxi Province is 29% of cultivated land, 1.5% of grassland, 5.5% of construction land, 56.6% of forest land, 5.8% of water area, and 1.6% of unused land [32]. The terrain in the south is the highest, gradually lowers to the north, and distributed in a ladder shape [33].
Five small basins of the Ganjiang River basin are divided in this study (Figure 1). First, we chose Ganzhou as the representative station of the upper reaches, Jian as the representative station of the middle reaches, and Nanchang as the representative station of the lower reaches. Second, Gaoan and Yichun are the stations of Jinjiang River and Yuanshui River basins, which are the largest tributaries in the lower reaches of the Ganjiang River, and their watershed ranges are relatively independent.

2.2. Data Processing

2.2.1. Drought and Flood Grade

Historical materials of flood and drought disasters in the Ganjiang River basin were collected from the local chronicles of Jiangxi Province (http://dfzb.jiangxi.gov.cn/), which include different kinds of county or prefecture annals, such as Historical Climate Data of Jiangxi Province, and Flood Investigation Data of Jiangxi Province (Figure 2). The drought and flood records from 1500 to 2000 of five representative stations from Yearly Charts of Dryness/Wetness in China for the Last 500-Year Period and their supplementary dataset [34] were used in this study. The grade of drought and flood is determined using a semantic difference method, as suggested by relevant literature [30]. This method was extended to make comprehensive judgments from three aspects, namely, time, space, and disaster phenomenon (Table 1). Grade numbers from one to five denote five degrees (drought, slight drought, normal, slight flood, and flood), indicating that the larger the numerical grade value is, the higher the precipitation will be. As mentioned in Section 2.1, The Ganjiang River basin is divided into five small basins or representative stations, namely, Ganzhou, Jian, Nanchang, Gaoan, and Yichun, with 16, 11, 5, 3, and 3 counties, respectively. The records from other counties with the same small basin can supplement missing records of representing sites in a certain year because the occurrence of drought and flood disasters in the small river basin is consistent. On this basis, the drought and flood grade series of five representative stations in the Ganjiang River basin for the past 515 years can be obtained.

2.2.2. Modern Precipitation and Streamflow Data

The data of modern measured precipitation were mainly obtained from the climatic month dataset from 1955 to 2014 (data downloaded from the China Meteorological Administration, and the website is http://data.cma.cn/), which had undergone quality control to eliminate erroneous and experienced assessment by the China Meteorological Administration.
Modern streamflow data from 1955 to 2014 of the Ganjiang River were mainly obtained from the Waizhou Hydrometric Station (data derived from Jiangxi Hydrological Bureau and Key Laboratory of Poyang Lake Wetland and Watershed Research Ministry of Education), which can be used to verify the reconstructed streamflow. This station is a key station of the lower reaches of the Ganjiang River and controls 99.6% water collecting area of the overall basin [17].

2.2.3. Principal Component Regression Model and Quality Evaluation

The basic idea of principal component regression (PCR) [35] is to combine several variables with a certain correlation into new orthogonal comprehensive variables and use them as the basis for regression analysis. Principal component regression can completely maintain the information of the original data and perform dimensionality reduction processing on high-dimensional data to eliminate the mutual influence between various indicators, thereby improving the effectiveness of model prediction. The processing flow of principal component regression is shown in Figure 3. The correlation coefficient (r), relative bias (RB), absolute error (AE), and root mean square error (RMSE) are used to evaluate the effectiveness of the model. All these values are calculated as follows:
r = i n ( P i P ¯ ) ( A i A ¯ ) i n ( P i P ¯ ) 2 × i n ( A i A ¯ ) 2
A E = i = 1 n | ( P i A i ) | / n
R B   =   i = 1 n ( P i A i ) / A i × 100 % / n
R M S E = 1 n × i = 1 n ( P i A i ) 2
where Pi denotes the reconstructed streamflow, Ai denotes the gauged streamflow, and n is the sample number.

2.3. Overall Reconstruction Workflow

The reconstruction workflow is listed as follows (Figure 4): (1) Establish an ordinary least squares (OLS) model using the data of drought/flood grade and modern gauged precipitation data from the five representative stations. (2) Reconstruct the precipitation series from AD 1500 using a linear regression model established in the previous step. (3) Build a principal component regression (PCR) model by utilizing the modern gauged precipitation series of five representative stations and streamflow of the Waizhou Hydrometric Station. (4) Obtain the streamflow series of the Waizhou Hydrometric Station from AD 1500 by applying the reconstructed precipitation series of five representative stations to the PCR model. (5) Based on cumulative anomaly analysis, Mann-Kendall test, Redfit power spectrum, and continuous wavelet transformation, variation characteristics of Ganjiang 515 years streamflow was completed.

3. Streamflow Reconstruction

3.1. Precipitation Reconstruction of Five Stations

3.1.1. Drought Flood Grade and Precipitation Model

The linear relation between annual drought flood grade and precipitation based on the regression equation of drought/flood grade and gauged precipitation from 1955 to 2014 is shown in Table 2. A significant correlation is observed between drought flood grade and precipitation. The correlation coefficient (r) is approximately 0.7–0.8, indicating a positive correlation and all models passed the 99.9% confidence test. The coefficient of determination (r2) of the regression model is approximately 0.5–0.7, indicating that the fitting degree of the model is good.

3.1.2. Reconstruction Result of Precipitation

The precipitation series of five representative stations are reconstructed using the methods and models in Section 3.1.1 (Figure 5). The constructed precipitation based on the model and the actual measured precipitation on the overlap period (1955–2014) are compared to obtain results of uncertainty assessment. These results show that correlation coefficient (r) of five stations are 0.7917, 0.8635, 0.8757, 0.7226, and 0.8440, respectively, and their explained variance (r2) are 62.7%, 74.6%, 76.7%, 52.2%, and 71.2%, respectively. The reconstruction result is reliable, and the drought flood grade can be used to refer to precipitation.

3.2. Streamflow Reconstruction of the Ganjiang River

3.2.1. Reconstruction Model of Precipitation and Streamflow

Multiple regression analysis is conducted on the basis of the precipitation of five stations and the streamflow of Waizhou Hydrometric Station. Predictors x1, x2, x3, x4, and x5 denote the precipitation of Ganzhou, Jian, Nanchang, Gaoan, and Yichun, respectively, and predictor y denotes the streamflow of the Ganjiang River at the Waizhou Hydrometric Station. In this way, a tentative transfer function is constructed as follows: y = −1156.307 + 0.944x1 + 0.559x2 + 0.462x3 + 0.300x4 − 0.049x5. The coefficient of x5 is negative when the coefficient of determination (r2) is 0.835 and F statistic is 54.776 (p = 0.001), indicating large precipitation of Yichun and low streamflow of the Ganjiang River, which is inconsistent with the actual meaning. Multicollinearity in predictors may be the main reason for this error. Correlations exist among the five stations in some degree. Collinearity diagnostics show that the variance inflation factor (VIF) of independent variables are 2.100, 3.587, 6.886, 14.396, and 6.444. Some multicollinearities are observed because the VIF values of x3 to x5 are greater than six.
Principal component regression is used to build a new model for eliminating multicollinearity. A transfer function is constructed as follow: y = −1196.163 + 0.665x1 + 0.608x2 + 0.148x3 + 0.319x4 + 0.468x5. The adjusted r2 is 0.909, and F statistic is 94.562 (p = 0.0001). The fitting effect of principal component regression is better, and the coefficients of all independent variables are positive compared with multiple linear regression analysis, which is consistent with the actual meaning. Although the reconstruction results by this model are lower than the actual values in some extreme high flow years, such as the 1970s, the model can still reflect the flow extremes and changing trend (Figure 6A). The scatter plot (Figure 6B) show that reconstruction agrees well with the observed data of Waizhou Hydrometric Station during the overlap period from 1955 to 2014 with a correlation coefficient (r) is 0.891, and an explained variance (r2) is 79.4%. This demonstrates that this model is reliable and can be used to reconstruct streamflow variation of the Ganjiang River for the past 515 years.

3.2.2. Results of Streamflow Reconstruction

The streamflow from 1500 to 2014 and an 11-year moving mean are reconstructed using the principal component regression model in Section 3.2.1 and the precipitations of five stations reconstructed in Section 3.1.2 (Figure 7). Smoothing the reconstruction series clearly shows low-frequency variation. High streamflow is defined as more than the mean plus one standard deviation, whereas, low streamflow as less than the mean minus one standard deviation. For the past 515 years, low streamflow periods are defined for AD 1508–1514, 1527–1531, 1536–1544, 1601–1605, 1631–1636, 1659–1676, 1820–1826, 1890–1895, 1960–1969, 1986–1992, and 2005–2011. High streamflow periods are defined for AD 1550–1554, 1557–1561, 1581–1584, 1610–1619, 1736–1750, 1834–1862, 1873–1877, 1916–1920, and 1997–1999.
The middle and late 17th century are the lowest streamflow epoch in the Ganjiang River during the reconstruction period. Historical material recorded many serious droughts at that time. Nanchang experience drought in 1659, Yichun suffered two serious droughts in 1662 and 1665, and Ganzhou experienced drought in 1665. The flow sequence constructed by Gou et al. [36], who applied tree ring to streamflow reconstruction for the upper Yellow River, showed that the AD 1681–1687 are the high streamflow epoch in the upper reaches of the Yellow River. Therefore, the monsoon is extremely strong and can blow to Northwest China, causing small rainfall in Southern China [37].

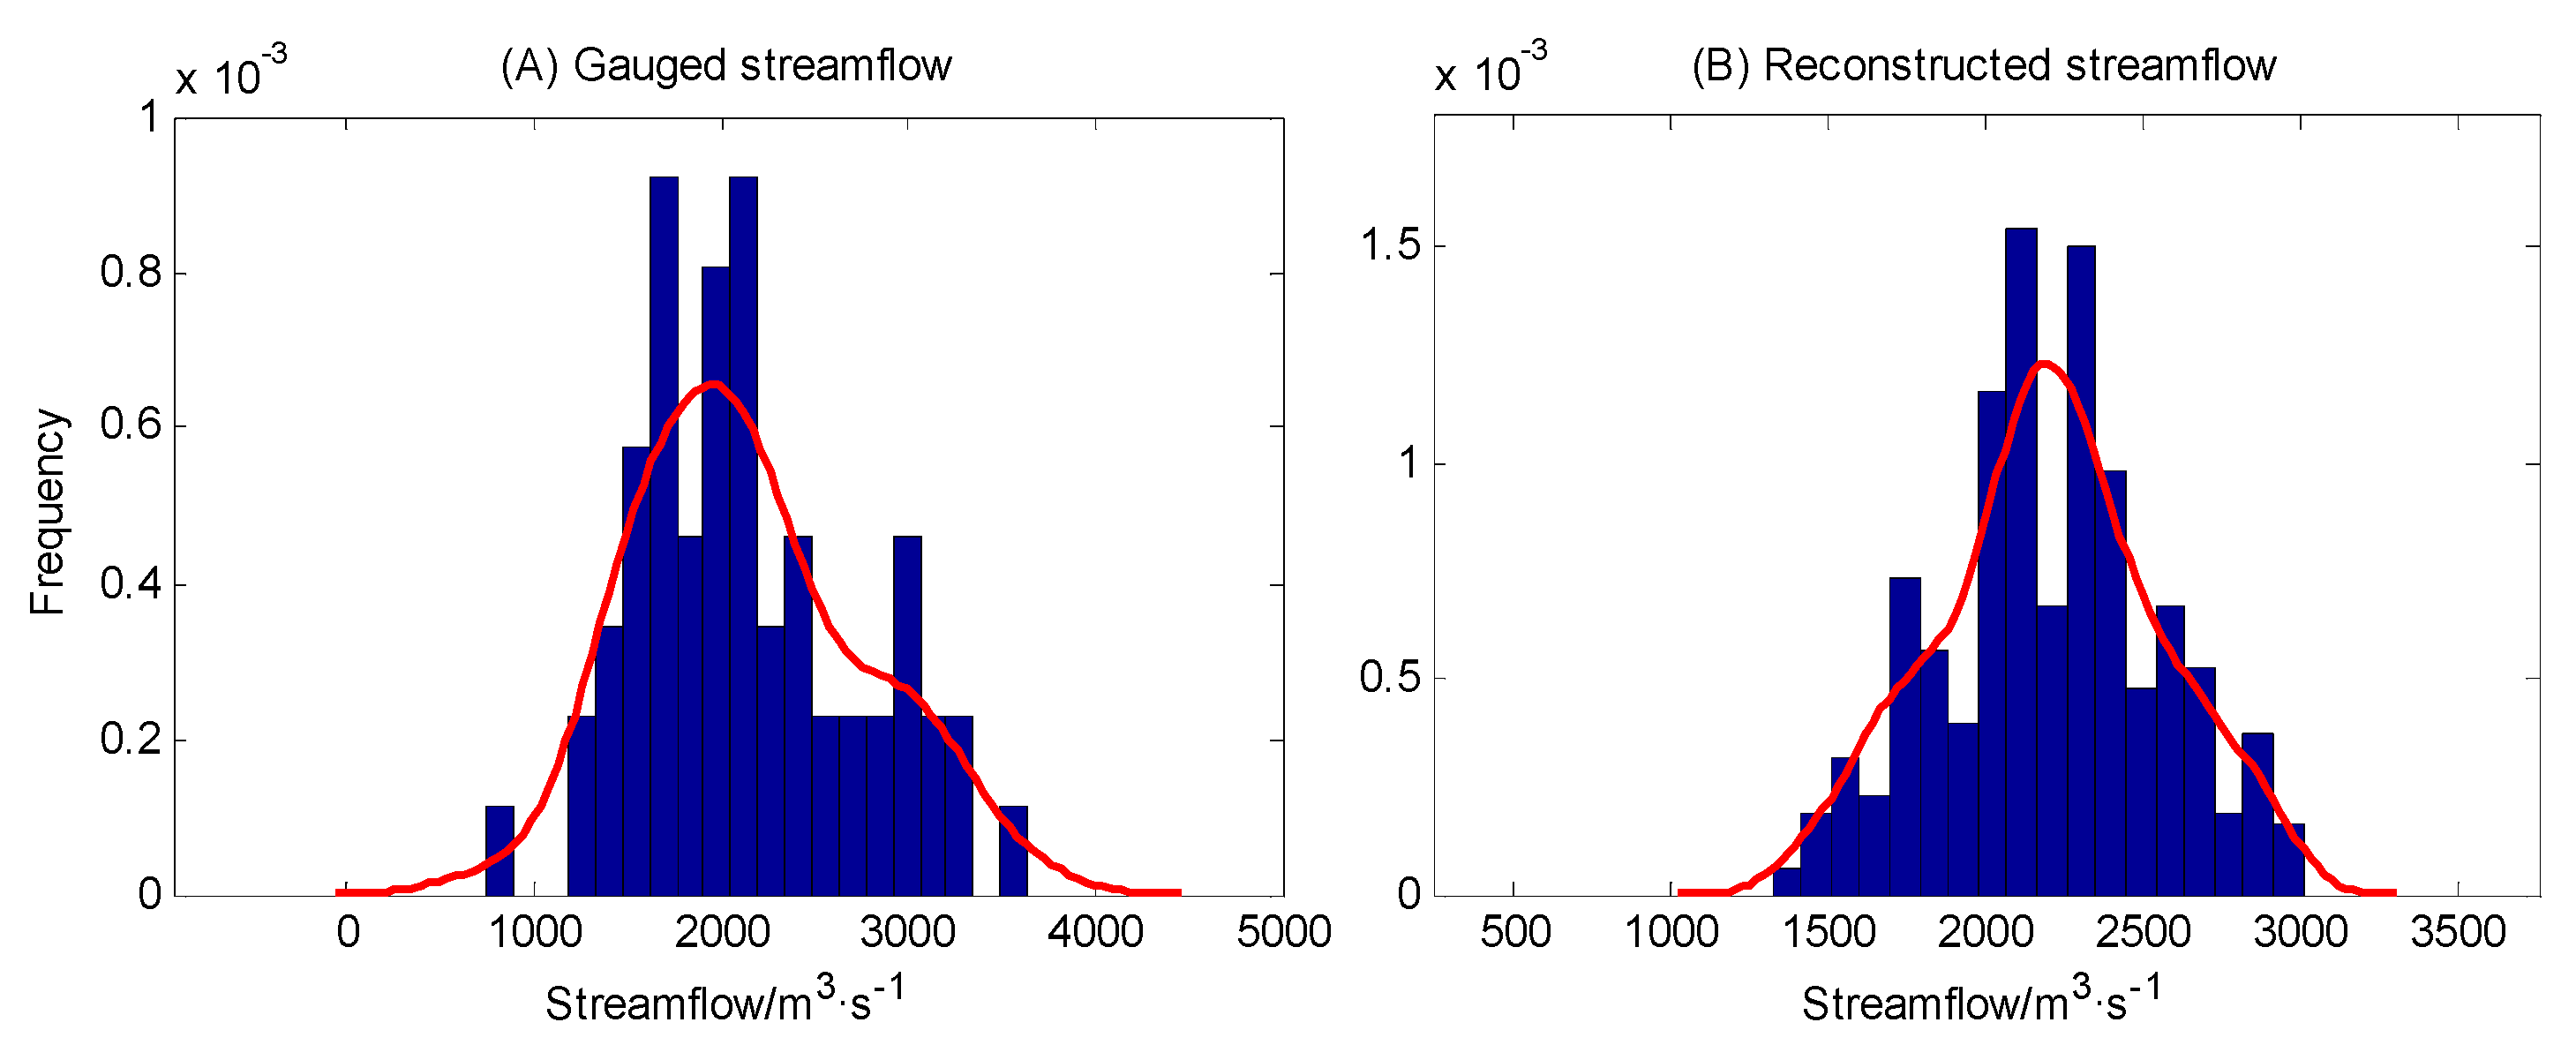
3.3. Model Validity and Uncertainty Analysis

The results of model validity evaluation show that AE of reconstructed streamflow of Waizhou Station Ganjiang River is 220.8 m3/s, and RMSE is 270.3 m3/s, with low RB of −1.82%. Although the reconstructed streamflow values have a lower probability at both ends of the frequency distribution, Figure 8 shows the reconstructed flow in the past 515 years, which is consistent with the gauged flow distribution frequency from 1955 AD to 2014 AD, and the kernel density curve of the two groups is approximately similar. This finding indicates that the reconstructed sequence in this study has certain stability to some extent. In addition to climate change, river streamflow is also affected by factors, such as topography, land use, soil, etc. [38]. Considering that, this study mainly analyzes the characteristics of flow changes on the 500-year scale during the historical era. Obviously, land use has an impact on river runoff. The research scale of this paper is the annual resolution streamflow reconstruction of more than 500 years, and there is a lack of more accurate historical land use records during the historical era [39]. In addition, topography and soil have little change on this time scale, so these factors are not included in the research models of this study.

4. Discussion

4.1. Analysis of Variation Characteristics

As shown in the cumulative anomaly analysis (Figure 9A), the streamflow series can be divided into three declining periods and two increasing periods for the past 515 years. The main declining periods are identified as AD 1500–1547, 1621–1720, 1962–2014, and the main increasing periods are identified as 1548–1620, and 1721–1961. The trend of cumulative anomaly curve from 1792 to 1961 is mainly upward, although there are also some small fluctuations, such as 1831–1842, 1892–1937. The results of Mann-Kendall test (Figure 9B) indicate that the abrupt change occurs from 1710 to 1720. Combining the results of cumulative anomaly analysis and Mann-Kendall test, the abrupt change point from low streamflow to high streamflow occurs around AD 1720. For reasons of rational use of water resources and maintaining ecological balance, it is important to understand the long-term changes in runoff [40,41,42]. Studies in Bulgaria have also shown that inter-decadal and inter-annual changes in surface runoff have important implications for water use [40], which changed from ~100 L/person/day in 1970, it rose to the highest value of ~220 L/person/day in 1990, and then began to drop to ~140 L/person/day in 1995 [43]. In the past 500 years, the results of flow reconstruction in the area near the Baltic Sea region [44] also show that the streamflow changes have different scales of periodic changes, such as 16 years, 32 years and above period.
The results of Redfit power spectrum (Figure 10) show three kinds of significant periods are found in the flow variation of the Ganjiang River for the past 515 years, which are 2–5, 7–8, and approximately 32 years, where the most significant period is 2–3 years (at 99% confidence level). The periods of 2–5 and 7–8 years may have relations with El Niño/Southern Oscillation (ENSO) [45], whereas, the period of 32 years may have relations with long-term fluctuations in solar activity [46], especially Bruckner cycle [47].

4.2. Relationship between Streamflow and ENSO

To illustrate the relations between streamflow and ENSO, continuous wavelet transformation (CWT) [48] is applied to compare the streamflow series reconstructed in this study and ENSO Niño3.4 index from 1500 to 2000 reconstructed by Li et al. [49] with the scale of eight years of wavelet coefficient. Results show that significant positive or negative correlations are found (Figure 11) in different periods. The main positive correlations are identified as 1500–1531, 1652–1709, 1786–1819, 1841–1865, 1884–1905, and the main negative correlations are identified as 1532–1576, 1612–1651, 1710–1734, 1866–1883, and 1961–2005. The periods of 1577–1611, 1735–1785, 1820–1840, and 1906–1960 are in an unstable state. The rainfall of East China is opposite with ENSO on the basis of the modern observed meteorological data [50]. The rainfall of East China is less than that in ENSO development year, whereas, the rainfall is more than that in ENSO recovery year. The long-term relationship between the Ganjiang River streamflow and ENSO varies. As shown in Figure 11A, the positive correlation is designated as 1, negative correlation is −1, and the other is 0. Thus, the correlation of 170 years is positive, 173 years are negative, and 162 years are lagging or ahead of one-fourth cycle between the reconstructed streamflow and ENSO index wavelet coefficient series from 1500 to 2014 (Figure 11B). The relationship between the East Asian monsoon, precipitation, and ENSO is complex [51]. This study only considers the relationship between the streamflow and the ENSO index series, and the reliability of its model validity needs further study.

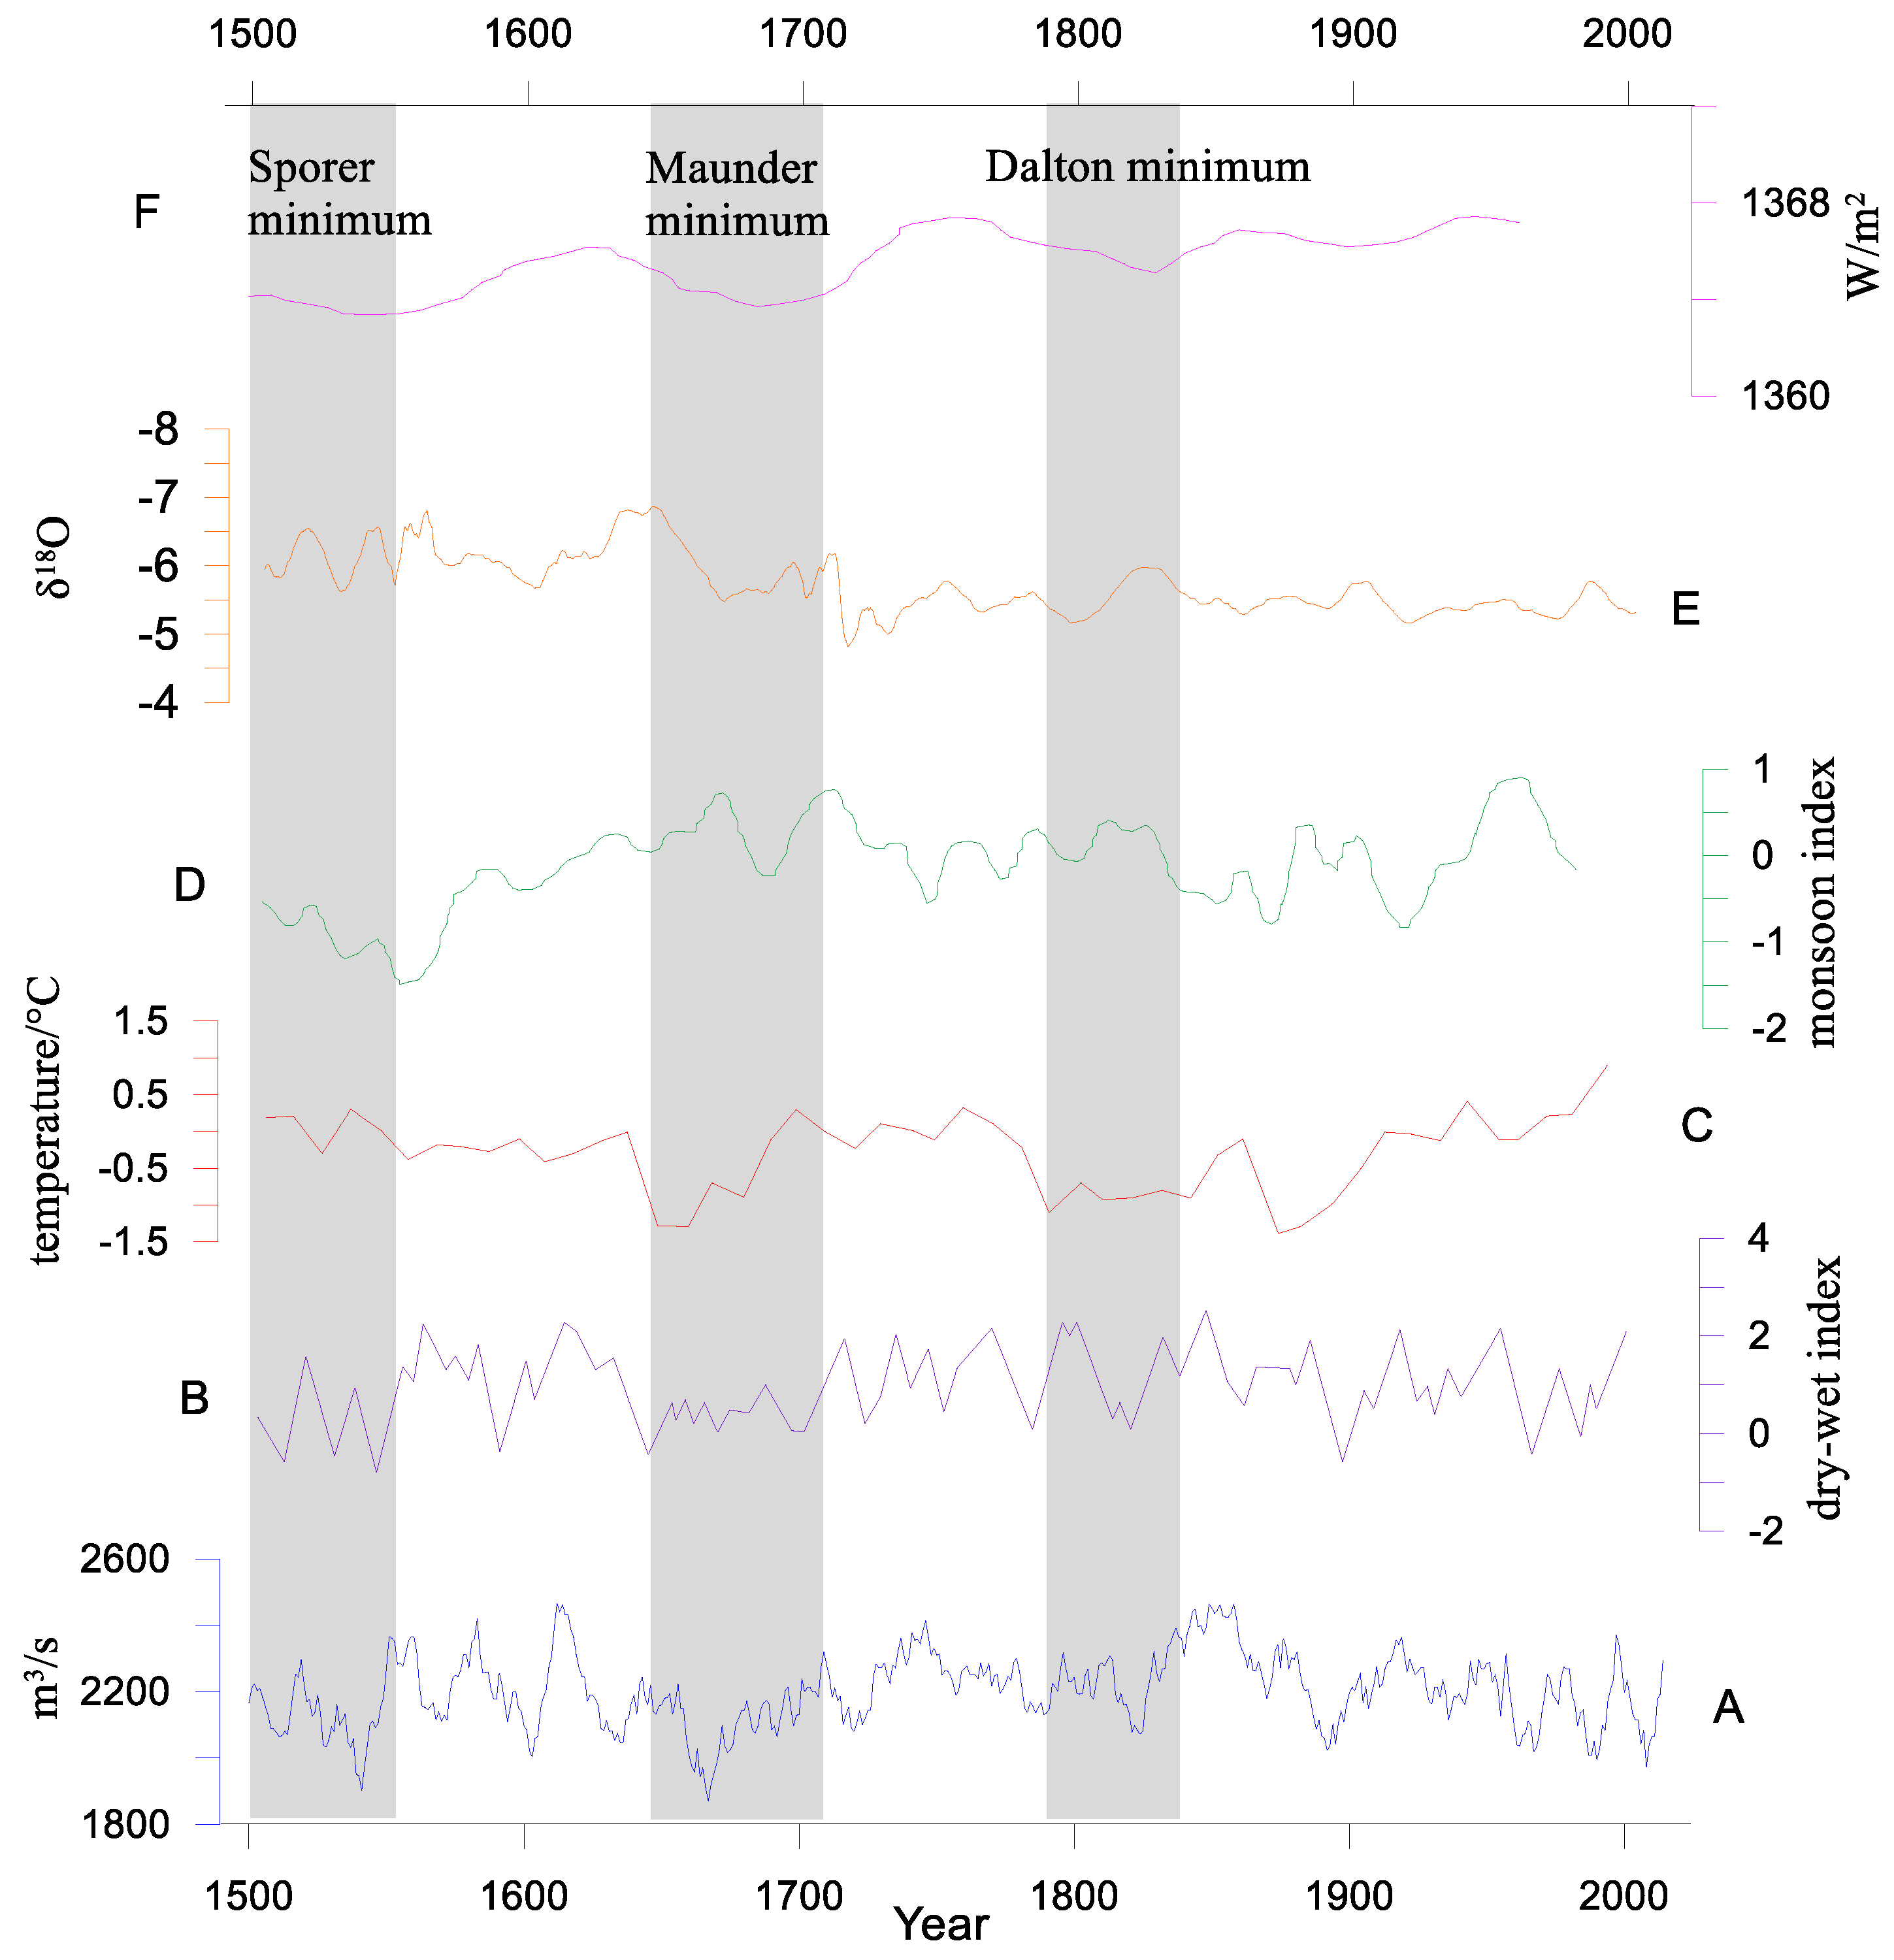
4.3. Effect of Temperature, Monsoon, and Solar Activity

The trends of the reconstructed Ganjiang streamflow (Figure 12A) series with the dry–wet series in Eastern China for nearly 500 years (Figure 12B) are basically the same [52]. This condition shows that the variation of Ganjiang streamflow is controlled by the overall dry and wet patterns in Eastern China. The temperature of Eastern China series (Figure 12C) reconstructed by Ge et al. [53] showed that the streamflow is relatively low during the low-temperature period. The precipitation in the middle and lower reaches of the Yangtze River is significantly affected by temperature [54]. Therefore, the changes in streamflow are obviously affected by precipitation around the area. A relevant study [36] showed that abundant precipitations in northern China and a small amount of precipitation in the south occur because the rain belt advances northward. Figure 12D shows the East Asian Monsoon (EAM) index reconstructed by Zhou et al. [55]. The rain belt cannot advance to northwest China and stagnates in the middle and lower reaches of the Yangtze River when the monsoon is weak, thereby leading to a relative increase in the Ganjiang streamflow in this period. Solar activity has a greater impact on climate change [56]. Although the South Asian monsoon (SAM) has a certain effect on the precipitation in East Asia, related studies [57,58] have shown that the dividing line between SAM and EAM is near 102° E, so it has less impact on the Ganjiang River Basin, were located east of 114° E. Compared with oxygen isotope (δ18O) (Figure 12E) series of the South Asian monsoon from the stalagmites in Jhumar Cave, India [59], it can be found that the relationship with the precipitation of the Ganjiang River is not obvious. As shown in Figure 12 (F), the comparisons of Ganjiang River streamflow series with the total solar irradiance (TSI) reconstructed by 10Be from ice cores and 14C from tree rings [60] for the past 500 years show good correspondence. Low TSI indicates low streamflow and vice versa. The low streamflow periods of 1527–1531, 1536–1544, and 1659–1676 AD at the Ganjiang River coincide well with the Sporer minimum and Maunder minimum [61]. The low streamflow period in 1820–1826 AD is consistent with the Dalton minimum [62]. Streamflow may be affected by temperature and East Asian monsoon, which are controlled by solar activities [63,64,65]. Floods in Ganjiang River may be related to strong solar activity, monsoon failure, and vice versa.

4.4. Hydrological Frequency Curve Analysis

Owing to abundant cultural heritage, spatially explicit and well-dated local chronicle materials illustrate general streamflow patterns and historic floods or droughts for the past 515 years, thereby facilitating historical hydrological and sustainable development research. Recent streamflow variations should be investigated in a long-term context to understand future changes in water resources. Considering that the modern hydrological observation data of the Ganjiang River are approximately 50 years, an ultra-long series that contains considerable intrinsic attributes that could not be obtained from short-gauged records should be developed. The streamflow of the Ganjiang River once in a hundred years may reach up to 3270 m3/s for flood and 1540 m3/s for drought on the basis of the calculation results of the P-III hydrological frequency curve using the reconstructed Ganjiang River streamflow series for the past 515 years (Figure 13), indicating that the total amount of water resources in a year is 1031 × 108 m3 and 485 × 108 m3, respectively. The standard of the once in a millennium runoff may reach up to 3770 m3/s for flood and 1430 m3/s for drought, indicating that the amount of water resources in a year is 1188 × 108 m3 and 450 × 108 m3, respectively. The results of hydrological frequency analyses can provide basic water resource data for socially sustainable development and land use or urban ecological governance in Jiangxi Province. Land use has a certain impact on regional runoff and ecosystem services [7,66]. This study mainly focuses on the reconstruction of the streamflow during the historical period, and land use change may not a drastic change, so the impact of land use on streamflow may not be obvious. Changes in land use structures may have an impact on regional runoff [67]. Therefore, to obtain detailed data on land use in historical periods, we can further understand the relationship between land use and water resources on a long-term scale.

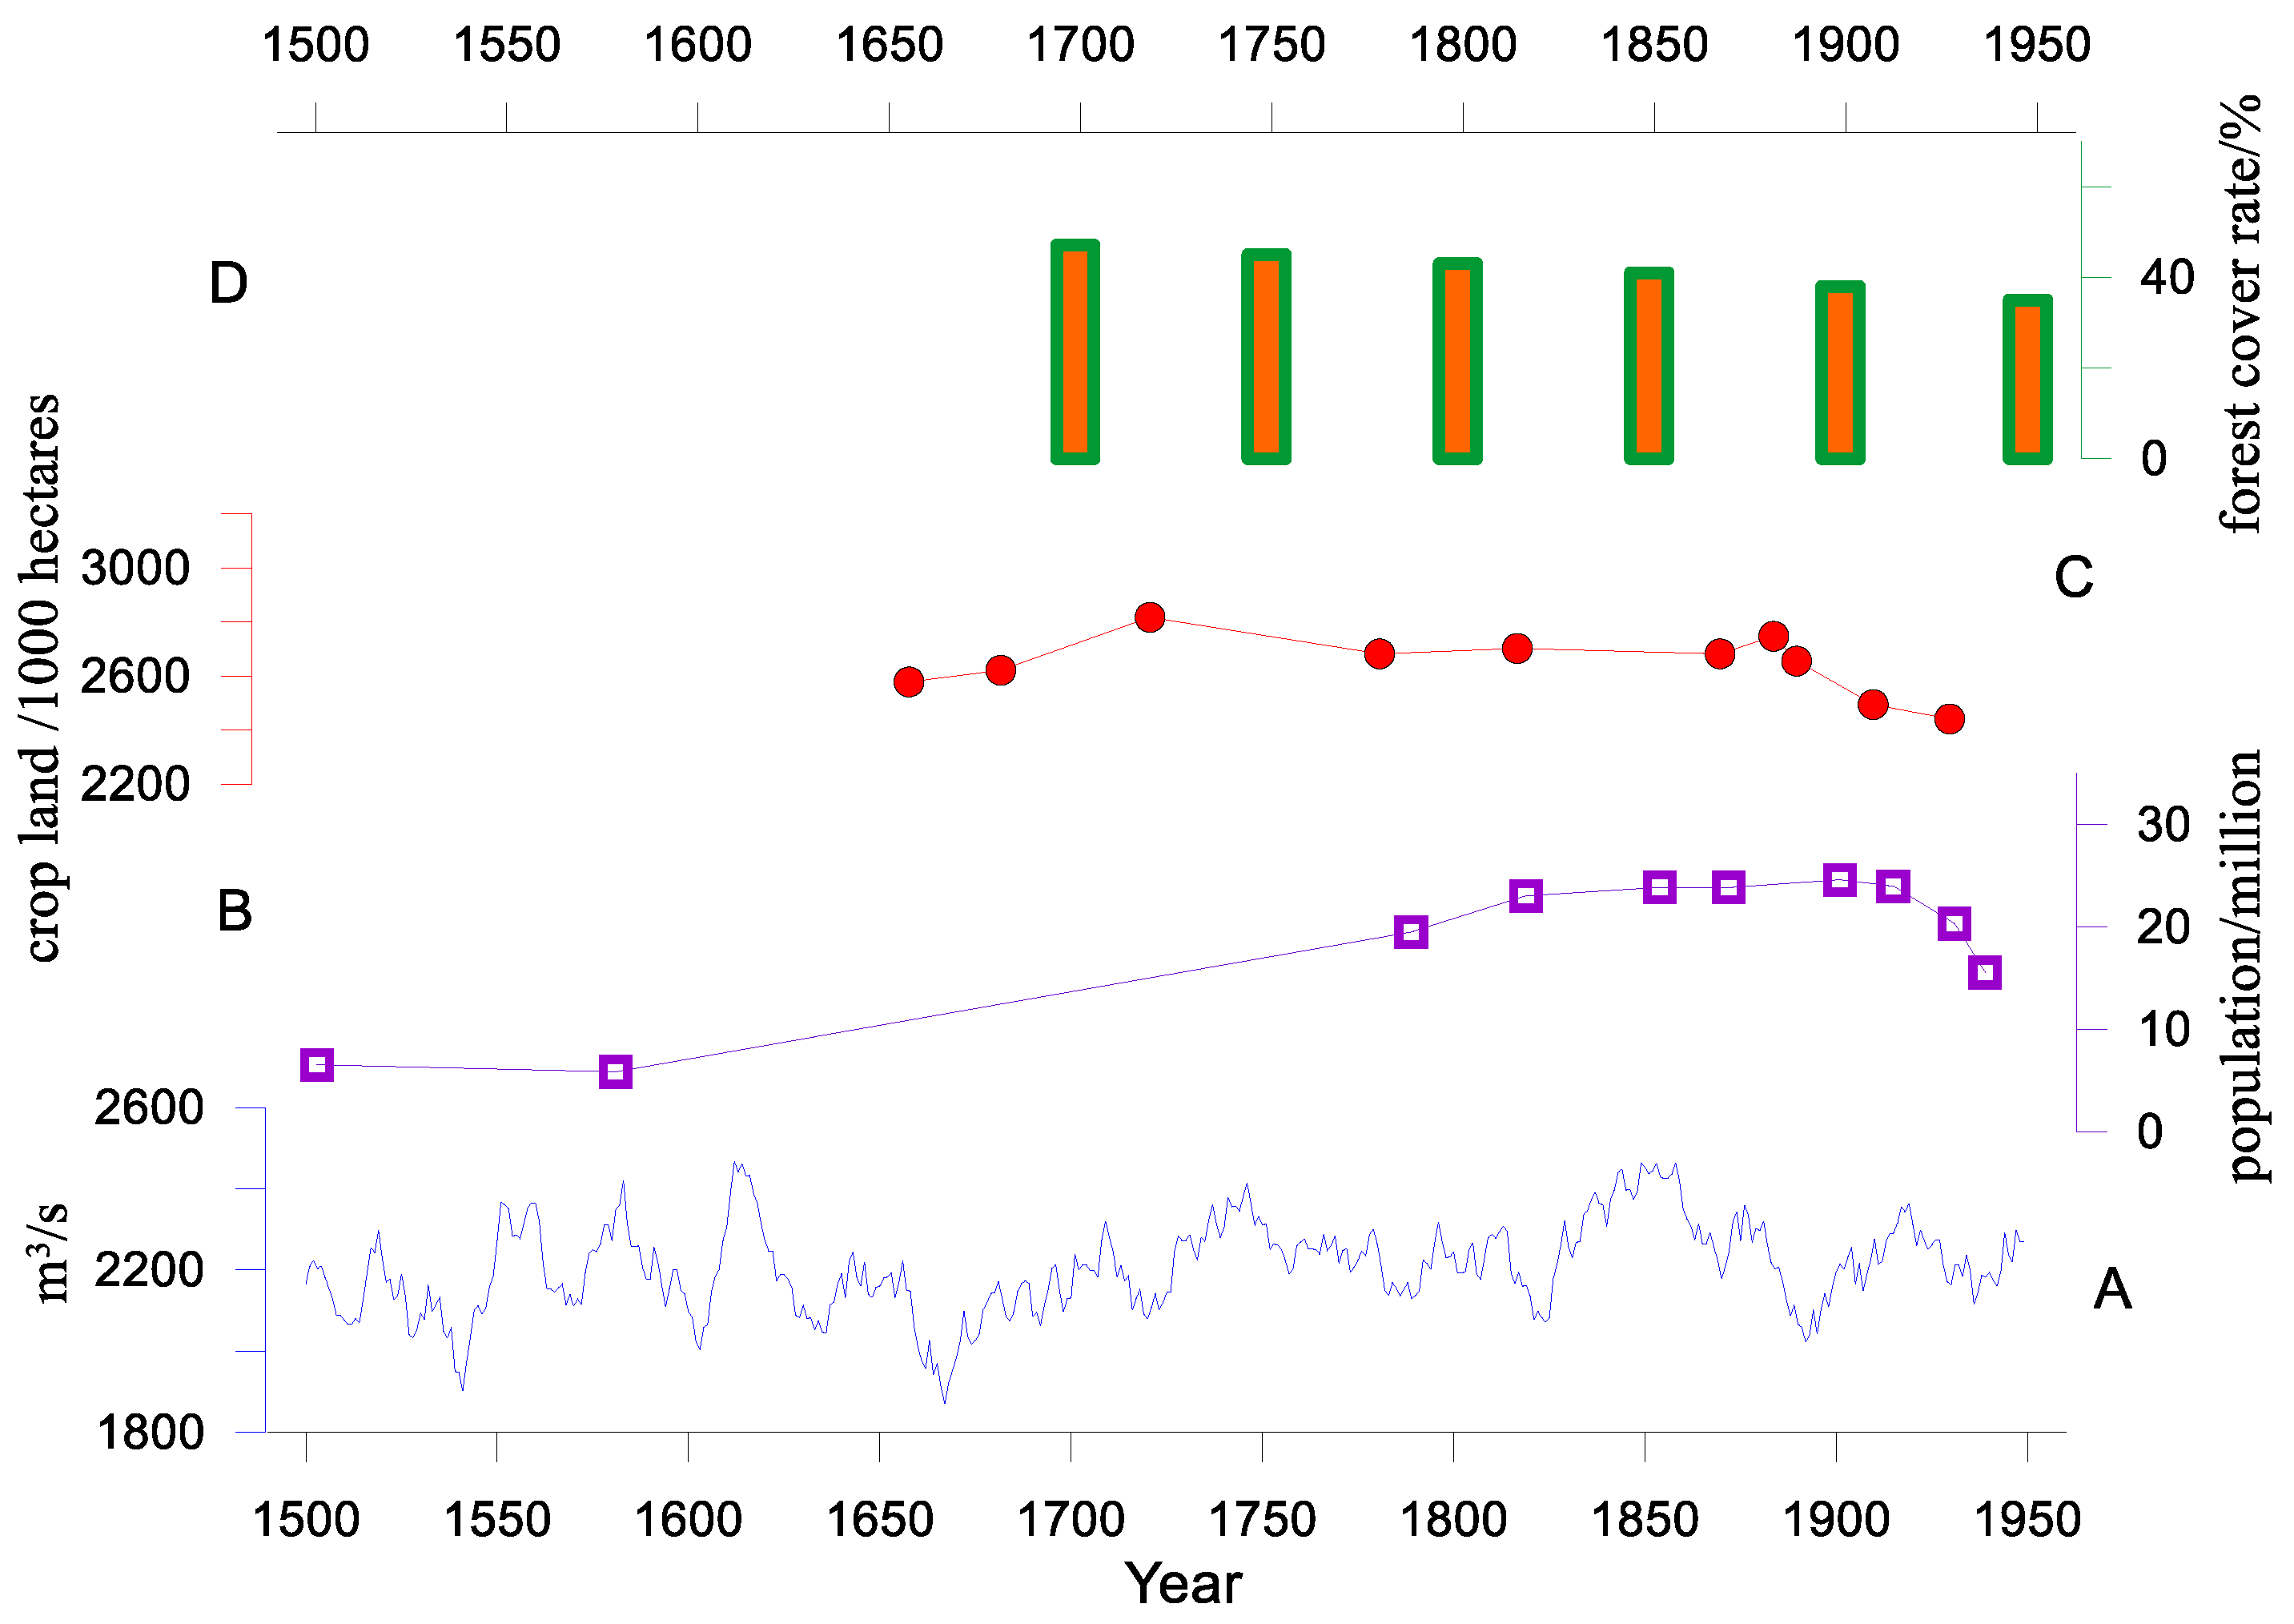
4.5. Land use, Flood Control, and Basin Sustainable Development

The impact of land use on water resources is multifaceted [68,69]. Some studies have shown that under different land use patterns, water production parameters and soil hydraulic properties are significantly different [70,71]. Simulation studies [72,73] show that changes in land use, especially the increase in the proportion of urban land, may cause changes in the spatial and temporal distribution of water resources [74,75], increasing the risk of impervious surfaces and urban waterlogging [76]. In addition, due to the increase in urban population, it is possible to increase the possibility of water shortage on local scales [77]. Therefore, understanding the long-term changes of water resources in basins is important for regional sustainable development, rational use of water resources, and flood control.
China began to have relatively complete statistical data since the 1950s, hence, we compared the Ganjiang runoff data from 1500 to 1950 with related historical data on population [78], crop land [79], and forest cover rate data [80]. As can be seen from Figure 14, the historical population of Jiangxi province has shown an overall upward trend since 1500. The area of cropland during this period has remained relatively stable, with an average value of about 2640 thousand hectares [79]. The forest coverage rate decreased from 47.1% in 1700 to 35% in 1949 [80]. According to the reconstruction results of this study, the streamflow of the Ganjiang River from 1500 to 1950 had certain fluctuations. In general, the population development of Jiangxi in the historical period was more consistent with changes in cultivated land. There is a negative correlation between forest cover rate and cropland and population. The relationship between water resource use and population and cropland in this period needs further study.
For regional sustainable development in Jiangxi Province, the water level of Poyang Lake has continued to be low in recent years with the impoundment of the Three Gorges Project. Therefore, the local government has repeatedly proposed the construction of water control projects in Poyang Lake. This is likely to cause damage to the lake’s ecological environment and migratory bird habitat. According to the results of the reconstruction of the Ganjiang streamflow of the past 515 years, this study shows that the variation of Ganjiang streamflow has a degree of fluctuation, but it has certain stability from the long-term scale. Since the Ganjiang River is the main water source of Poyang Lake, the lake water level change is likely to be a normal feedback process of streamflow fluctuation. With the normal water level of Poyang Lake in recent years, the local government abandoned the original plan for dam construction and replaced it with an open gateless project with little damage to the ecological environment.
From 1955 to 2014, Ganjiang streamflow has gauged data (Figure 15). Although the streamflow during this period still has some fluctuations, it is relatively stable overall, with an average value of 2132.2 m3/s. During this period, the population of Jiangxi Province increased from 15.68 million in 1955 to 45.42 million in 2014 [81]. The cropland in this period was generally consistent with the rising trend of the population. After entering the 1990s, the total cropland area remained at about 2900 thousand hectares [81]. Forest coverage has maintained a relatively steady upward trend, rising from 35% in 1955 to 63% in 2014 [82]. This is mainly due to the economic development of Jiangxi Province and the improvement of urbanization, which enables the reduction of deforestation and the implementation of barren hill greening projects [83]. Studies in the small area of the Ganjiang basin also show that the population of the Jitai basin increased from 1.11 million to 2.45 million between 1955 and 1995 [84]. During this period, the area of cropland decreased slightly, and the area of the forest increased to a certain extent [84]. Therefore, with the increase of population and the rise of urbanization rate, the rational use of regional water resources is particularly important. In addition, the concentration of the population has put forward higher requirements for the prevention of flood risks.

5. Conclusions

Understanding the past is important in predicting the future. In this study, we reconstruct the precipitation of five representative stations on the basis of the quantitative reconstruction of drought-wet historical material and the division of the Ganjiang River drainage basin. A principal component regression model based on the modern data of precipitation and streamflow is used to verify the correlation analysis during the reconstruction period. The reconstruction model is valid, with a low RB of −1.82%. The streamflow variation of the Ganjiang River for the past 515 years is reconstructed using this model. The result shows that high streamflow occurs nine times, and low flows occur 11 times. Extremely low streamflow during the reconstruction period is found during the middle and late 17th century. The accumulated anomaly and Mann-Kendall test results reveal that a mutational point from low streamflow to high streamflow occurs in AD 1720. Redfit power spectrum analysis shows that the variation periods are 2–5, 7–8, and approximately 32 years, where the most significant period is 2–3 years. CWT suggests that the corresponding relation between streamflow and ENSO is eight years. Streamflow is affected by temperature and East Asian monsoon, which are controlled by solar activities. Floods may be related to strong solar activity, monsoon failure, and vice versa. Hydrological frequency curve analysis shows that the streamflow of the Ganjiang River once in a hundred years may reach up to 1031 × 108 m3 for flood or 485 × 108 m3 for drought, and the standard of the once in a millennium runoff may reach up to 1188 × 108 m3 for flood or 450 × 108 m3 for drought. Some limitations are found in this study, such as the judgment of historical drought and flood levels is subjective, and the reconstructed streamflow is the annual average that may not match the instantaneous extreme value of the river. The characteristic analysis of Ganjiang River streamflow may provide basic hydrological data for the sustainable development of society and may serve as a reference for future studies on mitigating the impacts of drought and flood disasters and provide insight into the rational use of water resources in Jiangxi Province.

Author Contributions

Z.W. and F.L. conceived and designed the experiments; Z.W., X.C., M.J. (Min Ju) and M.J. (Meixin Jiang) performed the model; Z.W., G.L., H.L., C.L., S.L. and Y.J. analyzed the data; Z.W. wrote the paper. All authors have read and agreed to the published version of the manuscript.

Funding

This study was supported by the National Natural Science Foundation of China (Grant No. 41761045 and 41561020).

Acknowledgments

We thank anonymous referees and the editor for their helpful comments that greatly improved the quality of this research.

Conflicts of Interest

The authors declare no conflict of interest.

References

  1. Danker Dankers, R.; Feyen, L. Climate change impact on flood hazard in Europe: An assessment based on high-resolution climate simulations. J. Geophys. Res. Atmos. 2008, 113, 1–17. [Google Scholar] [CrossRef]
  2. Cox, P.M.; Betts, R.A.; Jones, C.D.; Spall, S.A.; Totterdell, I.J. Acceleration of global warming due to carbon-cycle feedbacks in a coupled climate model. Nature 2000, 408, 184–187. [Google Scholar] [CrossRef] [PubMed]
  3. Brown, P.T.; Caldeira, K. Greater future global warming inferred from Earth’s recent energy budget. Nature 2017, 552, 45–50. [Google Scholar] [CrossRef]
  4. IPCC. Climate Change 2013: The Physical Science Basis: Working Group I Contribution to the Fifth Assessment Report of the Intergovernmental Panel on Climate Change; Cambridge University Press Cambridge: New York, NY, USA, 2013. [Google Scholar]
  5. Seneviratne, S.I.; Nicholls, N.; Easterling, D.; Goodess, C.M.; Zhang, X. Changes in Climate Extremes and Their Impacts on the Natural Physical Environment; Cambridge University Press: Cambridge, UK, 2012. [Google Scholar]
  6. Yan, J.; Huang, C.; Chen, Y. Cross-century Global Environmental Problems and Behavioral Countermeasures; Science Press: Beijing, China, 1999. [Google Scholar]
  7. Shankman, D.; Davis, L.; de Leeuw, J. River management, landuse change, and future flood risk in China’s Poyang Lake region. Int. J. River Basin Manag. 2009, 7, 423–431. [Google Scholar] [CrossRef]
  8. Gao, T.; Xie, L.; Liu, B. Association of extreme precipitation over the Yangtze River Basin with global air-sea heat fluxes and moisture transport. Int. J. Climatol. 2016, 36, 3020–3038. [Google Scholar] [CrossRef]
  9. Luo, X. Annals of Water Resources in Jiangxi Province (1991-2000); China Water Conservancy and Hydropower Press: Beijing, China, 2005. [Google Scholar]
  10. Mirza, Q. Climate change and extreme weather events: Can developing countries adapt? Clim. Policy 2003, 3, 233–248. [Google Scholar] [CrossRef]
  11. Ren, M.; Bao, H.; Yang, R. An Outline of China’s Physical Geography; Foreign Languages Press: Beijing, China, 1985. [Google Scholar]
  12. Zhang, Y. Water Resources of Jiangxi Province; Jiangxi Science and Technology Press: Nanchang, China, 2005. [Google Scholar]
  13. Zhang, B. Poyang Lake Research; Shanghai Scientific and Technical Publishers: Shanghai, China, 1988. [Google Scholar]
  14. Wu, N.; Luo, Y.; Liu, T.; Huang, Z. Experimental study on the effect of the Three Gorges Project on water level in Lake Poyang. J. Lake Sci. 2014, 26, 522–528. [Google Scholar]
  15. Fang, C.; Cao, W.; Mao, J.; Li, H. Relation between Poyang Lake and Yangtze River and the Three Georges Reservoir’s Influence. J. Hydraul. Eng. 2012, 43, 175–181. [Google Scholar]
  16. Huang, Y.; Luo, W. Analysis of characteristics and variation tendency of runoff in Ganjiang River. Yangtze River 2012, 43, 27–31. [Google Scholar]
  17. Gu, C.; Mu, X.; Gao, P.; Wan, X. Variation of runoff and sediment discharge and response to human activities in the Ganjiang River. J. Sediment Res. 2016, 41, 38–44. [Google Scholar]
  18. Meko, D.M.; Therrell, M.D.; Baisan, C.H.; Hughes, M.K. Sacramento river flow reconstructed to A.D. 869 from tree rings. J. Am. Water Resour. As. 2001, 37, 1029–1039. [Google Scholar] [CrossRef]
  19. Smith, L.P.; Stockton, C.W. Reconstructed Stream Flow for the Salt and Verde Rivers from Tree-Ring Data. J. Am. Water Resour. As. 2010, 17, 939–947. [Google Scholar] [CrossRef]
  20. Gou, X.; Chen, F.; Cook, E.; Jacoby, G.; Yang, M.; Li, J. Streamflow variations of the Yellow River over the past 593 years in western China reconstructed from tree rings. Water Resour. Res. 2007, 43, 1820–1830. [Google Scholar] [CrossRef]
  21. Watson, T.A.; Barnett, F.A.; Gray, S.T.; Tootle, G.A. Reconstructed Stream Flows for the Headwaters of the Wind River, Wyoming, USA. J. Am. Water Resour. As. 2009, 45, 224–236. [Google Scholar] [CrossRef]
  22. Liu, Y.; Sun, J.; Song, H.; Cai, Q.; Bao, G.; Li, X. Tree-ring hydrologic reconstructions for the Heihe River watershed, western China since AD 1430. Water Res. 2010, 44, 2781–2792. [Google Scholar] [CrossRef]
  23. Gou, X.; Chen, F.; Jacoby, G.; Cook, E.; Yang, M.; Peng, J.; Zhang, Y. Rapid tree growth with respect to the last 400 years in response to climate warming, northeastern Tibetan Plateau. Int. J. Climatol. 2007, 27, 1497–1503. [Google Scholar] [CrossRef]
  24. Chen, F.; Yuan, Y.J.; Wei, W.S.; Yu, S.L.; Zhang, T.W.; Shang, H.M.; Zhang, R.B.; Qin, L.; Fan, Z.A. Tree-ring recorded hydroclimatic change in Tienshan mountains during the past 500 years. Quatern. Int. 2015, 358, 35–41. [Google Scholar] [CrossRef]
  25. Yuan, Y.; Shao, X.; Wei, W.; Yu, S.; Yuan, G.; Trouet, V. The Potential to Reconstruct Manasi River Streamflow in the Northern Tien Shan Mountains (NW China). Tree-Ring Res. 2007, 63, 81–93. [Google Scholar] [CrossRef] [Green Version]
  26. Qiao, L.; Wang, B.; Guo, H.; Wu, X.; Zhou, M.; Wang, Z.; Liu, X.; Xia, L.; Deng, Z. Reconstruction and analysis of July-September precipitation in Mt. Dagangshan, China. Acta Ecol. Sin. 2011, 31, 2272–2280. [Google Scholar]
  27. Yang, H. Compilation and Research of Jiangxi Local Records. Jiangxi Soc. Sci. 2000, 40, 72–76. [Google Scholar]
  28. Gong, G. Research Methods of Climate Change in Historical Period; Science Press: Beijing, China, 1983. [Google Scholar]
  29. Ge, Q. Climate Change through Every Chinese Dynasty; Science Press: Beijing, China, 2011. [Google Scholar]
  30. Zhang, D.; Liu, C.; Jiang, J. Reconstruction of Six Regional Dry/Wet Series and Their Abrupt Changes during the Last 1000 Years in East China. Quat. Sci. 1997, 17, 1–11. [Google Scholar]
  31. Xue, J.; Zhong, W. Precipitation Reconstruction and Analysis in Guangdong Province since 1470. J. South China Norm. Univ. 2006, 38, 125–133. [Google Scholar]
  32. Xu, Y. Research on Land Use Ecological Security Pattern in Jiangxi Province. Master’s Thesis, Jiangxi Normal University, Nanchang, China, 2017. [Google Scholar]
  33. Xiong, D. Meteorological Annals of Jiangxi Province; Annals Press: Beijing, China, 1997. [Google Scholar]
  34. Sciences, C.A.O.M. Yearly Charts of Dryness/Wetness in China for the Last 500 Years Period; Cartographic Publishing House: Beijing, China, 1981. [Google Scholar]
  35. Reiss, P.T.; Ogden, R.T. Functional principal component regression and functional partial least squares. J. Am. Stat. Assoc. 2007, 102, 984–996. [Google Scholar] [CrossRef]
  36. Gou, X.; Deng, Y.; Chen, F.; Yang, M.; Fang, K.; Gao, L.; Yang, T.; Zhang, F. Tree ring based streamflow reconstruction for the Upper Yellow River over the past 1234 years. Chin. Sci. Bull. 2010, 55, 4179–4186. [Google Scholar] [CrossRef]
  37. Pan, W.; Fei, J.; Man, Z.; Zheng, J.; Zhuang, H. The fluctuation of the beginning time of flood season in North China during AD1766–1911. Quatern. Int. 2015, 380, 377–381. [Google Scholar] [CrossRef]
  38. Hu, S.; Fan, Y.; Zhang, T. Assessing the Effect of Land Use Change on Surface Runoff in a Rapidly Urbanized City: A Case Study of the Central Area of Beijing. Land 2020, 9, 17. [Google Scholar] [CrossRef] [Green Version]
  39. Xie, J. Land Annals of Jiangxi Province; China Local Records Press: Beijing, China, 2003. [Google Scholar]
  40. Mimides, T.; Kotsovinos, N.; Rizos, S.; Soulis, C.; Karakatsoulis, P.; Stavropoulos, D. Integrated runoff and balance analysis concerning Greek-Bulgarian transboundary hydrological basin of River Nestos/Mesta. Desalination 2007, 213, 174–181. [Google Scholar] [CrossRef]
  41. Poff, N.L.; Brown, C.M.; Grantham, T.E.; Matthews, J.H.; Palmer, M.A.; Spence, C.M.; Wilby, R.L.; Haasnoot, M.; Mendoza, G.F.; Dominique, K.C.; et al. Sustainable water management under future uncertainty with eco-engineering decision scaling. Nat. Clim. Chang. 2016, 6, 25–34. [Google Scholar] [CrossRef] [Green Version]
  42. Tetzlaff, D.; Carey, S.K.; McNamara, J.P.; Laudon, H.; Soulsby, C. The essential value of long-term experimental data for hydrology and water management. Water Resour. Res. 2017, 53, 2598–2604. [Google Scholar] [CrossRef] [Green Version]
  43. Knight, C.G.; Staneva, M.P. The water resources of Bulgaria: An overview. GeoJournal 1996, 40, 347–362. [Google Scholar] [CrossRef]
  44. Hansson, D.; Eriksson, C.; Omstedt, A.; Chen, D. Reconstruction of river runoff to the Baltic Sea, AD 1500-1995. Int. J. Climatol. 2011, 31, 696–703. [Google Scholar] [CrossRef]
  45. Fang, K.Y.; Gou, X.H.; Chen, F.; Yang, M.X.; Li, J.B.; He, M.S.; Zhang, Y.; Tian, Q.H.; Peng, J.F. Drought variations in the eastern part of northwest China over the past two centuries: Evidence from tree rings. Clim. Res. 2009, 38, 129–135. [Google Scholar] [CrossRef] [Green Version]
  46. Zhan, L.; He, J.; Ye, Y.; Zhao, H. Periodicity Analysis of Solar Activity by Wavelet Analyzing Method. Acta Astron. Sin. 2006, 47, 166–174. [Google Scholar]
  47. Tian, Q.; Gou, X.; Zhang, Y.; Peng, J.; Wang, J.; Chen, T. Tree-Ring Based Drought Reconstruction (A.D. 1855-2001) for the Qilian Mountains, Northwestern China. Tree-Ring Res. 2009, 63, 27–36. [Google Scholar] [CrossRef]
  48. Grinsted, A.; Moore, J.C.; Jevrejeva, S. Application of the cross wavelet transform and wavelet coherence to geophysical time series. Nonlinear Proc. Geoph. 2004, 11, 561–566. [Google Scholar] [CrossRef]
  49. Li, J.; Xie, S.P.; Cook, E.R.; Morales, M.S. El Niño modulations over the past seven centuries. Nat. Clim. Chang. 2013, 3, 822–826. [Google Scholar] [CrossRef] [Green Version]
  50. Jin, Z.; Tao, S. A Study on the Relationships between ENSO Cycle and Rainfalls during Summer and Winter in Eastern China. Chin. J. Atmos. Sci. 1999, 23, 663–672. [Google Scholar]
  51. Chen, W.; Feng, J.; Wu, R. Roles of ENSO and PDO in the link of the East Asian winter monsoon to the following summer monsoon. J. Clim. 2013, 26, 622–635. [Google Scholar] [CrossRef]
  52. Zheng, J.; Wang, W.C.; Ge, Q.; Man, Z.; Zhang, P. Precipitation Variability and Extreme Events in Eastern China during the Past 1500 Years. Terr. Atmos. Ocean. 2006, 17, 579–592. [Google Scholar] [CrossRef] [Green Version]
  53. Ge, Q.; Zheng, J.; Fang, X.; Man, Z.; Zhang, X.; Zhang, P.; Wang, W. Winter half-year temperature reconstruction for the middle and lower reaches of the Yellow River and Yangtze River, China, during the past 2000 years. Holocene 2003, 13, 933–940. [Google Scholar]
  54. Ge, Q.S.; Guo, X.F.; Zheng, J.Y.; Hao, Z.X. Meiyu in the middle and lower reaches of the Yangtze River since 1736. Sci. Bull. 2008, 53, 107–114. [Google Scholar] [CrossRef]
  55. Zhou, X.; Zhao, P.; Liu, G. Asian-Pacific Oscillation index and variation of East Asian summer monsoon over the past millennium. Chin. Sci. Bull. 2009, 54, 3768. [Google Scholar] [CrossRef]
  56. Tan, L.; Cai, Y.; An, Z.; Yi, L.; Zhang, H.; Qin, S. Climate patterns in north central China during the last 1800 yr and their possible driving force. Clim. Past 2011, 7, 685–692. [Google Scholar] [CrossRef] [Green Version]
  57. Maher, B.A. Holocene variability of the East Asian summer monsoon from Chinese cave records: A re-assessment. Holocene 2008, 18, 861–866. [Google Scholar] [CrossRef]
  58. Wei, W.; Zhang, R.; Wen, M.; Yang, S. Relationship between the Asian westerly jet stream and summer rainfall over Central Asia and North China: Roles of the Indian monsoon and the South Asian High. J. Clim. 2017, 30, 537–552. [Google Scholar] [CrossRef]
  59. Sinha, A.; Berkelhammer, M.; Stott, L.; Mudelsee, M.; Cheng, H.; Biswas, J. The leading mode of Indian Summer Monsoon precipitation variability during the last millennium. Geophys. Res. Lett. 2011, 38, L15703. [Google Scholar] [CrossRef] [Green Version]
  60. Bard, E.; Raisbeck, G.; Yiou, F.; Jouzel, J. Solar irradiance during the last 1200 years based on cosmogenic nuclides. Tellus. B 2000, 52, 985–992. [Google Scholar] [CrossRef]
  61. Shindell, D.T.; Schmidt, G.A.; Mann, M.E.; Rind, D.; Waple, A. Solar forcing of regional climate change during the Maunder Minimum. Science 2001, 294, 2149–2152. [Google Scholar] [CrossRef] [Green Version]
  62. Anet, J.G.; Muthers, S.; Rozanov, E.V.; Raible, C.; Stenke, A.; Shapiro, A.I.; Brönnimann, S.; Arfeuille, F.X.; Brugnara, Y.; Beer, J. Impact of solar versus volcanic activity variations on tropospheric temperatures and precipitation during the Dalton Minimum. Clim. Past 2014, 10, 921–938. [Google Scholar] [CrossRef] [Green Version]
  63. Yamada, K.; Kohara, K.; Ikehara, M.; Seto, K. The variations in the East Asian summer monsoon over the past 3 kyrs and the controlling factors. Sci. Rep. UK 2019, 9, 5036. [Google Scholar] [CrossRef]
  64. Liu, H.Y.; Lin, Z.S.; Qi, X.Z.; Li, Y.X.; Yu, M.T.; Yang, H.; Shen, J. Possible link between Holocene East Asian monsoon and solar activity obtained from the EMD method. Nonlinear Proc. Geoph. 2012, 19, 421–430. [Google Scholar] [CrossRef] [Green Version]
  65. Zhao, L.; Wang, J. Robust response of the East Asian monsoon rainband to solar variability. J. Clim. 2014, 27, 3043–3051. [Google Scholar] [CrossRef]
  66. Chen, J.; Sun, B.; Chen, D.; Wu, X.; Guo, L.; Wang, G. Land Use Changes and Their Effects on the Value of Ecosystem Services in the Small Sanjiang Plain in China. Sci. World J. 2014, 2014, 7. [Google Scholar] [CrossRef] [Green Version]
  67. Yan, R.; Gao, J.; Li, L. Modeling the hydrological effects of climate and land use/cover changes in Chinese lowland polder using an improved WALRUS model. Hydrol. Res. 2016, 47, 84–101. [Google Scholar] [CrossRef] [Green Version]
  68. Zhang, C. Water Yield of Xitiaoxi River Basin Based on InVEST Modeling. J. Resour. Ecol. 2012, 3, 50–54. [Google Scholar]
  69. Zhou, W.; Liu, G.; Pan, J.; Feng, X. Distribution of available soil water capacity in China. J. Geogr. Sci. 2005, 15, 3–12. [Google Scholar] [CrossRef]
  70. Goldstein, J.H.; Caldarone, G.; Duarte, T.K.; Ennaanay, D.; Hannahs, N.; Mendoza, G.; Polasky, S.; Wolny, S.; Daily, G.C. Integrating ecosystem-service tradeoffs into land-use decisions. Proc. Natl. Acad. Sci. USA 2012, 109, 7565–7570. [Google Scholar] [CrossRef] [Green Version]
  71. Donohue, R.J.; Roderick, M.L.; McVicar, T.R. On the importance of including vegetation dynamics in Budyko’s hydrological model. Hydrol. Earth Syst. Sci. Discuss. 2006, 3, 1517–1551. [Google Scholar] [CrossRef] [Green Version]
  72. Aduah, M.S.; Jewitt, G.P.; Warburton Toucher, M.L. Assessing suitability of the ACRU hydrological model in a rainforest catchment in Ghana, West Africa. Water Sci. 2017, 31, 198–214. [Google Scholar] [CrossRef] [Green Version]
  73. Zhang, L.; Karthikeyan, R.; Bai, Z.; Wang, J. Spatial and temporal variability of temperature, precipitation, and streamflow in upper Sang-kan basin, China. Hydrol. Process. 2017, 31, 279–295. [Google Scholar] [CrossRef]
  74. Hughes, D.A. Hydrological modelling, process understanding and uncertainty in a southern African context: Lessons from the northern hemisphere. Hydrol. Process. 2016, 30, 2419–2431. [Google Scholar] [CrossRef]
  75. Zhou, D.; Tian, Y.; Jiang, G. Spatio-temporal investigation of the interactive relationship between urbanization and ecosystem services: Case study of the Jingjinji urban agglomeration, China. Ecol. Indic. 2018, 95, 152–164. [Google Scholar] [CrossRef]
  76. Zhang, H.; Cheng, J.; Wu, Z.; Li, C.; Qin, J.; Liu, T. Effects of impervious surface on the spatial distribution of urban waterlogging risk spots at multiple scales in Guangzhou, South China. Sustainability 2018, 10, 1589. [Google Scholar] [CrossRef] [Green Version]
  77. Flörke, M.; Schneider, C.; McDonald, R.I. Water competition between cities and agriculture driven by climate change and urban growth. Nat. Sustain. 2018, 1, 51–58. [Google Scholar] [CrossRef]
  78. Ge, J. Chinese Population History; Fudan University press: Shanghai, China, 2005. [Google Scholar]
  79. Ge, Q.; Dai, J.; He, F.; Zheng, J.; Man, Z.; Zhao, Y. Spatiotemporal dynamics of reclamation and cultivation and its driving factors in parts of China during the last three centuries. Prog. Nat. Sci. 2004, 14, 605–613. [Google Scholar] [CrossRef]
  80. He, F.; Ge, Q.; Dai, J.; Lin, S. Quantitative Analysis on Forest Dynamics of China in Recent 300 Years. Acta Geogr. Sin. 2007, 62, 30–40. [Google Scholar] [CrossRef]
  81. Statistics Bureau of Jiangxi Province. Jiangxi Statistical Yearbook; China Statistics Press: Beijing, China, 2018. [Google Scholar]
  82. Wan, A.; Wang, J.; Wu, K. Temporal and Spatial Characteristics and Driving Factors of Forest Land Change in Jiangxi. J. Anhui Agric. Sci. 2019, 47, 128–131. [Google Scholar]
  83. Chu, X. Analysis of environmental status and construction trend of ecological civilization in the pioneer demonstration zone of ecological civilization in Jiangxi Province. Environ. Dev. 2019, 31, 195–196. [Google Scholar]
  84. Zhao, S.; Lu, J.; Zhang, H.; Zeng, Y.; Qi, W.; Liang, Z.; Zhang, T.; Liu, G.; Qin, M.; Jiang, L. Population, consumption, and land use in the Jitai basin region, Jiangxi Province. In Growing Populations, Changing Landscapes: Studies from India, China, and the United States; Gordon, W., Ed.; National Academy Press: Washington, DC, USA, 2001. [Google Scholar]
Figure 1. Location map of the study area and representative stations of a small basin.
Sustainability 12 01168 g001
Figure 2. Piece of local chronicle pressed in AD 1753 (Emperor Qianlong 18th year) in Qing dynasty. This chronicle contains a flood strike record of the Ganjiang River in Taihe County, Jian prefecture that caused huge famine subsequently in AD 1704 (blue section). It also contains a drought-strike record in AD 1743 (red section), resulting in food shortage and causing people to overcome their hunger by eating some kind of soil.
Sustainability 12 01168 g002
Figure 3. The processing flow of principal component regression (PCR).
Sustainability 12 01168 g003
Figure 4. Workflow of overall reconstruction.
Sustainability 12 01168 g004
Figure 5. Precipitation reconstruction series of five representative stations from 1500 to 2014. (The x-axis represents the year, and the y-axis unit is mm).
Sustainability 12 01168 g005
Figure 6. Correlation of observed and reconstructed streamflow of the Ganjiang River.
Sustainability 12 01168 g006
Figure 7. Streamflow reconstruction for the Ganjiang River from 1500 to 2014. The red line shows 11year running mean values, and the blue line shows one standard deviation.
Sustainability 12 01168 g007
Figure 8. Statistics on the frequency distribution and kernel density curve of gauged streamflow (A) and reconstructed streamflow (B).
Sustainability 12 01168 g008
Figure 9. Accumulated anomaly and Mann-Kendall test results.
Sustainability 12 01168 g009
Figure 10. Redfit power spectrum of reconstructed Ganjiang River streamflow variations from 1500 to 2014, and the gray and red lines indicate 99% and 95% confidence levels, respectively.
Sustainability 12 01168 g010
Figure 11. Phase modal variation (A) and wavelet coefficient of reconstructed streamflow and ENSO index (B).
Sustainability 12 01168 g011
Figure 12. Comparison of Ganjiang River streamflow (A) and dry–wet index (B) [52], temperature in Eastern China (C) [53], East Asian Monsoon Index (D) [55], oxygen isotope (E) [59], and TSI (F) [60].
Sustainability 12 01168 g012
Figure 13. P-III hydrological frequency curve for the past 515 years.
Sustainability 12 01168 g013
Figure 14. Comparison of reconstructed Ganjiang River streamflow from 1500 to 1950 (A) and Jiangxi province population (B) [78], cropland (C) [79], forest cover rate (D) [80].
Sustainability 12 01168 g014
Figure 15. Comparison of gauged Ganjiang River streamflow from 1955 to 2014 (A) and Jiangxi province population (B) [81], cropland (C) [81], forest cover rate (D) [82], urbanization rate (E) [81], population in Jitai basin (F) [84], cropland in Jitai basin (G) [84], forest area in Jitai basin (H) [84].
Sustainability 12 01168 g015
Table 1. Historical materials on drought and flood disaster and grade standard.
GradeStandardText Description Classification
1 (drought)timelong durationdrought that usually lasts for several months; lake dries up because of drought; extensive plant death because of drought; people starve to death; locust disaster; no grain harvest.
spacelarge range
phenomenonsevere disaster
2 (slight drought)timeshort durationsingle season or single month drought; land rent exemption because of drought; general drought; people are hungry, but remained in their hometown.
spacesmall range
phenomenonless severe
3 (normal)--no record of droughts or floods this year; grain harvest; good weather for the crops; favorable weather.
4 (slight flood)timeshort durationless severe flooding in a single month; general flood; no description of waterlogging and only recorded dry in a certain month; exemption of land rent exemption because of flood.
spacesmall range
phenomenonless severe
5 (flood)timelong durationlong and intense precipitation; deep water on the ground; serious damage to crops, animals, and dams caused by floods; floods did not occur in many years.
spacelarge range
phenomenonsevere disaster
Table 2. Regression analysis of drought flood grade and precipitation from 1955 to 2014.
StationModel *rr2F-StatisticsSig.
1Ganzhouy = 211.227x + 788.2600.7920.62797.3790.000
2Jiany = 202.327x + 888.0530.8630.746169.9460.000
3Nanchangy = 246.008x + 851.0140.8760.767190.7780.000
4Gaoany = 150.896x + 1113.2050.7230.52263.3600.000
5Yichuny = 173.246x + 1086.4550.8440.712143.6500.000
* x denotes drought/flood grade, and y denotes gauged precipitation.

