1. Introduction
Overweight and obesity is a major concern in the world today. It is estimated that in 2016, 39% of adults worldwide were overweight, 13% of adults were suffering from obesity, and more than 18% of children and adolescents between 5 and 19 years old were obese [
1] (World Health Organization, 2018). Sugar-sweetened beverages (SSB) are drinks with added sugar including: non-diet soft drinks/sodas, flavored juice drinks, sports drinks, sweetened tea, coffee drinks, energy drinks, and electrolyte replacement drinks. SSBs can lead to health risks including overweight and obesity, tooth decay, heart disease, and type 2 diabetes [
2] (World Health Organization, 2015). So far, around 40 countries and territories have levied some specific tax policy on SSB in order to increase the price and then reduce the consumption of this kind of beverage [
3] (Global Food Research Program, 2018). Curbing the overweight and obesity epidemic will help to guarantee good public health, which is one of the Sustainable Development Goals (SDGs) proposed by the United Nation.
As a poor country, which had been severely destroyed by war, Vietnam has rapidly developed. In 2018, the poverty rate was only 6.8% [
4] (General Statistics Office, 2018) in comparison to 58% in 1993 and 75% in 1990 [
5] (Kozel 2014). Parallel with successful economic achievements, Vietnam is also faced with the issue of increasing overweight and obesity, particularly among children and adolescents in urban areas. According to a survey conducted by the Ministry of Health, the ratio of Vietnamese adults (18 to 69 years old) who are suffering from overweight and obesity (Body Mass Index—BMI ≥ 25) is 15.6%, of which 14.9% are men and 16.9% are women). The rising trend was also observed among children and adolescents, with the prevalence of overweight and obesity among both genders increasing from 2.6% in 2002 to 9.7% in 2016 [
6] (the Department of Preventive Medicine, 2017). In big cities, such as Hanoi and Ho Chi Minh city, the ratio of children and adolescents who are suffering from overweight and obesity was 43% in 2009, which increased from 12% in 1996. In 2014–2015, this ratio in the inner area of Ho Chi Minh city was 50% and a recent survey in the inner area of Hanoi showed that it was up to 40.7% [
7] (Hanoi Health Department, 2017).
According to the current law on the excise tax of Vietnam, an excise tax is a tax that is applicable on specific goods and services that (i) are not encouraged due to their bad effects on health, (ii) are normally consumed by high-income consumers in the society, and/or (iii) are unnecessary services [
8] (National Assembly, 2008). The current law on excise tax applies mostly to alcohol products, cigarettes, and expensive goods and services, such as planes, cruise boats, and cars.
As an effort to improve the people of Vietnam’s health, the Ministry of Finance had proposed an amended excise tax, applicable on SSB with the proposed tax rate of 10% [
9] (Ministry of Finance 2017). The rationale for the government to expand the excise tax on SSB is the high amount sugar, which is one of the reasons for overweight and obesity in Vietnam and around the world. Added to that, imposing an excise tax on SSB is a new trend in the world and is being strongly encouraged by international health organizations, such as the World Health Organization. Yet, the proposed draft tax law was strongly opposed by the soft drink industry. By the time of this writing (late 2019), the draft law has not been submitted to the National Assembly for approval yet.
Previous studies on the impacts of SSB tax yield mostly positive results. Griffith et al. (2019) [
10] reviewed the evidence on SSB effects from 27 studies of taxes in 11 jurisdictions and found that, in most studies, the taxes have resulted in reductions in purchases of taxed drinks. The largest effects were in Philadelphia, where the tax is fully passed through to prices. In Mexico, which has been the focus of multiple studies, SSB tax led to reductions in purchases of taxed beverages in most studies. Colchero et al. (2016) [
11] uses actual data after a one-year implementation of the SSB tax in Mexico and showed a decrease in SSB consumption, particularly among the poorest groups. Aguilar et al. [
12] (2018) found that the purchased liters of sugary drinks decreased by 6% after 2 years of implementation in Mexico.
There is also a shift from SSB to healthier items. Martos et al. (2015) [
13] found that, in Hungary, many consumers substitute SSB with healthier products, such as mineral water, fruit and vegetable drinks, and green herbs and spices. As a result, the tax could help induce a reduction in the overweight and obesity prevalence. Smith et al. (2010) [
14] estimate that a 20% price tax-induced increase on caloric sweetened beverages could lead to a decline in adult overweight prevalence from 66.9% to 62.4% and obesity prevalence from 33.4% to 30.4%, as well as the child at-risk-for-overweight prevalence (32.3% to 27.0%) and the overweight prevalence (16.6% to 13.7%) in the USA.
The impacts of the tax are found unevenly among socioeconomic groups. For example, in France, the change in behaviors regarding to the tax is more apparent among young people, households that have adolescents, and lower income groups (World Health Organization, 2016). In Hungary, overweight and adolescent adult are more likely to change their behavior based on targeted products than others (Martos et al., 2015) [
13]. In Mexico, Aguilar et al. (2018) [
12] showed that households with higher incomes are affected most, while Colchero et al. (2016) [
11] showed that the poorest group has the largest impacts.
While theoretically attractive, the implementation of the SSB tax in practice could be less effective than expected. In Denmark, the authorities even had to abandon their “fat tax policy” due to several disadvantaged consequences. The tax policy was said to be ineffective because it was not enough to make consumers change their consumed habits. They could easily switch to cheaper products or do cross-shopping. In addition to this, the administrative cost was too high (10% of the tax revenue) and led to a loss of 1300 jobs in the shrinking SSB sector (Snowdon, 2013 [
15]).
Although the proposed amended excise tax on SSB may have profound impacts on SSB consumption, health conditions, and tax revenues in Vietnam there have been very few studies on the tax impacts. Nguyen (2014) [
16] is one of the few studies that estimates the impact of this tax proposal. His model is based on the regression model, as shown below:
where,
represents the quantity demanded of SSB,
represents the price, and
represent the control variables. Using monthly volumes and values of soft drinks sold in the market of the six largest cities and provinces, including Hanoi, Ho Chi Minh city, Da Nang, Can Tho, Hai Phong, Nha Trang, from 2007 to 2013, the author shows that carbonated soft drinks were sensitive to price with its price elasticity at −2.8. Taxing 10% on SSB would results in a 12.1 million dollar decrease in GDP and an 8.46 million dollar increase in government revenue, whereas the soft industry revenue might lose 40.5 million dollars. The model is simplified and is not based on a complete demand system. Furthermore, data coverage is in selected cities and not nationwide.
To our knowledge, the only other study on SSB tax is Phong and Thai (2017) [
17] who use the Almost Ideal Demand System (AIDS) model to estimate the owned-price elasticity of SSB. Their results imply an SSB elasticity of −2.8, close to Nguyen (2014) [
16], despite using different methods. While interesting, their study is limited to only calculating the elasticities, without referring to consumption or the welfare impacts of the SSB tax. Furthermore, it was published in Vietnamese in a local university magazine, which limits its readership.
This study has two major objectives: estimating demand elasticities for SSB and evaluating the impacts of a proposed SSB tax on consumption and welfare in Vietnam. This study contributes to the literature in several aspects. Firstly, most previous studies focus on developed countries, with the notable exception of Mexico, a developing but upper-middle-income country. Therefore, our study will contribute to the understanding of the SSB tax in the developing world, where consumption demand is more resource-binding. Secondly, we estimate the welfare impacts of the SSB tax not only on the general population but on different socioeconomic groups based on characteristics such as ethnicity, income, and geography. Thirdly, we use the most recently available household dataset of 2016 that is representative nationwide.
The structure of our study is as follows:
Section 2 discusses the methodology and data.
Section 3 presents the findings on elasticities and the welfare impacts of the taxation. Finally,
Section 4 concludes our study.
2. Methodology and Data
2.1. Methodology
Our study uses the Almost Ideal Demand System (AIDS) model, introduced by Deaton and Muelbauer (1980) [
18] to estimate the elasticities of SSB. Based on the estimated elasticities, we calculate the welfare effect of the new tax proposal. The biggest advantage of the AIDS model is its automatic satisfaction to demand function restrictions, including adding-up, homogeneous restrictions, and Slutsky symmetry restrictions.
Theoretically, the system has the below form:
In which
refers to a price index that is calculated by below function:
The most important advantage of this system was its “flexibility” and its satisfaction of aggregation across consumers. The AIDS was said to automatically meet with three restrictions of a demand function (Moschini 1995 [
19]; Vu 2008 [
20]):
• Homogeneous restriction:
• Slutsky symmetry restriction:
In this study, we used the maximum-likelihood estimation method introduced by Ray (1983):
where
and
run from 1 to k corresponding to k items that were considered. In this research, there were 8 items, including sugar
, candy
, fresh milk
, wine
, beer
, bottle beverages
, powered coffee
, and tea
.
The dependent variable (
) denoted the proportion of the consumed value of item
ith over all covered items. The independent variable (
) denoted the average price of item
ith, which was consumed by the household. We also have:
where
was a matrix of parameters, which was also known as equivalent scale and corresponded to household characteristics (vector
). In this study, there were 12 household characteristics that would be mentioned in the next part. The equivalent scale theoretically converted households with different contexts into a general unit, based on a general household. This scale had an important meaning in welfare economics as well as public policy in terms of equity, justice, and resource relocation (Ray, 1983 [
21]).
And
was a trans-log function as mentioned above:
By estimating the above system, this research would be able to measure approximately the compensated price elasticity, uncompensated price elasticity, and expenditure elasticity for item ith.
Marshallian owned-price elasticity of food item
i:
The Marshallian cross-price elasticity of food item
i with respect to the price of food item
j:
The expenditure elasticity of food item
i:
The Hicksian price elasticity is estimated from the Slutsky equation:
After estimating the elasticities, we stimulate a 10% tax on SSB. The welfare change to consumers are estimated using the compensating variation (CV) measure, reflecting the “compensations” to consumers so that they can reach their initial utility after a change in prices. We utilize the estimated Hicksian elasticities to implement the CV, as is usual in the literature (Vu & Glewwe 2011 [
22]).
In terms of the expenditure (cost) function:
The CV can be approximated using a second order Taylor expansion of the minimum expenditure function as:
Equation (15) indicates that the impact of a price change upon a household is a function of both the magnitude of the price change and the relative importance of different food items. The first order effect is proportional to quantity consumed. The second order effect depends on the compensated price elasticity.
2.2. Data
For the data, we use the Vietnam Household Living Standard Survey (VHLSS) 2016, collected by Vietnam’s General Statistics Office (GSO). VHLSS was a nation-wide survey in Vietnam that was collected every two years by GSO, in order to inquire information about income, expenditure, as well as other living conditions of Vietnamese households.
There were 46,995 households being interviewed in 2016, in which 37,596 households being asked about income solely (income household—IH) and other 9399 households being inquired on income and expenditure information (income and expenditure household—IEH) [General Statistics Office, 2018b]. As a requirement of necessary variables, this research would utilize data from 9399 IEHs.
There are eight food items that were under consideration, including sugar, candy, fresh milk, wine, beer, soft drinks, powered coffee, and dry tea. This study focused on SSB, so its main concern was soft drinks, which was defined as all bottled beverages in the market, such as carbonated drinks, juice, energy drinks, and fresh water, excluding instant tea and coffee. Unfortunately, this research could not extract fresh water from other sugary drinks.
This study followed a three-step procedure in processing data to estimate the consumption impacts of excise tax on SSB. Firstly, the necessary data would be extracted from the VHLSS 2016 dataset. There were two main groups of figures, the number and the amount of money that households spent on SSB and other household characteristics that might affect to their consumption. Secondly, these variables would be given into an AIDS model in order to estimate the income, as well as the compensated and uncompensated price elasticity of SSB. Finally, the research would analyze the dataset and result of the AIDS model to give some policy implications.
In order to estimate the AIDS by using VHLSS 2016, eight food items were added into the model, including sugar, candy, fresh milk, wine, beer, instant coffee, dried tea, and soft drinks. These goods are selected because they are considered close substitutes to SSB.
For the price of each item, VHLSS did not survey the actual price of each food item, so, in this research, the price of item
ith (
) will be seen as the average price of that item in case of positive consumption. The function was calculated as follows:
However, because not all households consumed all the items in the selected basket, i.e., in case of zero consumption, the price of item ith was replaced by the median value of in the district. If the median value of by district were unable to be calculated, it was replaced by the median value of in the province.
3. Empirical Results
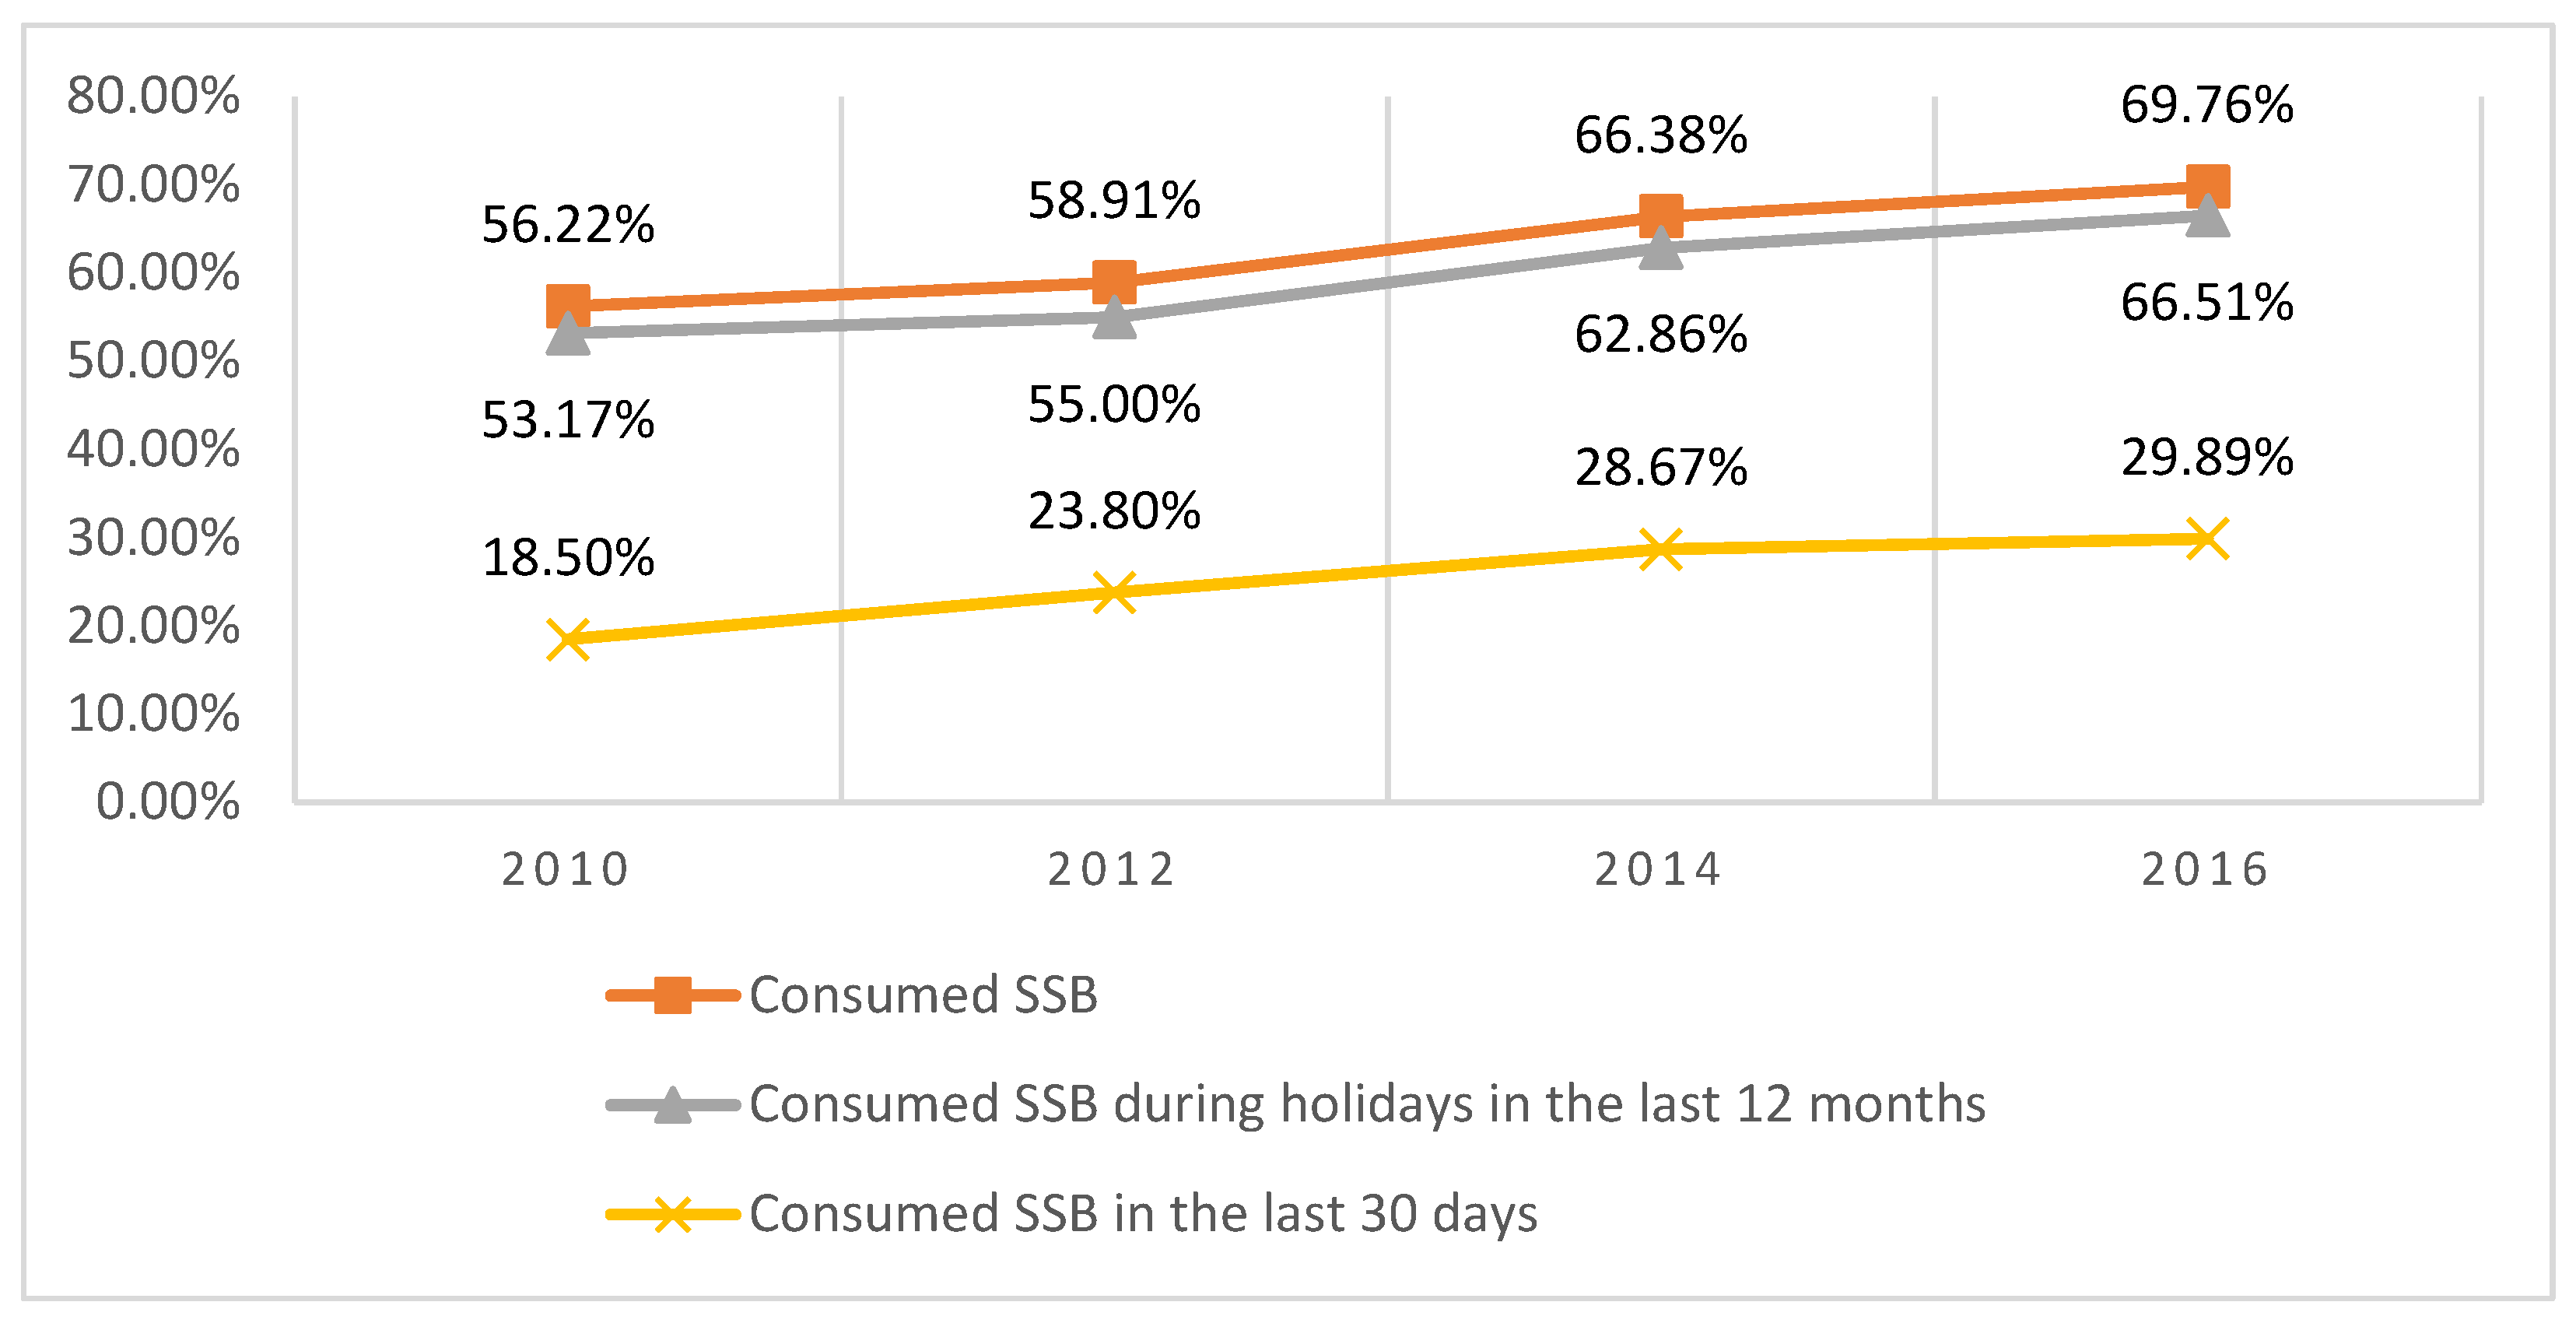
Figure 1 indicates the change in the consumption habits of households from 2008 to 2016 using the all rounds of VHLSS from 2008 to 2016. Undoubtedly, the consumption of SSB has increased gradually year by year. Until 2016, nearly 70% of the sample said that they had consumed SSB. However, most of them consumed this item in special occasions like the Lunar New Year holiday. That number, in daily life, was quite low, only nearly equaling half of the above occasions. Nevertheless, all figures were increasing.
We estimate the AIDS model using control variables for living area, ethnicity, household size, the quintile of expenditure, the number of children, and five dummy variables for regions. The system was run for two samples, the first one was the full sample (n = 9382) after eliminating some household with missing data, and the other sample only considered the SSB consumer (n = 6557).
Table 1 shows the estimated elasticities for eight food items:
The results show that, for the full sample, the expenditure elasticity of all food items is positive, which means that if total expenditure increases by 1%, the expenditure for all items will follow. This trend is quite suitable for consuming theory. In particular, the expenditure elasticity of SSB was approximately 0.96, which means that if the total expenditure of a household increases by 1%, the budget for SSB will increase by 0.96%. This rate is quite high in comparison to a necessary commodity like sugar (0.31), another sugar-containing product. Candy (0.72) and wine (0.94) were lower than other beverage products, such as dried tea (1.03), powered coffee (1.28), beer (1.34), and fresh milk (1.63).
The Hicksian own-price elasticity of all products was negative, which means that when the price of any item increases, the expenditure for it will decline, but the level of decreasing is different., SSB’s absolute value of Hicksian own-price elasticity (1.14) is the highest in comparison to the others and is the only one higher than 1. The result pointed out that if the price of SSB increased by 1%, the consuming amount of each household would decrease by more than 1%, at 1.14%. Supposing that the new tax policy was implemented with a tax rate of 10%, the households would cut down their budget for SSB by 11.4%. Additionally, if the tax rate was doubled, the outcome could be doubled too, which shows that the new tax policy may be effective in term of declining the level of SSB consuming.
However, as can be seen from the cross-price elasticity of SSB with respect to the price of other items, all of them were positive, which means that they are all substitute goods of SSB. A 10% SSB tax will lead to a rise in the consumption of other sugar-related items, such as sugar (0.7%) and candy (1.6%). In addition to this, consumers will switch to other substitutes, leading to an increase in consumption at 2.3% for fresh milk, 2.5% for beer, 2.2% for dried tea, 1.7% for wine, and 0.4% for powered coffee. In another word, the budget for all items can be re-distributed to several items once the new tax policy is imposed.
Focusing on the group of SSB consumers, the result shows that the SSB expenditure elasticity of this group is much lower than in the full sample, 0.62 in comparison to 0.96. This level of elasticity is only higher than sugar (0.43) and is lower than all other items. However, if there were an increase in price by 1%, SSB would still cut down the budget for SSB at 1.13%. This level of Hicksian own-price elasticity is still the highest among the eight food items and, despite being lower than the whole sample, the gap is not so much. Therefore, if the Vietnamese government decided to implement the excise tax policy on SSB, the group of SSB consumers might significantly decline their expenditure on this kind of beverage. Nevertheless, in relation to the response of other products, the SSB consumer will increase their expenditure for all other food items, including sugar-containing products, like candy, and unhealthy beverages, like wine and beer, because of positive cross-price elasticity.
3.1. SSB Elasticities of Different Socioeconomic Groups
The reaction of households to the changes in price will be diverse due to the differences in their characteristics. In this part, the AIDS model is estimated on a separate group of households for measuring the consequences of the new tax policy on each of them. There were six groups under consideration, including urban/rural are, ethnic minorities or majority, the number of children, the quintile, the region, and the time of consumption.
Table 2 shows the results of SSB elasticities estimated for different socioeconomic groups.
There is a slight difference between the elasticities of SSB consumer in rural and urban area. Relating to the percentage of SSB consumers, this ratio in urban areas (80.1%) is higher than that in rural areas (65.5%), which means that citizens living in urban areas are more likely to consume SSB than those living in other areas. Additionally, if there was a shock in the total expenditure of households, the one who was living in the rural area would react more strongly because of the higher expenditure elasticity (1.03 in comparison to 0.84). Regarding uncompensated and compensated elasticity, both groups (rural and urban) have a negative value, which is explainable by the increasing price, but the absolute values of rural areas are lower than urban areas. Assuming that the price of SSB increased by 10% because of the new tax policy, the household living in urban areas would decline their consumption by 12.3% in comparison to the ratio of 11.2% of rural areas. In the context of higher SSB consumer percentages and higher ratios of people who are suffering from overweight and obesity in urban areas, this result shows that the tax policy seems to be effective in achieving its objective, which is said to solve the problem of rising levels of overweight and obesity.
It is obvious that the percentage of SSB consumers with the ethnic majority (72.4%) is higher than the ethnic minorities (57.6%). Looking at the compensated elasticity of both groups, the figure shows that the majority will response to a new tax policy in a stronger way due to its higher absolute value (1.18 in comparison to 1.02). However, like the case of urban and rural areas, the income effect in the minorities is more significant than the other one, whereas, the uncompensated elasticity of the majority is higher than the minority.
The result shows that a relationship between the number of children in the household and the percentage of SSB consumers in each group may exist. The biggest proportion of SSB consumers is the household that has only one child (76.1%). And then, the proportion gradually decrease when the number of children in the household increases. The proportion of SSB consumers decrease significantly when the household has the fourth child, just 57.8% in comparison to 72% of the household that has three children. Then, if the number increases, the percentage of SSB-consuming households will decline further to 52.1% of households. For the households that do not have children, the percentage of SSB-consuming households is 62.6%, lower than the one with three children but higher than the one with more than 3 children.
Looking at the elasticity data, it is easy to see that if the government decided to impose an excise tax on SSB, the household with more than four children would react strongest to the policy because of the highest compensated elasticity (1.31). The household with no children will also significantly decreases their consumed SSB amount (1.23). The compensated elasticities of other households with one to four children are quite similar and fluctuated from 1.11 to 1.15. However, if we look at the expenditure elasticity of these household groups, it could be noticed that the group with no children is affected most by the income effect, which means that if the total expenditure of household increases by 1%, the expenditure for SSB will rise by 1.07%, whereas, the other groups only increase their budget for SSB by less than 1%.
As can be seen from the above figure, the percentage of SSB consumers in each expenditure quintile gradually increased from the lowest level (53.2%) to the highest level of expenditure (81.2%). In contrast, the absolute value of elasticities declined from low to the high. The result shows that all households will save their budget for SSB if the new tax policy is imposed, and the household in the lowest quintile will be affected most by this decision.
Consuming behaviors in different geographical regions, including the taste for sweetened products may differ because of differences in culture or climate features. In Vietnam, it can be seen from the figure that the percentage of SSB consumers in each region varies from north to south, in which region in the north, Midlands, and Northern Mountains have the lowest proportion (56.4%). Then, the ratio increases from north to south. The region that has the highest proportion is the South East (85.4%). It is easy to explain this by the differences in nature conditions. In the north, there are 4 seasons, spring, summer, autumn, and winter, whereas in the south it is thought to be hot throughout the year, which pushes consumers to spend more on beverages. Additionally, the midlands and the Northern Mountains are mountainous areas with relatively cool weather, but it is also the poorest region, with 13.8% of households rated poor (General Statistics Office, 2018)—the highest rate among six regions in Vietnam. Therefore, they may not be able to spend money on leisure commodities like soft drinks. In contrast, the South East region has the lowest rate of poor households (0.6%) (General Statistics Office, 2018) and the weather here is quite hot. However, the Central Highlands, the second poorest region in Vietnam, also contributes a high percentage of SSB consumers (79.4%), rank second among six regions.
The differences in climate also lead to the alteration in SSB elasticities. The region that has lowest percentage of SSB consumers—the midlands and the Northern Mountains, also has the lowest SSB compensated elasticity (0.76), which means that if the price of SSB increases by 1%, the consumed amount of SSB only declines by 0.76%. This may be because soft drinks are not a popular commodity here. The second lowest position belongs to Red River Delta (0.89). The compensated elasticity is highest in the Mekong River Delta (−1.24), which means that this is the most sensitive region to the price of SSB. However, the two regions that have the highest percentage of SSB consumer, the South East (85.4%) and the Central Highlands (79.4%), just have average SSB compensated elasticities (−1.09 and −1.05, respectively).
3.2. Simulating the Welfare Effects of SSB Tax
After estimating the compensated elasticity, the research tried to measure the welfare effects of the new tax policy by calculating compensating variation (CV). This number represents for the changes in welfare when changing price but keep the initial utility level.
This research supposed that the new tax policy applying on SSB at 10% will lead to an increasing by 10% in SSB price. In this case, on average, the CV is estimated in
Table 3. The unit value is one thousand VND (Approximately, 20 thousand VND is equivalent to 1 USD).
Table 3 shows that the CV for all samples and the CV for each category are negative, which means that, on welfare aspect, the new tax policy has a bad effect on the consumer. On average, the CV of a consumer will be decline by 27.8 thousand VND.
However, the positive effect of this tax policy is that, the level of decreasing welfare is higher in urban areas (−43.2 thousand VND) and in the majority ethnicity (−29.7 thousand VND) in comparison to rural areas (−21.24 thousand VND) and the minority ethnicity (−19.2 thousand VND), respectively. In addition, the lower the quintile is, the higher welfare is lost. Whereas a household in the lowest quintile may lose 9.2 thousand VND, the highest level one is possibly deprived of 53.8 thousand VND. The result points out that the excise tax policy on SSB is not a regressive tax.
Nevertheless, considering the welfare of households with different numbers of children, the household with two children will lose the biggest welfare (36.6 thousand VND), followed by the household with one (29.6 thousand VND), four (29.1 thousand VND), and three (28.2 thousand VND) children.
Regarding the welfare in the six regions, it is no surprise that the household living in the South East region and the Central Highlands will lose the biggest welfare, 60.5 thousand VND and 46.7 thousand VND, respectively, because of a high percentage SSB consumer. However, the households in the Midlands and the Northern Mountains are not the group that will lose the most welfare—it is the households in the Mekong Delta River that will lose the most, despite having the biggest proportion of SSB consumers there.
In short, losing welfare is inevitable when implementing any policy instrument. With the new tax proposal, the welfare of the whole society will be lost but it also leads to a decrease in their consumed amount of “bad” SSB goods.
After examining the data, we can see that, in Vietnam, despite the trend of increasing of SSB consumers, they normally consume this kind of product on special occasions like the New Year holiday. The number of loyal SSB households is not very high. It can be said that, SSB is not a necessary commodity in Vietnam due to its high own-price elasticity. To be more specific, the AIDS results show that if the price increased by 1%, each household would decrease 1.14% their expenditure on this product. This number is quite high in comparison to other food items and other beverages, which are mostly under 1%. It can be said that the tax policy is quite effective on the consumer orientation of citizens. This outcome also fits with the objective of the tax policy, which is to reduce the consumed amount of SSB so that Vietnam can improve its nutrition status and reduce the overweight and obesity issue. This argument supports to the imposition of an excise tax policy on SSB in Vietnam.
The research has also found out that the SSB consumer is mainly living in an urban area and is part of the majority ethnicity. The SSB tax will impact these objects most strongly rather than another vulnerable side. In addition, there is a close relationship between the expenditure quintile and the consumption of SSB; there are more SSB consuming households in the higher quantile than in the lower quintile. This may be because SSB is normally treated as a leisure beverage but not a necessary commodity, which is usually served on special occasions like the Tet holiday or a family gathering. Therefore, people in the low expenditure quintile rarely consume it in comparison to the higher quintile. Furthermore, regions with different features of the climate and socioeconomy also affect the expenditure choice of households. For example, the poorest regions, like Midlands and Northern Mountains, had the lowest proportion of SSB consumption among the six regions. Whereas, the hottest regions, like the South East or the Central Highlands, had the highest numbers. The households in these places also lose most welfare in comparison to the others. From the above arguments, we can see that, with the purpose of decreasing the consumed amount of SSB, the new tax policy can partly reach its objectives. Those who are most affected by this tax policy will be the households that consumed SSB the most and have a higher own-price elasticity. In addition to this, with the figure of losing welfare, we can see that this tax policy is quite equal to the society in terms of welfare because the one that will lose the most welfare will also be the one who consumed SSB the most.
On the other hand, the research also shows that the number of children in the household also influences SSB-consuming behavior. The households with only one child are more likely to consume SSB than the other, and if the children in the household increase, the percentage of SSB consuming households declines. This phenomenon can be explained by the psychology effects of having the first child, which means that the other family members will give the child as much as they can to show their love. In addition, in comparison to families with more than one child, the family may be able to handle the increased expenditure.
However, it is possible that the tax policy leads to some loss of welfare for the whole society. Despite this, the loss can be offset by improvements in national health, and it should be noted that the ratio of Vietnamese people who are suffering from overweight and obesity is limited compared to other countries. Additionally, the model result also shows that wine, beer, other beverages, and candy are the substitutes for SSB. The switch to alcohol products may lead to unexpected effects on the tax.


