Design for and from Recycling: A Circular Ecodesign Approach to Improve the Circular Economy

Abstract
:1. Introduction
2. Materials and Methods
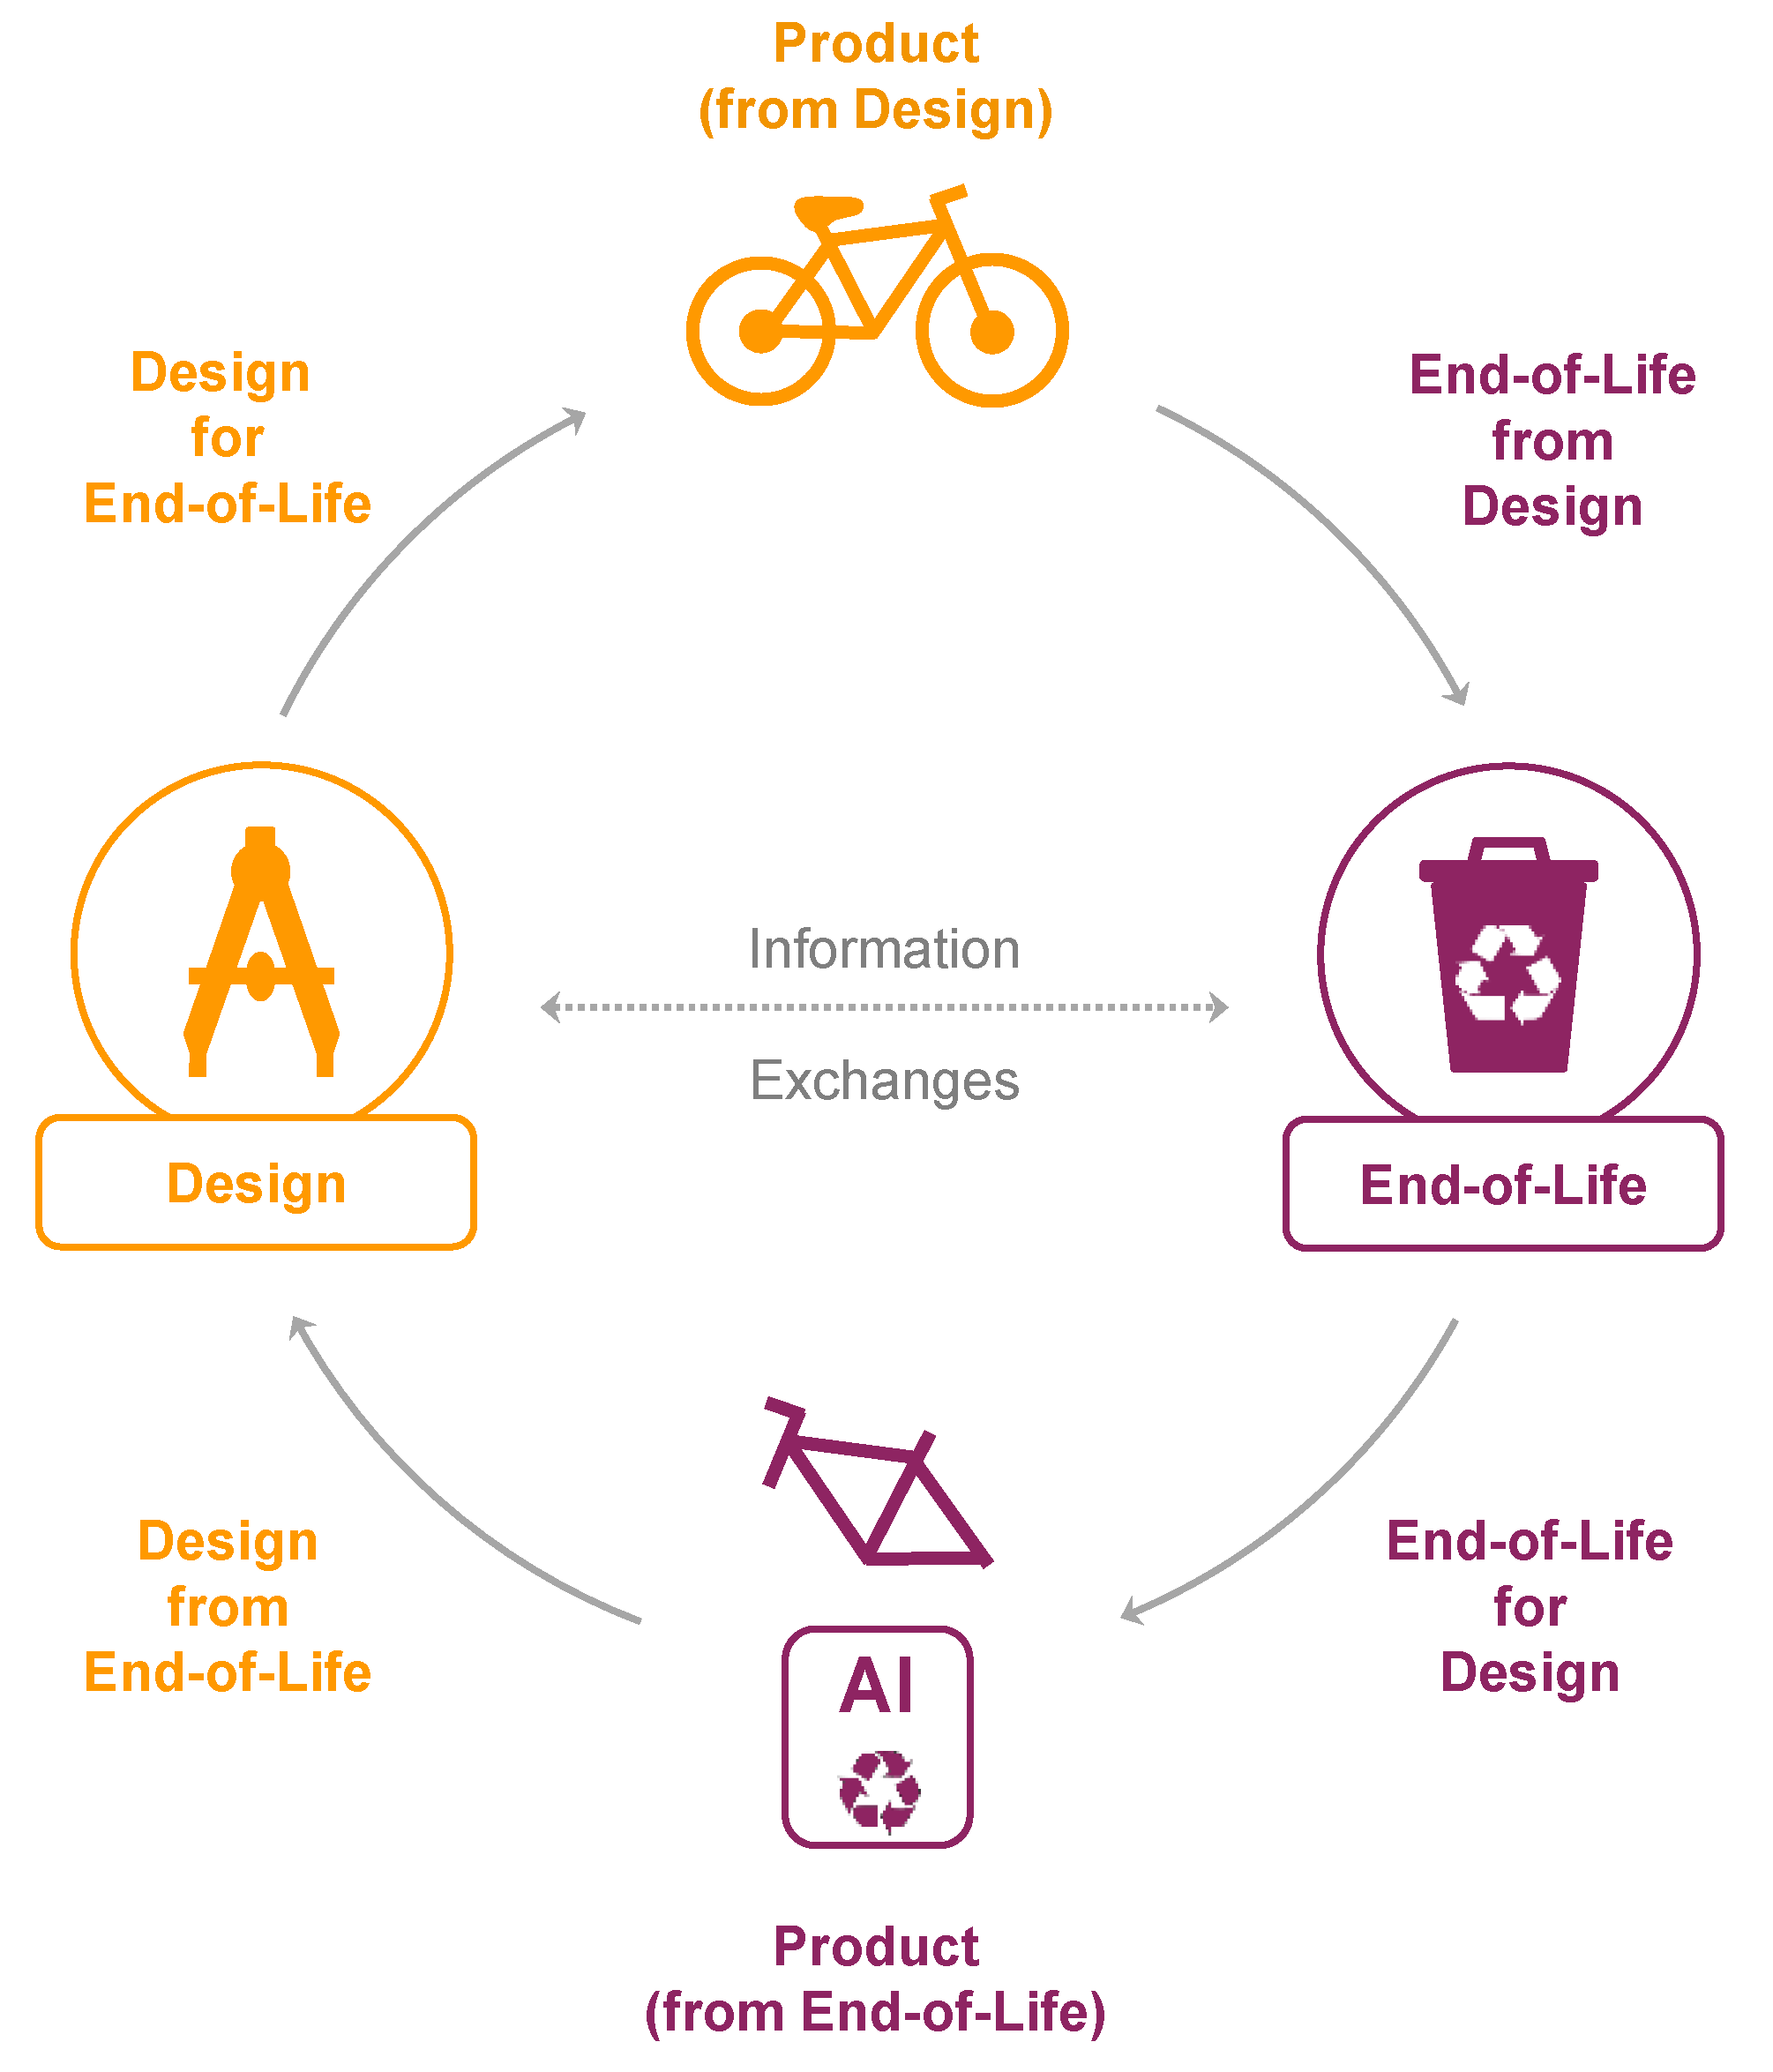
2.1. Re-Cycling: Circularity Management by Both Design and End-of-Life Stakeholders
2.1.1. Product Designers Approaches
- Design for EoL is the most known and the most used. It aims (i) to improve the product so that it can be recovered in the best possible way when it becomes waste and (ii) to promote the elimination of residues that could not be recovered;
- Design from EoL is concerned with the integration of artefacts from the end-of-life treatment chain into a new product (e.g., use of recycled materials instead of virgin ones, reuse of modules or parts extracted during disassembly, etc.).
2.1.2. End-of-Life Stakeholders Approaches
- EoL from design aims to integrate the information accrued from the product design into the operating mode of the chain or its treatment processes to increase the functional, material, and energy recovery;
- EoL for design is concerned with the end-of-life treatment pathway that becomes a supplier of artefacts (i.e., product, module, part, or material from a recovery pathway), which must meet the designer’s specifications.
2.1.3. Focus of the Article
2.2. Design-for-Recycling: Proposition of an Indicator-Based Approach
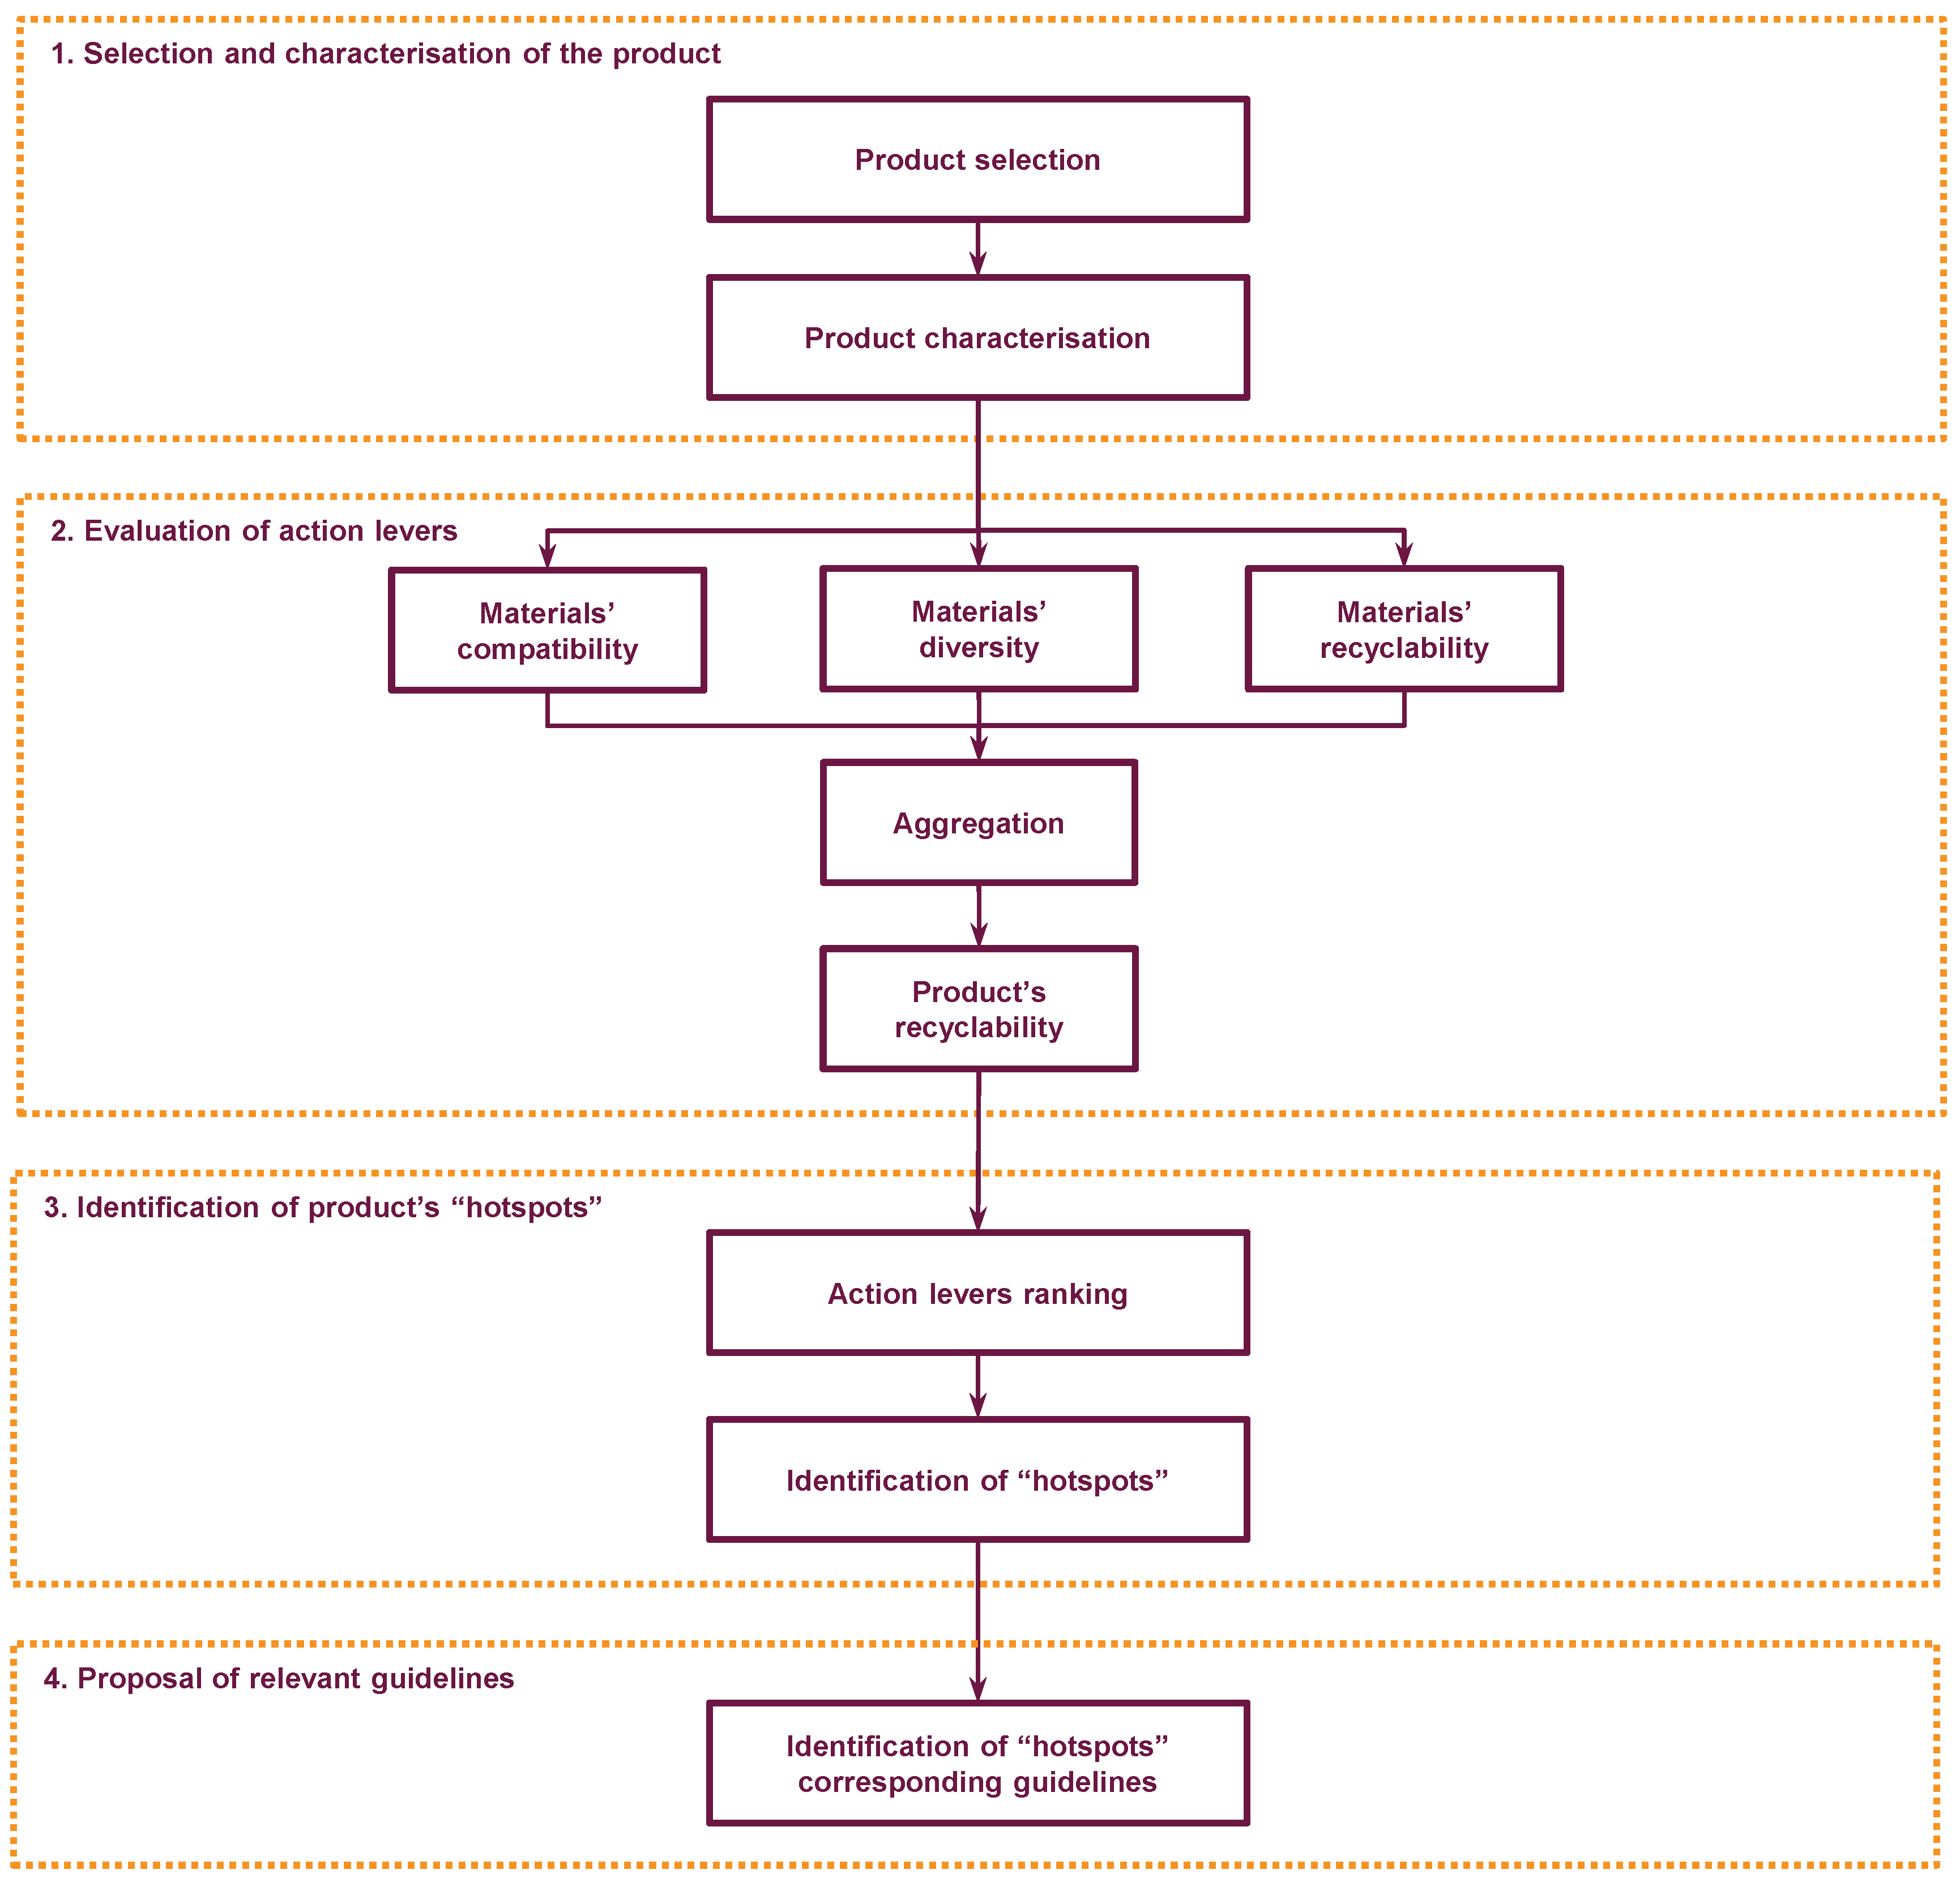
2.2.1. Method Description
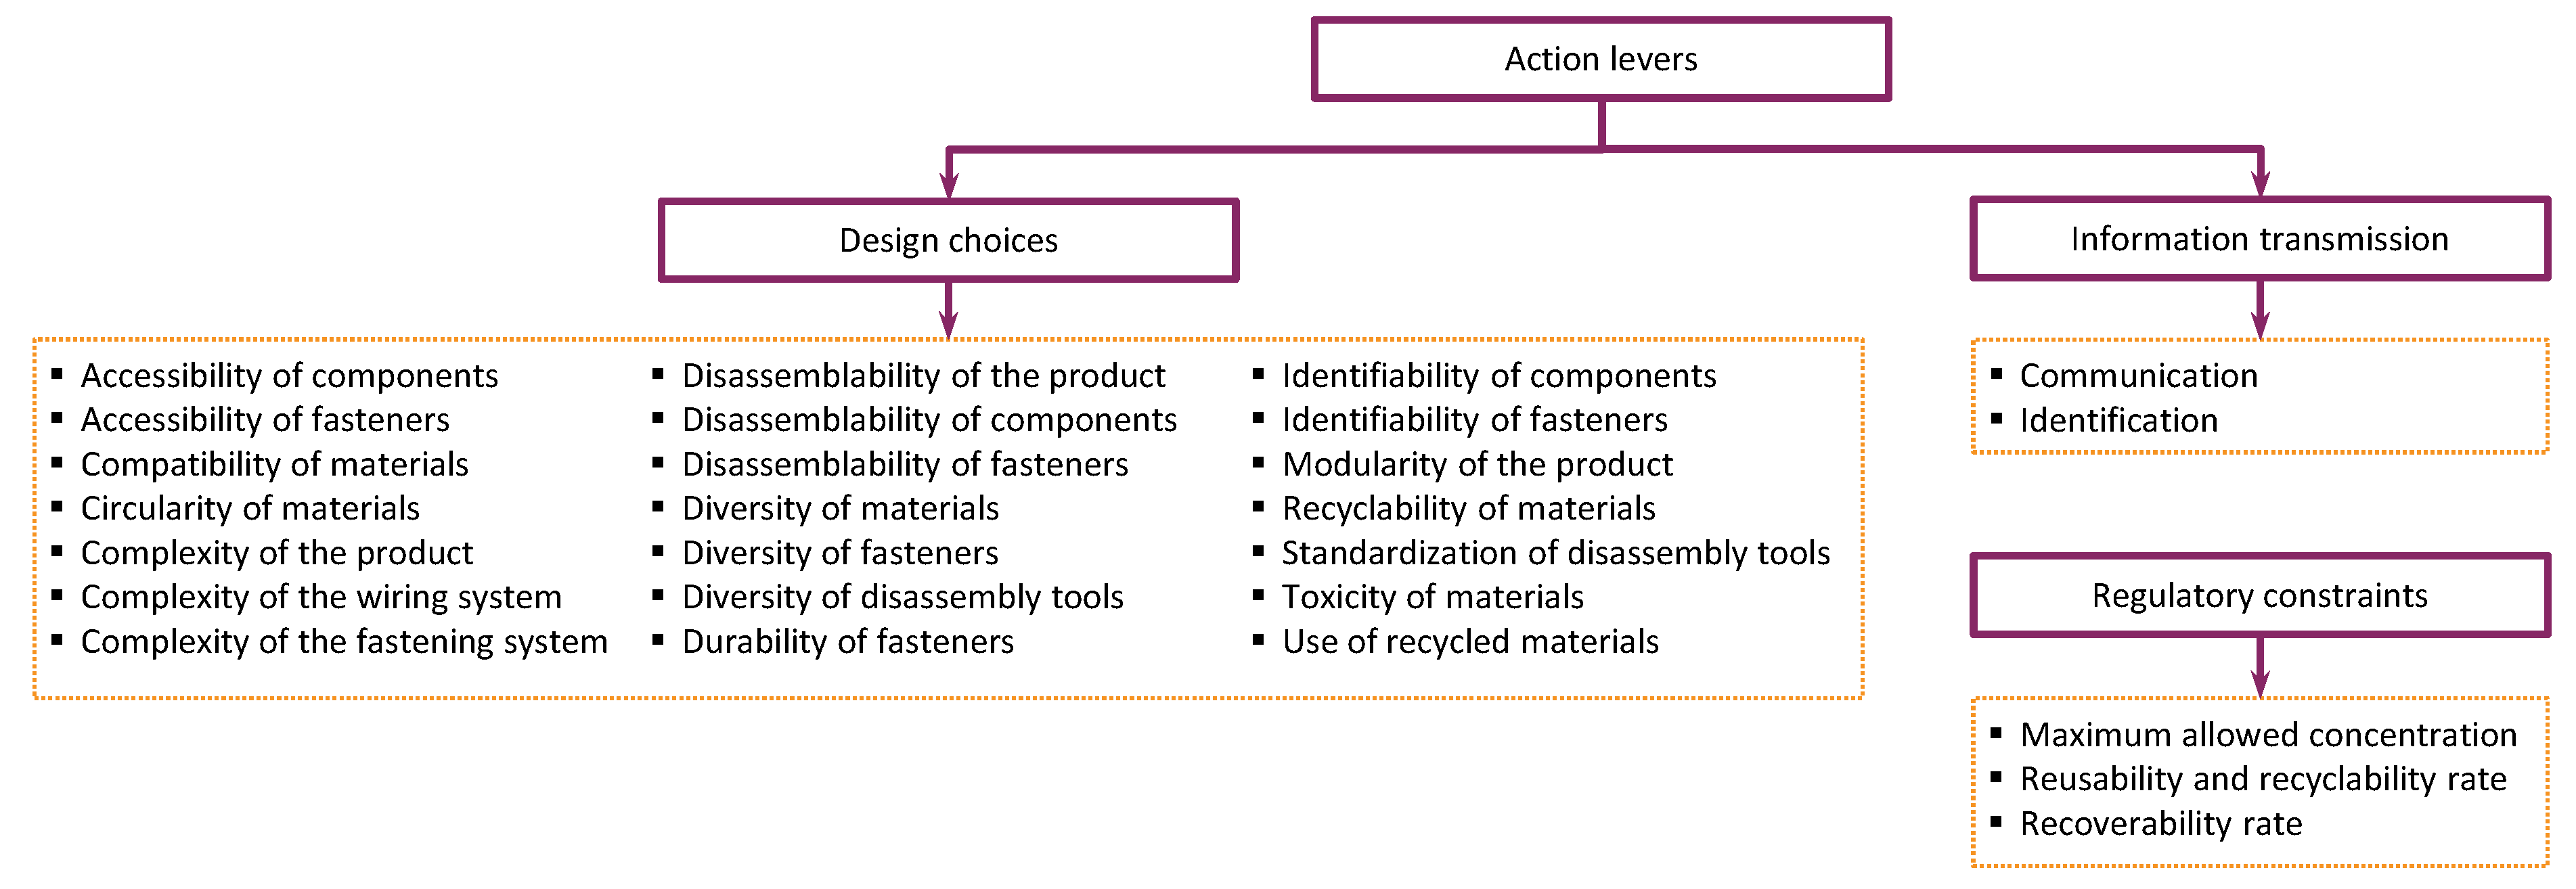
2.2.2. Identification of Design-for-Recycling Guidelines and Product Designer’s Action Levers
- decontamination depends mainly on the identification time, the clarity and durability of the instructions, and the dismantling time;
- dismantling is also affected by the identification time and the dismantling time;
- shredding is impacted by the fragmentation capability of the product as well as the energy required for this fragmentation;
- sorting depends on the difference in physical properties between each of the shredded materials (e.g., magnetism of ferrous metals, density difference between materials, etc.) and is highly dependent on shredding quality;
- recycling is mainly affected by material’s ability to be regenerated, as well as its compatibility with the other materials to recycle, but also with (i) different grades of the same material, (ii) impurities that were not separated during the shredding/sorting phase, and (iii) its surface treatments [13].
- Materials. This category is mainly concerned with the selection of materials. The levers identified are the diversity [12,15,16,19], compatibility [12,15,16,17,19,20,21], recyclability [12,15,16,17,18], toxicity [14,17,18], and circularity [16] of materials, and also the use of recycled ones [12,15,16];
- Fasteners. In this category, action levers are not only associated with the fasteners themselves (complexity of the fastening system [12,14,15,16] and their diversity [12,16], identifiability [12,15,16,17], accessibility [12,15,16,17,18,20], disassemblability [12,15,16,17,18,19,20], and durability [18]), but also with the dismantling tools (tools’ diversity [12,15] and types [12,14,15,16,18,20]). Therefore, this category includes action levers that seek to simplify the disassembly of fasteners;
- Information. This category deals with the communication of useful information about the end-of-life of the product to both users and stakeholders of the EoL chain [17].
- Product. Reusability, recyclability, and recoverability of the product;
- Materials. Maximum tolerated concentration of harmful substances.
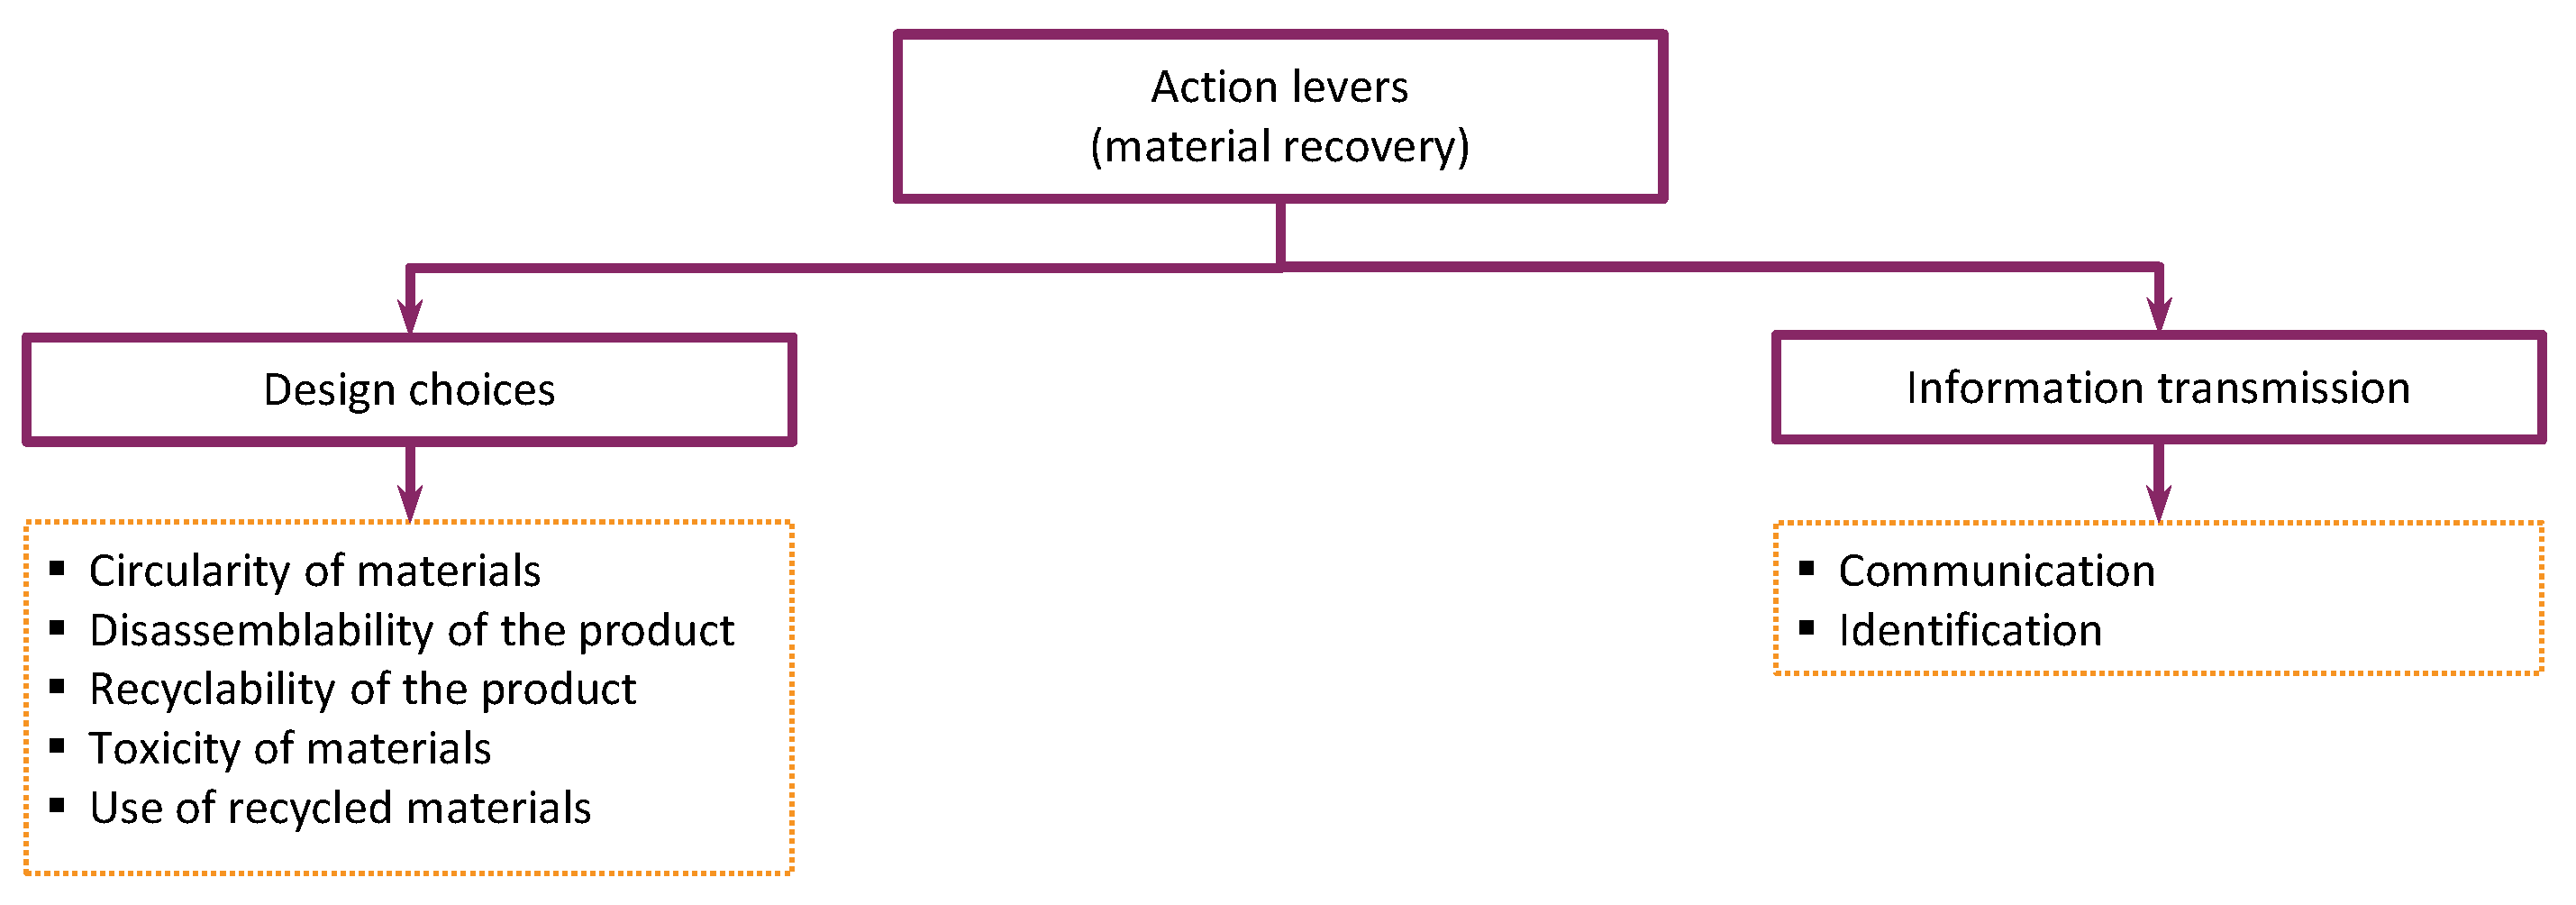
2.2.3. Grouping of Product Designer’s Action Levers
- Disassemblability of the product: (i) accessibility of components, (ii) accessibility of fasteners, (iii) complexity of the product, (iv) complexity of the wiring system, (v) complexity of the fastening system, (vi) disassemblability of components, (vii) disassemblability of fasteners, (viii) diversity of fasteners, (ix) diversity of disassembly tools, (x) durability of fasteners, (xi) modularity of the product, (xii) identifiability of components, (xiii) identifiability of fasteners, and (xiv) standardization of disassembly tools
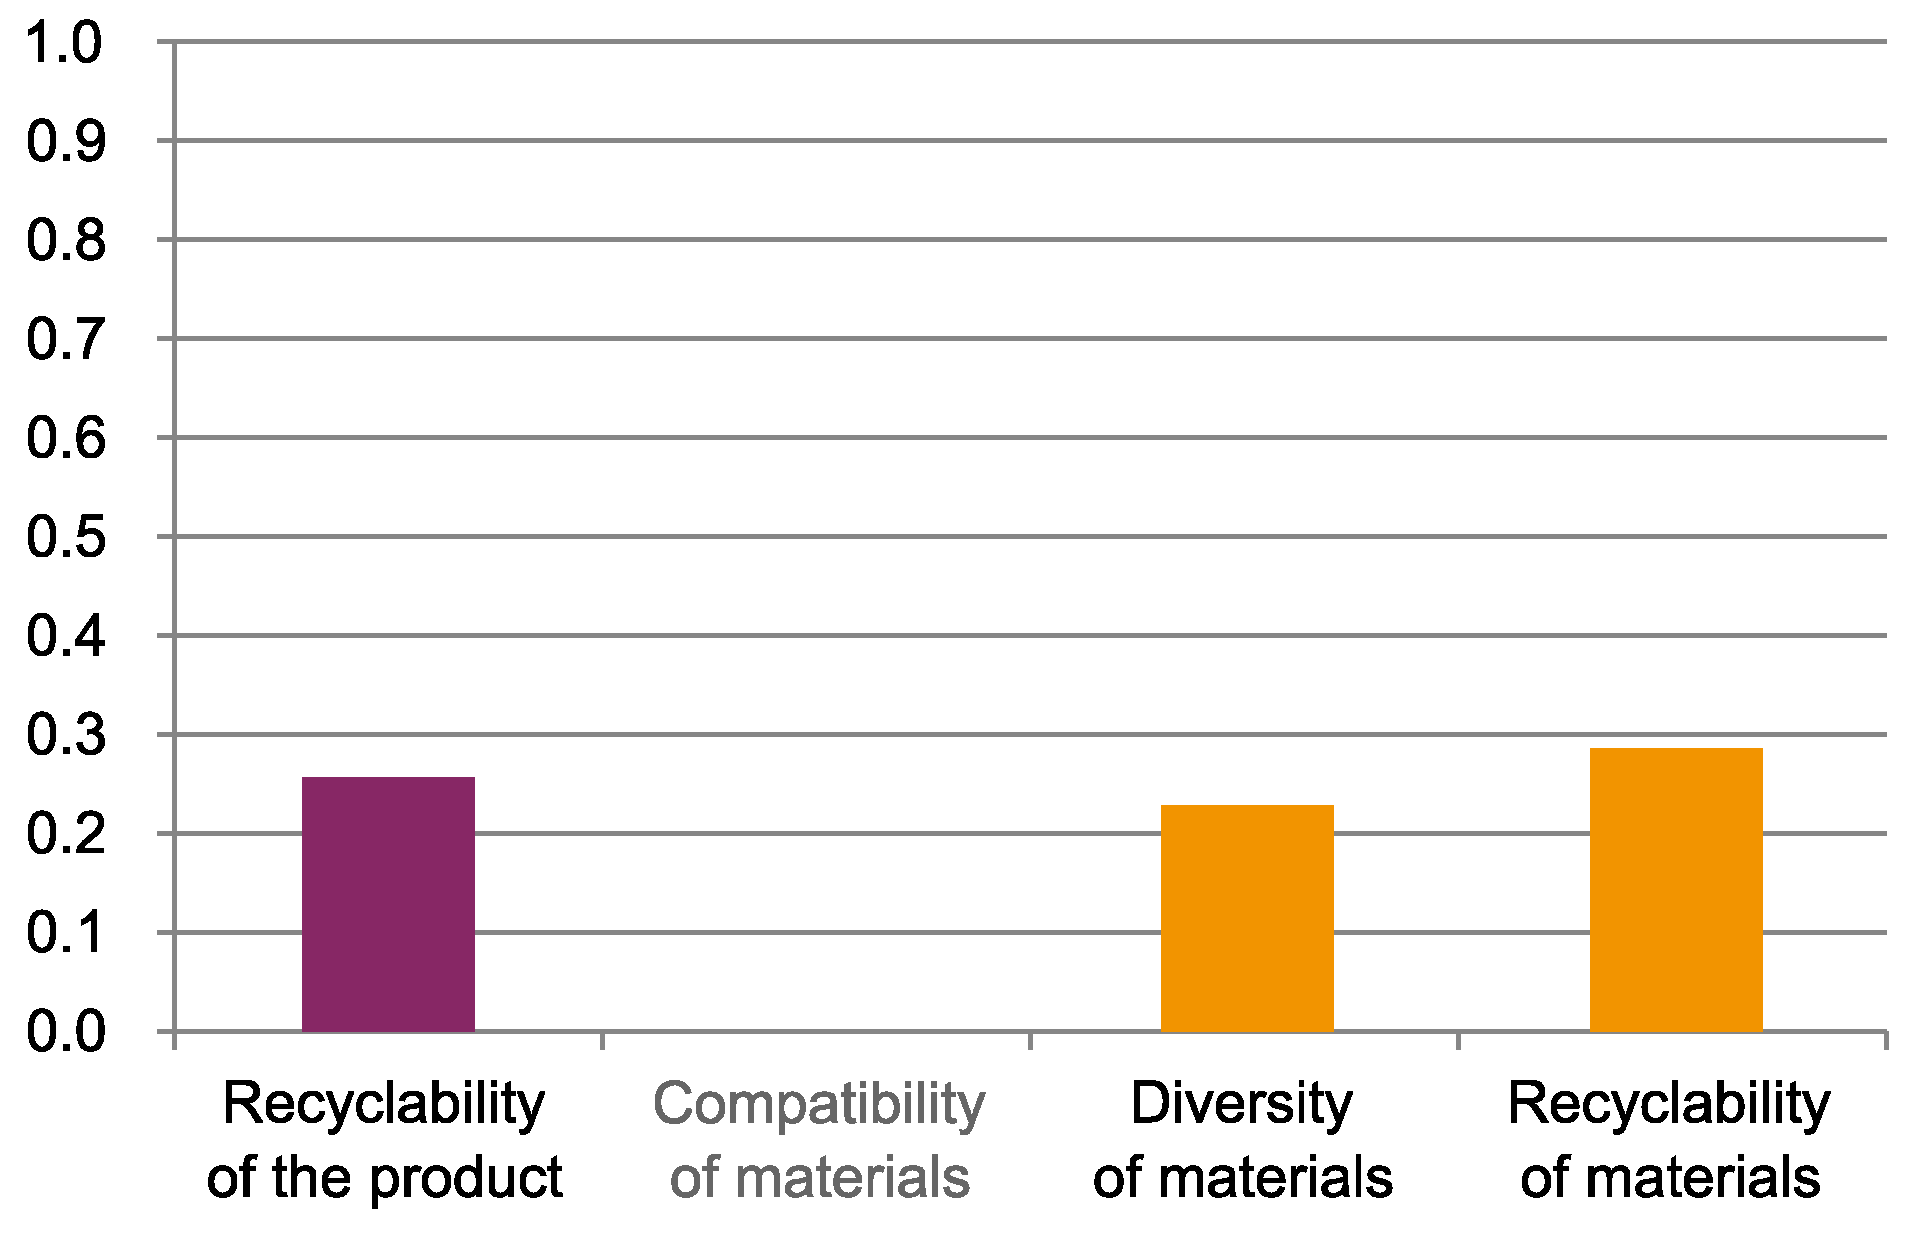
- Recyclability of the product: (i) compatibility of materials, (ii) diversity of materials, and (iii) recyclability of materials
2.2.4. Selection and Definition of the Indicators Associated with Product Designer’s Action Levers
- the result value must be within the range of 0 to 1;
- the value of 1 must correspond to the best score and 0 to the worst.
- for the first-degree function, the variation in each indicator reflects in the same way on the index;
- for the nth degree function, it was observed that for the minimum value of one of the indicators, the partial derivative of the index with respect to this indicator is the highest and for the maximum value, the derivative is the lowest. The function is then sensitive to the lowest values;
- for the intermediate symmetrical functions (degree 2 to n − 1), the same behavior as for the nth degree function has been identified.
- Recyclability of the product
- Compatibility of materials
- Ishii et al. [25] propose to assess the compatibility of materials in a semi-qualitative way. The proposed indicator defines six levels of compatibility: very compatible (1), compatible (0.8), some level of compatibility (0.6), incompatible (0.2), hazardous (0), and no information (0.5). The allocated score is within the range [0,1];
- Qian et al. [26] propose to use matrices to easily visualize the compatibility information. Compatibility is divided into four levels: most compatible, some compatible, limited compatible, and no compatible. Here, the value of the indicator is not numerical, but a graph indicating compatibility degree by zones;
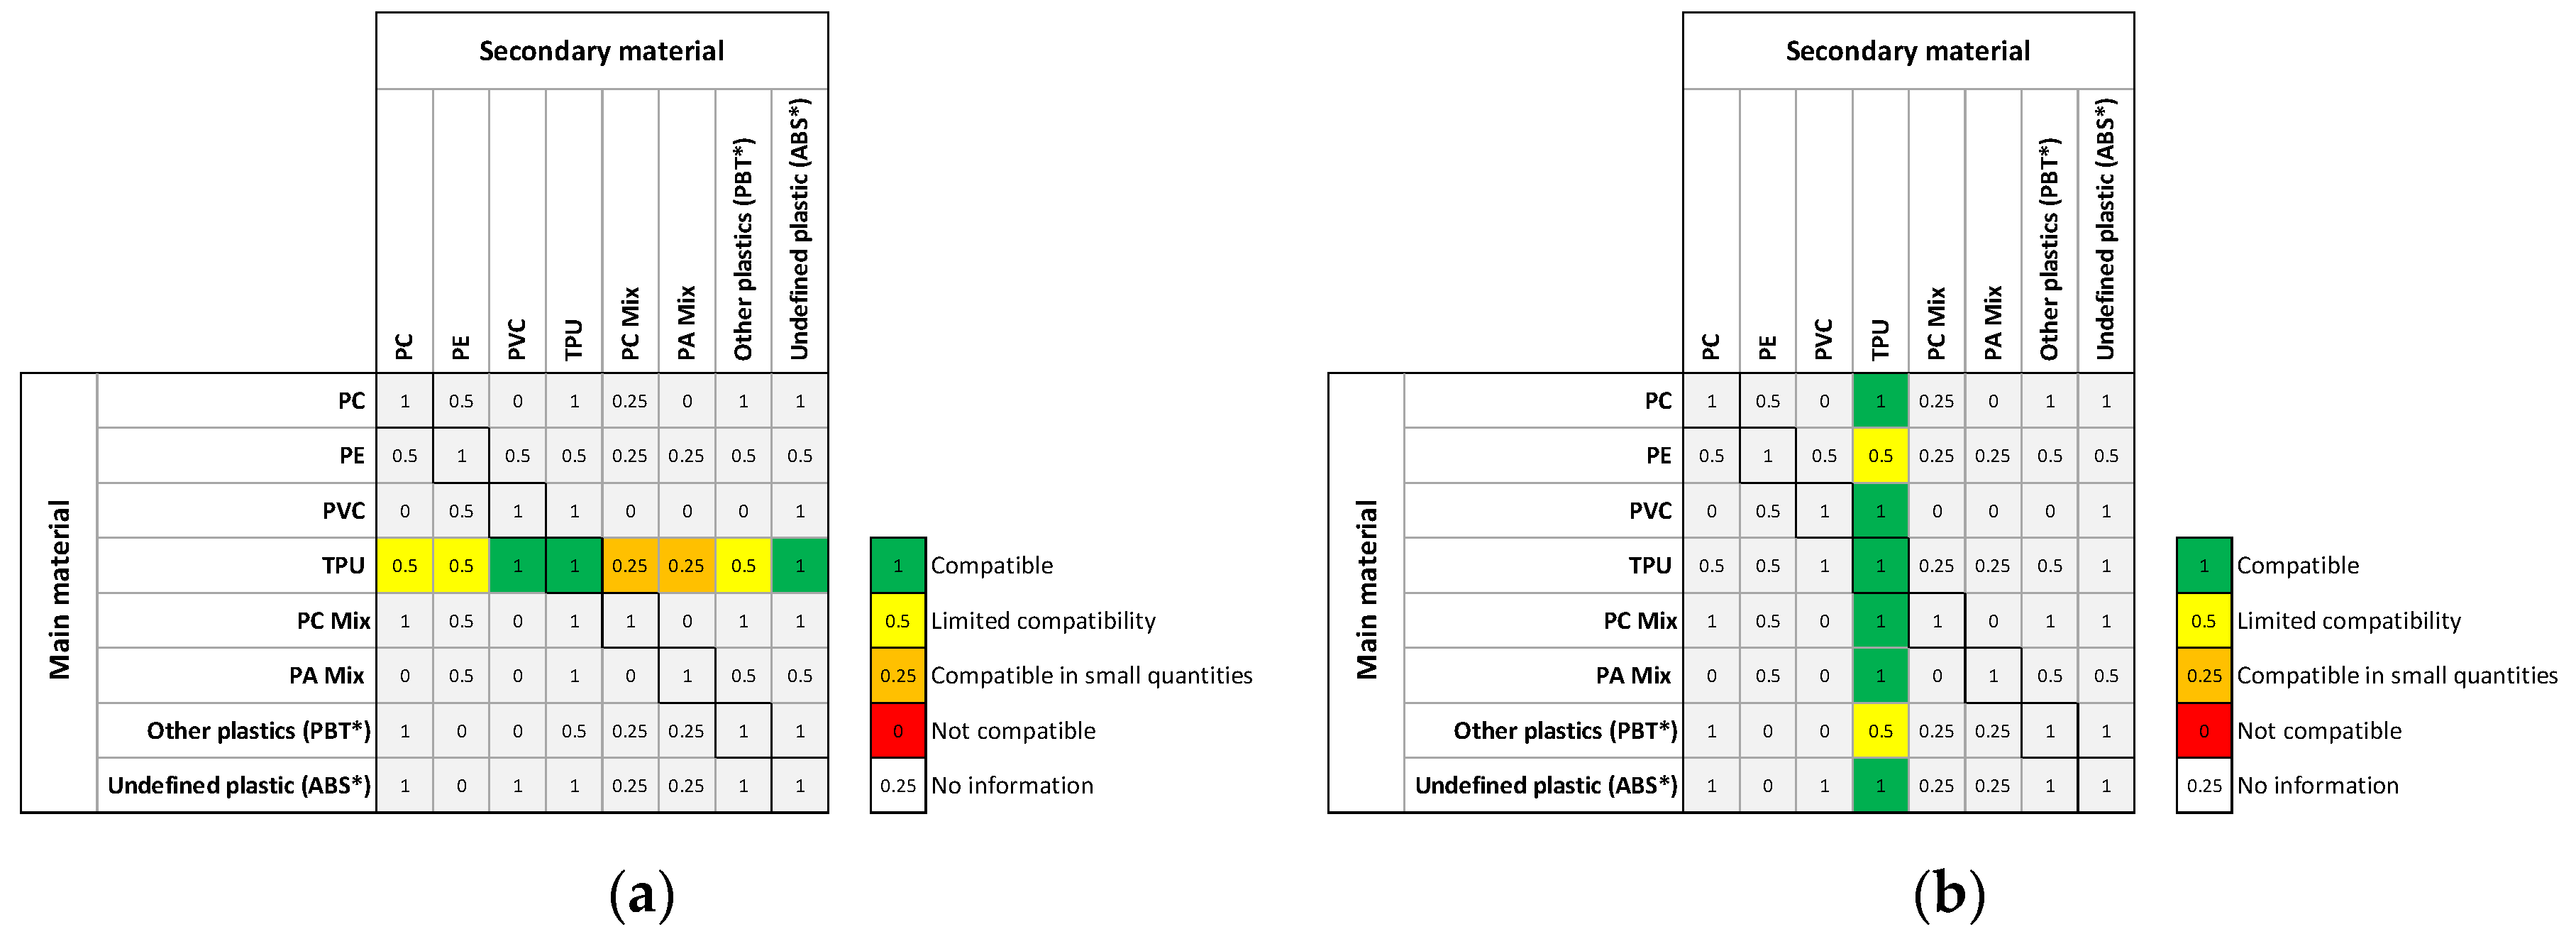
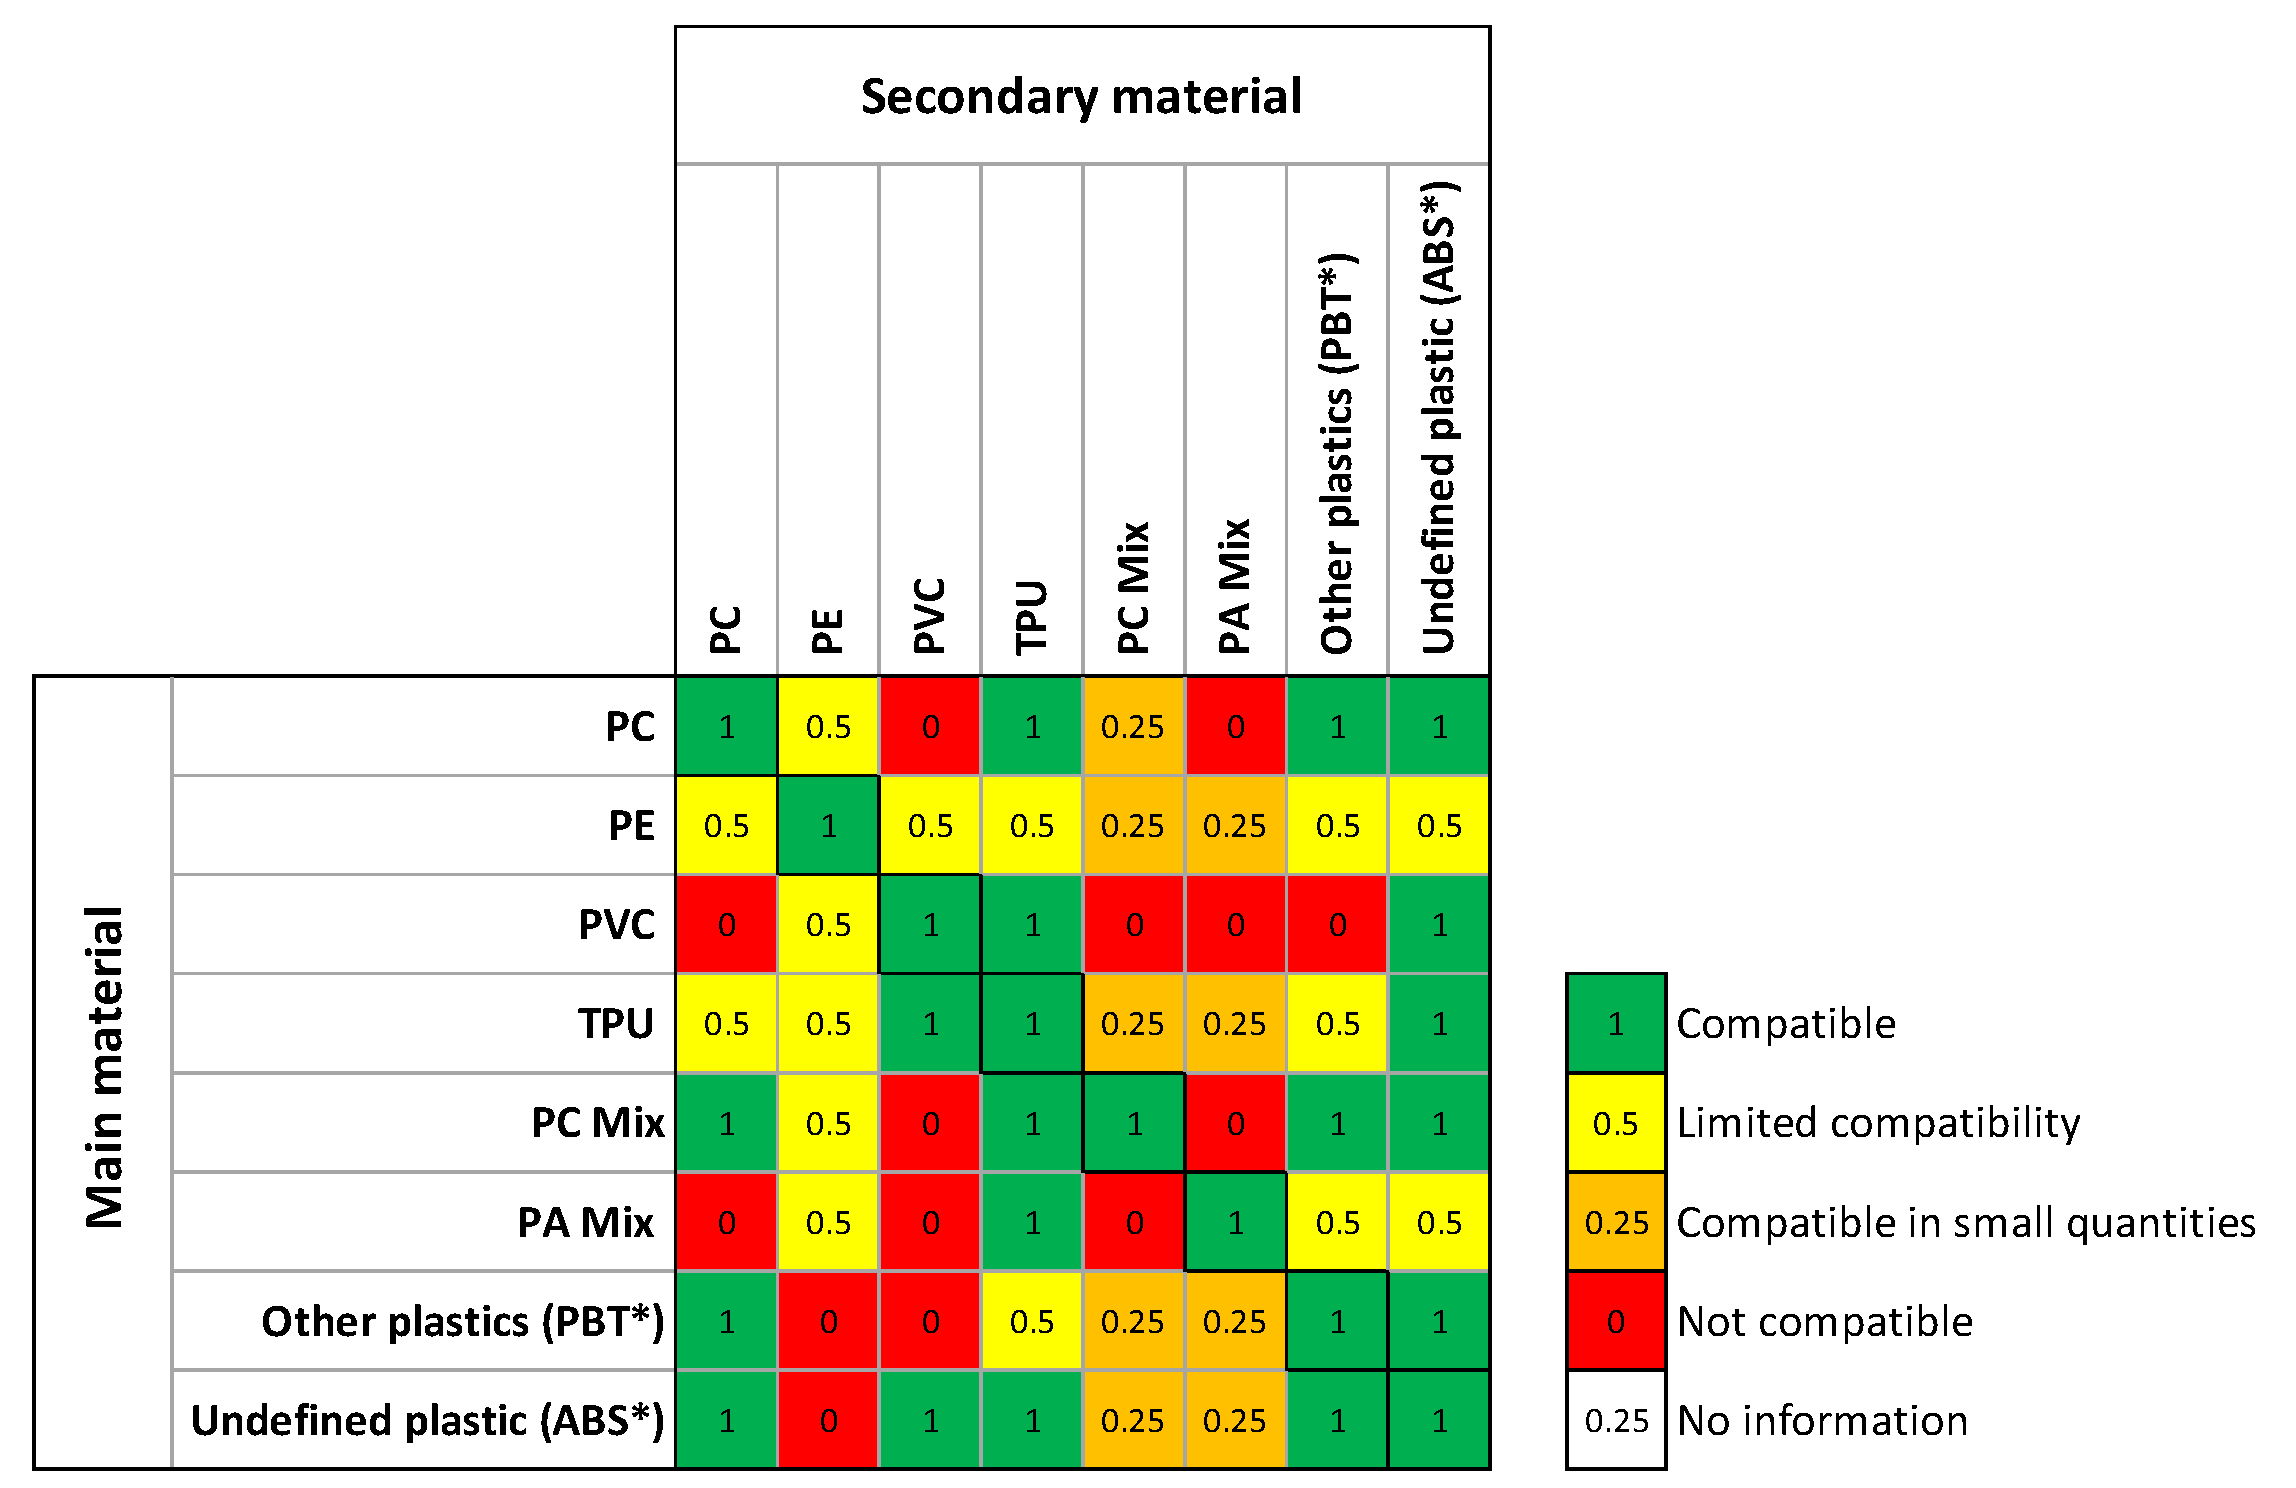
- Pahl et al. [20] propose an indicator similar to that of Qian et al. Compatibility of materials (plastics) is classified on four levels: compatible, limited compatibility, compatible in small quantities, and not compatible. As for the indicator of Qian et al., the value provided by this indicator is graphical and not numerical;
- De Aguiar et al. [27] propose a compatibility indicator similar to the previous ones. They propose to classify material compatibility into four levels: same material (1), compatible materials (2), low compatibility materials (3), and non-compatible materials (4). The indicator’s range is therefore between 1 and 4.
- the compatibility values are expressed in a similar way to those proposed by Ishii et al. so that the provided value is a number (and not a graph). The value is thus contained in the interval [0;1] so the interpretation remains the same as the one adopted for all indicators (i.e., 0 being the worst value and 1 being the best);
- the situation where the designer has no information, proposed by Ishii et al., has been added.
- the first mode corresponds to the line reading (Figure 5a). It shows the compatibility of our material as one of the main materials (i.e., as a material to be recycled);
- the second mode corresponds to the column reading (Figure 5b). It shows the compatibility of our material as one of the secondary materials (i.e., as an impurity that could compromise the recycling of the main material).
- Diversity of materials
- the greater the variety of materials, the more difficult it is to recycle the product;
- the higher the concentration of a material, the easier it is to recycle it.
- Dostatni et al. [28] proposed the rate of materials diversity indicator, whose value is in the range between 0.5 and 5. The rate of material diversity indicator is dependent on the number of occurrences (i.e., the number of parts) of the material the most frequently used in the product, and the number of occurrences of other materials;
- Rzeźnik et al. [29] measure the material heterogeneity (i.e., the material diversity) of a machine using its information entropy.
- the indicator is dependent on the diversity of materials: the more different materials the product contains, the more the entropy value increases;
- the indicator is dependent on the concentration of materials: the higher the concentration of a material, the lower the value of diversity.
- Recyclability of materials (treatment efficiency)
2.2.5. Indicator-Based Design for Recycling Guidelines
2.3. Design from Recycling: Proposition of an Index Assessing the Convenience of Using Recycled Materials
2.3.1. Method Description
2.3.2. Selection and Definition of the Indicators
- use materials that benefit from a good environmental score;
- avoid or reduce the use of toxic materials or components;
- prefer the use of materials coming from renewable raw materials;
- prefer recyclable raw materials;
- avoid irreversible mixing of materials;
- avoid raw materials and parts whose origin is problematic.
- Technical Convenience of Using Recycled Materials
- Economic Convenience of Using Recycled Materials
- Environmental Convenience of Using Recycled Materials
2.3.3. Selection of the Weighting Method
2.3.4. Selection of the Aggregation Method
- Additive aggregation methods (86.5%): They use functions that sum the normalized values of the indicators to form the index. The most common additive method is by far the weighted arithmetic mean;
- Geometric aggregation methods (8.3%). These methods use multiplicative functions instead of additive functions. The geometric aggregation function the most commonly used is the weighted geometric mean;
- Non-compensatory aggregation methods (5.2%). The additive and geometric aggregations imply that the compensation between the indicators is acceptable. Non-compensatory methods are used when such compensation is deemed unacceptable. The result of such a method is rather a rank than a concrete value. As no compensation between the indicators of the method is allowed, all weights reflect the relative importance of each indicator rather than a trade-off ratio.
3. Results
3.1. Implementation of the Design for Recycling Proposition
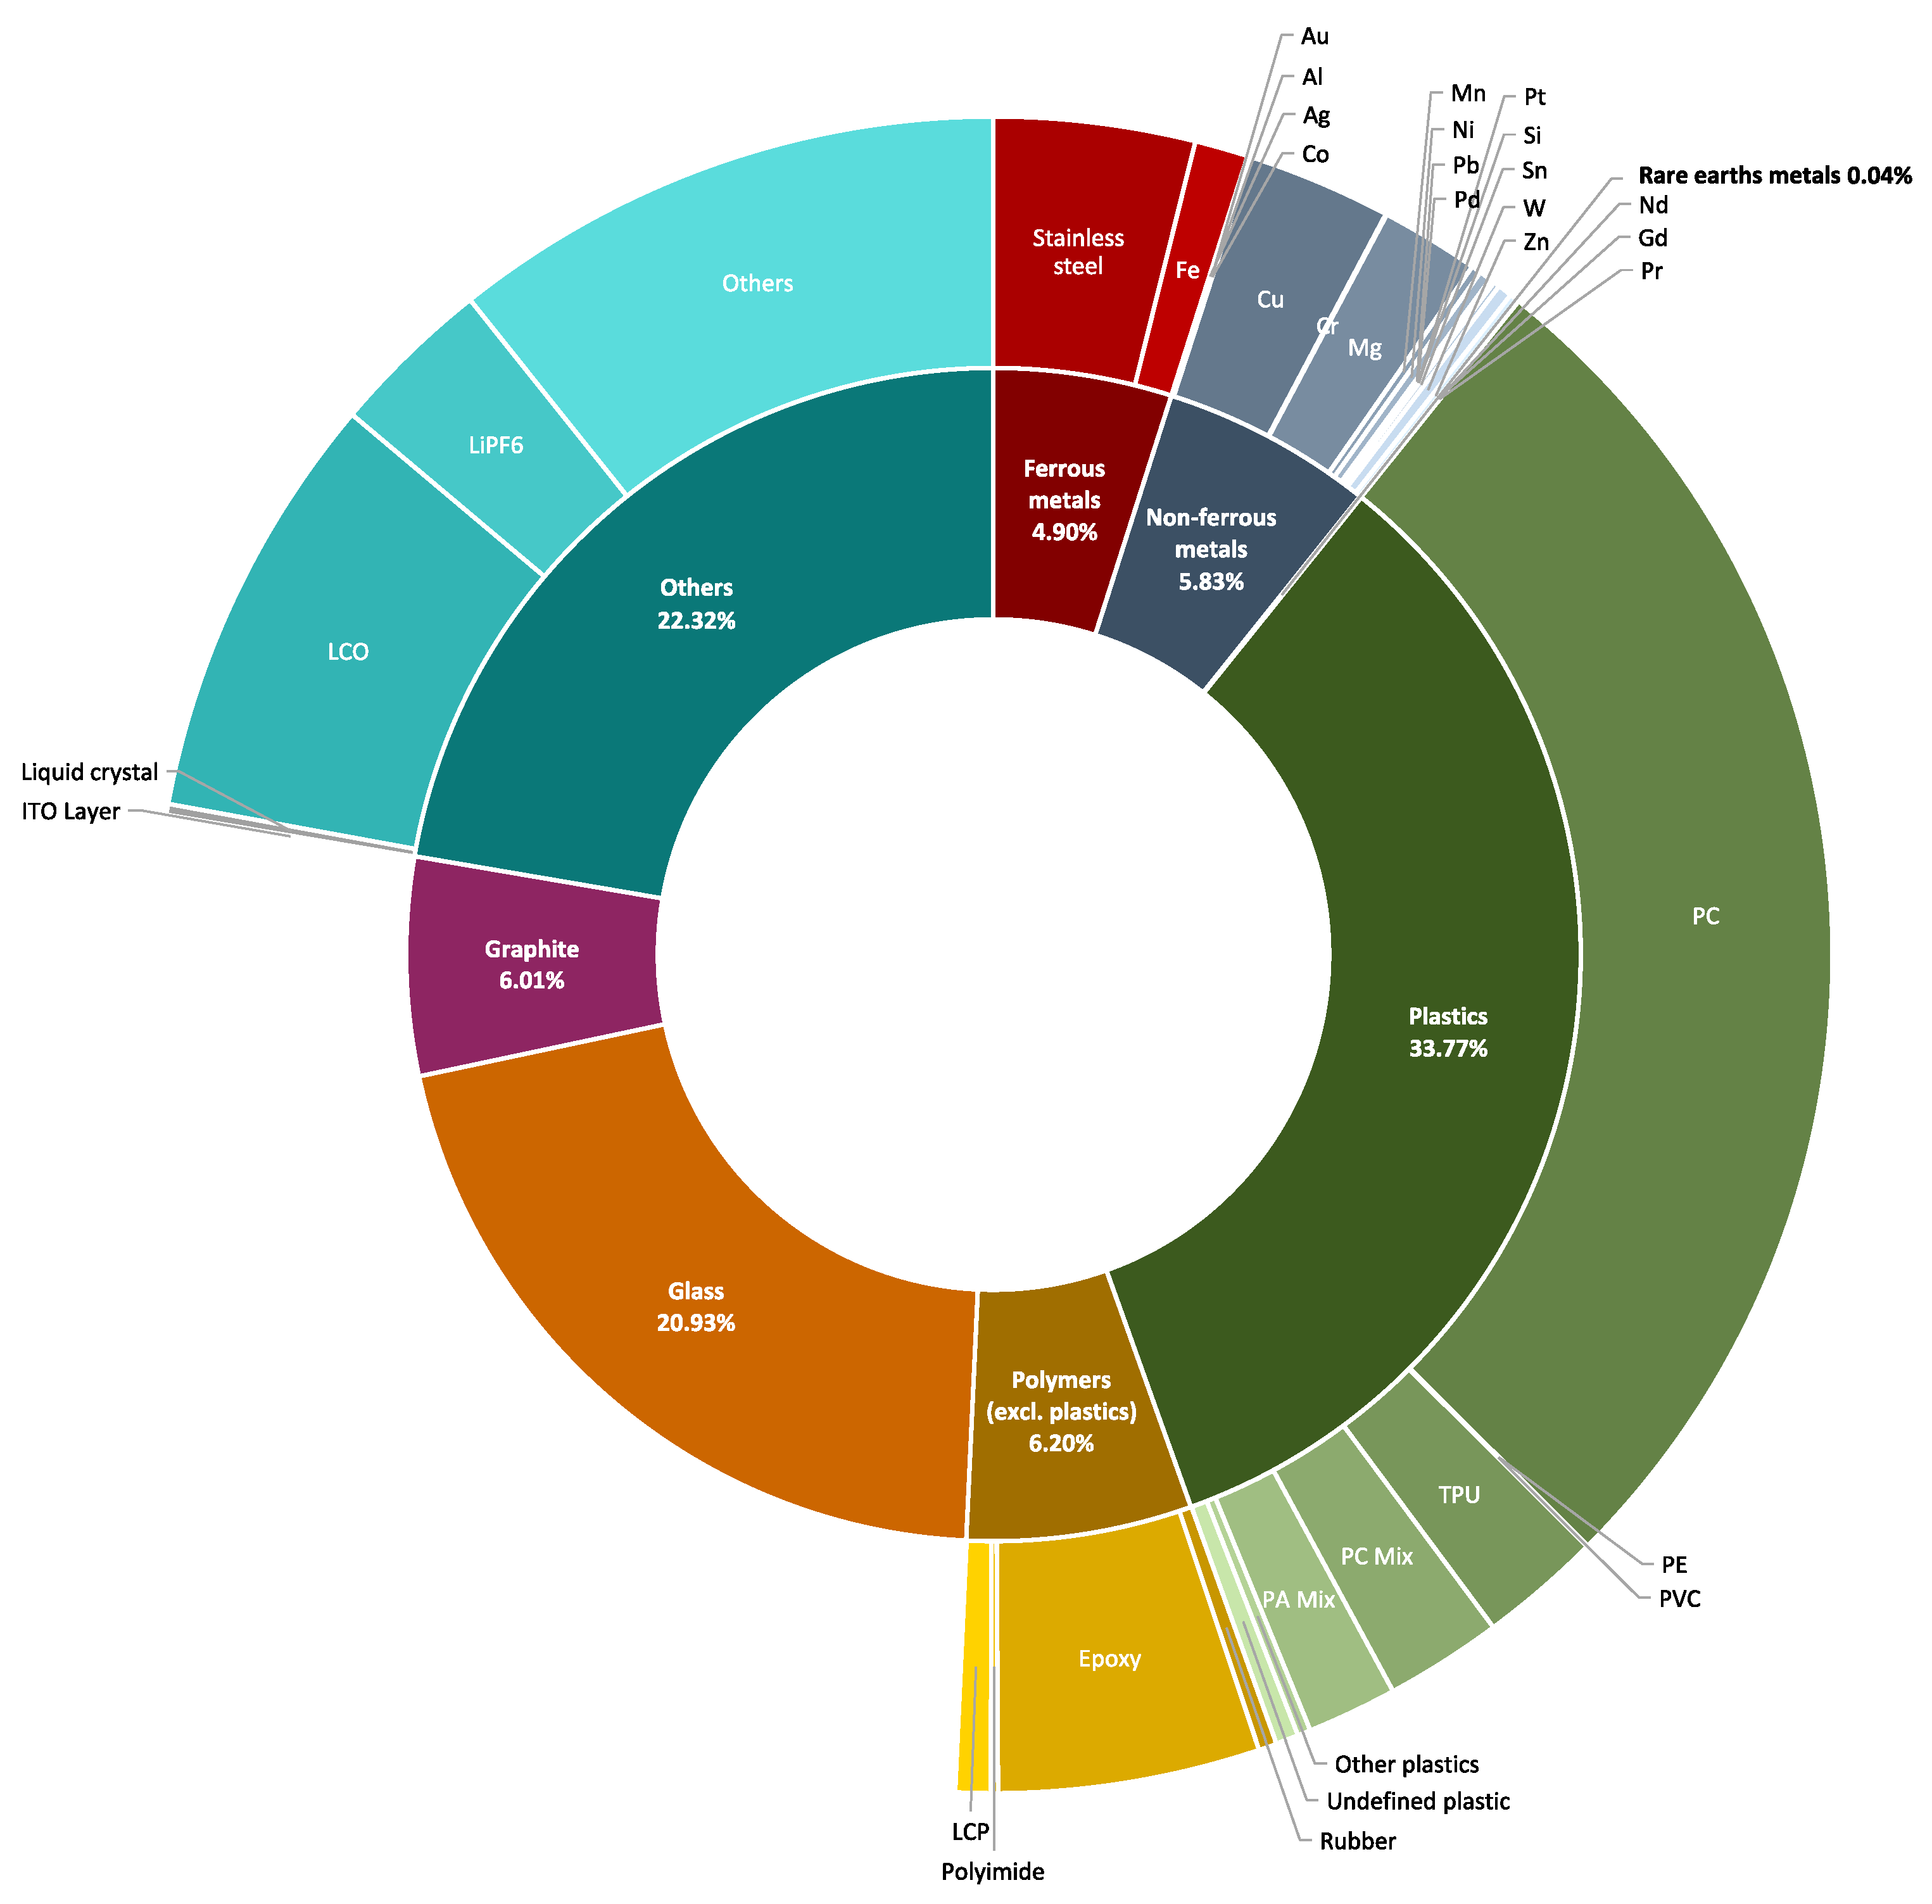
3.1.1. Step 1—Selection and Characterization of the Product
- Product’s Selection
- production practices, working conditions, working hours, and health and safety regulations on the products that consumers use and buy;
- the origin of raw materials (i.e., transparency in the supply chain);
- the functioning of companies (including economic aspects).
- Product’s Characterization
3.1.2. Step 2—Evaluation of Action Levers
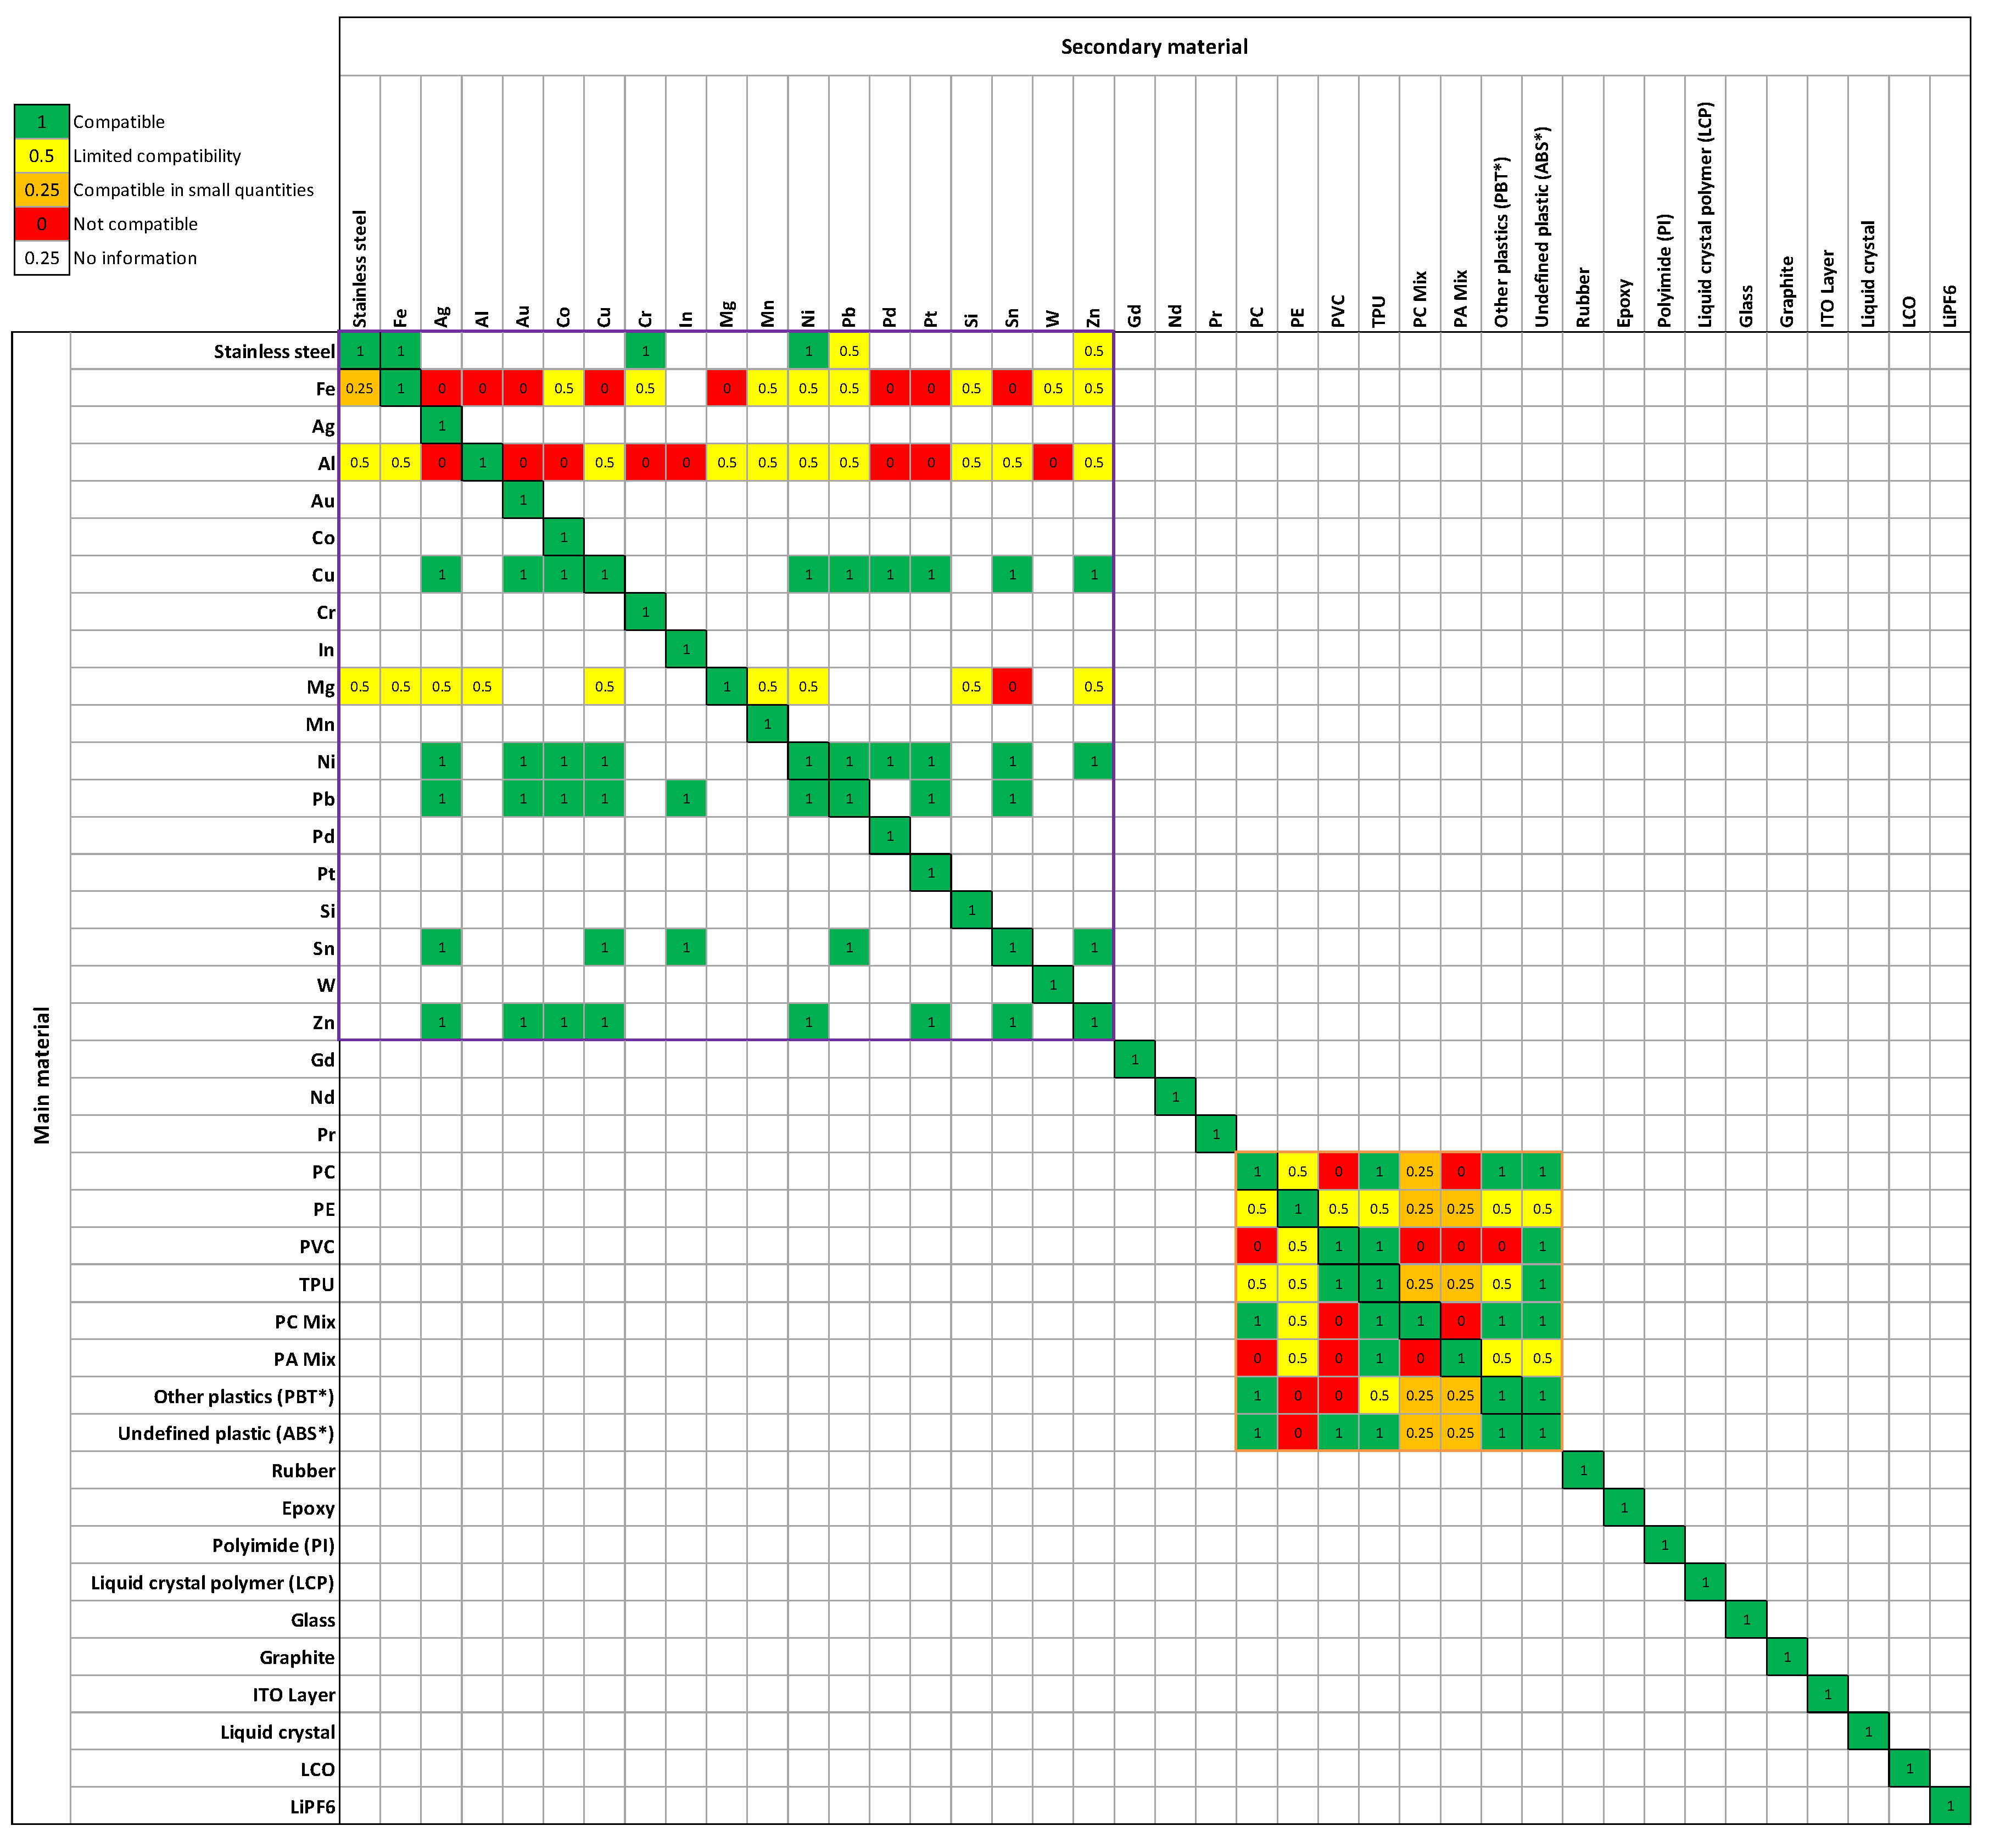
- Compatibility of materials
- For metals, compatibility is addressed in the literature by the ability to separate impurities from the material to be recycled. Some authors analyze the impurity distribution rates between the metal, slag, and gas phases using an element radar map [43,44]. Others use the metal recycling wheel, which describes the various possibilities for loss and recovery of impurities as well as the economically viable routes [45,46].
- For plastics, compatibility is approached in the chemical sense, i.e., by the relationship between the material to be recycled and the impurities that could disrupt its recycling. It is represented in a matrix form in the literature [20,26,47]. Maier’s matrix was preferred, because it is more recent and more comprehensive. Information from the Eco3e site on what is tolerated, poorly tolerated, and not tolerated for recycling regarding glass fiber concentration has been used to analyze the compatibility of PC Mix and PA Mix plastics [48].
- Diversity of materials
- Recyclability of materials
- Recyclability of the product
3.1.3. Step 3—Identification of Product’s “Hotspots”
3.1.4. Step 4—Proposal of Relevant Guidelines
- minimize the number of different types of materials;
- avoid the mixing of materials in assemblies;
- use a monomaterial strategy: favor using a single material per product or sub-assembly.
3.2. Implementation of the Design from Recycling Proposition
3.2.1. Step 1—Selection of the Recycled Material
3.2.2. Step 2—Evaluation of Convenience Indicators
- Assessing the Technical Convenience of Using Recycled Materials
- The Urban Mines Chair specifies that the impurity of recycled plastics from the WEEE sector is between 12% and 15%. Due to a lack of information on the PC, we used the highest value in this range for our study;
- The following hypothesis is retained: the company responsible for supplying the recycled material has been checked and validated by the purchasing department. Hence, a value of 1 has been assigned to the indicator of supply reliability.
- Assessing the Economic Convenience of Using Recycled Materials
- Assessing the Environmental Convenience of Using Recycled Materials
- the environmental impact of the production of primary (i.e., virgin) raw materials was calculated using the Ecoinvent 3 database;
- the environmental impact of the production of secondary (i.e., recycled) raw materials was calculated using the database created by Eco-systèmes and Récylum [49]. It enables manufacturers to assess the environmental impacts or benefits of recycling more than 60 materials obtained from WEEE;
- the selected impact categories are the same as those used in Fraunhofer’s report [38].
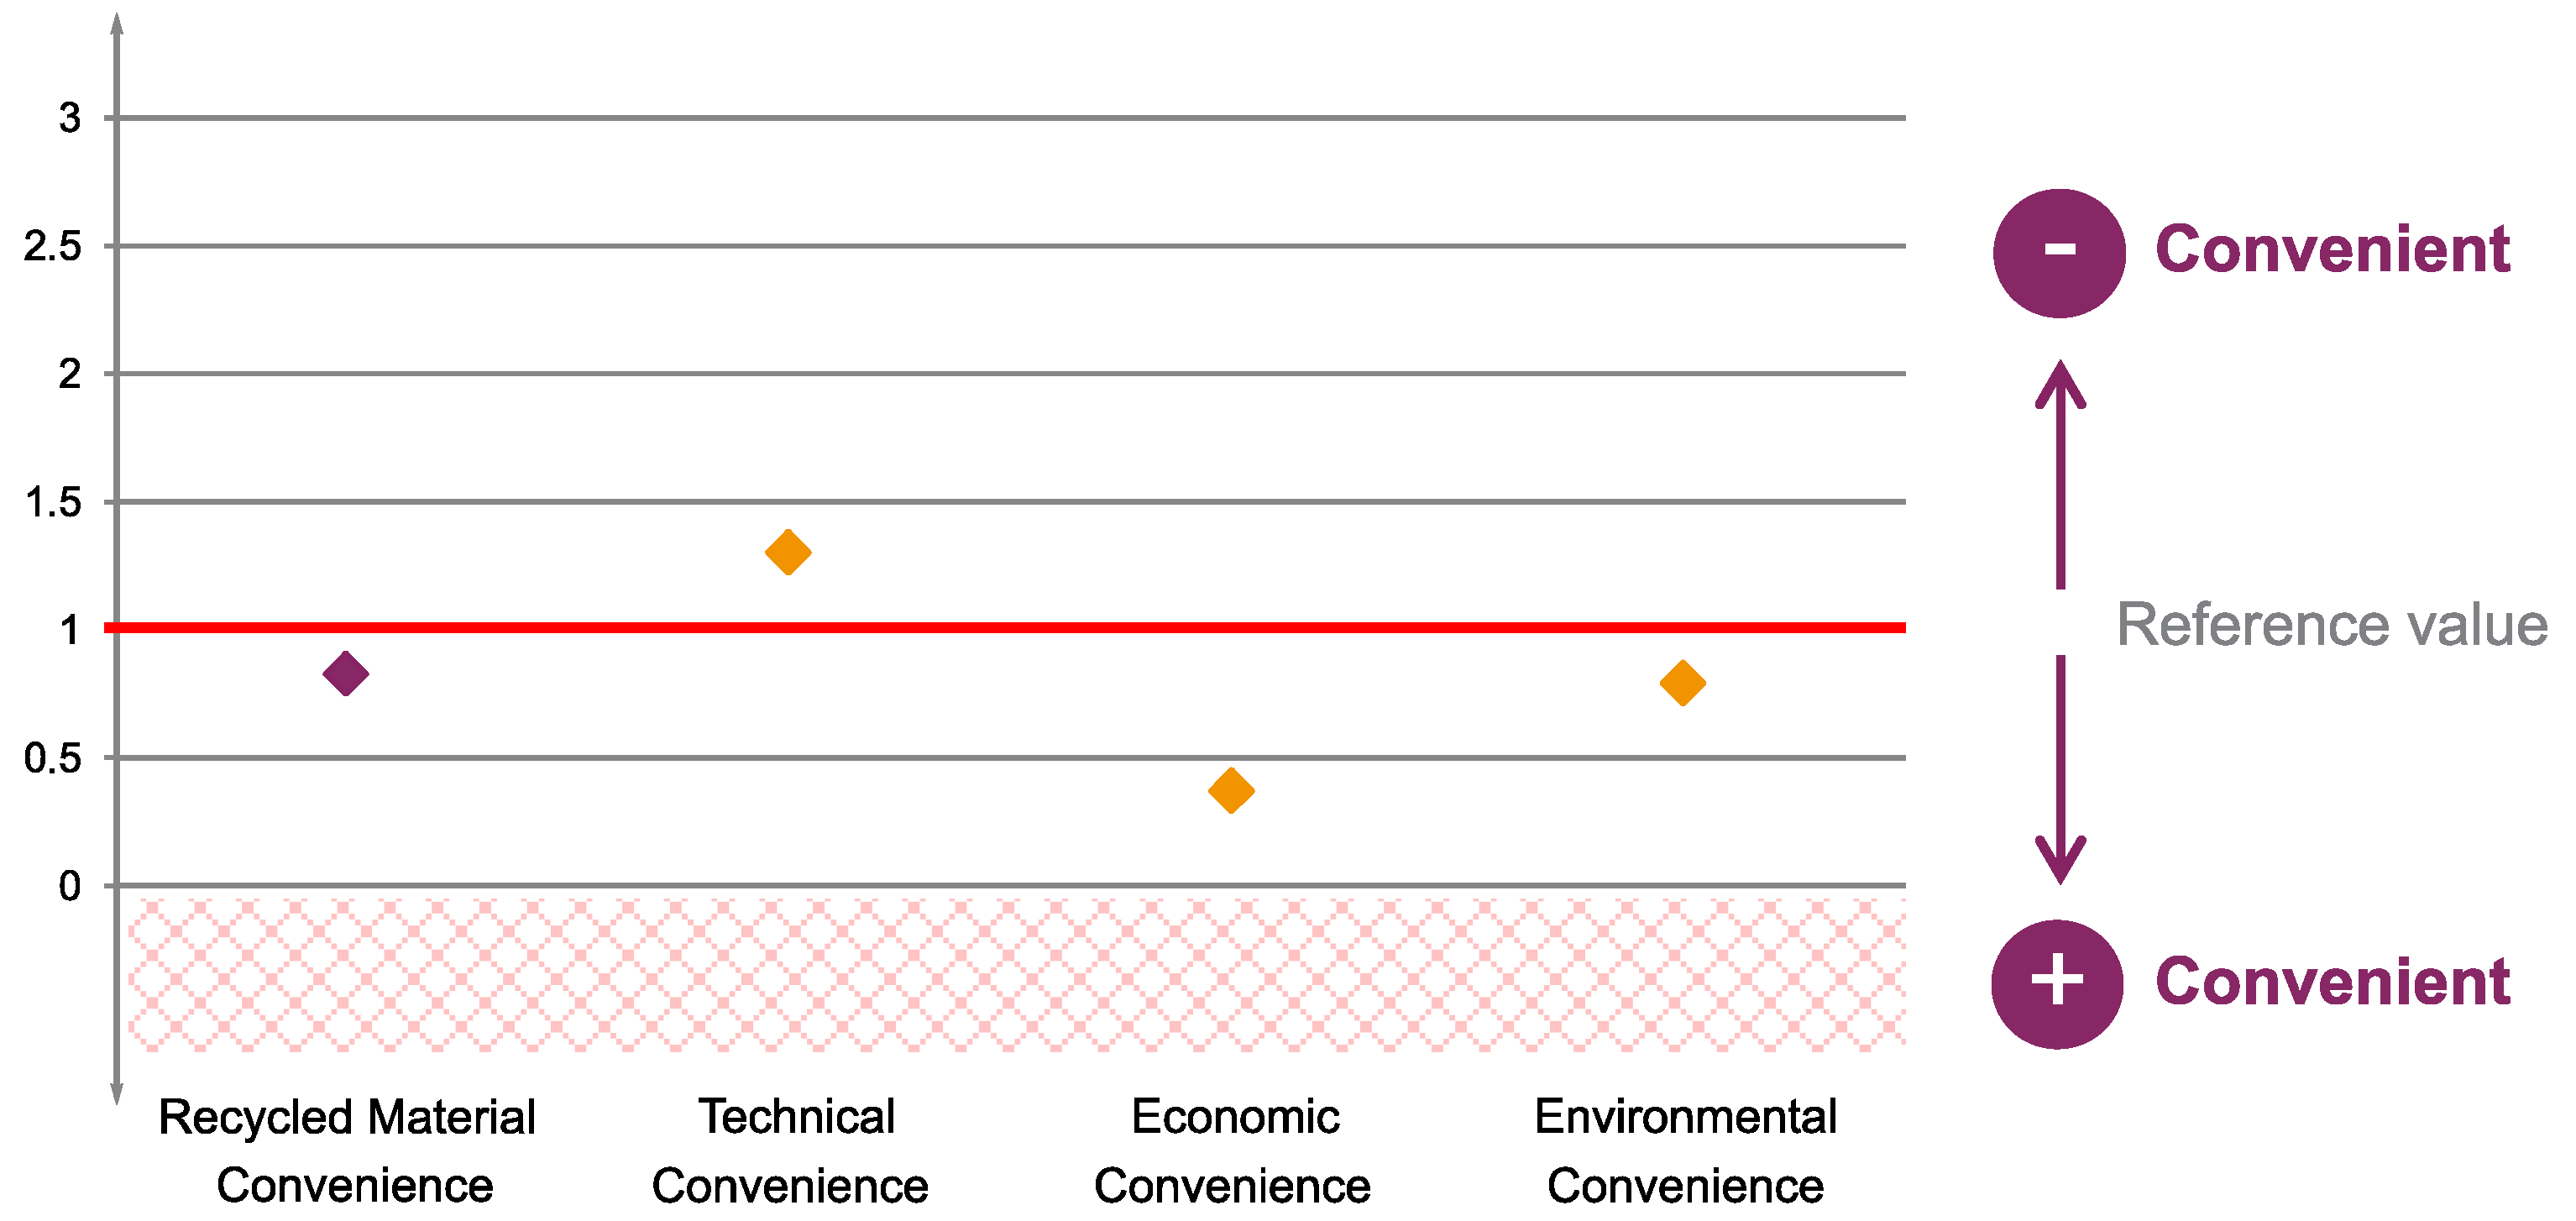
3.2.3. Step 3—Evaluation of Convenience Index
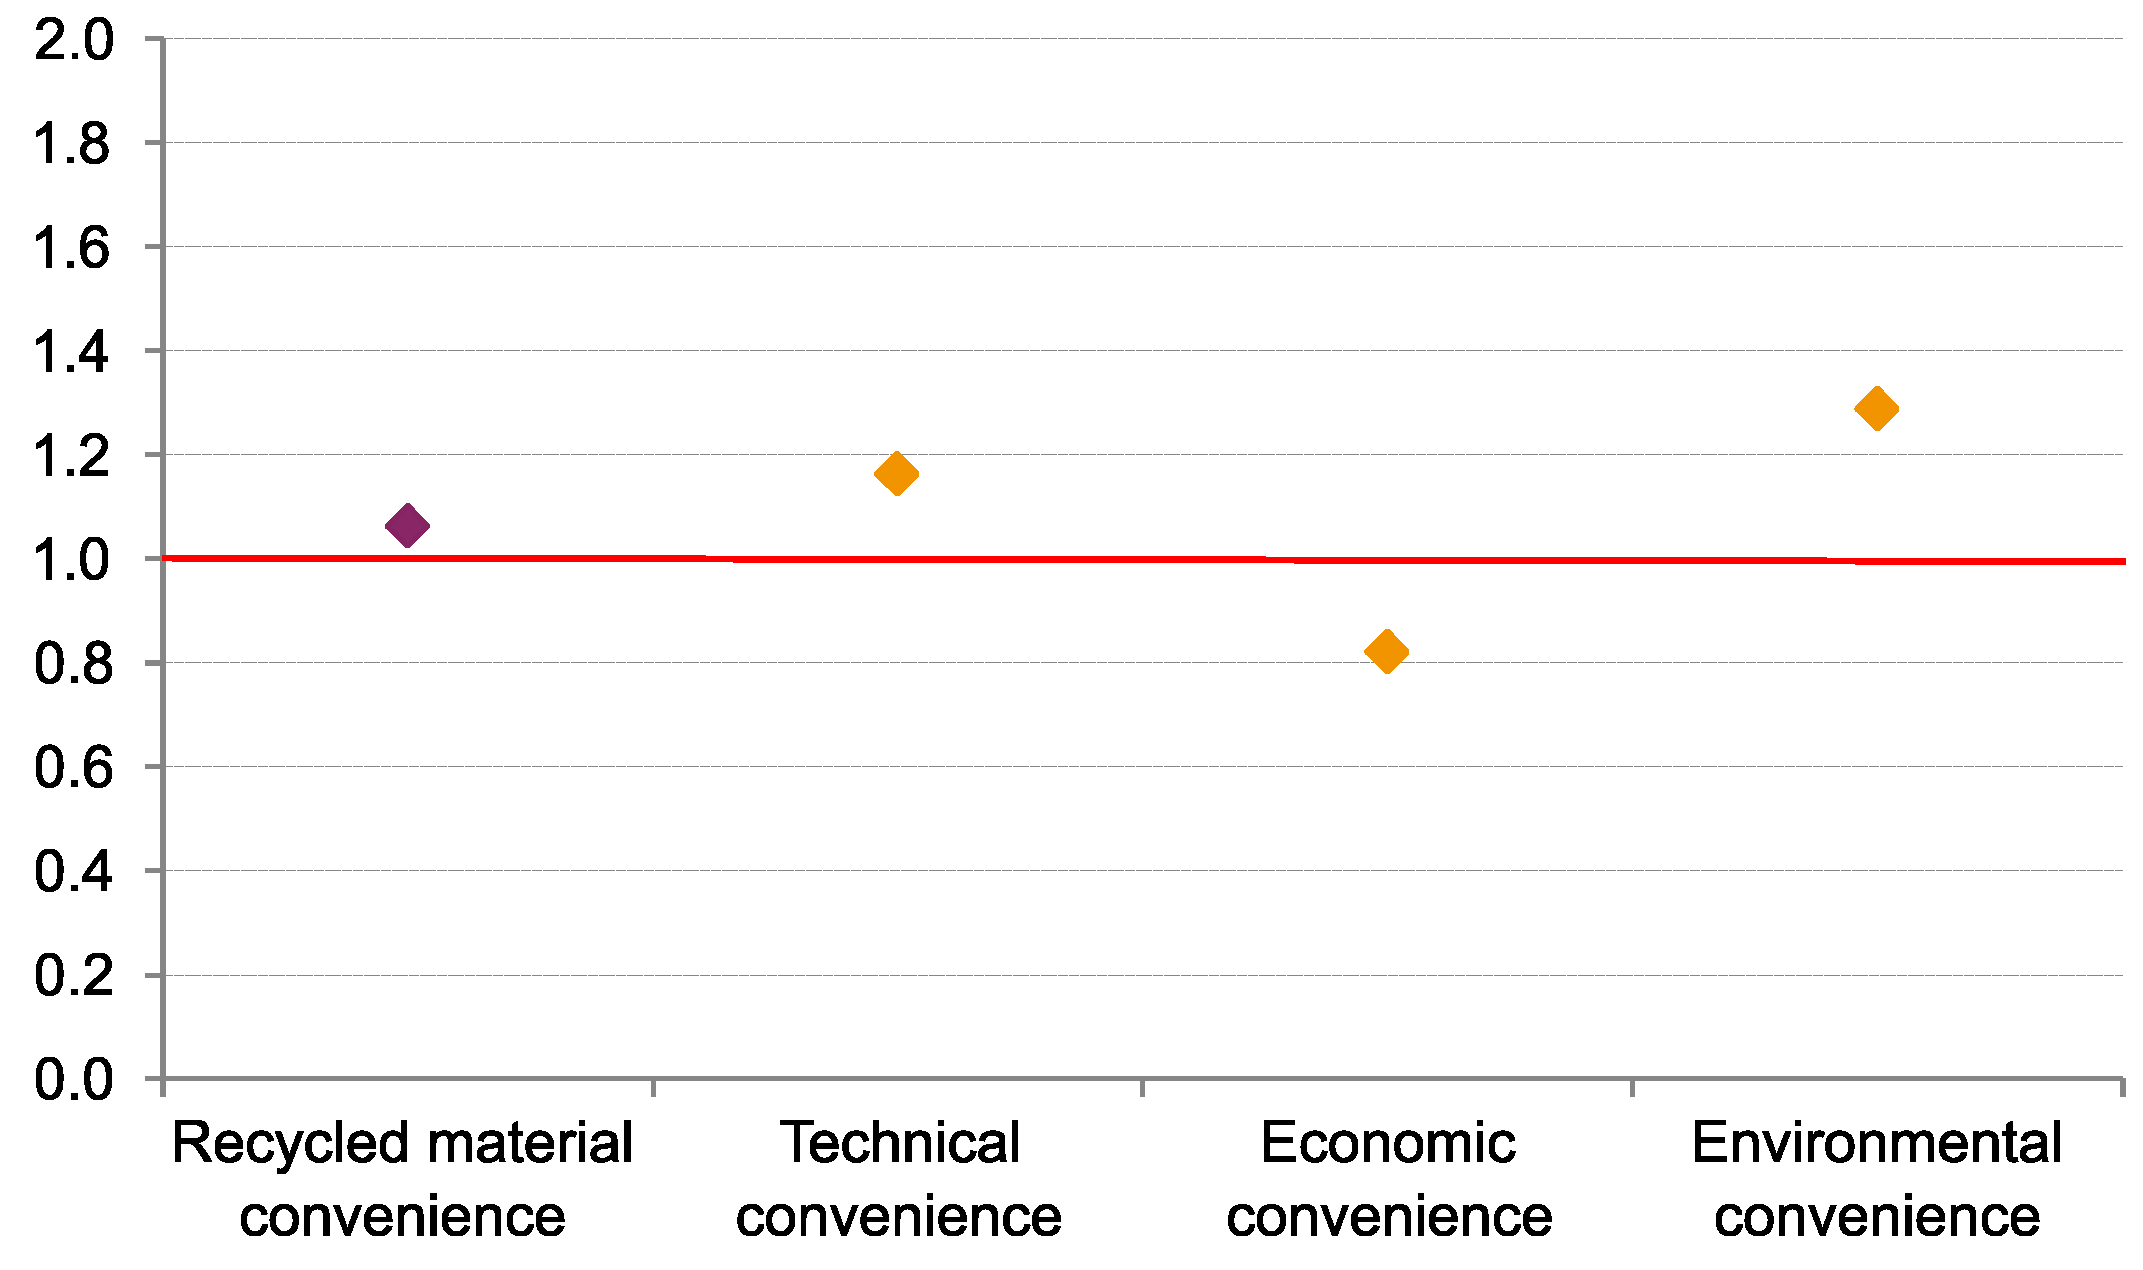
- the technical convenience is not confirmed, as it is 15% above the reference value (100% purity);
- the economic convenience is confirmed, as it is 18% below the reference value (i.e., the price of virgin PC);
- the environmental convenience is not confirmed, as it is 29% above the reference value (the environmental impacts of the production of virgin PC). However, it should be noticed that this recycled material might be environmentally convenient in another product. Another possibility is that recycled PC from another industry might be environmentally more convenient;
- the overall convenience is not confirmed, because the score provided by the aggregation index is 9% above the reference value. Recycled PC is, overall, less interesting than virgin PC.
4. Discussion
4.1. Design for Recycling Proposition
- It was not possible to carry out an exhaustive literature search to define each of the performance indicators for the 24 action levers and the three regulatory constraints. This implies that there may be other very relevant indicators that have not been identified. However, careful attention will be needed before selecting any new indicator, especially to its ease of use so that it can be effectively used in the design phase;
- Difficulty in obtaining the detailed EoL information needed to use the indicators.
- The data used to assess the compatibility and recyclability of materials needs to be updated as constantly as possible (for the analysis to best reflect the reality of the recycling chains).
- The recyclability analysis on the Fairphone 2® only considered the phone itself. Accessories (such as USB cable, charger, and headphones) were not part of the scope of the study.
- The first perspective is related to the fact that the indicators linking the design for EoL guidelines have only been confronted with the Fairphone 2®. Therefore, the next step is to test the set of indicators on other “non-modular” smartphones and verify that similar results are obtained.
- Finally, we believe that the development of a digital platform connected to design software would allow capitalizing on all the expertise developed in this work. The objective is to allow designers to better understand the proposed tools throughout the design process. Such a platform would also ensure the availability and updating of the technical, economic, and environmental databases gathered to feed the data of the current and future studies.
4.2. Design from Recycling Proposition
- Difficult access to information (especially environmental data).
- The technical, economic, and environmental data used to assess the convenience indicators needs to be constantly updated.
- No consideration of the impact of the decrease in the purity of the materials. On the one hand, this loss conditions the resale market of the material (which might be purely and simply unsaleable), and on the other hand, it might impact the technical performance of the product.
- The convenience of using a recycled material may change over time, so it cannot be reduced to a one-time analysis. A dynamic assessment is thus needed. The economic convenience is a good example, as it may fluctuate over time due to the availability of the metals. Indeed, knowing that smart device production is rising every year and that our planet has a limited reserve of rare-earth and precious metals, it is foreseeable that the price of some metals will increase over time.
- The convenience assessment does not take into account either the economic or environmental impact of the whole production. Indeed, a slight cost reduction can induce sometimes a big save when the whole production is considered. The same happens for environmental impacts, and therefore this can be a decisive factor for the designer.
- The approach has only been tested on one material to show above all the interest of this type of approach. The first perspective would be to first conduct further tests on the same material, and then on others in a second step. However, it should be noted that the approach can only be fully validated when facing a real situation within a company.
- The possible deterioration of the technical performance of the product caused by the decrease in the purity of the materials should be included in the technical convenience assessment.
- The environmental and economic impact of the whole production and the associated savings should also be included in their respective convenience assessment.
- As with the design-for-EoL approach, the development of a digital platform integrated into the design process is necessary to capitalize on the approach on the one hand and to consolidate and update databases on the other hand.
5. Conclusions
- On the one hand, the design-for-recycling proposition allows identifying the product characteristics that are the least performant (concerning recycling) and proposes the most accurate design guidelines to improve them.
- On the other hand, the design-from-recycling proposition allows the convenience of using recycled materials within a technical, economic and environmental point of view to be easily and objectively assessed. A global score is also proposed to simplify decision making.
Author Contributions
Funding
Acknowledgments
Conflicts of Interest
References
- Bortone, I.; Chianese, S.; Erto, A.; Di Nardo, A.; De Crescenzo, C.; Karatza, D.; Santonastaso, G.F.; Musmarra, D. An optimized configuration of adsorptive wells for the remediation of an aquifer contaminated by multiple aromatic hydrocarbon pollutants. Sci. Total Environ. 2019, 696, 133731. [Google Scholar] [CrossRef]
- Bolan, N.; Sarkar, B.; Yan, Y.; Li, Q.; Wijesekara, H.; Kannan, K.; Tsang, D.C.W.; Schauerte, M.; Bosch, J.; Noll, H.; et al. Remediation of poly- and perfluoroalkyl substances (PFAS) contaminated soils—To mobilize or to immobilize or to degrade? J. Hazard. Mater. 2021, 401, 123892. [Google Scholar] [CrossRef] [PubMed]
- European Parliament. Directive 2008/98/EC of the European Parliament and of the Council on Waste and Repealing Certain Directives. EUR-Lex. 2008. Available online: https://eur-lex.europa.eu/legal-content/EN/TXT/?uri=CELEX%3A32008L0098&qid=1606197537028 (accessed on 24 November 2020).
- European Parliament. Directive 2009/125/EC of the European Parliament and of the Council of 21 October 2009 Establishing a Framework for the Setting of Ecodesign Requirements for Energy-Related Products. EUR-Lex. 2009. Available online: https://eur-lex.europa.eu/eli/dir/2009/125/oj (accessed on 24 November 2020).
- European Parliament. Directive 2012/19/EU of the European Parliament and of the Council on Waste Electrical and Electronic Equipment (WEEE). EUR-Lex. 2012. Available online: https://eur-lex.europa.eu/legal-content/EN/TXT/?uri=celex%3A32012L0019 (accessed on 24 November 2020).
- Martínez Leal, J. Développement d’outils d’aide à la décision en conception pilotés par l’analyse multicritère de la valorisabilité du produit et l’outillage des lignes directrices d’écoconception pour la fin de vie; École Nationale Supérieure d’Arts et Métiers: Bordeaux, France, 2019; Available online: https://pastel.archives-ouvertes.fr/tel-02939064 (accessed on 15 September 2020).
- Maudet, C.; Bertoluci, G.; Froelich, D. Integrating Plastic Recycling Industries into the Automotive Supply Chain. 2007. Available online: https://hal.archives-ouvertes.fr/hal-00719227 (accessed on 21 August 2020).
- Mathieux, F. Contribution à l’intégration de la valorisation en fin de vie dès la conception d’un produit. une méthode basée sur l’évaluation multicritères de la recyclabilité du produit et sur l’identification de ses points faibles de conception. Ph.D. Thesis, Arts et Métiers ParisTech, Chambéry, France, 2002. Available online: https://tel.archives-ouvertes.fr/tel-00005689/document (accessed on 23 September 2016).
- Martínez Leal, J.; Charbuillet, C.; Pompidou, S.; Perry, N. Recycling Chains: A Proposal for an Exhaustive Definition. In Proceedings of the 10th International Conference on Society & Materials, SAM10, Rome, Italy, 9–10 May 2016; Available online: https://hal.archives-ouvertes.fr/hal-01500922 (accessed on 3 April 2017).
- Rousseaux, P.; Gremy-Gros, C.; Bonnin, M.; Henriel-Ricordel, C.; Bernard, P.; Floury, L.; Staigre, G.; Vincent, P. “Eco-tool-seeker”: A new and unique business guide for choosing ecodesign tools. J. Clean. Prod. 2017, 151, 546–577. [Google Scholar] [CrossRef] [Green Version]
- Leal, J.M.; Pompidou, S.; Charbuillet, C.; Perry, N. Product Recoverability: A Review of Assessment Methods. Procedia CIRP 2018, 69, 710–715. [Google Scholar] [CrossRef]
- Go, T.F.; Wahab, D.A.; Hishamuddin, H. Multiple generation life-cycles for product sustainability: The way forward. J. Clean. Prod. 2015, 95, 16–29. [Google Scholar] [CrossRef]
- Pôle Éco-Conception. Fascicule de conception pour l’intégration de la pensée fin de vie. 2015. Available online: http://www.eco-conception.fr/articles/nouveau-document--fascicule-de-conception-pour-lintegration-de-la-pensee-fin-de-vie.html (accessed on 13 May 2016).
- Dombrowski, U.; Schmidt, S.; Schmidtchen, K. Analysis and Integration of Design for X Approaches in Lean Design as basis for a Lifecycle Optimized Product Design. Procedia CIRP 2014, 15, 385–390. [Google Scholar] [CrossRef] [Green Version]
- Dowie, T.; Simon, M. Guidelines for Designing for Disassembly and Recycling; Manchester Metropolitan University: Manchester, UK, 1994. [Google Scholar]
- Vezzoli, C.; Manzini, E. Design for Environmental Sustainability; Springer: London, UK, 2008; ISBN 978-1-84800-162-6. [Google Scholar]
- Wimmer, W.; Züst, R. ECODESIGN Pilot: Product Investigation, Learning and Optimization Tool for Sustainable Product Development with CD-ROM; Alliance for Global Sustainability Bookseries; Springer: Dordrecht, The Netherlands, 2001; ISBN 978-1-4020-0965-5. Available online: https://docplayer.net/12541797-Guidelines-for-designing-for-disassembly-and-recycling.html (accessed on 24 November 2020).
- Kriwet, A.; Zussman, E.; Seliger, G. Systematic integration of design-for-recycling into product design. Int. J. Prod. Econ. 1995, 38, 15–22. [Google Scholar] [CrossRef]
- Masanet, E.; Auer, R.; Tsuda, D.; Barillot, T.; Baynes, A. An assessment and prioritization of “design for recycling” guidelines for plastic components. In Proceedings of the Conference Record 2002 IEEE International Symposium on Electronics and the Environment (Cat. No.02CH37273), San Francisco, CA, USA, 6–9 May 2002; pp. 5–10. [Google Scholar]
- Pahl, G.; Beitz, W.; Feldhusen, J.; Grote, K.-H.; Wallace, K.; Blessing, L.T. (Eds.) Engineering Design: A Systematic Approach, 3rd ed.; Springer: London, UK, 2007; ISBN 978-1-84628-319-2. [Google Scholar]
- Reuter, M.A.; van Schaik, A. Product-Centric Simulation-Based Design for Recycling: Case of LED Lamp Recycling. J. Sustain. Metall. 2015, 1, 4–28. [Google Scholar] [CrossRef] [Green Version]
- Parlement Européen; Conseil de l’Union Européenne. Directive 2009/125/CE Établissant un cadre pour la fixation d’exigences en matière d’écoconception applicables aux produits liés à l’énergie. EUR-Lex. 2009. Available online: https://eur-lex.europa.eu/eli/dir/2009/125/oj (accessed on 24 November 2020).
- Parlement Européen; Conseil de l’Union Européenne. Directive 2005/64/CE Concernant la réception par type des véhicules à moteur au regard des possibilités de leur réutilisation, de leur recyclage et de leur valorisation, et en modifiant la Directive 70/156/CEE du Conseil. EUR-Lex. 2005. Available online: https://eur-lex.europa.eu/legal-content/FR/TXT/PDF/?uri=CELEX:32005L0064&from=ET (accessed on 24 November 2020).
- Maurin, M. Pour une construction formelle d’indice global agrégé en pollution de l’air. 2007. Available online: https://www.researchgate.net/publication/238735605_Pour_une_construction_formelle_d%27indice_global_agrege_en_pollution_de_l%27air (accessed on 24 November 2020).
- Ishii, K.; Eubanks, C.F.; Di Marco, P. Design for product retirement and material life-cycle. Mater. Des. 1994, 15, 225–233. [Google Scholar] [CrossRef]
- Qian, X.; Yu, Y.; Zhang, H.C. A semi-quantitative methodology of environmentally conscious design for electromechanical products. In Proceedings of the 2001 IEEE International Symposium on Electronics and the Environment. 2001 IEEE ISEE (Cat. No.01CH37190), Denver, CO, USA, 9 May 2001; pp. 156–160. [Google Scholar]
- De Aguiar, J.; de Oliveira, L.; da Silva, J.O.; Bond, D.; Scalice, R.K.; Becker, D. A design tool to diagnose product recyclability during product design phase. J. Clean. Prod. 2017, 141, 219–229. [Google Scholar] [CrossRef]
- Dostatni, E.; Diakun, J.; Grajewski, D.; Wichniarek, R.; Karwasz, A. Multi-agent system to support decision-making process in design for recycling. Soft Comput. 2016, 20, 4347–4361. [Google Scholar] [CrossRef] [Green Version]
- Rzeźnik, C.; Rybacki, P.; Molińska, A. Assessment of the effect of the material diversity of agricultural machines on their recyclability. J. Res. Appl. Agric. Eng. 2008, 53, 12–15. [Google Scholar]
- Martínez Leal, J.; Pompidou, S.; Charbuillet, C.; Perry, N. Efficacité potentielle de valorisation (Proposition d’indicateurs à l’usage du concepteur pour mieux prendre en compte l’efficacité des voies de traitement du produit en fin de vie). In Les Enjeux D’écoconception en Économie Circulaire; Presse des MINES: Paris, France, 2019. [Google Scholar]
- Horta Arduin, R.; Grimaud, G.; Martínez Leal, J.; Pompidou, S.; Charbuillet, C.; Laratte, B.; Alix, T.; Perry, N. Influence of scope definition in recycling rate calculation for European e-waste extended producer responsibility. Waste Manag. 2019, 84, 256–268. [Google Scholar] [CrossRef] [PubMed]
- Grimaud, G. Conception des scénarios de recyclage pilotée par l’évaluation des performances des procédés; École Nationale Supérieure d’Arts et Métiers: Bordeaux, France, 2019; Available online: https://pastel.archives-ouvertes.fr/tel-02067670 (accessed on 19 August 2019).
- Gan, X.; Fernandez, I.C.; Guo, J.; Wilson, M.; Zhao, Y.; Zhou, B.; Wu, J. When to use what: Methods for weighting and aggregating sustainability indicators. Ecol. Indic. 2017, 81, 491–502. [Google Scholar] [CrossRef]
- Kararach, G.; Nhamo, G.; Mubila, M.; Nhamo, S.; Nhemachena, C.; Babu, S. Reflections on the Green Growth Index for Developing Countries: A focus of selected African countries. Dev. Policy Rev. 2017, 36. [Google Scholar] [CrossRef]
- ADEME. Les filières à responsabilité élargie du producteur: Panorama; ADEME: Angers, France, 2017; ISBN 979-10-297-0750-6. [Google Scholar]
- ADEME; France Nature Environnement. Les impacts du smartphone—Un téléphone pas si «smart» pour l’environnement; ADEME: Angers, France, 2019. [Google Scholar]
- Fairphone Transparency: A Mission and a Challenge, Fairphone. 2013. Available online: https://www.fairphone.com/es/2013/07/26/transparency-a-mission-and-a-challenge/ (accessed on 21 September 2019).
- Fraunhofer IZM. Life Cycle Assessment of the Fairphone 2; Fraunhofer IZM, 2016. Available online: https://www.researchgate.net/publication/311425397_Life_Cycle_Assessment_of_the_Fairphone_2 (accessed on 20 June 2019).
- Fairphone. What are the Technical Specifications of the Fairphone 2? Support. 2019. Available online: http://support.fairphone.com/hc/en-us/articles/203478389-What-are-the-technical-specifications-of-the-Fairphone-2- (accessed on 22 September 2019).
- Fairphone. Impact Report Vol. 1. 2018. Available online: https://www.fairphone.com/wp-content/uploads/2018/11/Fairphone_Report_DEF_WEB.pdf (accessed on 24 November 2020).
- Fairphone. European Patent Application; EP 3 104 250 A1; European Patent Office: Rijswijk, The Netherlands, 2016. [Google Scholar]
- Güvendik, M. From Smartphone to Futurephone: Assessing the Environmental Impacts of Different Circular Economy Scenarios of a Smartphone Using LCA. 2014. Available online: https://www.semanticscholar.org/paper/From-Smartphone-to-Futurephone%3A-Assessing-the-of-of-G%C3%BCvendik/a16cae3a30286796b2e3c0c9befeebaf89b5cc0b (accessed on 24 November 2020).
- Hiraki, T.; Takeda, O.; Nakajima, K.; Matsubae, K.; Nakamura, S.; Nagasaka, T. Thermodynamic criteria for the removal of impurities from end-of-life magnesium alloys by evaporation and flux treatment. Sci. Technol. Adv. Mater. 2011, 12, 035003. [Google Scholar] [CrossRef] [PubMed]
- Reck, B.K.; Graedel, T.E. Challenges in Metal Recycling. Science 2012, 337, 690–695. [Google Scholar] [CrossRef] [PubMed]
- Reuter, M. Challenges of Metal Recycling. Materia 2012, 50–57. Available online: https://www.researchgate.net/publication/270048511_Challenges_of_Metal_Recycling (accessed on 24 November 2020).
- Reuter, M.; Schaik, A.; Ballester, M. Limits of the Circular Economy: Fairphone Modular Design Pushing the Limits. World Metall. ERZMETALL 2018, 71, 68–79. [Google Scholar]
- Maier, C. Design Guides for Plastics; Econology Ltd., 2009. Available online: https://www.tangram.co.uk/Design%20Guides%20for%20Plastics.PDF (accessed on 24 November 2020).
- Eco3e Plastics. 2016. Available online: http://eco3e.eu/en/base/plastics/ (accessed on 3 October 2019).
- Safran, B.; Hugrel, C.; Palluau, M. ICV de la gestion en fin de vie des matériaux constitutifs des Équipements Électriques et Électroniques. 2017. Available online: https://www.ademe.fr/icv-gestion-fin-vie-materiaux-constitutifs-equipements-electriques-electroniques-cadre-filiere-agreee-deee (accessed on 24 November 2020).
- Fairphone. Fairphone’s Report on Recyclability. 2017. Available online: https://www.fairphone.com/wp-content/uploads/2017/02/FairphoneRecyclabilityReport022017.pdf (accessed on 24 November 2020).
- Ardente, F.; Mathieux, F.; Talens Peiró, L.; European Commission; Joint Research Centre; Institute for Environment and Sustainability. Environmental Footprint and Material Efficiency Support for Product Policy: Report on Benefits and Impacts/Costs of Options for Different Potential Material Efficiency Requirements for Electronic Displays; Publications Office: Luxembourg, 2013; ISBN 978-92-79-33255-5. [Google Scholar]
- Vanegas, P.; Peeters, J.R.; Cattrysse, D.; Tecchio, P.; Ardente, F.; Mathieux, F.; Dewulf, W.; Duflou, J.R. Ease of disassembly of products to support circular economy strategies. Resour. Conserv. Recycl. 2018, 135, 323–334. [Google Scholar] [CrossRef] [PubMed]


| Level | |
|---|---|
| Compatible | 1.0 |
| Limited compatibility | 0.5 |
| Compatible in small quantities | 0.25 |
| Not compatible | 0.0 |
| No information | 0.25 |
| Scope | Action Lever | Guidelines |
|---|---|---|
| Product | Complexity | Minimize the number of components |
| Modularity | Make the product as modular as possible (with material separation) | |
| Disassemblability | Reduce time and number of disassembly steps | |
| Increase the linearity of the disassembly sequence | ||
| Minimize divergence in the dismantling sequence order | ||
| Homogenize the principles of assembly and disassembly | ||
| Design the product so that it can be easily transported after use (i.e., allowing for pre-disassembly) | ||
| Components | Identifiability | Components containing non-recyclable, non-compatible, toxic, valuable, rare, and critical materials must be easily identified |
| Accessibility | Components containing non-recyclable, non-compatible, toxic, valuable, rare, and critical materials must be easily accessible | |
| Disassemblability | Components containing non-recyclable, non-compatible, toxic, valuable, rare, and critical materials must be easily removed | |
| Where the materials of inseparable parts or sub-assemblies are not compatible, ensure that they are easily separable | ||
| Design parts for disassembly stability | ||
| Materials | Diversity | Minimize the number of different types of materials |
| Avoid the mixing of materials in assemblies | ||
| Monomaterial strategy. Favor using a single material per product or sub-assembly | ||
| Compatibility | Use compatible materials (that can be recycled together) in the product or sub-assembly | |
| Use fasteners made of a material compatible with the other parts | ||
| Recyclability | Use recyclable materials | |
| Choose materials that can easily recover their original properties after recycling | ||
| Use of recycled materials | Use recycled materials | |
| Toxicity | Avoid or reduce the use of substances, materials, or components harmful to humans or the environment | |
| Circularity | Design considering the secondary use of recycled materials | |
| Fasteners | Complexity | Minimize the number of fasteners |
| Diversity | Minimize the number of different types of fasteners | |
| Identifiability | Fasteners must be easily identified | |
| Accessibility | Fasteners must be easily accessible (including the space for the disassembly tool) | |
| Disassemblability | Fasteners must be easily removed | |
| Diversity | Minimize the required number of fastener disassembly tools | |
| Standardisation | Promote the use of standard disassembly tools | |
| Durability | Protect fasteners from corrosion and wear | |
| Cables and connectors | Complexity | Minimize the number and length of interconnecting wires or cables |
| Marking and labelling | Identification | Standardized coding and marking of materials to facilitate their identification (especially plastic parts) |
| Standardized labelling of products and components on recyclability, incompatibility, and/or toxicity so that they can be easily identified from recyclables and waste streams | ||
| Eliminate labels incompatible with end-of-life treatment | ||
| Place identification elements in visible locations | ||
| Information | Communication | Provide useful processing-related information |
| Provide information to the user on how the product or its parts are to be disposed of |
| Scope | Validation Tool | Regulatory Constraints |
|---|---|---|
| Product | Reusability and recyclability rate | Potentially reusable and recyclable mass percentage of a new product |
| Recoverability rate | Potentially recoverable mass percentage of a new product | |
| Materials | Maximum allowed concentration | Restrictions on the use of certain hazardous substances in products |
| Scenario | |
|---|---|
| The recycled material supplier complies with the purchasing department criteria | 1 |
| The recycled material supplier does not comply with the purchasing department criteria | 0 |
| Compatibility | ||||
|---|---|---|---|---|
| PC (polycarbonate) | 0.59 | 0.63 | 0.63 | 0.54 |
| PE (polyethylene) | 0.50 | 0.44 | 0.44 | |
| PVC (polyvinyl chloride) | 0.44 | 0.44 | 0.44 | |
| TPU (thermoplastic polyurethane) | 0.63 | 0.88 | 0.88 | |
| PC Mix (PC + glass fibre) | 0.69 | 0.28 | 0.28 | |
| PA Mix (PA + glass fibre) | 0.44 | 0.25 | 0.25 | |
| Other plastics (COC, PSU et PBT *) | 0.50 | 0.69 | 0.69 | |
| Undefined plastic (ABS *) | 0.69 | 0.88 | 0.69 |
| Materials | Materials | |||
|---|---|---|---|---|
| Stainless steel | 0.99 | Pr (praseodymium) | 0.00 | 0.29 |
| Fe (iron) | 0.70 | PC (polycarbonate) | 0.95 | |
| Ag (silver) | 0.80 | PE (polyethylene) | 0.00 | |
| Al (aluminium) | 0.10 | PVC (polyvinyl chloride) | 0.00 | |
| Au (gold) | 0.90 | TPU (thermoplastic polyurethane) | 0.00 | |
| Co (cobalt) | 0.80 | PC Mix (PC + glass fibre) | 0.00 | |
| Cu (copper) | 0.90 | PA Mix (PA + glass fibre) | 0.00 | |
| Cr (chrome) | 0.00 | Other plastics (COC, PSU et PBT *) | 0.00 | |
| Mg (magnesium) | 0.90 | Undefined plastic (ABS *) | 0.95 | |
| Mn (manganese) | 0.00 | Rubber | 0.00 | |
| Ni (nickel) | 0.80 | Epoxy | 0.00 | |
| Pb (lead) | 0.00 | Polyimide (PI) | 0.00 | |
| Pd (palladium) | 0.00 | Liquid crystal polymer (LCP) | 0.00 | |
| Pt (platinum) | 0.90 | Glass | 0.00 | |
| Si (silicon) | 0.00 | Graphite | 0.00 | |
| Sn (tin) | 0.60 | ITO Layer | 0.64 | |
| W (tungsten) | 0.00 | Liquid crystal | 0.00 | |
| Zn (zinc) | 0.00 | LCO | 0.81 | |
| Gd (gadolinium) | 0.00 | LiPF6 | 0.00 | |
| Nd (neodymium) | 0.00 | Others | 0.00 |
| PC | 0.85 | 1.00 | 1.15 |
| PC | 0.82 |
| Impact Category | Indicator | Units | ||||
|---|---|---|---|---|---|---|
| Climate change | GWP | kg CO2 eq | 0.20 | 1.29 | ||
| Resource depletion | ADP (elements) | kg Sb eq | 4.75 | |||
| ADP (fossils) | MJ | 0.14 | ||||
| Human toxicity | Humantox | kg DCB eq | 1.31 | |||
| Ecotoxicity | Ecotox | kg DCB eq | 0.03 |
| Technical Convenience | Economic Convenience | Environmental Convenience | Use Convenience | |
|---|---|---|---|---|
| PC | 1.15 | 0.82 | 1.29 | 1.09 |
Publisher’s Note: MDPI stays neutral with regard to jurisdictional claims in published maps and institutional affiliations. |
© 2020 by the authors. Licensee MDPI, Basel, Switzerland. This article is an open access article distributed under the terms and conditions of the Creative Commons Attribution (CC BY) license (http://creativecommons.org/licenses/by/4.0/).
Share and Cite
Martínez Leal, J.; Pompidou, S.; Charbuillet, C.; Perry, N. Design for and from Recycling: A Circular Ecodesign Approach to Improve the Circular Economy. Sustainability 2020, 12, 9861. https://doi.org/10.3390/su12239861
Martínez Leal J, Pompidou S, Charbuillet C, Perry N. Design for and from Recycling: A Circular Ecodesign Approach to Improve the Circular Economy. Sustainability. 2020; 12(23):9861. https://doi.org/10.3390/su12239861
Chicago/Turabian StyleMartínez Leal, Jorge, Stéphane Pompidou, Carole Charbuillet, and Nicolas Perry. 2020. "Design for and from Recycling: A Circular Ecodesign Approach to Improve the Circular Economy" Sustainability 12, no. 23: 9861. https://doi.org/10.3390/su12239861