An Optimal Metro Design for Transit Networks in Existing Square Cities Based on Non-Demand Criterion


Abstract
:1. Introduction
- (1)
- How to design a ring-radial network in existing square cities
- (2)
- How to identify the passenger transfer between stations
- (3)
- How to measure passenger transfer’s effects on the metro network design of both models
- (4)
- How to minimize passenger transfers and increase the cost–benefit ratio
2. Literature Review
3. Input Data, Models, and Assumptions
- Introducing a mathematical formulation for determining the PTN of the metro transit network.
- Obviating the combinatorial complexity of transit routing with an efficient, straightforward scheme of design.
- Presenting the mathematical notations in a general framework, which gives the possibility of generalizing the methodology in other studies or even using it as a subroutine in presenting more sophisticated methodologies.
- Developing an exclusive non-demand criterion of metro network design, unlike reviewed studies where they all are demand-oriented.
3.1. Network Representation
3.2. Transfers in Transit Networks
3.3. Objective Function
4. Metro Models Concept
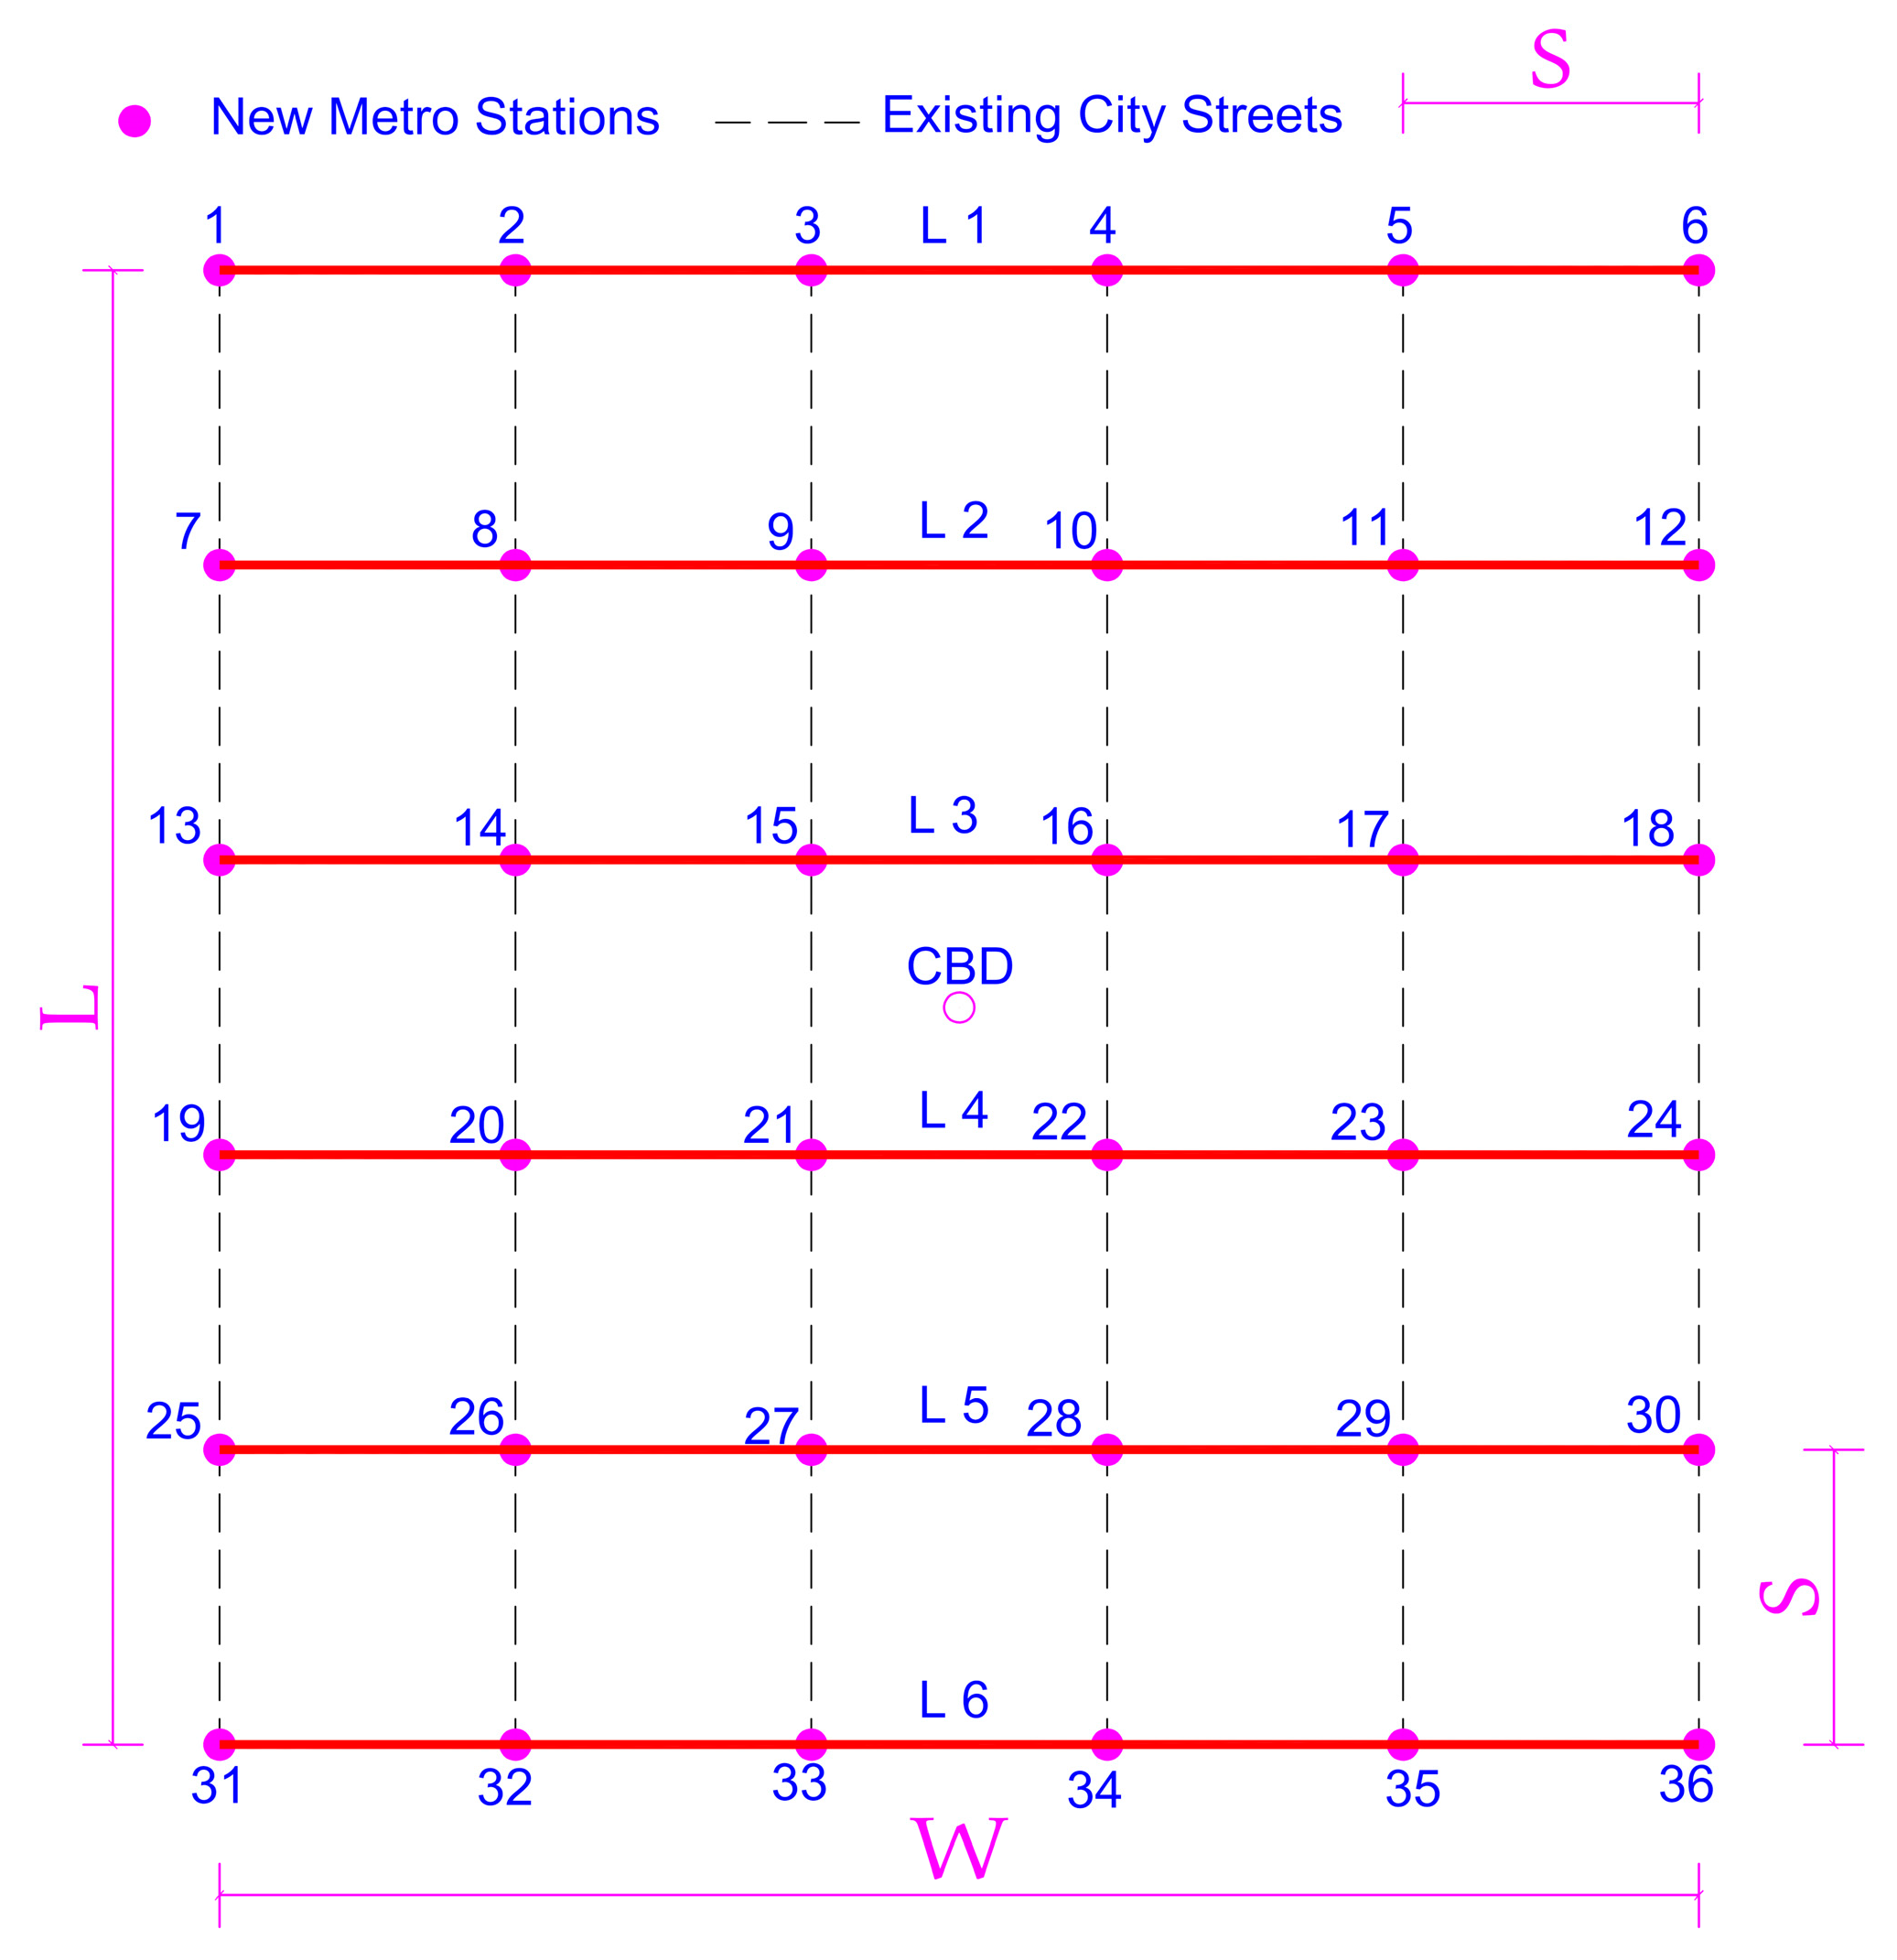
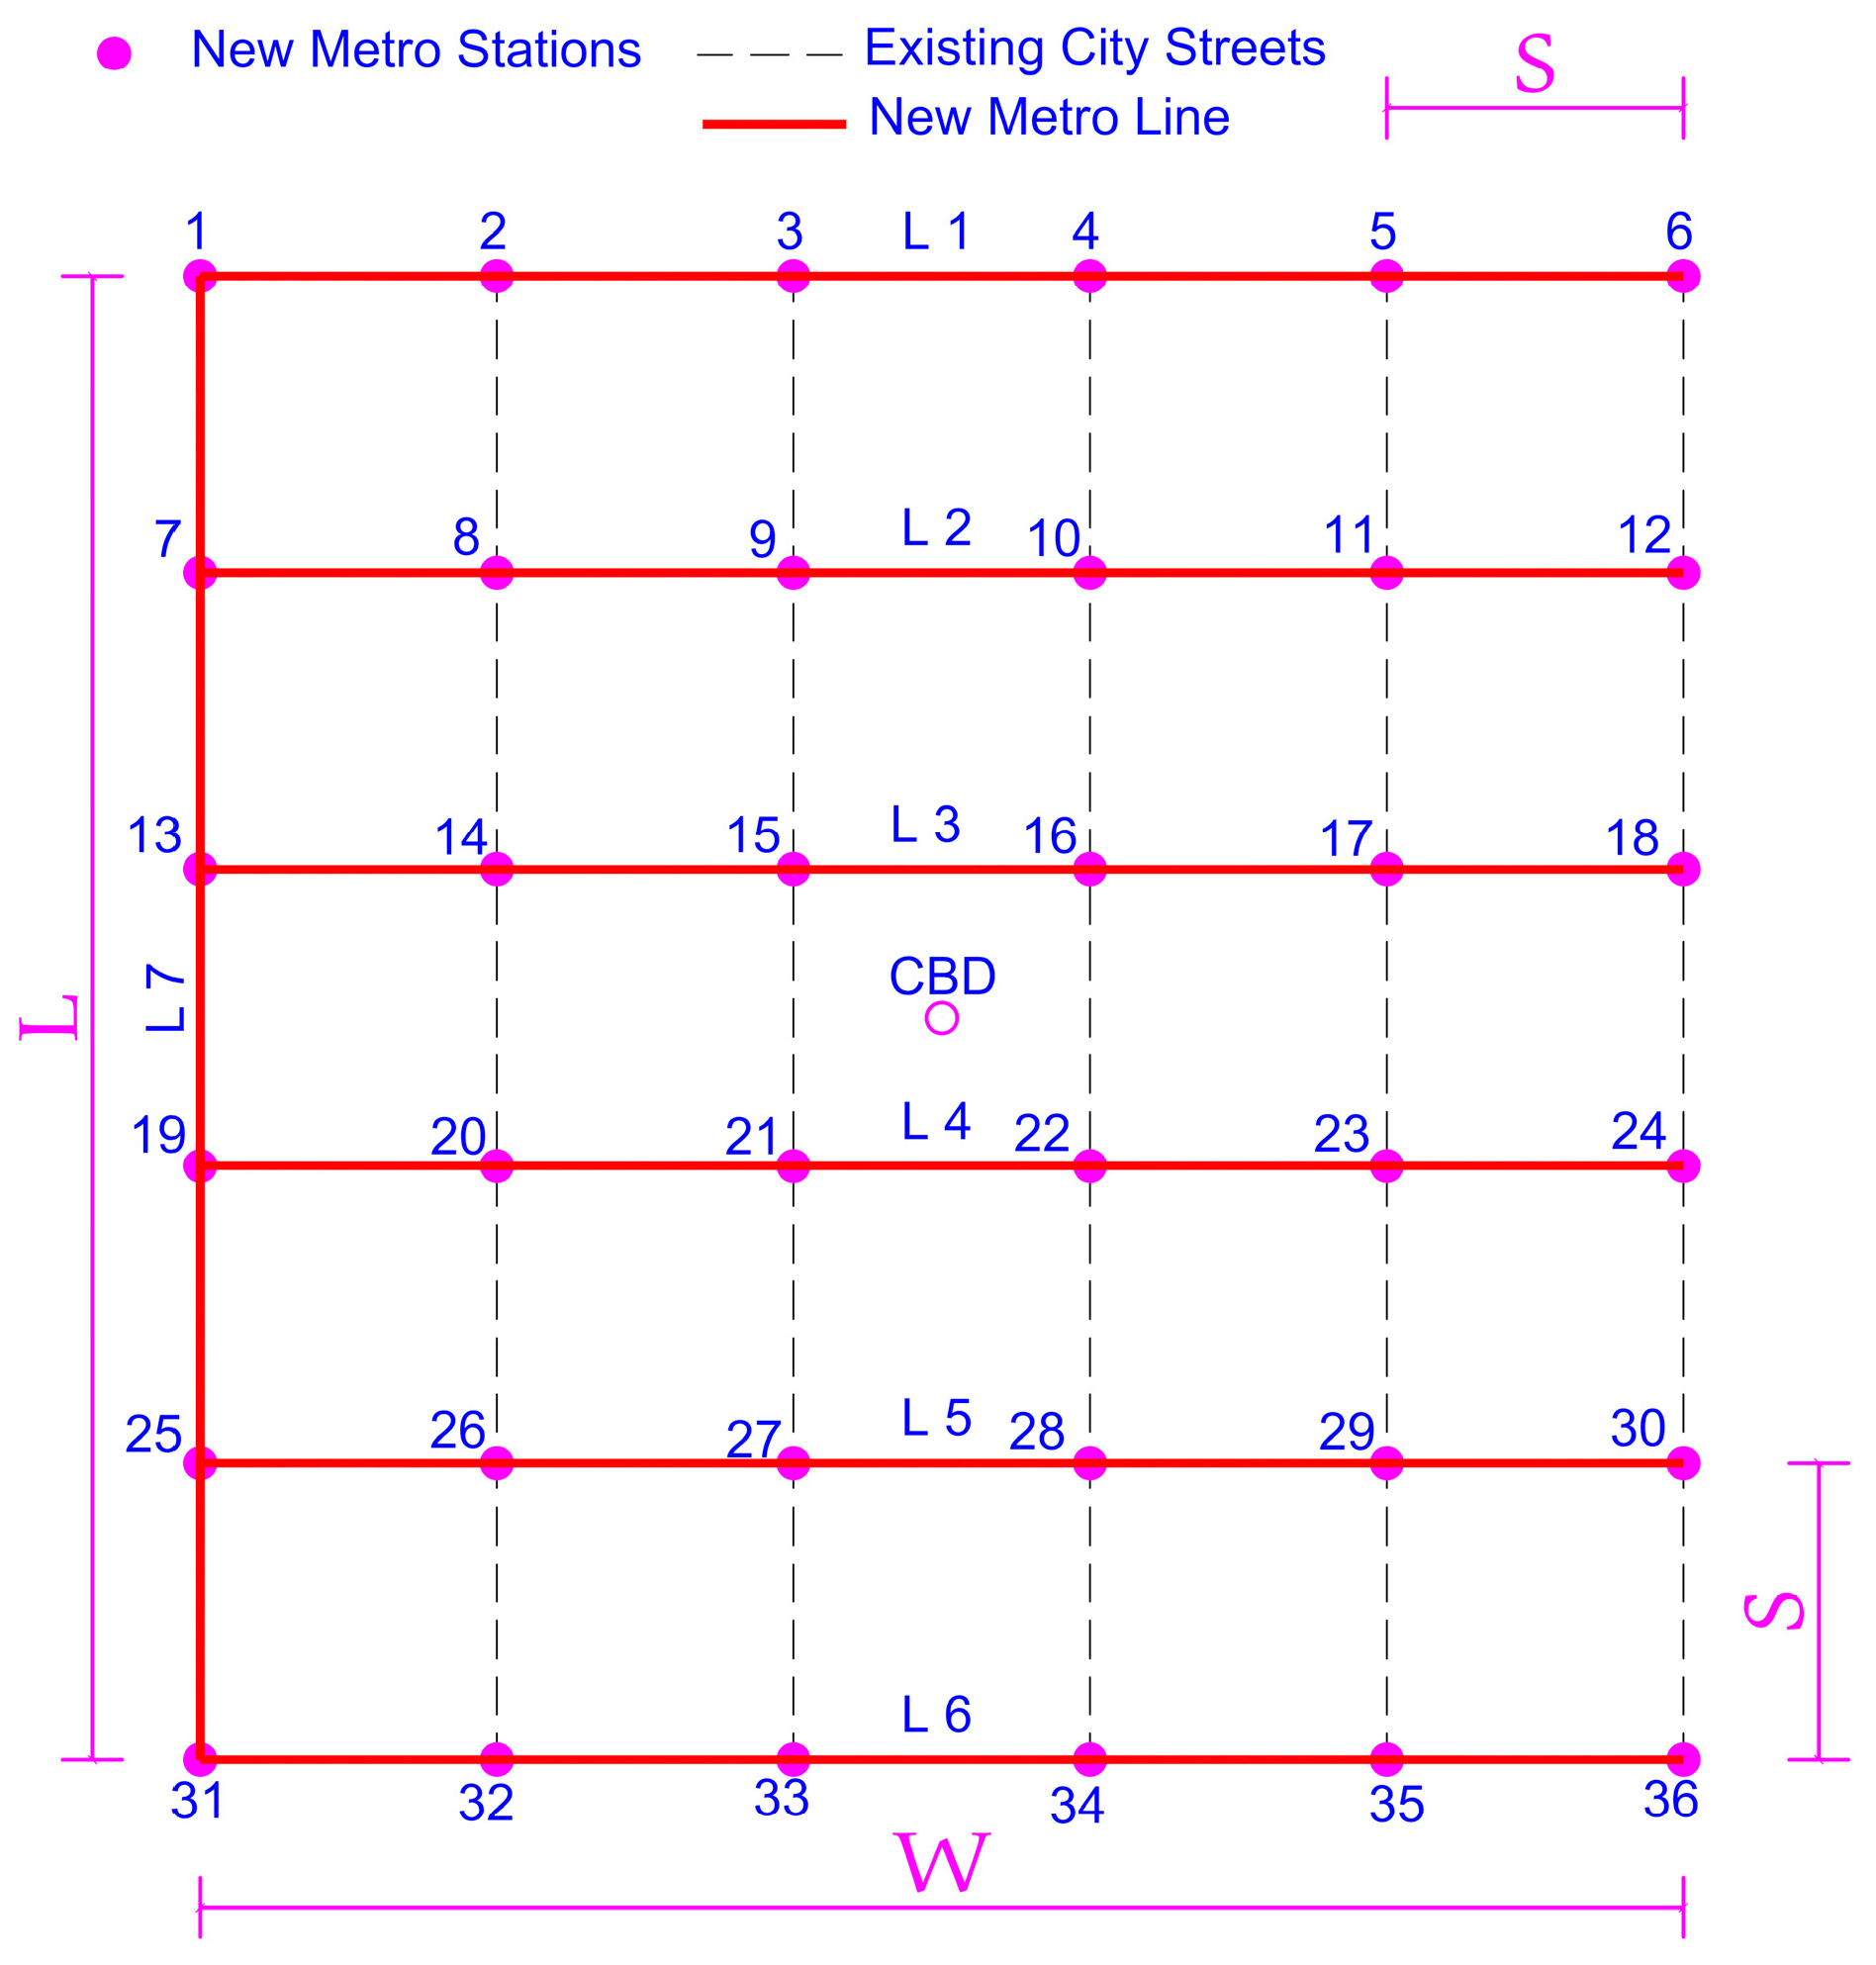
4.1. Case Study
- Stations’ locations are fixed positions in main street intersections, as similar in existing cities.
- Existing street spacing (S) is equal to a distance unit (1 km).
- Zone traffic area is assumed to be between existing streets and equal to an area unit (1 km2)
4.2. Metro Network Structure
5. The Analytical Model of Design
- Phase #1:
- Make an assessment and analysis of the existing metro according to different PTN structures.
- Phase #2:
- Obtain the passenger transfer matrix of both models.
- Phase #3:
- Show the efficiency of the PTN criterion as a means of design to select the optimal metro network.
5.1. Assessment of the Transit Network
5.2. Passenger Transfer Matrix of Both Models
- When getting the transfer matrix, the combination of stops in one line is set to 0 if passengers can reach one another without transfer (TS0).
- For other combinations of stops, if they have common stations, the transfer matrix is set to 1, which means that the number of transfer is 1 (TS1).
- If one line doesn’t have common stops with another, we should check whether these stops have common stops with the other lines (TS2) or are unserved (TS∞).
- Existing streets were already constructed.
- New proposed metro lines were constructed under existing streets as far as possible.
- The new proposed station must be in the existing street intersection.
5.3. Capital Cost of Metro Lines
- CT
- Capital cost for twin tunnel (2020-prices) (million per km-US$)
- CMin.
- Minimum limit of capital cost (million per km-US$)
- CMax
- Maximum limit of capital cost (million per km-US$)
- Cavg
- Average capital cost (million per km-US$)
- DT
- External diameter of twin tunnel (m)
- ζ
- Tunneling ratio (%)
5.4. Accuracy of the Approximation Formula
6. Results and Discussion
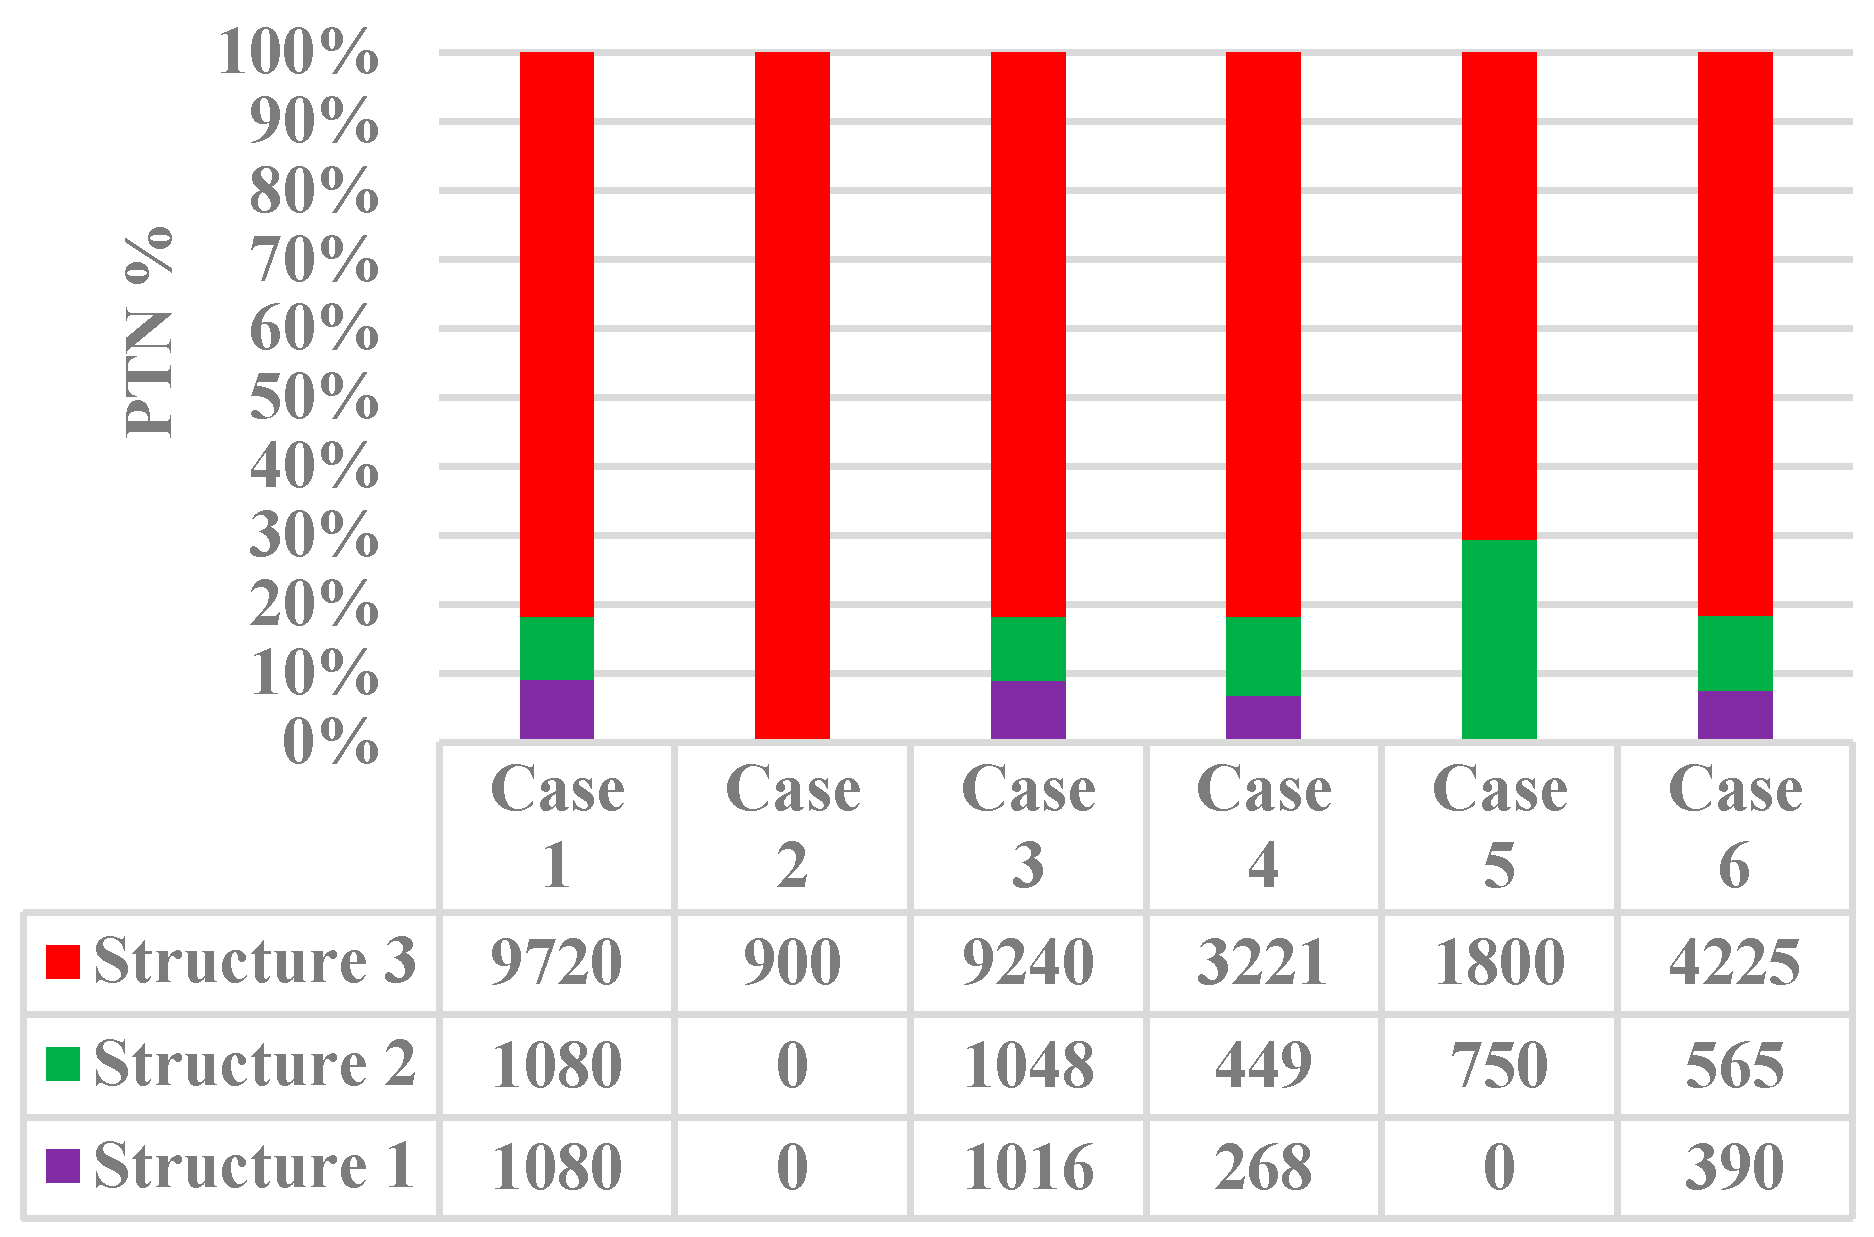
6.1. Transfer Numbers Distribution of Transit Network
6.2. Cost–Benefit Ratio (CBR)
6.3. Discussion
- Increasing direct trips between the stations.
- Overall PTN reduction.
- Benefit–cost ratio.
- Minimize passenger transfers between origin and destination, which leads to minimizing travel time.
- Minimize the total construction cost of metro lines by considering the cost–benefit ratio.
7. Conclusions
Author Contributions
Funding
Conflicts of Interest
References
- Sun, H.; Wu, J.; Ma, H.; Yang, X.; Gao, Z. A bi-objective timetable optimization model for urban rail transit based on the time-dependent passenger volume. IEEE Trans. Intell. Transp. Syst. 2018, 20, 604–615. [Google Scholar] [CrossRef]
- Zhao, P.; Hu, H. Geographical patterns of traffic congestion in growing megacities: Big data analytics from Beijing. Cities 2019, 92, 164–174. [Google Scholar] [CrossRef]
- Aziz, O.; Farooq, M.S.; Abid, A.; Saher, R.; Aslam, N. Research Trends in Enterprise Service Bus (ESB) Applications: A Systematic Mapping Study. IEEE Access 2020, 8, 31180–31197. [Google Scholar] [CrossRef]
- Hu, Y.; Zhang, Q.; Wang, W. A model layout region optimization for feeder buses of rail transit. Procedia-Soc. Behav. Sci. 2012, 43, 773–780. [Google Scholar] [CrossRef] [Green Version]
- Umlauf, T. Sustainable Public Transportation in Large Cities: Demand Estimation. Master’s Thesis, Department of Civil Engineering, The University of Texas at El Paso, El Paso, TX, USA, May 2014. [Google Scholar]
- Owais, M.; Osman, M.K.; Moussa, G. Multi-objective transit route network design as set covering problem. IEEE Trans. Intell. Transp. Syst. 2015, 17, 670–679. [Google Scholar] [CrossRef]
- Canca, D.; De-Los-Santos, A.; Laporte, G.; Mesa, J.A. The railway rapid transit network construction scheduling problem. Comput. Ind. Eng. 2019, 138, 106075. [Google Scholar] [CrossRef]
- Badia, H.; Estrada, M.; Robuste, F. Competitive transit network design in cities with radial street patterns. Transp. Res. Part B Methodol. 2014, 59, 161–181. [Google Scholar] [CrossRef]
- Chen, H.; Gu, W.; Cassidy, M.J.; Daganzo, C.F. Optimal transit service atop ring-radial and grid street networks: A continuum approximation design method and comparisons. Transp. Res. Part B Methodol. 2015, 81, 755–774. [Google Scholar] [CrossRef] [Green Version]
- Dickinson, R.E. The West European City: A Geographical Interpretation; Taylor & Francis Group: London, UK, 2003; Volume 179. [Google Scholar]
- Kevin, L.; Hack, G. Site Planning; The MIT Press: Cambridge, MA, USA, 1962. [Google Scholar]
- Daganzo, C.F. Structure of competitive transit networks. Transp. Res. Part B Methodol. 2010, 44, 434–446. [Google Scholar] [CrossRef] [Green Version]
- Owais, M.; Hassan, T. Incorporating dynamic bus stop simulation into static transit assignment models. Int. J. Civ. Eng. 2018, 16, 67–77. [Google Scholar] [CrossRef]
- Mandl, C.E. Evaluation and optimization of urban public transportation networks. Eur. J. Oper. Res. 1980, 5, 396–404. [Google Scholar] [CrossRef]
- Owais, M. Issues related to transit network design problem. Int. J. Comput. Appl. 2015, 120. [Google Scholar] [CrossRef] [Green Version]
- Musso, A.; Vuchic, V.R. Characteristics of Metro Networks and Methodology for Their Evaluation; National Research Council, Transportation Research Board: Washington, DC, USA, 1988. [Google Scholar]
- Vuchic, V.R.; Musso, A. Theory and practice of metro network design. Public Transp. Int. 1991, 3, 298. [Google Scholar]
- Vuchic, V.R. Urban Transit: Operations, Planning, and Economics; John Wiley & Sons: Hoboken, NJ, USA, 2017. [Google Scholar]
- Vuchic, V.R.; Clarke, R.; Molinero, A. Timed Transfer System Planning, Design and Operation; United States Department of Transportation Urban Mass Transportation Administration: Washington, DC, USA, 1981; Volume 124.
- Synn, J. Systems Approach to Metro Network Design. Ph.D. Thesis, University of Pennsylvania, Philadelphia, PA, USA, 2005. [Google Scholar]
- Owais, M.; Ahmed, A.; Moussa, G.; Khalil, A. Design Scheme of Multiple-Subway Lines for Minimizing Passengers Transfers in Mega-Cities Transit Networks. Int. J. Rail Transp. 2020. [Google Scholar] [CrossRef]
- Owais, M.; Ahmed, A.; Moussa, G.; Khalil, A. Integrating Underground Line Design with Existing Public Transportation Systems to Increase Transit Network Connectivity: Case Study in Greater Cairo. Expert Syst. Appl. 2020. [Google Scholar] [CrossRef]
- Derrible, S.J.-M. The Properties and Effects of Metro Network Designs. Ph.D. Thesis, Department of Civil Engineering, University of Toronto, Toronto, ON, Canada, 2010. [Google Scholar]
- Simpson, B. Urban Public Transport Today; Routledge: Abingdon, Oxfordshire, UK, 2003. [Google Scholar]
- Ning, L.; Zhao, P.; Xu, W.; Qiao, K. Transfer coordination for metro networks during the start-or end-of-service period. Math. Probl. Eng. 2018, 2018, 3835270. [Google Scholar] [CrossRef]
- Bookbinder, J.H.; Désilets, A. Transfer optimization in a transit network. Transp. Sci. 1992, 26, 106–118. [Google Scholar] [CrossRef]
- Ting, C. Transfer Coordination in Transit Networks. Ph.D. Thesis, University of Maryland College Park, College Park, MD, USA, 1998. [Google Scholar]
- Shafahi, Y.; Khani, A. A practical model for transfer optimization in a transit network: Model formulations and solutions. Transp. Res. Part A Policy Pract. 2010, 44, 377–389. [Google Scholar] [CrossRef]
- Wang, C.; Ye, Z.; Wang, W. A multi-objective optimization and hybrid heuristic approach for urban bus route network design. IEEE Access 2020, 8, 12154–12167. [Google Scholar] [CrossRef]
- Zhao, F.; Ubaka, I.; Gan, A. Transit network optimization: Minimizing transfers and maximizing service coverage with an integrated simulated annealing and tabu search method. Transp. Res. Rec. 2005, 1923, 180–188. [Google Scholar] [CrossRef]
- Wan, S.; Yang, Z.; Shi, Y.; Zhang, Y.; Li, Q.; Geng, Y. Coordination of metro lines in transfer station considering passengers’ conflicts and waiting time. In Proceedings of the 2018 3rd IEEE International Conference on Intelligent Transportation Engineering (ICITE), Singapore, 3–5 September 2018; pp. 91–94. [Google Scholar]
- Jinli, W.; Xiangfeng, L.; Yuhua, W.; Yan, Y. Study on optimization of urban public transit networks based on transfer coefficient. In Proceedings of the Proceedings 2011 International Conference on Transportation, Mechanical, and Electrical Engineering (TMEE), Changchun, China, 16–18 December 2011; pp. 67–70. [Google Scholar]
- Feng, X.; Zhu, X.; Qian, X.; Jie, Y.; Ma, F.; Niu, X. A new transit network design study in consideration of transfer time composition. Transp. Res. Part D Transp. Environ. 2019, 66, 85–94. [Google Scholar] [CrossRef]
- Klier, M.J.; Haase, K. Urban public transit network optimization with flexible demand. Or Spectrum 2015, 37, 195–215. [Google Scholar] [CrossRef]
- Kuo, Y. Design method using hybrid of line-type and circular-type routes for transit network system optimization. Top 2014, 22, 600–613. [Google Scholar] [CrossRef]
- Iliopoulou, C. Hybrid Population Based Optimization Algorithm For The Urban Transit Routing Problem. Master’s Thesis, University of California, Oakland, CA, USA, 2015. [Google Scholar]
- Chakroborty, P. Genetic algorithms for optimal urban transit network design. Comput.-Aided Civ. Infrastruct. Eng. 2003, 18, 184–200. [Google Scholar] [CrossRef]
- Chakroborty, P.; Wivedi, T. Optimal route network design for transit systems using genetic algorithms. Eng. Optim. 2002, 34, 83–100. [Google Scholar] [CrossRef]
- Fan, L.; Mumford, C.L. A metaheuristic approach to the urban transit routing problem. J. Heuristics 2010, 16, 353–372. [Google Scholar] [CrossRef]
- Borndörfer, R.; Grötschel, M.; Pfetsch, M.E. Models for line planning in public transport. In Computer-Aided Systems in Public Transport; Springer: Berlin/Heidelberg, Germany, 2008; pp. 363–378. [Google Scholar]
- Hassannayebi, E.; Sajedinejad, A.; Mardani, S. Urban rail transit planning using a two-stage simulation-based optimization approach. Simul. Model. Pract. Theory 2014, 49, 151–166. [Google Scholar] [CrossRef]
- Laporte, G.; Pascoal, M.M. Path based algorithms for metro network design. Comput. Oper. Res. 2015, 62, 78–94. [Google Scholar] [CrossRef]
- Król, A.; Król, M. The design of a metro network using a genetic algorithm. Appl. Sci. 2019, 9, 433. [Google Scholar] [CrossRef] [Green Version]
- Owais, M. Location Strategy for Traffic Emission Remote Sensing Monitors to Capture the Violated Emissions. J. Adv. Transp. 2019, 2019, 6520818. [Google Scholar] [CrossRef] [Green Version]
- Owais, M.; Moussa, G.S.; Hussain, K.F. Sensor location model for O/D estimation: Multi-criteria meta-heuristics approach. Oper. Res. Perspect. 2019, 6, 100100. [Google Scholar] [CrossRef]
- Owais, M.; Moussa, G.S.; Hussain, K.F. Robust Deep Learning Architecture for Traffic Flow Estimation from a Subset of Link Sensors. J. Transp. Eng. Part A Syst. 2020, 146, 04019055. [Google Scholar] [CrossRef]
- Owais, M.; Abbas, Y.A. Distributing Portable Excess Speed Detectors in AL Riyadh City. Int. J. Civ. Eng. 2020, 18, 1301–1314. [Google Scholar] [CrossRef]
- Curtin, K.M.; Biba, S. The transit route arc-node service maximization problem. Eur. J. Oper. Res. 2011, 208, 46–56. [Google Scholar] [CrossRef]
- Escudero, L.; Muñoz, S. An approach for solving a modification of the extended rapid transit network design problem. Top 2009, 17, 320–334. [Google Scholar] [CrossRef]
- Caprara, A.; Kroon, L.; Monaci, M.; Peeters, M.; Toth, P. Passenger railway optimization. Handb. Oper. Res. Manag. Sci. 2007, 14, 129–187. [Google Scholar]
- Binder, S.; Maknoon, Y.; Bierlaire, M. The multi-objective railway timetable rescheduling problem. Transp. Res. Part C Emerg. Technol. 2017, 78, 78–94. [Google Scholar] [CrossRef] [Green Version]
- Miller, P.; de Barros, A.G.; Kattan, L.; Wirasinghe, S. Public transportation and sustainability: A review. KSCE J. Civ. Eng. 2016, 20, 1076–1083. [Google Scholar] [CrossRef]
- Lampkin, W.; Saalmans, P.D. The Design of Routes, Service Frequencies and Schedules for a Municipal Bus Undertaking: A Case Study. Oper. Res. Ouarterly 1967, 18, 375–397. [Google Scholar] [CrossRef]
- Canca, D.; De-Los-Santos, A.; Laporte, G.; Mesa, J.A. Integrated railway rapid transit network design and line planning problem with maximum profit. Transp. Res. Part E Logist. Transp. Rev. 2019, 127, 1–30. [Google Scholar] [CrossRef]
- Canca, D.; De-Los-Santos, A.; Laporte, G.; Mesa, J.A. A general rapid network design, line planning and fleet investment integrated model. Ann. Oper. Res. 2016, 246, 127–144. [Google Scholar] [CrossRef]
- Schöbel, A. An eigenmodel for iterative line planning, timetabling and vehicle scheduling in public transportation. Transp. Res. Part C Emerg. Technol. 2017, 74, 348–365. [Google Scholar] [CrossRef]
- Burggraeve, S.; Bull, S.H.; Vansteenwegen, P.; Lusby, R.M. Integrating robust timetabling in line plan optimization for railway systems. Transp. Res. Part C Emerg. Technol. 2017, 77, 134–160. [Google Scholar] [CrossRef] [Green Version]
- Schöbel, A. Line planning in public transportation: Models and methods. OR Spectr. 2012, 34, 491–510. [Google Scholar] [CrossRef] [Green Version]
- Fan, W.; Machemehl, R.B. A tabu search based heuristic method for the transit route network design problem. In Computer-aided Systems in Public Transport; Springer: Berlin/Heidelberg, Germany, 2008; pp. 387–408. [Google Scholar]
- Canca, D.; De-Los-Santos, A.; Laporte, G.; Mesa, J.A. An adaptive neighborhood search metaheuristic for the integrated railway rapid transit network design and line planning problem. Comput. Oper. Res. 2017, 78, 1–14. [Google Scholar] [CrossRef]
- Fan, W.; Machemehl, R.B. Using a Simulated Annealing Algorithm to Solve the Transit Route Network Design Problem. J. Transp. Eng. 2006, 132, 122–132. [Google Scholar] [CrossRef]
- Yu, B.; Yang, Z.-Z.; Jin, P.-H.; Wu, S.-H.; Yao, B.-Z. Transit route network design-maximizing direct and transfer demand density. Transp. Res. Part C Emerg. Technol. 2012, 22, 58–75. [Google Scholar] [CrossRef]
- Sun, Y.; Schonfeld, P.; Guo, Q. Optimal extension of rail transit lines. Int. J. Sustain. Transp. 2018, 12, 753–769. [Google Scholar] [CrossRef]
- Saidi, S.; Ji, Y.; Cheng, C.; Guan, J.; Jiang, S.; Kattan, L.; Du, Y.; Wirasinghe, S. Planning urban ring rail transit lines: Case study of Shanghai, China. Transp. Res. Rec. 2016, 2540, 56–65. [Google Scholar] [CrossRef] [Green Version]
- Saidi, S.; Wirasinghe, S.; Kattan, L. Rail transit: Exploration with emphasis on networks with ring lines. Transp. Res. Rec. 2014, 2419, 23–32. [Google Scholar] [CrossRef]
- Vuchic, V. Planning, design and operation of rail transit networks. Metro Rep. Int. 2014, 48–53. [Google Scholar]
- Freemark, Y. Paris Region Moves Ahead with 125 Miles of New Metro Lines. The Transport Politic. May 2011. Available online: https://www.thetransportpolitic.com/2011/05/27/paris-region-moves-ahead-with-125-miles-of-new-metro-lines/ (accessed on 1 June 2020).
- Owais, M.; Alshehri, A. Pareto Optimal Path Generation Algorithm in Stochastic Transportation Networks. IEEE Access 2020, 8, 58970–58981. [Google Scholar] [CrossRef]
- Owais, M.; Osman, M.K. Complete hierarchical multi-objective genetic algorithm for transit network design problem. Expert Syst. Appl. 2018, 114, 143–154. [Google Scholar] [CrossRef]
- Boudreau, T.; Glick, J.; Greene, S.; Spurlin, V.; Woehr, J.J. NetBeans: The Definitive Guide: Developing, Debugging, and Deploying JAVA Code; O’Reilly Media, Inc.: Sebastopol, CA, USA, 2002. [Google Scholar]
- Flyvbjerg, B.; Bruzelius, N.; van Wee, B. Comparison of capital costs per route-kilometre in urban rail. arXiv 2013, arXiv:1303.6569. [Google Scholar]
- Liang, J.; Wu, J.; Gao, Z.; Sun, H.; Yang, X.; Lo, H.K. Bus transit network design with uncertainties on the basis of a metro network: A two-step model framework. Transp. Res. Part B Methodol. 2019, 126, 115–138. [Google Scholar] [CrossRef]
- Chen, J.; Liu, Z.; Wang, S.; Chen, X. Continuum approximation modeling of transit network design considering local route service and short-turn strategy. Transp. Res. Part E Logist. Transp. Rev. 2018, 119, 165–188. [Google Scholar] [CrossRef]
- Sachan, A.; Mathew, T. Integrated Multimodal Transit Route Network Design with Feeder Systems. Transp. Res. Procedia 2020, 48, 756–763. [Google Scholar] [CrossRef]
- Nikolić, M.; Teodorović, D. Transit network design by bee colony optimization. Expert Syst. Appl. 2013, 40, 5945–5955. [Google Scholar] [CrossRef]
- Nikolić, M.; Teodorović, D. A simultaneous transit network design and frequency setting: Computing with bees. Expert Syst. Appl. 2014, 41, 7200–7209. [Google Scholar] [CrossRef]
- Göçmen, E.; Erol, R. Transportation problems for intermodal networks: Mathematical models, exact and heuristic algorithms, and machine learning. Expert Syst. Appl. 2019, 135, 374–387. [Google Scholar] [CrossRef]
- Liang, M.; Wang, W.; Dong, C.; Zhao, D. A cooperative coevolutionary optimization design of urban transit network and operating frequencies. Expert Syst. Appl. 2020, 160, 113736. [Google Scholar] [CrossRef]
- Buba, A.T.; Lee, L.S. A differential evolution for simultaneous transit network design and frequency setting problem. Expert Syst. Appl. 2018, 106, 277–289. [Google Scholar] [CrossRef]
- Zhao, H.; Jiang, R. The memetic algorithm for the optimization of urban transit network. Expert Syst. Appl. 2015, 42, 3760–3773. [Google Scholar] [CrossRef]
- Dib, O.; Moalic, L.; Manier, M.-A.; Caminada, A. An advanced GA–VNS combination for multicriteria route planning in public transit networks. Expert Syst. Appl. 2017, 72, 67–82. [Google Scholar] [CrossRef] [Green Version]
- Hu, Z.-H. A container multimodal transportation scheduling approach based on immune affinity model for emergency relief. Expert Syst. Appl. 2011, 38, 2632–2639. [Google Scholar] [CrossRef]
- Rehborn, H.; Klenov, S.L.; Palmer, J. An empirical study of common traffic congestion features based on traffic data measured in the USA, the UK, and Germany. Phys. A Stat. Mech. Appl. 2011, 390, 4466–4485. [Google Scholar] [CrossRef]
- Arnott, R.; Small, K. The economics of traffic congestion. Am. Sci. 1994, 82, 446–455. [Google Scholar]
- Currie, J.; Walker, R. Traffic congestion and infant health: Evidence from E-ZPass. Am. Econ. J. Appl. Econ. 2011, 3, 65–90. [Google Scholar] [CrossRef] [Green Version]
- D’Andrea, E.; Marcelloni, F. Detection of traffic congestion and incidents from GPS trace analysis. Expert Syst. Appl. 2017, 73, 43–56. [Google Scholar] [CrossRef]
- Furlan, R.; AL-Mohannadi, A. An Urban Regeneration Planning Scheme for the Souq Waqif Heritage Site of Doha. Sustainability 2020, 12, 7927. [Google Scholar] [CrossRef]
- Dong, N.; Fu, Y.; Xiong, F.; Li, L.; Ao, Y.; Martek, I. Sustainable Construction Project Management (SCPM) Evaluation—A Case Study of the Guangzhou Metro Line-7, PR China. Sustainability 2019, 11, 5731. [Google Scholar] [CrossRef] [Green Version]
- Zhou, X.-H.; Shen, S.-L.; Xu, Y.-S.; Zhou, A.-N. Analysis of production safety in the construction industry of China in 2018. Sustainability 2019, 11, 4537. [Google Scholar] [CrossRef] [Green Version]
- Zhan, C.; De Jong, M.; De Bruijn, H. Funding sustainable cities: A comparative study of sino-singapore tianjin eco-city and shenzhen international low-carbon city. Sustainability 2018, 10, 4256. [Google Scholar] [CrossRef] [Green Version]
- Li, S.; Liu, X.; Li, Z.; Wu, Z.; Yan, Z.; Chen, Y.; Gao, F. Spatial and temporal dynamics of urban expansion along the Guangzhou–Foshan inter-city rail transit corridor, China. Sustainability 2018, 10, 593. [Google Scholar] [CrossRef] [Green Version]


| Station | 1 | 2 | 3 | 4 | 5 | 6 | 7 | 8 | 9 | 10 | 11 | 12 | 13 | 14 | 15 | 16 | 17 | 18 | 19 | 20 | 21 | 22 | 23 | 24 | 25 | 26 | 27 | 28 | 29 | 30 | 31 | 32 | 33 | 34 | 35 | 36 |
|---|---|---|---|---|---|---|---|---|---|---|---|---|---|---|---|---|---|---|---|---|---|---|---|---|---|---|---|---|---|---|---|---|---|---|---|---|
| 1 | 0 | 0 | 0 | 0 | 0 | 0 | ∞ | ∞ | ∞ | ∞ | ∞ | ∞ | ∞ | ∞ | ∞ | ∞ | ∞ | ∞ | ∞ | ∞ | ∞ | ∞ | ∞ | ∞ | ∞ | ∞ | ∞ | ∞ | ∞ | ∞ | ∞ | ∞ | ∞ | ∞ | ∞ | ∞ |
| 2 | 0 | 0 | 0 | 0 | 0 | 0 | ∞ | ∞ | ∞ | ∞ | ∞ | ∞ | ∞ | ∞ | ∞ | ∞ | ∞ | ∞ | ∞ | ∞ | ∞ | ∞ | ∞ | ∞ | ∞ | ∞ | ∞ | ∞ | ∞ | ∞ | ∞ | ∞ | ∞ | ∞ | ∞ | ∞ |
| 3 | 0 | 0 | 0 | 0 | 0 | 0 | ∞ | ∞ | ∞ | ∞ | ∞ | ∞ | ∞ | ∞ | ∞ | ∞ | ∞ | ∞ | ∞ | ∞ | ∞ | ∞ | ∞ | ∞ | ∞ | ∞ | ∞ | ∞ | ∞ | ∞ | ∞ | ∞ | ∞ | ∞ | ∞ | ∞ |
| 4 | 0 | 0 | 0 | 0 | 0 | 0 | ∞ | ∞ | ∞ | ∞ | ∞ | ∞ | ∞ | ∞ | ∞ | ∞ | ∞ | ∞ | ∞ | ∞ | ∞ | ∞ | ∞ | ∞ | ∞ | ∞ | ∞ | ∞ | ∞ | ∞ | ∞ | ∞ | ∞ | ∞ | ∞ | ∞ |
| 5 | 0 | 0 | 0 | 0 | 0 | 0 | ∞ | ∞ | ∞ | ∞ | ∞ | ∞ | ∞ | ∞ | ∞ | ∞ | ∞ | ∞ | ∞ | ∞ | ∞ | ∞ | ∞ | ∞ | ∞ | ∞ | ∞ | ∞ | ∞ | ∞ | ∞ | ∞ | ∞ | ∞ | ∞ | ∞ |
| 6 | 0 | 0 | 0 | 0 | 0 | 0 | ∞ | ∞ | ∞ | ∞ | ∞ | ∞ | ∞ | ∞ | ∞ | ∞ | ∞ | ∞ | ∞ | ∞ | ∞ | ∞ | ∞ | ∞ | ∞ | ∞ | ∞ | ∞ | ∞ | ∞ | ∞ | ∞ | ∞ | ∞ | ∞ | ∞ |
| 7 | ∞ | ∞ | ∞ | ∞ | ∞ | ∞ | 0 | 0 | 0 | 0 | 0 | 0 | ∞ | ∞ | ∞ | ∞ | ∞ | ∞ | ∞ | ∞ | ∞ | ∞ | ∞ | ∞ | ∞ | ∞ | ∞ | ∞ | ∞ | ∞ | ∞ | ∞ | ∞ | ∞ | ∞ | ∞ |
| 8 | ∞ | ∞ | ∞ | ∞ | ∞ | ∞ | 0 | 0 | 0 | 0 | 0 | 0 | ∞ | ∞ | ∞ | ∞ | ∞ | ∞ | ∞ | ∞ | ∞ | ∞ | ∞ | ∞ | ∞ | ∞ | ∞ | ∞ | ∞ | ∞ | ∞ | ∞ | ∞ | ∞ | ∞ | ∞ |
| 9 | ∞ | ∞ | ∞ | ∞ | ∞ | ∞ | 0 | 0 | 0 | 0 | 0 | 0 | ∞ | ∞ | ∞ | ∞ | ∞ | ∞ | ∞ | ∞ | ∞ | ∞ | ∞ | ∞ | ∞ | ∞ | ∞ | ∞ | ∞ | ∞ | ∞ | ∞ | ∞ | ∞ | ∞ | ∞ |
| 10 | ∞ | ∞ | ∞ | ∞ | ∞ | ∞ | 0 | 0 | 0 | 0 | 0 | 0 | ∞ | ∞ | ∞ | ∞ | ∞ | ∞ | ∞ | ∞ | ∞ | ∞ | ∞ | ∞ | ∞ | ∞ | ∞ | ∞ | ∞ | ∞ | ∞ | ∞ | ∞ | ∞ | ∞ | ∞ |
| 11 | ∞ | ∞ | ∞ | ∞ | ∞ | ∞ | 0 | 0 | 0 | 0 | 0 | 0 | ∞ | ∞ | ∞ | ∞ | ∞ | ∞ | ∞ | ∞ | ∞ | ∞ | ∞ | ∞ | ∞ | ∞ | ∞ | ∞ | ∞ | ∞ | ∞ | ∞ | ∞ | ∞ | ∞ | ∞ |
| 12 | ∞ | ∞ | ∞ | ∞ | ∞ | ∞ | 0 | 0 | 0 | 0 | 0 | 0 | ∞ | ∞ | ∞ | ∞ | ∞ | ∞ | ∞ | ∞ | ∞ | ∞ | ∞ | ∞ | ∞ | ∞ | ∞ | ∞ | ∞ | ∞ | ∞ | ∞ | ∞ | ∞ | ∞ | ∞ |
| 13 | ∞ | ∞ | ∞ | ∞ | ∞ | ∞ | ∞ | ∞ | ∞ | ∞ | ∞ | ∞ | 0 | 0 | 0 | 0 | 0 | 0 | ∞ | ∞ | ∞ | ∞ | ∞ | ∞ | ∞ | ∞ | ∞ | ∞ | ∞ | ∞ | ∞ | ∞ | ∞ | ∞ | ∞ | ∞ |
| 14 | ∞ | ∞ | ∞ | ∞ | ∞ | ∞ | ∞ | ∞ | ∞ | ∞ | ∞ | ∞ | 0 | 0 | 0 | 0 | 0 | 0 | ∞ | ∞ | ∞ | ∞ | ∞ | ∞ | ∞ | ∞ | ∞ | ∞ | ∞ | ∞ | ∞ | ∞ | ∞ | ∞ | ∞ | ∞ |
| 15 | ∞ | ∞ | ∞ | ∞ | ∞ | ∞ | ∞ | ∞ | ∞ | ∞ | ∞ | ∞ | 0 | 0 | 0 | 0 | 0 | 0 | ∞ | ∞ | ∞ | ∞ | ∞ | ∞ | ∞ | ∞ | ∞ | ∞ | ∞ | ∞ | ∞ | ∞ | ∞ | ∞ | ∞ | ∞ |
| 16 | ∞ | ∞ | ∞ | ∞ | ∞ | ∞ | ∞ | ∞ | ∞ | ∞ | ∞ | ∞ | 0 | 0 | 0 | 0 | 0 | 0 | ∞ | ∞ | ∞ | ∞ | ∞ | ∞ | ∞ | ∞ | ∞ | ∞ | ∞ | ∞ | ∞ | ∞ | ∞ | ∞ | ∞ | ∞ |
| 17 | ∞ | ∞ | ∞ | ∞ | ∞ | ∞ | ∞ | ∞ | ∞ | ∞ | ∞ | ∞ | 0 | 0 | 0 | 0 | 0 | 0 | ∞ | ∞ | ∞ | ∞ | ∞ | ∞ | ∞ | ∞ | ∞ | ∞ | ∞ | ∞ | ∞ | ∞ | ∞ | ∞ | ∞ | ∞ |
| 18 | ∞ | ∞ | ∞ | ∞ | ∞ | ∞ | ∞ | ∞ | ∞ | ∞ | ∞ | ∞ | 0 | 0 | 0 | 0 | 0 | 0 | ∞ | ∞ | ∞ | ∞ | ∞ | ∞ | ∞ | ∞ | ∞ | ∞ | ∞ | ∞ | ∞ | ∞ | ∞ | ∞ | ∞ | ∞ |
| 19 | ∞ | ∞ | ∞ | ∞ | ∞ | ∞ | ∞ | ∞ | ∞ | ∞ | ∞ | ∞ | ∞ | ∞ | ∞ | ∞ | ∞ | ∞ | 0 | 0 | 0 | 0 | 0 | 0 | ∞ | ∞ | ∞ | ∞ | ∞ | ∞ | ∞ | ∞ | ∞ | ∞ | ∞ | ∞ |
| 20 | ∞ | ∞ | ∞ | ∞ | ∞ | ∞ | ∞ | ∞ | ∞ | ∞ | ∞ | ∞ | ∞ | ∞ | ∞ | ∞ | ∞ | ∞ | 0 | 0 | 0 | 0 | 0 | 0 | ∞ | ∞ | ∞ | ∞ | ∞ | ∞ | ∞ | ∞ | ∞ | ∞ | ∞ | ∞ |
| 21 | ∞ | ∞ | ∞ | ∞ | ∞ | ∞ | ∞ | ∞ | ∞ | ∞ | ∞ | ∞ | ∞ | ∞ | ∞ | ∞ | ∞ | ∞ | 0 | 0 | 0 | 0 | 0 | 0 | ∞ | ∞ | ∞ | ∞ | ∞ | ∞ | ∞ | ∞ | ∞ | ∞ | ∞ | ∞ |
| 22 | ∞ | ∞ | ∞ | ∞ | ∞ | ∞ | ∞ | ∞ | ∞ | ∞ | ∞ | ∞ | ∞ | ∞ | ∞ | ∞ | ∞ | ∞ | 0 | 0 | 0 | 0 | 0 | 0 | ∞ | ∞ | ∞ | ∞ | ∞ | ∞ | ∞ | ∞ | ∞ | ∞ | ∞ | ∞ |
| 23 | ∞ | ∞ | ∞ | ∞ | ∞ | ∞ | ∞ | ∞ | ∞ | ∞ | ∞ | ∞ | ∞ | ∞ | ∞ | ∞ | ∞ | ∞ | 0 | 0 | 0 | 0 | 0 | 0 | ∞ | ∞ | ∞ | ∞ | ∞ | ∞ | ∞ | ∞ | ∞ | ∞ | ∞ | ∞ |
| 24 | ∞ | ∞ | ∞ | ∞ | ∞ | ∞ | ∞ | ∞ | ∞ | ∞ | ∞ | ∞ | ∞ | ∞ | ∞ | ∞ | ∞ | ∞ | 0 | 0 | 0 | 0 | 0 | 0 | ∞ | ∞ | ∞ | ∞ | ∞ | ∞ | ∞ | ∞ | ∞ | ∞ | ∞ | ∞ |
| 25 | ∞ | ∞ | ∞ | ∞ | ∞ | ∞ | ∞ | ∞ | ∞ | ∞ | ∞ | ∞ | ∞ | ∞ | ∞ | ∞ | ∞ | ∞ | ∞ | ∞ | ∞ | ∞ | ∞ | ∞ | 0 | 0 | 0 | 0 | 0 | 0 | ∞ | ∞ | ∞ | ∞ | ∞ | ∞ |
| 26 | ∞ | ∞ | ∞ | ∞ | ∞ | ∞ | ∞ | ∞ | ∞ | ∞ | ∞ | ∞ | ∞ | ∞ | ∞ | ∞ | ∞ | ∞ | ∞ | ∞ | ∞ | ∞ | ∞ | ∞ | 0 | 0 | 0 | 0 | 0 | 0 | ∞ | ∞ | ∞ | ∞ | ∞ | ∞ |
| 27 | ∞ | ∞ | ∞ | ∞ | ∞ | ∞ | ∞ | ∞ | ∞ | ∞ | ∞ | ∞ | ∞ | ∞ | ∞ | ∞ | ∞ | ∞ | ∞ | ∞ | ∞ | ∞ | ∞ | ∞ | 0 | 0 | 0 | 0 | 0 | 0 | ∞ | ∞ | ∞ | ∞ | ∞ | ∞ |
| 28 | ∞ | ∞ | ∞ | ∞ | ∞ | ∞ | ∞ | ∞ | ∞ | ∞ | ∞ | ∞ | ∞ | ∞ | ∞ | ∞ | ∞ | ∞ | ∞ | ∞ | ∞ | ∞ | ∞ | ∞ | 0 | 0 | 0 | 0 | 0 | 0 | ∞ | ∞ | ∞ | ∞ | ∞ | ∞ |
| 29 | ∞ | ∞ | ∞ | ∞ | ∞ | ∞ | ∞ | ∞ | ∞ | ∞ | ∞ | ∞ | ∞ | ∞ | ∞ | ∞ | ∞ | ∞ | ∞ | ∞ | ∞ | ∞ | ∞ | ∞ | 0 | 0 | 0 | 0 | 0 | 0 | ∞ | ∞ | ∞ | ∞ | ∞ | ∞ |
| 30 | ∞ | ∞ | ∞ | ∞ | ∞ | ∞ | ∞ | ∞ | ∞ | ∞ | ∞ | ∞ | ∞ | ∞ | ∞ | ∞ | ∞ | ∞ | ∞ | ∞ | ∞ | ∞ | ∞ | ∞ | 0 | 0 | 0 | 0 | 0 | 0 | ∞ | ∞ | ∞ | ∞ | ∞ | ∞ |
| 31 | ∞ | ∞ | ∞ | ∞ | ∞ | ∞ | ∞ | ∞ | ∞ | ∞ | ∞ | ∞ | ∞ | ∞ | ∞ | ∞ | ∞ | ∞ | ∞ | ∞ | ∞ | ∞ | ∞ | ∞ | ∞ | ∞ | ∞ | ∞ | ∞ | ∞ | 0 | 0 | 0 | 0 | 0 | 0 |
| 32 | ∞ | ∞ | ∞ | ∞ | ∞ | ∞ | ∞ | ∞ | ∞ | ∞ | ∞ | ∞ | ∞ | ∞ | ∞ | ∞ | ∞ | ∞ | ∞ | ∞ | ∞ | ∞ | ∞ | ∞ | ∞ | ∞ | ∞ | ∞ | ∞ | ∞ | 0 | 0 | 0 | 0 | 0 | 0 |
| 33 | ∞ | ∞ | ∞ | ∞ | ∞ | ∞ | ∞ | ∞ | ∞ | ∞ | ∞ | ∞ | ∞ | ∞ | ∞ | ∞ | ∞ | ∞ | ∞ | ∞ | ∞ | ∞ | ∞ | ∞ | ∞ | ∞ | ∞ | ∞ | ∞ | ∞ | 0 | 0 | 0 | 0 | 0 | 0 |
| 34 | ∞ | ∞ | ∞ | ∞ | ∞ | ∞ | ∞ | ∞ | ∞ | ∞ | ∞ | ∞ | ∞ | ∞ | ∞ | ∞ | ∞ | ∞ | ∞ | ∞ | ∞ | ∞ | ∞ | ∞ | ∞ | ∞ | ∞ | ∞ | ∞ | ∞ | 0 | 0 | 0 | 0 | 0 | 0 |
| 35 | ∞ | ∞ | ∞ | ∞ | ∞ | ∞ | ∞ | ∞ | ∞ | ∞ | ∞ | ∞ | ∞ | ∞ | ∞ | ∞ | ∞ | ∞ | ∞ | ∞ | ∞ | ∞ | ∞ | ∞ | ∞ | ∞ | ∞ | ∞ | ∞ | ∞ | 0 | 0 | 0 | 0 | 0 | 0 |
| 36 | ∞ | ∞ | ∞ | ∞ | ∞ | ∞ | ∞ | ∞ | ∞ | ∞ | ∞ | ∞ | ∞ | ∞ | ∞ | ∞ | ∞ | ∞ | ∞ | ∞ | ∞ | ∞ | ∞ | ∞ | ∞ | ∞ | ∞ | ∞ | ∞ | ∞ | 0 | 0 | 0 | 0 | 0 | 0 |
| Station | 1 | 2 | 3 | 4 | 5 | 6 | 7 | 8 | 9 | 10 | 11 | 12 | 13 | 14 | 15 | 16 | 17 | 18 | 19 | 20 | 21 | 22 | 23 | 24 | 25 | 26 | 27 | 28 | 29 | 30 | 31 | 32 | 33 | 34 | 35 | 36 |
|---|---|---|---|---|---|---|---|---|---|---|---|---|---|---|---|---|---|---|---|---|---|---|---|---|---|---|---|---|---|---|---|---|---|---|---|---|
| 1 | 0 | 0 | 0 | 0 | 0 | 0 | 0 | 1 | 1 | 1 | 1 | 1 | 0 | 1 | 1 | 1 | 1 | 1 | 0 | 1 | 1 | 1 | 1 | 1 | 0 | 1 | 1 | 1 | 1 | 1 | 0 | 1 | 1 | 1 | 1 | 1 |
| 2 | 0 | 0 | 0 | 0 | 0 | 0 | 1 | 0 | 1 | 1 | 1 | 1 | 1 | 0 | 1 | 1 | 1 | 1 | 1 | 0 | 1 | 1 | 1 | 1 | 1 | 0 | 1 | 1 | 1 | 1 | 1 | 0 | 1 | 1 | 1 | 1 |
| 3 | 0 | 0 | 0 | 0 | 0 | 0 | 1 | 1 | 0 | 1 | 1 | 1 | 1 | 1 | 0 | 1 | 1 | 1 | 1 | 1 | 0 | 1 | 1 | 1 | 1 | 1 | 0 | 1 | 1 | 1 | 1 | 1 | 0 | 1 | 1 | 1 |
| 4 | 0 | 0 | 0 | 0 | 0 | 0 | 1 | 1 | 1 | 0 | 1 | 1 | 1 | 1 | 1 | 0 | 1 | 1 | 1 | 1 | 1 | 0 | 1 | 1 | 1 | 1 | 1 | 0 | 1 | 1 | 1 | 1 | 1 | 0 | 1 | 1 |
| 5 | 0 | 0 | 0 | 0 | 0 | 0 | 1 | 1 | 1 | 1 | 0 | 1 | 1 | 1 | 1 | 1 | 0 | 1 | 1 | 1 | 1 | 1 | 0 | 1 | 1 | 1 | 1 | 1 | 0 | 1 | 1 | 1 | 1 | 1 | 0 | 1 |
| 6 | 0 | 0 | 0 | 0 | 0 | 0 | 1 | 1 | 1 | 1 | 1 | 0 | 1 | 1 | 1 | 1 | 1 | 0 | 1 | 1 | 1 | 1 | 1 | 0 | 1 | 1 | 1 | 1 | 1 | 0 | 1 | 1 | 1 | 1 | 1 | 0 |
| 7 | 0 | 1 | 1 | 1 | 1 | 1 | 0 | 0 | 0 | 0 | 0 | 0 | 0 | 1 | 1 | 1 | 1 | 1 | 0 | 1 | 1 | 1 | 1 | 1 | 0 | 1 | 1 | 1 | 1 | 1 | 0 | 1 | 1 | 1 | 1 | 1 |
| 8 | 1 | 0 | 1 | 1 | 1 | 1 | 0 | 0 | 0 | 0 | 0 | 0 | 1 | 0 | 1 | 1 | 1 | 1 | 1 | 0 | 1 | 1 | 1 | 1 | 1 | 0 | 1 | 1 | 1 | 1 | 1 | 0 | 1 | 1 | 1 | 1 |
| 9 | 1 | 1 | 0 | 1 | 1 | 1 | 0 | 0 | 0 | 0 | 0 | 0 | 1 | 1 | 0 | 1 | 1 | 1 | 1 | 1 | 0 | 1 | 1 | 1 | 1 | 1 | 0 | 1 | 1 | 1 | 1 | 1 | 0 | 1 | 1 | 1 |
| 10 | 1 | 1 | 1 | 0 | 1 | 1 | 0 | 0 | 0 | 0 | 0 | 0 | 1 | 1 | 1 | 0 | 1 | 1 | 1 | 1 | 1 | 0 | 1 | 1 | 1 | 1 | 1 | 0 | 1 | 1 | 1 | 1 | 1 | 0 | 1 | 1 |
| 11 | 1 | 1 | 1 | 1 | 0 | 1 | 0 | 0 | 0 | 0 | 0 | 0 | 1 | 1 | 1 | 1 | 0 | 1 | 1 | 1 | 1 | 1 | 0 | 1 | 1 | 1 | 1 | 1 | 0 | 1 | 1 | 1 | 1 | 1 | 0 | 1 |
| 12 | 1 | 1 | 1 | 1 | 1 | 0 | 0 | 0 | 0 | 0 | 0 | 0 | 1 | 1 | 1 | 1 | 1 | 0 | 1 | 1 | 1 | 1 | 1 | 0 | 1 | 1 | 1 | 1 | 1 | 0 | 1 | 1 | 1 | 1 | 1 | 0 |
| 13 | 0 | 1 | 1 | 1 | 1 | 1 | 0 | 1 | 1 | 1 | 1 | 1 | 0 | 0 | 0 | 0 | 0 | 0 | 0 | 1 | 1 | 1 | 1 | 1 | 0 | 1 | 1 | 1 | 1 | 1 | 0 | 1 | 1 | 1 | 1 | 1 |
| 14 | 1 | 0 | 1 | 1 | 1 | 1 | 1 | 0 | 1 | 1 | 1 | 1 | 0 | 0 | 0 | 0 | 0 | 0 | 1 | 0 | 1 | 1 | 1 | 1 | 1 | 0 | 1 | 1 | 1 | 1 | 1 | 0 | 1 | 1 | 1 | 1 |
| 15 | 1 | 1 | 0 | 1 | 1 | 1 | 1 | 1 | 0 | 1 | 1 | 1 | 0 | 0 | 0 | 0 | 0 | 0 | 1 | 1 | 0 | 1 | 1 | 1 | 1 | 1 | 0 | 1 | 1 | 1 | 1 | 1 | 0 | 1 | 1 | 1 |
| 16 | 1 | 1 | 1 | 0 | 1 | 1 | 1 | 1 | 1 | 0 | 1 | 1 | 0 | 0 | 0 | 0 | 0 | 0 | 1 | 1 | 1 | 0 | 1 | 1 | 1 | 1 | 1 | 0 | 1 | 1 | 1 | 1 | 1 | 0 | 1 | 1 |
| 17 | 1 | 1 | 1 | 1 | 0 | 1 | 1 | 1 | 1 | 1 | 0 | 1 | 0 | 0 | 0 | 0 | 0 | 0 | 1 | 1 | 1 | 1 | 0 | 1 | 1 | 1 | 1 | 1 | 0 | 1 | 1 | 1 | 1 | 1 | 0 | 1 |
| 18 | 1 | 1 | 1 | 1 | 1 | 0 | 1 | 1 | 1 | 1 | 1 | 0 | 0 | 0 | 0 | 0 | 0 | 0 | 1 | 1 | 1 | 1 | 1 | 0 | 1 | 1 | 1 | 1 | 1 | 0 | 1 | 1 | 1 | 1 | 1 | 0 |
| 19 | 0 | 1 | 1 | 1 | 1 | 1 | 0 | 1 | 1 | 1 | 1 | 1 | 0 | 1 | 1 | 1 | 1 | 1 | 0 | 0 | 0 | 0 | 0 | 0 | 0 | 1 | 1 | 1 | 1 | 1 | 0 | 1 | 1 | 1 | 1 | 1 |
| 20 | 1 | 0 | 1 | 1 | 1 | 1 | 1 | 0 | 1 | 1 | 1 | 1 | 1 | 0 | 1 | 1 | 1 | 1 | 0 | 0 | 0 | 0 | 0 | 0 | 1 | 0 | 1 | 1 | 1 | 1 | 1 | 0 | 1 | 1 | 1 | 1 |
| 21 | 1 | 1 | 0 | 1 | 1 | 1 | 1 | 1 | 0 | 1 | 1 | 1 | 1 | 1 | 0 | 1 | 1 | 1 | 0 | 0 | 0 | 0 | 0 | 0 | 1 | 1 | 0 | 1 | 1 | 1 | 1 | 1 | 0 | 1 | 1 | 1 |
| 22 | 1 | 1 | 1 | 0 | 1 | 1 | 1 | 1 | 1 | 0 | 1 | 1 | 1 | 1 | 1 | 0 | 1 | 1 | 0 | 0 | 0 | 0 | 0 | 0 | 1 | 1 | 1 | 0 | 1 | 1 | 1 | 1 | 1 | 0 | 1 | 1 |
| 23 | 1 | 1 | 1 | 1 | 0 | 1 | 1 | 1 | 1 | 1 | 0 | 1 | 1 | 1 | 1 | 1 | 0 | 1 | 0 | 0 | 0 | 0 | 0 | 0 | 1 | 1 | 1 | 1 | 0 | 1 | 1 | 1 | 1 | 1 | 0 | 1 |
| 24 | 1 | 1 | 1 | 1 | 1 | 0 | 1 | 1 | 1 | 1 | 1 | 0 | 1 | 1 | 1 | 1 | 1 | 0 | 0 | 0 | 0 | 0 | 0 | 0 | 1 | 1 | 1 | 1 | 1 | 0 | 1 | 1 | 1 | 1 | 1 | 0 |
| 25 | 0 | 1 | 1 | 1 | 1 | 1 | 0 | 1 | 1 | 1 | 1 | 1 | 0 | 1 | 1 | 1 | 1 | 1 | 0 | 1 | 1 | 1 | 1 | 1 | 0 | 0 | 0 | 0 | 0 | 0 | 0 | 1 | 1 | 1 | 1 | 1 |
| 26 | 1 | 0 | 1 | 1 | 1 | 1 | 1 | 0 | 1 | 1 | 1 | 1 | 1 | 0 | 1 | 1 | 1 | 1 | 1 | 0 | 1 | 1 | 1 | 1 | 0 | 0 | 0 | 0 | 0 | 0 | 1 | 0 | 1 | 1 | 1 | 1 |
| 27 | 1 | 1 | 0 | 1 | 1 | 1 | 1 | 1 | 0 | 1 | 1 | 1 | 1 | 1 | 0 | 1 | 1 | 1 | 1 | 1 | 0 | 1 | 1 | 1 | 0 | 0 | 0 | 0 | 0 | 0 | 1 | 1 | 0 | 1 | 1 | 1 |
| 28 | 1 | 1 | 1 | 0 | 1 | 1 | 1 | 1 | 1 | 0 | 1 | 1 | 1 | 1 | 1 | 0 | 1 | 1 | 1 | 1 | 1 | 0 | 1 | 1 | 0 | 0 | 0 | 0 | 0 | 0 | 1 | 1 | 1 | 0 | 1 | 1 |
| 29 | 1 | 1 | 1 | 1 | 0 | 1 | 1 | 1 | 1 | 1 | 0 | 1 | 1 | 1 | 1 | 1 | 0 | 1 | 1 | 1 | 1 | 1 | 0 | 1 | 0 | 0 | 0 | 0 | 0 | 0 | 1 | 1 | 1 | 1 | 0 | 1 |
| 30 | 1 | 1 | 1 | 1 | 1 | 0 | 1 | 1 | 1 | 1 | 1 | 0 | 1 | 1 | 1 | 1 | 1 | 0 | 1 | 1 | 1 | 1 | 1 | 0 | 0 | 0 | 0 | 0 | 0 | 0 | 1 | 1 | 1 | 1 | 1 | 0 |
| 31 | 0 | 1 | 1 | 1 | 1 | 1 | 0 | 1 | 1 | 1 | 1 | 1 | 0 | 1 | 1 | 1 | 1 | 1 | 0 | 1 | 1 | 1 | 1 | 1 | 0 | 1 | 1 | 1 | 1 | 1 | 0 | 0 | 0 | 0 | 0 | 0 |
| 32 | 1 | 0 | 1 | 1 | 1 | 1 | 1 | 0 | 1 | 1 | 1 | 1 | 1 | 0 | 1 | 1 | 1 | 1 | 1 | 0 | 1 | 1 | 1 | 1 | 1 | 0 | 1 | 1 | 1 | 1 | 0 | 0 | 0 | 0 | 0 | 0 |
| 33 | 1 | 1 | 0 | 1 | 1 | 1 | 1 | 1 | 0 | 1 | 1 | 1 | 1 | 1 | 0 | 1 | 1 | 1 | 1 | 1 | 0 | 1 | 1 | 1 | 1 | 1 | 0 | 1 | 1 | 1 | 0 | 0 | 0 | 0 | 0 | 0 |
| 34 | 1 | 1 | 1 | 0 | 1 | 1 | 1 | 1 | 1 | 0 | 1 | 1 | 1 | 1 | 1 | 0 | 1 | 1 | 1 | 1 | 1 | 0 | 1 | 1 | 1 | 1 | 1 | 0 | 1 | 1 | 0 | 0 | 0 | 0 | 0 | 0 |
| 35 | 1 | 1 | 1 | 1 | 0 | 1 | 1 | 1 | 1 | 1 | 0 | 1 | 1 | 1 | 1 | 1 | 0 | 1 | 1 | 1 | 1 | 1 | 0 | 1 | 1 | 1 | 1 | 1 | 0 | 1 | 0 | 0 | 0 | 0 | 0 | 0 |
| 36 | 1 | 1 | 1 | 1 | 1 | 0 | 1 | 1 | 1 | 1 | 1 | 0 | 1 | 1 | 1 | 1 | 1 | 0 | 1 | 1 | 1 | 1 | 1 | 0 | 1 | 1 | 1 | 1 | 1 | 0 | 0 | 0 | 0 | 0 | 0 | 0 |
| Station | 1 | 2 | 3 | 4 | 5 | 6 | 7 | 8 | 9 | 10 | 11 | 12 | 13 | 14 | 15 | 16 | 17 | 18 | 19 | 20 | 21 | 22 | 23 | 24 | 25 | 26 | 27 | 28 | 29 | 30 | 31 | 32 | 33 | 34 | 35 | 36 |
|---|---|---|---|---|---|---|---|---|---|---|---|---|---|---|---|---|---|---|---|---|---|---|---|---|---|---|---|---|---|---|---|---|---|---|---|---|
| 1 | 0 | ∞ | ∞ | ∞ | ∞ | 2 | ∞ | 0 | ∞ | ∞ | 2 | ∞ | ∞ | ∞ | 0 | 1 | ∞ | ∞ | ∞ | ∞ | 1 | 0 | ∞ | ∞ | ∞ | 2 | ∞ | ∞ | 0 | ∞ | 2 | ∞ | ∞ | ∞ | ∞ | 0 |
| 2 | ∞ | 0 | ∞ | ∞ | ∞ | ∞ | ∞ | ∞ | ∞ | ∞ | ∞ | ∞ | ∞ | ∞ | ∞ | ∞ | ∞ | ∞ | ∞ | ∞ | ∞ | ∞ | ∞ | ∞ | ∞ | ∞ | ∞ | ∞ | ∞ | ∞ | ∞ | ∞ | ∞ | ∞ | ∞ | ∞ |
| 3 | ∞ | ∞ | 0 | 0 | ∞ | ∞ | ∞ | ∞ | ∞ | ∞ | ∞ | ∞ | 0 | ∞ | ∞ | ∞ | ∞ | 0 | 0 | ∞ | ∞ | ∞ | ∞ | 0 | ∞ | ∞ | ∞ | ∞ | ∞ | ∞ | ∞ | ∞ | 0 | 0 | ∞ | ∞ |
| 4 | ∞ | ∞ | 0 | 0 | ∞ | ∞ | ∞ | ∞ | ∞ | ∞ | ∞ | ∞ | 0 | ∞ | ∞ | ∞ | ∞ | 0 | 0 | ∞ | ∞ | ∞ | ∞ | 0 | ∞ | ∞ | ∞ | ∞ | ∞ | ∞ | ∞ | ∞ | 0 | 0 | ∞ | ∞ |
| 5 | ∞ | ∞ | ∞ | ∞ | 0 | ∞ | ∞ | ∞ | ∞ | ∞ | ∞ | ∞ | ∞ | ∞ | ∞ | ∞ | ∞ | ∞ | ∞ | ∞ | ∞ | ∞ | ∞ | ∞ | ∞ | ∞ | ∞ | ∞ | ∞ | ∞ | ∞ | ∞ | ∞ | ∞ | ∞ | ∞ |
| 6 | 2 | ∞ | ∞ | ∞ | ∞ | 0 | ∞ | 2 | ∞ | ∞ | 0 | ∞ | ∞ | ∞ | 1 | 0 | ∞ | ∞ | ∞ | ∞ | 0 | 1 | ∞ | ∞ | ∞ | 0 | ∞ | ∞ | 2 | ∞ | 0 | ∞ | ∞ | ∞ | ∞ | 2 |
| 7 | ∞ | ∞ | ∞ | ∞ | ∞ | ∞ | 0 | ∞ | ∞ | ∞ | ∞ | ∞ | ∞ | ∞ | ∞ | ∞ | ∞ | ∞ | ∞ | ∞ | ∞ | ∞ | ∞ | ∞ | ∞ | ∞ | ∞ | ∞ | ∞ | ∞ | ∞ | ∞ | ∞ | ∞ | ∞ | ∞ |
| 8 | 0 | ∞ | ∞ | ∞ | ∞ | 2 | ∞ | 0 | ∞ | ∞ | 2 | ∞ | ∞ | ∞ | 0 | 1 | ∞ | ∞ | ∞ | ∞ | 1 | 0 | ∞ | ∞ | ∞ | 2 | ∞ | ∞ | 0 | ∞ | 2 | ∞ | ∞ | ∞ | ∞ | 0 |
| 9 | ∞ | ∞ | ∞ | ∞ | ∞ | ∞ | ∞ | ∞ | 0 | 0 | ∞ | ∞ | ∞ | 0 | ∞ | ∞ | 0 | ∞ | ∞ | 0 | ∞ | ∞ | 0 | ∞ | ∞ | ∞ | 0 | 0 | ∞ | ∞ | ∞ | ∞ | ∞ | ∞ | ∞ | ∞ |
| 10 | ∞ | ∞ | ∞ | ∞ | ∞ | ∞ | ∞ | ∞ | 0 | 0 | ∞ | ∞ | ∞ | 0 | ∞ | ∞ | 0 | ∞ | ∞ | 0 | ∞ | ∞ | 0 | ∞ | ∞ | ∞ | 0 | 0 | ∞ | ∞ | ∞ | ∞ | ∞ | ∞ | ∞ | ∞ |
| 11 | 2 | ∞ | ∞ | ∞ | ∞ | 0 | ∞ | 2 | ∞ | ∞ | 0 | ∞ | ∞ | ∞ | 1 | 0 | ∞ | ∞ | ∞ | ∞ | 0 | 1 | ∞ | ∞ | ∞ | 0 | ∞ | ∞ | 2 | ∞ | 0 | ∞ | ∞ | ∞ | ∞ | 2 |
| 12 | ∞ | ∞ | ∞ | ∞ | ∞ | ∞ | ∞ | ∞ | ∞ | ∞ | ∞ | 0 | ∞ | ∞ | ∞ | ∞ | ∞ | ∞ | ∞ | ∞ | ∞ | ∞ | ∞ | ∞ | ∞ | ∞ | ∞ | ∞ | ∞ | ∞ | ∞ | ∞ | ∞ | ∞ | ∞ | ∞ |
| 13 | ∞ | ∞ | 0 | 0 | ∞ | ∞ | ∞ | ∞ | ∞ | ∞ | ∞ | ∞ | 0 | ∞ | ∞ | ∞ | ∞ | 0 | 0 | ∞ | ∞ | ∞ | ∞ | 0 | ∞ | ∞ | ∞ | ∞ | ∞ | ∞ | ∞ | ∞ | 0 | 0 | ∞ | ∞ |
| 14 | ∞ | ∞ | ∞ | ∞ | ∞ | ∞ | ∞ | ∞ | 0 | 0 | ∞ | ∞ | ∞ | 0 | ∞ | ∞ | 0 | ∞ | ∞ | 0 | ∞ | ∞ | 0 | ∞ | ∞ | ∞ | 0 | 0 | ∞ | ∞ | ∞ | ∞ | ∞ | ∞ | ∞ | ∞ |
| 15 | 0 | ∞ | ∞ | ∞ | ∞ | 1 | ∞ | 0 | ∞ | ∞ | 1 | ∞ | ∞ | ∞ | 0 | 0 | ∞ | ∞ | ∞ | ∞ | 0 | 0 | ∞ | ∞ | ∞ | 1 | ∞ | ∞ | 0 | ∞ | 1 | ∞ | ∞ | ∞ | ∞ | 0 |
| 16 | 1 | ∞ | ∞ | ∞ | ∞ | 0 | ∞ | 1 | ∞ | ∞ | 0 | ∞ | ∞ | ∞ | 0 | 0 | ∞ | ∞ | ∞ | ∞ | 0 | 0 | ∞ | ∞ | ∞ | 0 | ∞ | ∞ | 1 | ∞ | 0 | ∞ | ∞ | ∞ | ∞ | 1 |
| 17 | ∞ | ∞ | ∞ | ∞ | ∞ | ∞ | ∞ | ∞ | 0 | 0 | ∞ | ∞ | ∞ | 0 | ∞ | ∞ | 0 | ∞ | ∞ | 0 | ∞ | ∞ | 0 | ∞ | ∞ | ∞ | 0 | 0 | ∞ | ∞ | ∞ | ∞ | ∞ | ∞ | ∞ | ∞ |
| 18 | ∞ | ∞ | 0 | 0 | ∞ | ∞ | ∞ | ∞ | ∞ | ∞ | ∞ | ∞ | 0 | ∞ | ∞ | ∞ | ∞ | 0 | 0 | ∞ | ∞ | ∞ | ∞ | 0 | ∞ | ∞ | ∞ | ∞ | ∞ | ∞ | ∞ | ∞ | 0 | 0 | ∞ | ∞ |
| 19 | ∞ | ∞ | 0 | 0 | ∞ | ∞ | ∞ | ∞ | ∞ | ∞ | ∞ | ∞ | 0 | ∞ | ∞ | ∞ | ∞ | 0 | 0 | ∞ | ∞ | ∞ | ∞ | 0 | ∞ | ∞ | ∞ | ∞ | ∞ | ∞ | ∞ | ∞ | 0 | 0 | ∞ | ∞ |
| 20 | ∞ | ∞ | ∞ | ∞ | ∞ | ∞ | ∞ | ∞ | 0 | 0 | ∞ | ∞ | ∞ | 0 | ∞ | ∞ | 0 | ∞ | ∞ | 0 | ∞ | ∞ | 0 | ∞ | ∞ | ∞ | 0 | 0 | ∞ | ∞ | ∞ | ∞ | ∞ | ∞ | ∞ | ∞ |
| 21 | 1 | ∞ | ∞ | ∞ | ∞ | 0 | ∞ | 1 | ∞ | ∞ | 0 | ∞ | ∞ | ∞ | 0 | 0 | ∞ | ∞ | ∞ | ∞ | 0 | 0 | ∞ | ∞ | ∞ | 0 | ∞ | ∞ | 1 | ∞ | 0 | ∞ | ∞ | ∞ | ∞ | 1 |
| 22 | 0 | ∞ | ∞ | ∞ | ∞ | 1 | ∞ | 0 | ∞ | ∞ | 1 | ∞ | ∞ | ∞ | 0 | 0 | ∞ | ∞ | ∞ | ∞ | 0 | 0 | ∞ | ∞ | ∞ | 1 | ∞ | ∞ | 0 | ∞ | 1 | ∞ | ∞ | ∞ | ∞ | 0 |
| 23 | ∞ | ∞ | ∞ | ∞ | ∞ | ∞ | ∞ | ∞ | 0 | 0 | ∞ | ∞ | ∞ | 0 | ∞ | ∞ | 0 | ∞ | ∞ | 0 | ∞ | ∞ | 0 | ∞ | ∞ | ∞ | 0 | 0 | ∞ | ∞ | ∞ | ∞ | ∞ | ∞ | ∞ | ∞ |
| 24 | ∞ | ∞ | 0 | 0 | ∞ | ∞ | ∞ | ∞ | ∞ | ∞ | ∞ | ∞ | 0 | ∞ | ∞ | ∞ | ∞ | 0 | 0 | ∞ | ∞ | ∞ | ∞ | 0 | ∞ | ∞ | ∞ | ∞ | ∞ | ∞ | ∞ | ∞ | 0 | 0 | ∞ | ∞ |
| 25 | ∞ | ∞ | ∞ | ∞ | ∞ | ∞ | ∞ | ∞ | ∞ | ∞ | ∞ | ∞ | ∞ | ∞ | ∞ | ∞ | ∞ | ∞ | ∞ | ∞ | ∞ | ∞ | ∞ | ∞ | 0 | ∞ | ∞ | ∞ | ∞ | ∞ | ∞ | ∞ | ∞ | ∞ | ∞ | ∞ |
| 26 | 2 | ∞ | ∞ | ∞ | ∞ | 0 | ∞ | 2 | ∞ | ∞ | 0 | ∞ | ∞ | ∞ | 1 | 0 | ∞ | ∞ | ∞ | ∞ | 0 | 1 | ∞ | ∞ | ∞ | 0 | ∞ | ∞ | 2 | ∞ | 0 | ∞ | ∞ | ∞ | ∞ | 2 |
| 27 | ∞ | ∞ | ∞ | ∞ | ∞ | ∞ | ∞ | ∞ | 0 | 0 | ∞ | ∞ | ∞ | 0 | ∞ | ∞ | 0 | ∞ | ∞ | 0 | ∞ | ∞ | 0 | ∞ | ∞ | ∞ | 0 | 0 | ∞ | ∞ | ∞ | ∞ | ∞ | ∞ | ∞ | ∞ |
| 28 | ∞ | ∞ | ∞ | ∞ | ∞ | ∞ | ∞ | ∞ | 0 | 0 | ∞ | ∞ | ∞ | 0 | ∞ | ∞ | 0 | ∞ | ∞ | 0 | ∞ | ∞ | 0 | ∞ | ∞ | ∞ | 0 | 0 | ∞ | ∞ | ∞ | ∞ | ∞ | ∞ | ∞ | ∞ |
| 29 | 0 | ∞ | ∞ | ∞ | ∞ | 2 | ∞ | 0 | ∞ | ∞ | 2 | ∞ | ∞ | ∞ | 0 | 1 | ∞ | ∞ | ∞ | ∞ | 1 | 0 | ∞ | ∞ | ∞ | 2 | ∞ | ∞ | 0 | ∞ | 2 | ∞ | ∞ | ∞ | ∞ | 0 |
| 30 | ∞ | ∞ | ∞ | ∞ | ∞ | ∞ | ∞ | ∞ | ∞ | ∞ | ∞ | ∞ | ∞ | ∞ | ∞ | ∞ | ∞ | ∞ | ∞ | ∞ | ∞ | ∞ | ∞ | ∞ | ∞ | ∞ | ∞ | ∞ | ∞ | 0 | ∞ | ∞ | ∞ | ∞ | ∞ | ∞ |
| 31 | 2 | ∞ | ∞ | ∞ | ∞ | 0 | ∞ | 2 | ∞ | ∞ | 0 | ∞ | ∞ | ∞ | 1 | 0 | ∞ | ∞ | ∞ | ∞ | 0 | 1 | ∞ | ∞ | ∞ | 0 | ∞ | ∞ | 2 | ∞ | 0 | ∞ | ∞ | ∞ | ∞ | 2 |
| 32 | ∞ | ∞ | ∞ | ∞ | ∞ | ∞ | ∞ | ∞ | ∞ | ∞ | ∞ | ∞ | ∞ | ∞ | ∞ | ∞ | ∞ | ∞ | ∞ | ∞ | ∞ | ∞ | ∞ | ∞ | ∞ | ∞ | ∞ | ∞ | ∞ | ∞ | ∞ | 0 | ∞ | ∞ | ∞ | ∞ |
| 33 | ∞ | ∞ | 0 | 0 | ∞ | ∞ | ∞ | ∞ | ∞ | ∞ | ∞ | ∞ | 0 | ∞ | ∞ | ∞ | ∞ | 0 | 0 | ∞ | ∞ | ∞ | ∞ | 0 | ∞ | ∞ | ∞ | ∞ | ∞ | ∞ | ∞ | ∞ | 0 | 0 | ∞ | ∞ |
| 34 | ∞ | ∞ | 0 | 0 | ∞ | ∞ | ∞ | ∞ | ∞ | ∞ | ∞ | ∞ | 0 | ∞ | ∞ | ∞ | ∞ | 0 | 0 | ∞ | ∞ | ∞ | ∞ | 0 | ∞ | ∞ | ∞ | ∞ | ∞ | ∞ | ∞ | ∞ | 0 | 0 | ∞ | ∞ |
| 35 | ∞ | ∞ | ∞ | ∞ | ∞ | ∞ | ∞ | ∞ | ∞ | ∞ | ∞ | ∞ | ∞ | ∞ | ∞ | ∞ | ∞ | ∞ | ∞ | ∞ | ∞ | ∞ | ∞ | ∞ | ∞ | ∞ | ∞ | ∞ | ∞ | ∞ | ∞ | ∞ | ∞ | ∞ | 0 | ∞ |
| 36 | 0 | ∞ | ∞ | ∞ | ∞ | 2 | ∞ | 0 | ∞ | ∞ | 2 | ∞ | ∞ | ∞ | 0 | 1 | ∞ | ∞ | ∞ | ∞ | 1 | 0 | ∞ | ∞ | ∞ | 2 | ∞ | ∞ | 0 | ∞ | 2 | ∞ | ∞ | ∞ | ∞ | 0 |
| Station | 1 | 2 | 3 | 4 | 5 | 6 | 7 | 8 | 9 | 10 | 11 | 12 | 13 | 14 | 15 | 16 | 17 | 18 | 19 | 20 | 21 | 22 | 23 | 24 | 25 | 26 | 27 | 28 | 29 | 30 | 31 | 32 | 33 | 34 | 35 | 36 |
|---|---|---|---|---|---|---|---|---|---|---|---|---|---|---|---|---|---|---|---|---|---|---|---|---|---|---|---|---|---|---|---|---|---|---|---|---|
| 1 | 0 | 1 | 1 | 1 | 1 | 2 | 1 | 0 | 1 | 1 | 2 | 1 | 1 | 1 | 0 | 1 | 1 | 1 | 1 | 1 | 1 | 0 | 0 | 0 | 1 | ∞ | 1 | 1 | ∞ | 1 | ∞ | 1 | 1 | 1 | 1 | ∞ |
| 2 | 1 | 0 | 0 | 0 | 0 | 1 | 0 | 1 | 2 | 2 | 1 | 0 | 0 | 2 | 1 | 1 | 2 | 0 | 0 | 2 | 1 | 1 | 1 | 0 | 0 | ∞ | 1 | 2 | ∞ | 0 | ∞ | 0 | 0 | 0 | 0 | ∞ |
| 3 | 1 | 0 | 0 | 0 | 0 | 1 | 0 | 1 | 2 | 2 | 1 | 0 | 0 | 2 | 1 | 1 | 2 | 0 | 0 | 2 | 1 | 1 | 1 | 0 | 0 | ∞ | 1 | 2 | ∞ | 0 | ∞ | 0 | 0 | 0 | 0 | ∞ |
| 4 | 1 | 0 | 0 | 0 | 0 | 1 | 0 | 1 | 2 | 2 | 1 | 0 | 0 | 2 | 1 | 1 | 2 | 0 | 0 | 2 | 1 | 1 | 1 | 0 | 0 | ∞ | 1 | 2 | ∞ | 0 | ∞ | 0 | 0 | 0 | 0 | ∞ |
| 5 | 1 | 0 | 0 | 0 | 0 | 1 | 0 | 1 | 2 | 2 | 1 | 0 | 0 | 2 | 1 | 1 | 2 | 0 | 0 | 2 | 1 | 1 | 1 | 0 | 0 | ∞ | 1 | 2 | ∞ | 0 | ∞ | 0 | 0 | 0 | 0 | ∞ |
| 6 | 2 | 1 | 1 | 1 | 1 | 0 | 1 | 2 | 1 | 1 | 0 | 1 | 1 | 1 | 1 | 0 | 1 | 1 | 1 | 1 | 0 | 1 | 1 | 1 | 1 | ∞ | 0 | 1 | ∞ | 1 | ∞ | 1 | 0 | 1 | 1 | ∞ |
| 7 | 1 | 0 | 0 | 0 | 0 | 1 | 0 | 1 | 2 | 2 | 1 | 0 | 0 | 2 | 1 | 1 | 2 | 0 | 0 | 2 | 1 | 1 | 1 | 0 | 0 | ∞ | 1 | 2 | ∞ | 0 | ∞ | 0 | 0 | 0 | 0 | ∞ |
| 8 | 0 | 1 | 1 | 1 | 1 | 2 | 1 | 0 | 1 | 1 | 1 | 1 | 1 | 1 | 0 | 1 | 1 | 1 | 1 | 1 | 1 | 0 | 0 | 0 | 1 | ∞ | 1 | 1 | ∞ | 1 | ∞ | 1 | 1 | 1 | 1 | ∞ |
| 9 | 1 | 2 | 2 | 2 | 2 | 1 | 2 | 1 | 0 | 0 | 1 | 2 | 2 | 0 | 1 | 1 | 0 | 2 | 2 | 0 | 1 | 1 | 0 | 1 | 2 | ∞ | 0 | 0 | ∞ | 2 | ∞ | 1 | 2 | 2 | 2 | ∞ |
| 10 | 1 | 2 | 2 | 2 | 2 | 1 | 2 | 1 | 0 | 0 | 1 | 2 | 2 | 0 | 1 | 1 | 0 | 2 | 2 | 0 | 1 | 1 | 0 | 1 | 2 | ∞ | 0 | 0 | ∞ | 2 | ∞ | 1 | 2 | 2 | 2 | ∞ |
| 11 | 2 | 1 | 1 | 1 | 1 | 0 | 1 | 1 | 1 | 1 | 0 | 1 | 1 | 1 | 1 | 0 | 1 | 1 | 1 | 1 | 0 | 1 | 1 | 1 | 1 | ∞ | 0 | 1 | ∞ | 1 | ∞ | 1 | 0 | 1 | 1 | ∞ |
| 12 | 1 | 0 | 0 | 0 | 0 | 1 | 0 | 1 | 2 | 2 | 1 | 0 | 0 | 2 | 1 | 1 | 2 | 0 | 0 | 2 | 1 | 1 | 1 | 0 | 0 | ∞ | 1 | 2 | ∞ | 0 | ∞ | 0 | 0 | 0 | 0 | ∞ |
| 13 | 1 | 0 | 0 | 0 | 0 | 1 | 0 | 1 | 2 | 2 | 1 | 0 | 0 | 2 | 1 | 1 | 2 | 0 | 0 | 2 | 1 | 1 | 1 | 0 | 0 | ∞ | 1 | 2 | ∞ | 0 | ∞ | 0 | 0 | 0 | 0 | ∞ |
| 14 | 1 | 2 | 2 | 2 | 2 | 1 | 2 | 1 | 0 | 0 | 1 | 2 | 2 | 0 | 1 | 1 | 0 | 2 | 2 | 0 | 1 | 1 | 0 | 1 | 2 | ∞ | 0 | 0 | ∞ | 2 | ∞ | 1 | 2 | 2 | 2 | ∞ |
| 15 | 0 | 1 | 1 | 1 | 1 | 1 | 1 | 0 | 1 | 1 | 1 | 1 | 1 | 1 | 0 | 0 | 1 | 1 | 1 | 1 | 0 | 0 | 0 | 0 | 1 | ∞ | 1 | 1 | ∞ | 1 | ∞ | 1 | 1 | 1 | 1 | ∞ |
| 16 | 1 | 1 | 1 | 1 | 1 | 0 | 1 | 1 | 1 | 1 | 0 | 1 | 1 | 1 | 0 | 0 | 1 | 1 | 1 | 1 | 0 | 0 | 1 | 1 | 1 | ∞ | 0 | 1 | ∞ | 1 | ∞ | 1 | 0 | 1 | 1 | ∞ |
| 17 | 1 | 2 | 2 | 2 | 2 | 1 | 2 | 1 | 0 | 0 | 1 | 2 | 2 | 0 | 1 | 1 | 0 | 2 | 2 | 0 | 1 | 1 | 0 | 1 | 2 | ∞ | 0 | 0 | ∞ | 2 | ∞ | 1 | 2 | 2 | 2 | ∞ |
| 18 | 1 | 0 | 0 | 0 | 0 | 1 | 0 | 1 | 2 | 2 | 1 | 0 | 0 | 2 | 1 | 1 | 2 | 0 | 0 | 2 | 1 | 1 | 1 | 0 | 0 | ∞ | 1 | 2 | ∞ | 0 | ∞ | 0 | 0 | 0 | 0 | ∞ |
| 19 | 1 | 0 | 0 | 0 | 0 | 1 | 0 | 1 | 2 | 2 | 1 | 0 | 0 | 2 | 1 | 1 | 2 | 0 | 0 | 2 | 1 | 1 | 1 | 0 | 0 | ∞ | 1 | 2 | ∞ | 0 | ∞ | 0 | 0 | 0 | 0 | ∞ |
| 20 | 1 | 2 | 2 | 2 | 2 | 1 | 2 | 1 | 0 | 0 | 1 | 2 | 2 | 0 | 1 | 1 | 0 | 2 | 2 | 0 | 1 | 1 | 0 | 1 | 2 | ∞ | 0 | 0 | ∞ | 2 | ∞ | 1 | 2 | 2 | 2 | ∞ |
| 21 | 1 | 1 | 1 | 1 | 1 | 0 | 1 | 1 | 1 | 1 | 0 | 1 | 1 | 1 | 0 | 0 | 1 | 1 | 1 | 1 | 0 | 0 | 1 | 1 | 1 | ∞ | 0 | 1 | ∞ | 1 | ∞ | 1 | 0 | 1 | 1 | ∞ |
| 22 | 0 | 1 | 1 | 1 | 1 | 1 | 1 | 0 | 1 | 1 | 1 | 1 | 1 | 1 | 0 | 0 | 1 | 1 | 1 | 1 | 0 | 0 | 0 | 0 | 1 | ∞ | 1 | 1 | ∞ | 1 | ∞ | 1 | 1 | 1 | 1 | ∞ |
| 23 | 0 | 1 | 1 | 1 | 1 | 1 | 1 | 0 | 0 | 0 | 1 | 1 | 1 | 0 | 0 | 1 | 0 | 1 | 1 | 0 | 1 | 0 | 0 | 0 | 1 | ∞ | 0 | 0 | ∞ | 1 | ∞ | 1 | 1 | 1 | 1 | ∞ |
| 24 | 0 | 0 | 0 | 0 | 0 | 1 | 0 | 0 | 1 | 1 | 1 | 0 | 0 | 1 | 0 | 1 | 1 | 0 | 0 | 1 | 1 | 0 | 0 | 0 | 0 | ∞ | 1 | 1 | ∞ | 0 | ∞ | 0 | 0 | 0 | 0 | ∞ |
| 25 | 1 | 0 | 0 | 0 | 0 | 1 | 0 | 1 | 2 | 2 | 1 | 0 | 0 | 2 | 2 | 2 | 2 | 0 | 0 | 2 | 1 | 1 | 1 | 0 | 0 | ∞ | 1 | 2 | ∞ | 0 | ∞ | 0 | 0 | 0 | 0 | ∞ |
| 26 | ∞ | ∞ | ∞ | ∞ | ∞ | ∞ | ∞ | ∞ | ∞ | ∞ | ∞ | ∞ | ∞ | ∞ | ∞ | ∞ | ∞ | ∞ | ∞ | ∞ | ∞ | ∞ | ∞ | ∞ | ∞ | 0 | ∞ | ∞ | ∞ | ∞ | ∞ | ∞ | ∞ | ∞ | ∞ | ∞ |
| 27 | 1 | 1 | 1 | 1 | 1 | 0 | 1 | 1 | 0 | 0 | 0 | 1 | 1 | 0 | 1 | 0 | 0 | 1 | 1 | 0 | 0 | 1 | 0 | 1 | 1 | ∞ | 0 | 0 | ∞ | 1 | ∞ | 1 | 0 | 1 | 1 | ∞ |
| 28 | 1 | 2 | 2 | 2 | 2 | 1 | 2 | 1 | 0 | 0 | 1 | 2 | 2 | 0 | 1 | 1 | 0 | 2 | 2 | 0 | 1 | 1 | 0 | 1 | 2 | ∞ | 0 | 0 | ∞ | 2 | ∞ | 1 | 2 | 2 | 2 | ∞ |
| 29 | ∞ | ∞ | ∞ | ∞ | ∞ | ∞ | ∞ | ∞ | ∞ | ∞ | ∞ | ∞ | ∞ | ∞ | ∞ | ∞ | ∞ | ∞ | ∞ | ∞ | ∞ | ∞ | ∞ | ∞ | ∞ | ∞ | ∞ | ∞ | 0 | ∞ | ∞ | ∞ | ∞ | ∞ | ∞ | ∞ |
| 30 | 1 | 0 | 0 | 0 | 0 | 1 | 0 | 1 | 2 | 2 | 1 | 0 | 0 | 1 | 1 | 1 | 2 | 0 | 0 | 2 | 1 | 1 | 1 | 0 | 0 | ∞ | 1 | 2 | ∞ | 0 | ∞ | 0 | 0 | 0 | 0 | ∞ |
| 31 | ∞ | ∞ | ∞ | ∞ | ∞ | ∞ | ∞ | ∞ | ∞ | ∞ | ∞ | ∞ | ∞ | ∞ | ∞ | ∞ | ∞ | ∞ | ∞ | ∞ | ∞ | ∞ | ∞ | ∞ | ∞ | ∞ | ∞ | ∞ | ∞ | ∞ | 0 | ∞ | ∞ | ∞ | ∞ | ∞ |
| 32 | 1 | 0 | 0 | 0 | 0 | 1 | 0 | 1 | 2 | 2 | 1 | 0 | 0 | 2 | 2 | 2 | 2 | 0 | 0 | 2 | 1 | 1 | 1 | 0 | 0 | ∞ | 1 | 2 | ∞ | 0 | ∞ | 0 | 0 | 0 | 0 | ∞ |
| 33 | 1 | 0 | 0 | 0 | 0 | 0 | 0 | 1 | 1 | 1 | 0 | 0 | 0 | 1 | 1 | 0 | 1 | 0 | 0 | 1 | 0 | 1 | 1 | 0 | 0 | ∞ | 0 | 1 | ∞ | 0 | ∞ | 0 | 0 | 0 | 0 | ∞ |
| 34 | 1 | 0 | 0 | 0 | 0 | 1 | 0 | 1 | 2 | 2 | 1 | 0 | 0 | 2 | 2 | 2 | 2 | 0 | 0 | 2 | 1 | 1 | 1 | 0 | 0 | ∞ | 1 | 2 | ∞ | 0 | ∞ | 0 | 0 | 0 | 0 | ∞ |
| 35 | 1 | 0 | 0 | 0 | 0 | 1 | 0 | 1 | 2 | 2 | 1 | 0 | 0 | 2 | 2 | 2 | 2 | 0 | 0 | 2 | 1 | 1 | 1 | 0 | 0 | ∞ | 1 | 2 | ∞ | 0 | ∞ | 0 | 0 | 0 | 0 | ∞ |
| 36 | ∞ | ∞ | ∞ | ∞ | ∞ | ∞ | ∞ | ∞ | ∞ | ∞ | ∞ | ∞ | ∞ | ∞ | ∞ | ∞ | ∞ | ∞ | ∞ | ∞ | ∞ | ∞ | ∞ | ∞ | ∞ | ∞ | ∞ | ∞ | ∞ | ∞ | ∞ | ∞ | ∞ | ∞ | ∞ | 0 |
| Project Name | Country | ζ (%) | Dt (m) | Actual Costs | Avg. Capital Costs | Variation. % |
|---|---|---|---|---|---|---|
| Copenhagen Metro Phases 1–3 | Denmark | 48% | 6.40 | 318 | 317.65 | −0.11 |
| Caracas Line 3 | Venezuela | 100 | 6.80 | 470 | 491.20 | +4.51 |
| Singapore metro | Singapore | 30 | 6.60 | 258 | 265.80 | +3.02 |
| Berlin U-Bahn metro | Germany | 100 | 6.60 | 459 | 484.70 | +5.60 |
| Structure No. | ||||
|---|---|---|---|---|
| 1 | 0 | 0 | 0 | 1 |
| 2 | 0 | 0 | 1 | 1 |
| 3 | 0 | 1 | 2 | 9 |
Publisher’s Note: MDPI stays neutral with regard to jurisdictional claims in published maps and institutional affiliations. |
© 2020 by the authors. Licensee MDPI, Basel, Switzerland. This article is an open access article distributed under the terms and conditions of the Creative Commons Attribution (CC BY) license (http://creativecommons.org/licenses/by/4.0/).
Share and Cite
Owais, M.; Ahmed, A.S.; Moussa, G.S.; Khalil, A.A. An Optimal Metro Design for Transit Networks in Existing Square Cities Based on Non-Demand Criterion. Sustainability 2020, 12, 9566. https://doi.org/10.3390/su12229566
Owais M, Ahmed AS, Moussa GS, Khalil AA. An Optimal Metro Design for Transit Networks in Existing Square Cities Based on Non-Demand Criterion. Sustainability. 2020; 12(22):9566. https://doi.org/10.3390/su12229566
Chicago/Turabian StyleOwais, Mahmoud, Abdou S. Ahmed, Ghada S. Moussa, and Ahmed A. Khalil. 2020. "An Optimal Metro Design for Transit Networks in Existing Square Cities Based on Non-Demand Criterion" Sustainability 12, no. 22: 9566. https://doi.org/10.3390/su12229566