Communication

Atmospheric Carbon Dioxide and Electricity Production Due to Lockdown

1
Environmental Technology, School of Industrial Technology, Universiti Sains Malaysia, Gelugor, Pulau Pinang 11800 USM, Malaysia
2
Centre for Marine and Coastal Studies (CEMACS), Universiti Sains Malaysia, Gelugor, Pulau Pinang 11800 USM, Malaysia
3
A-LG-03, Block A, Elite Scientific Instruments Sdn Bhd, Serdang Perdana Selatan, Section 1, Selangor Darul Ehsan, Seri Kembangan 43300, Malaysia
*
Authors to whom correspondence should be addressed.
Sustainability 2020, 12(22), 9397; https://doi.org/10.3390/su12229397
Submission received: 8 September 2020 / Revised: 21 October 2020 / Accepted: 23 October 2020 / Published: 12 November 2020

Abstract

:
We analyzed real-time measurements of atmospheric carbon dioxide (CO2), with total electricity production and nationwide restrictions phases in China, the United States of America, Europe, and India due to the novel coronavirus COVID-19 pandemic and its effects on atmospheric CO2. A decline of 3.7% in the global energy demand at about 150 million tonnes of oil equivalent (Mtoe) in the first quarter (Q1) of 2020 was recorded compared to Q1 2019 due to the cutback on international economic activities. Our results showed that: (1) electricity production for the same period in 2018, 2019, and 2020 shrunk at an offset of 9.20%, which resulted in a modest reduction (−1.79%) of atmospheric CO2 to the 2017–2018 CO2 level; (2) a non-seasonal, abrupt, and brief atmospheric CO2 decrease by 0.85% in mid-February 2020 could be due to Phase 1 restrictions in China. The results indicate that electricity production reduction is significant to the short-term variability of atmospheric CO2. It also highlights China’s significant contribution to atmospheric CO2, which suggests that, without the national restriction of activities, CO2 concentration is set to exceed 2019 by 1.79%. Due to the lockdown, it quickly decreased and sustained for two months. The results underscore atmospheric CO2 reductions on the monthly time scale that can be achieved if electricity production from combustible sources was slashed. The result could be useful for cost-benefit analyses on the decrease in electricity production of combustible sources and the impact of this reduction on atmospheric CO2.

1. Introduction

COVID-19 Restrictions and Its Environmental Impact

The novel coronavirus disease (COVID-19) pandemic has led to a public health predicament of unprecedented magnitude. Besides research on developing treatment and vaccines, some studies have addressed the “lockdown” effects on the environment. The large scale on which the phenomenon has occurred offers a rare glimpse of the impact of policies and strategies on the global atmosphere that would otherwise be difficult to study. One such international policy is nationwide restrictions on industrial, educational, and tourism activities, resulting in lower energy demand and reduced greenhouse gas emissions, such as CO2 [1]. This abrupt decline in emission could lead to decreased atmospheric CO2 concentrations, which this work intends to explore. Extensive examinations on the potential for near-term emissions reductions could be carried out so that the reduction causes minimal impact on societal well-being. The economic response to the COVID-19 pandemic will also likely influence the future pathway of CO2 emissions [1].
COVID-19 spread globally in December 2019 after it was detected in the city of Wuhan, China. COVID-19 spread exponentially across all nations globally, claiming hundreds of thousands of lives, especially among the elderly and immunocompromised individuals [2]. In Malaysia, the COVID-19 index case was first detected on 25 January 2020. Ministry of Health Malaysia reported the number of confirmed instances of COVID-19 during the Phase I Movement Control Order or MCO was 2766 cases, while in Phase II in mid-April 2020, the ministry reported 4987 cases [3].
The global manufacturing output growth registered a sharp decline of 6% in the first quarter (Q1) of 2020 due to the economic lockdown caused by the COVID-19 pandemic. This decline is attributable to China’s lockdown to contain its spread. As the world’s largest manufacturer, China was tremendously affected by COVID-19, which indicated a 14.1% drop. Nearly all Chinese industries experienced a negative growth rate in Q1 2020, including motor vehicles (−27.3%), textiles (−22.5%), computer electronics (−5.2%), and basic metals (−1.9%). Meanwhile, North America’s manufacturing output fell by 2.4% in Q1 2020 and 1.1% in the last quarter of 2019 [4].
In the face of the pandemic, most governments worldwide enforced directives and legislate orders restricting mobility, gatherings, or meetings. Workers all over the world were ordered to work from home due to the confinement imposed. The movement restrictions across nations, states, and cities negatively impacted the manufacturing, agriculture, shipping, and tourism sectors. With the detention of people to their homes and with all the industries and factories shuttered, it was observed that there was a drastic reduction in vehicular and industrial emissions, which positively impacted air quality [3]. The low emission could extend to a significant decrease in atmospheric CO2 concentrations.
A decrease in air pollutant concentrations ranging from 30 to 50% was found in European countries due to lockdown measures [5]. In the first phase of lockdown and baselines established in 2017–2019 in the US, the reduction of air pollutants was found in the range of 37 to 49% [6]. In China, air pollution levels decreased by 25% during the lockdown period, which is about 1 million tonnes less than in the same period in the previous year [7]. In India, air pollution levels decreased by 52% compared to the past three years [8]. In Australia, based in [9], air pollution was extremely low to extremely high. The extremely high polluted air was reported to decrease from 1.55% to 0%, the very high category decreased from 5.43% to 0.26%, and the high category decreased from 16.80% to 1.55%. The data was obtained using a survey that looked at citizens’ perception of air quality before and during the restriction phases. In the recently published work by researchers on the air quality status during Malaysia’s Movement Control Order (MCO), the particulate matter’s concentrations showed up to 58.4% reduction in concentration in several areas marked as COVID-19 “red zones” [3]. A similar pattern was observed in the emission of CO2 [1]. But, the effect of reduced emission of CO2 on atmospheric CO2 concentration has yet to be reported.
We studied whether global movement restriction and complete shutdown of most economic sectors and subsequent decrease in electricity production and CO2 emission reduced atmospheric CO2 concentrations. Atmospheric CO2 concentration was collected from a station situated in a remote location. The data was then compared with the different stages of the restriction of activities imposed by high-emitting CO2 nations like China, Europe, the United States of America, and India, and then evaluated against the electricity production data to determine if the latter affected atmospheric CO2 concentrations. Hence, the scope of this work is the effect of global electricity production on the atmospheric CO2 measured in the Southeast Asia region. The temporal range considered is the first quarter of three consecutive years of 2018, 2019, and 2020 and the analysis done is on the monthly time scale. This work also adds to Quéré et al.’s [1] results since their paper studied the potential reduction of CO2 emission due to the lockdown.

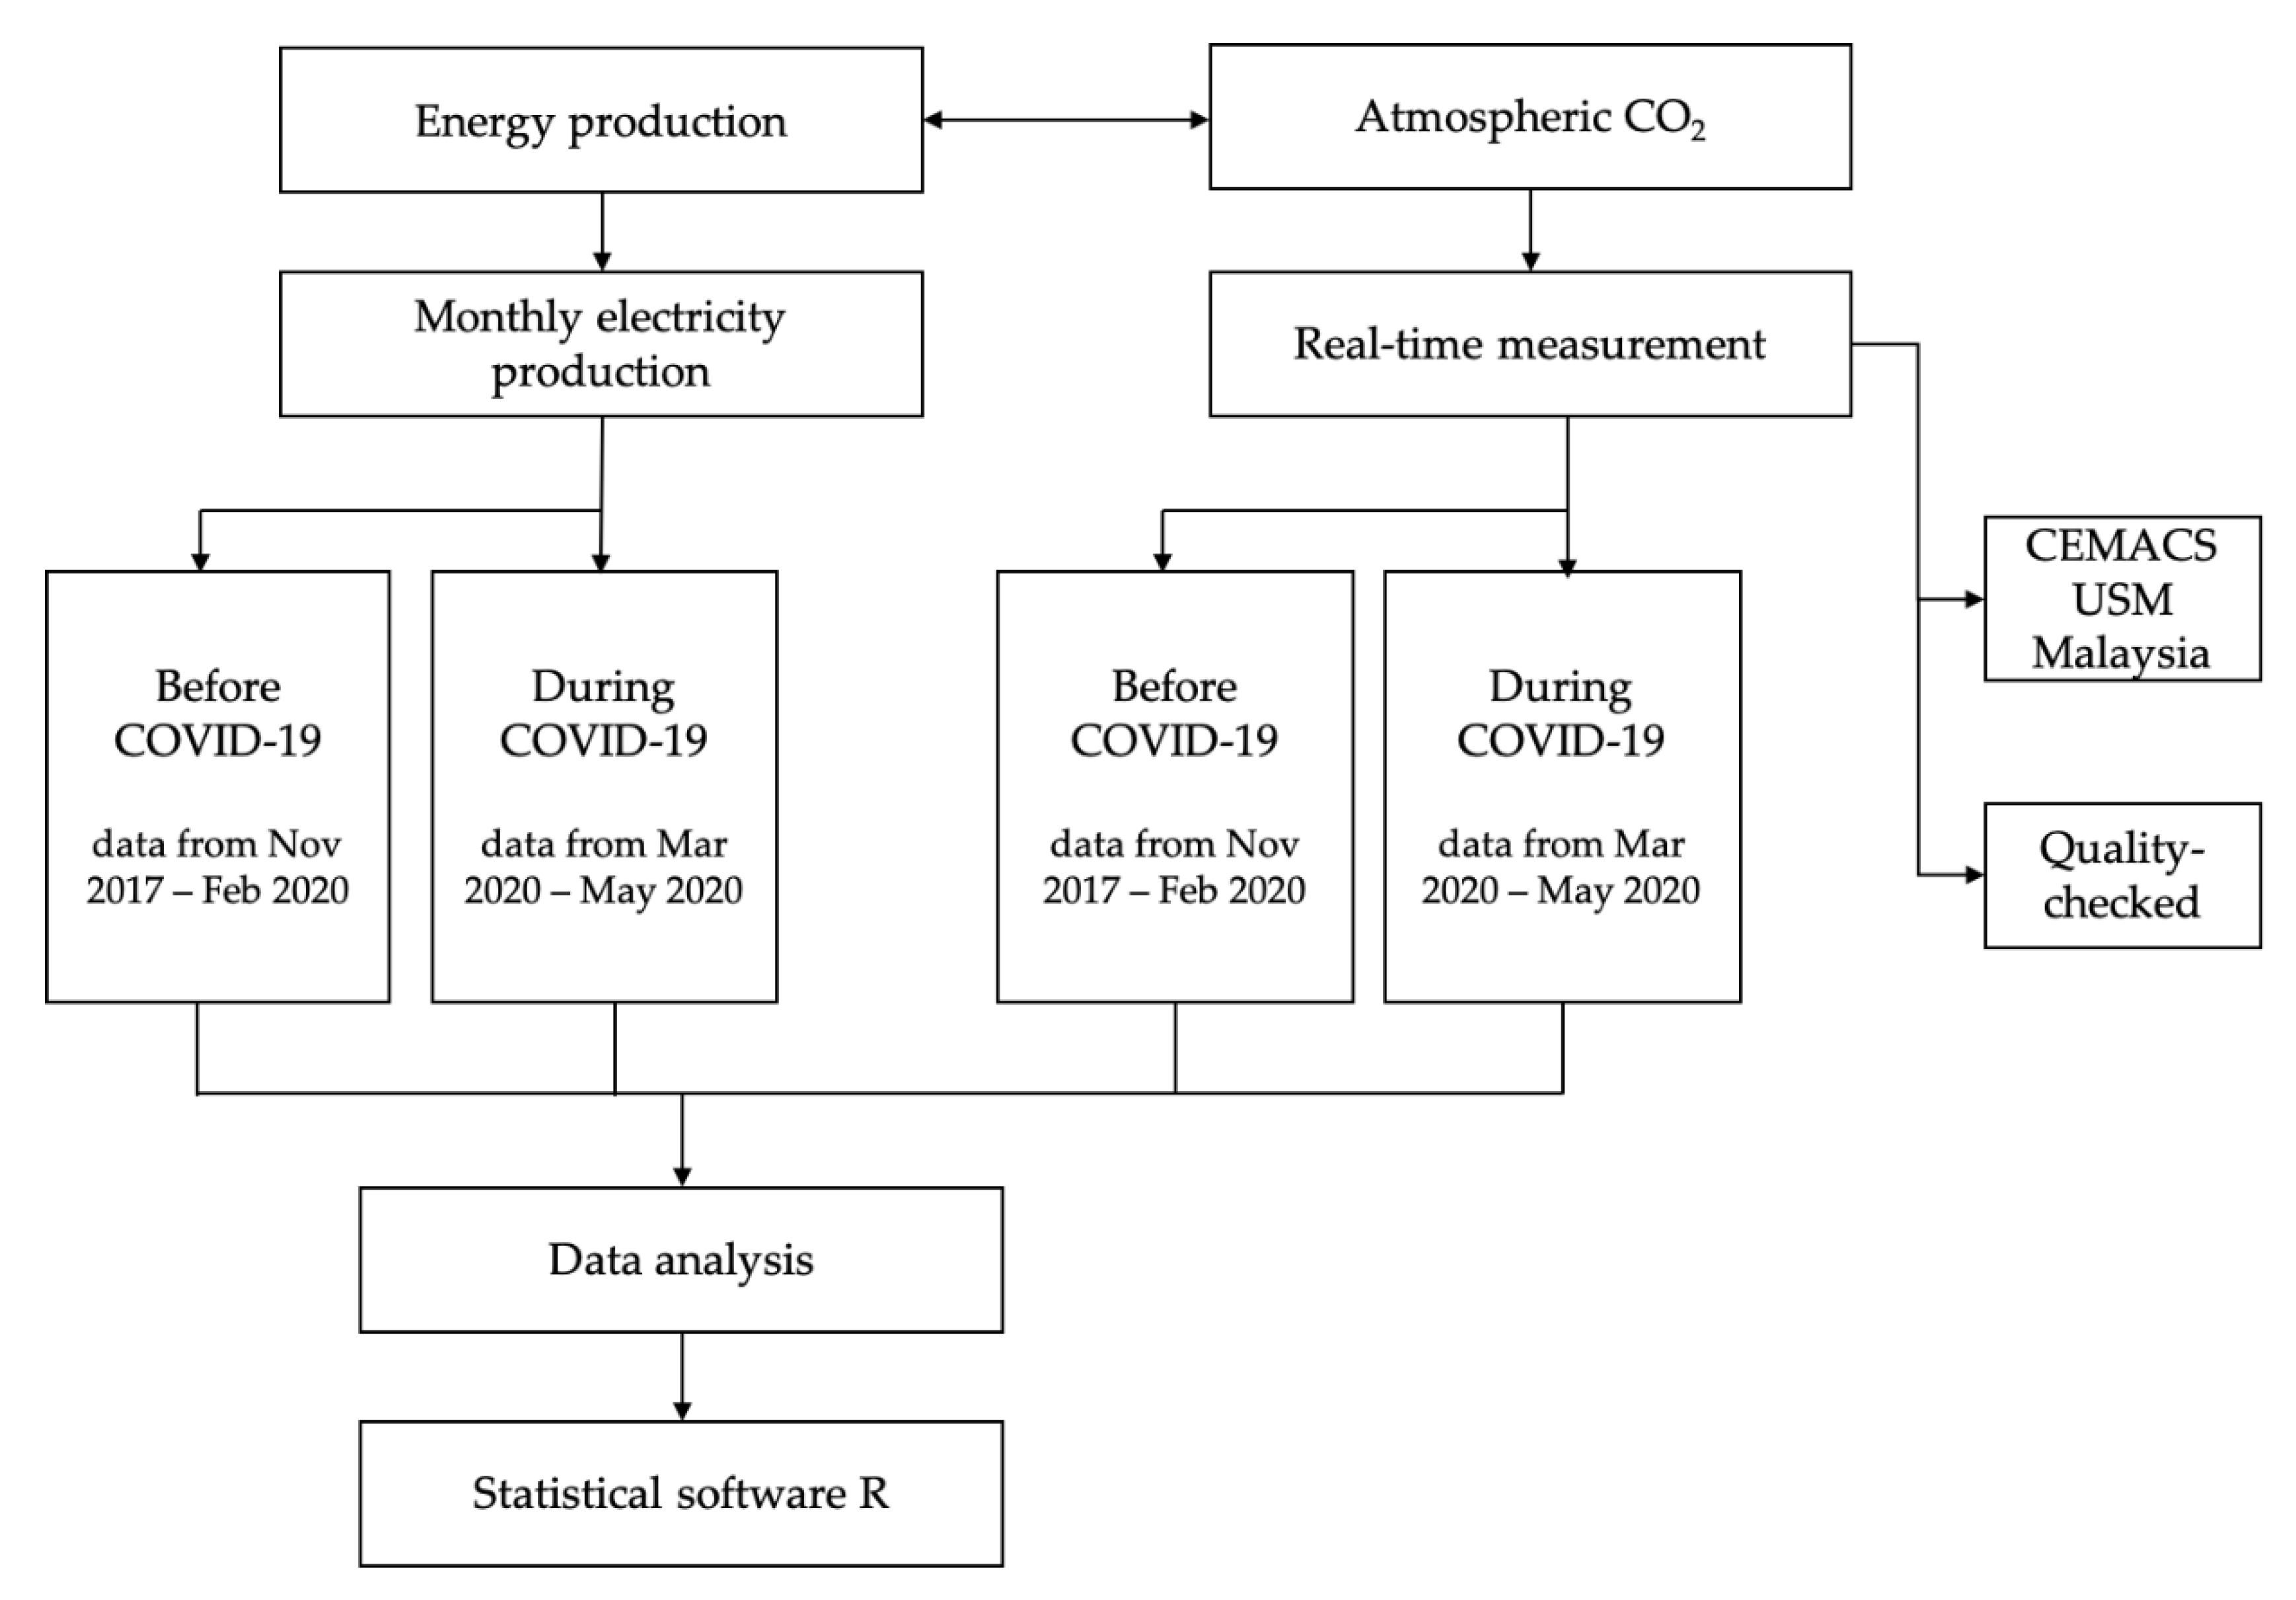
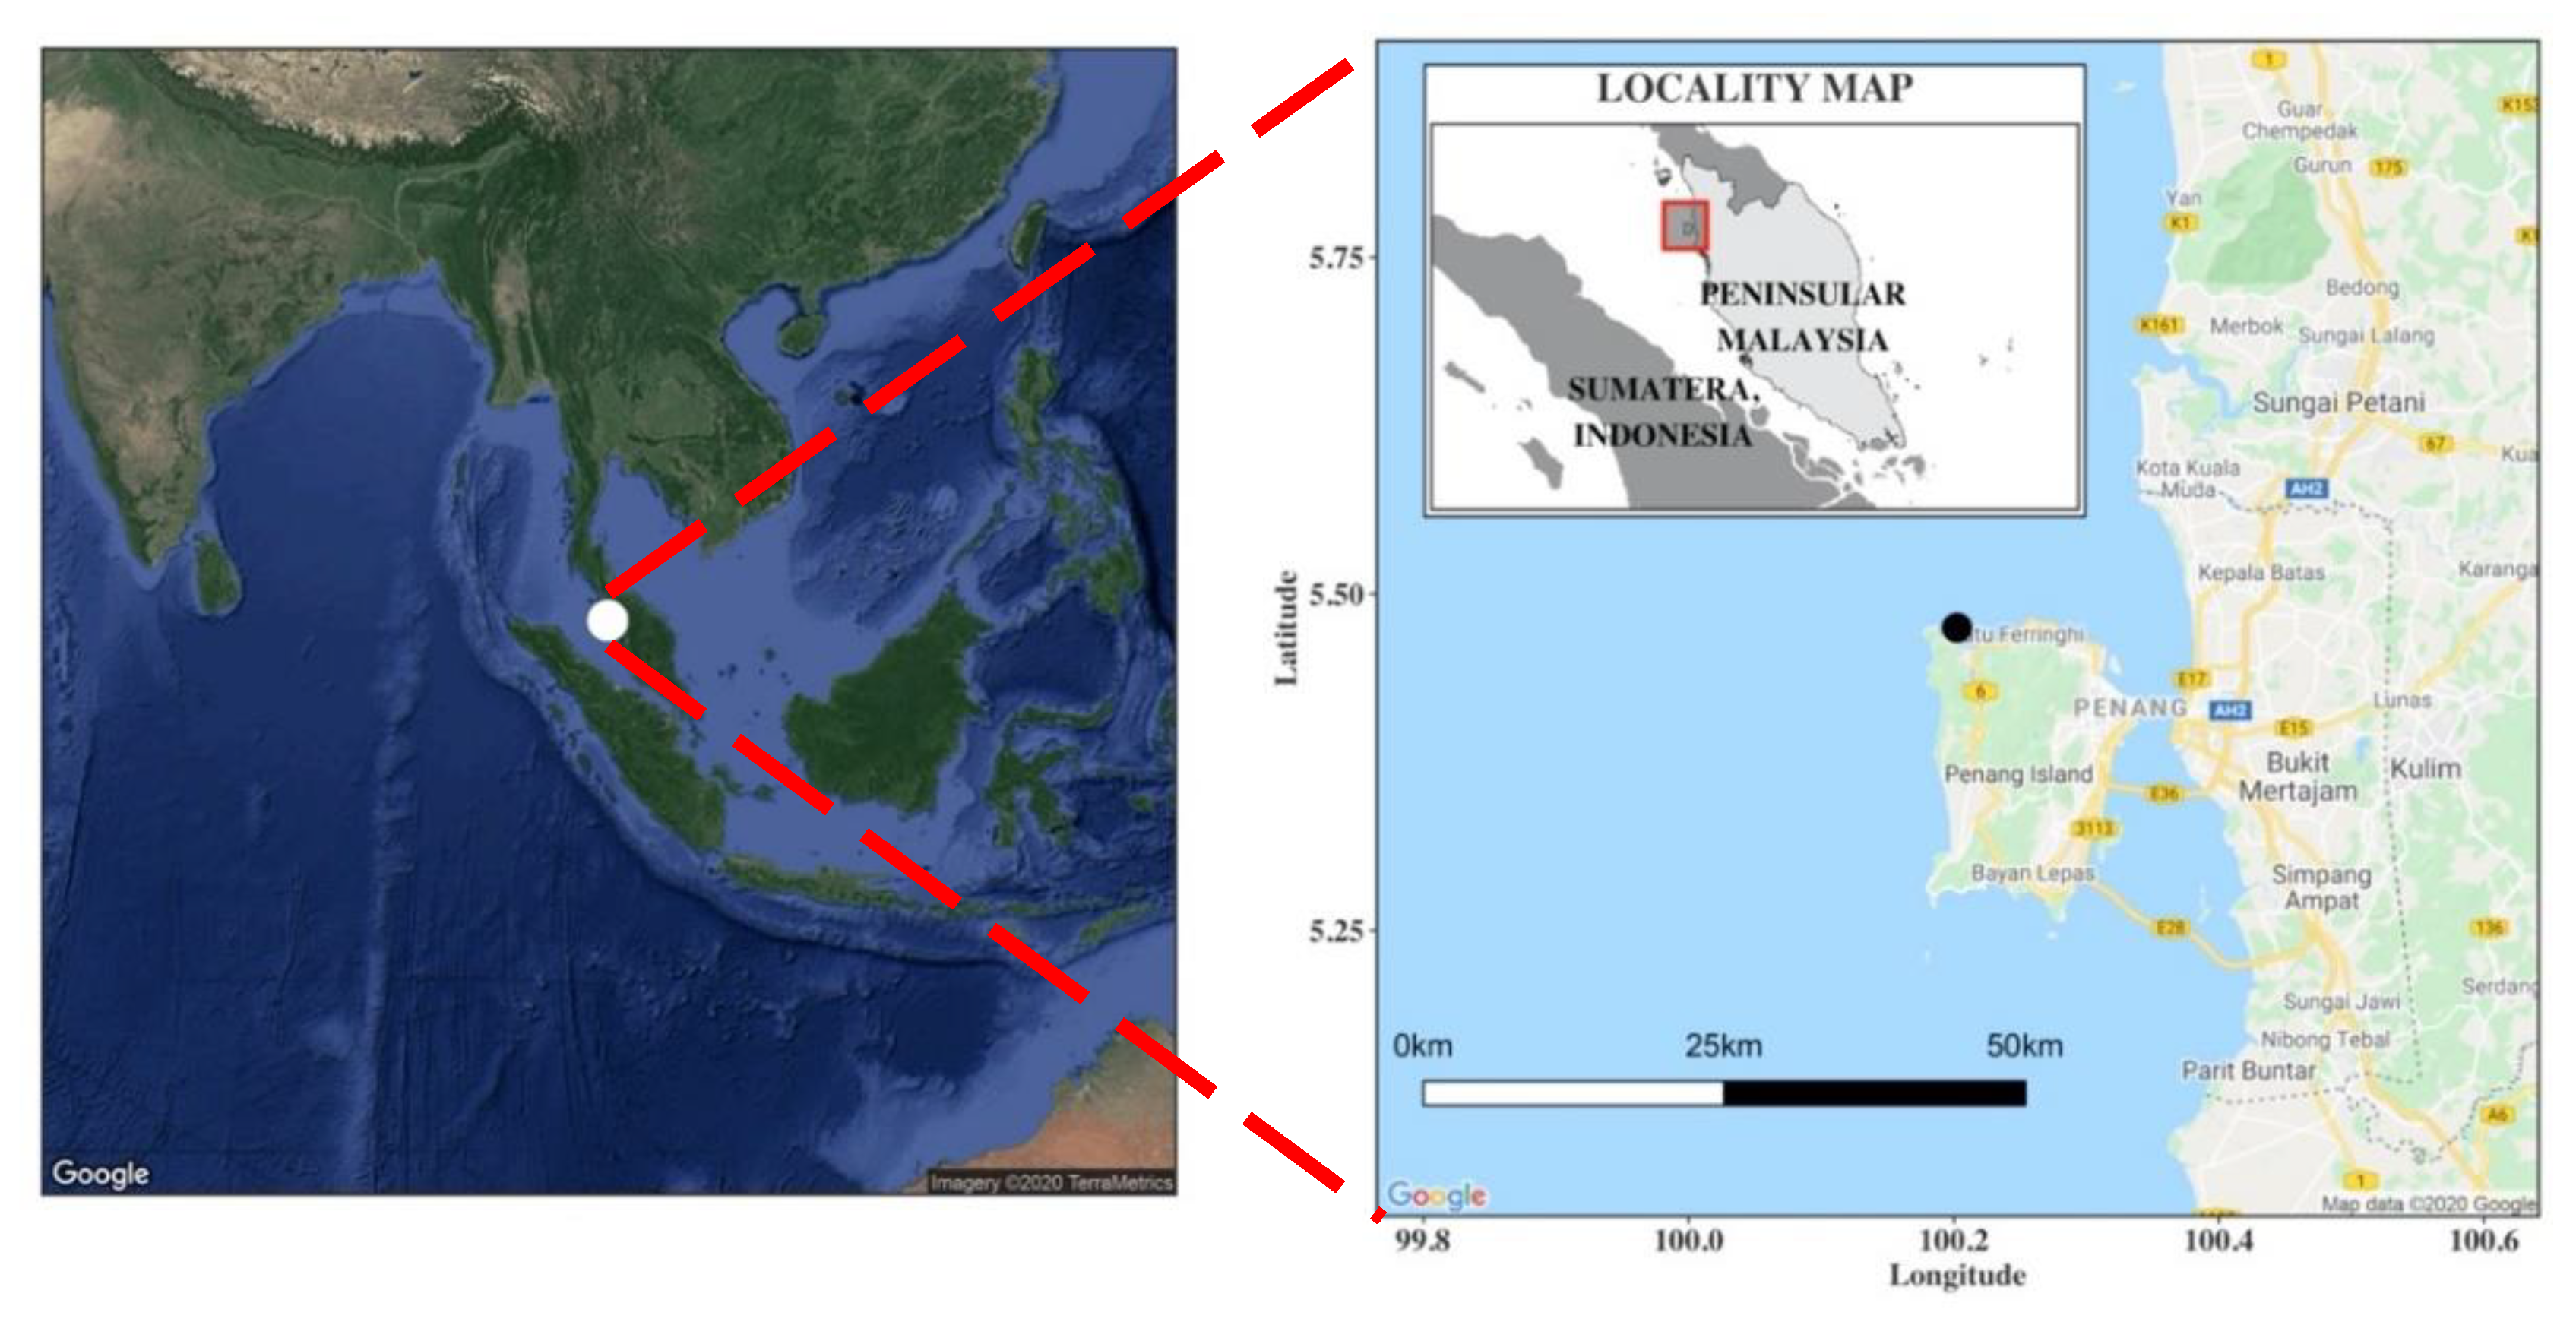
2. Materials and Methods

Our method consists of two main steps: the data collection on (1) energy production and (2) atmospheric CO2. The linkage between energy production and atmospheric CO2 concentration is illustrated in the flowchart in Figure 1. Energy production is associated with the burning of combustible fuel, of which a high percentage is fossil fuels. Energy production increases the combustion of fossil fuel, which emits CO2. Energy production ramps up when demand is high and the lockdown reduced energy demand and production, which could reduce atmospheric CO2 concentrations.
We note that time lag will exist between CO2 emission and atmospheric concentration of CO2 since the gas’s residence time is ten years. Carbon dioxide is an inert gas that is well-mixed in the atmosphere and varies by only 1% globally [10]. Thus, the CO2 measurement at our monitoring station represents the greater region of Southeast Asia and makes it sufficient to study the effects of Malaysia’s lockdown. A spike in CO2 emission will take more than a decade to reduce through natural processes such as photosynthesis, burial, and subduction. However, this study investigates the monthly short term effects of a significant decrease of CO2 emission [1] observed during the reduced electricity production phase caused by the lockdown.
A study reported that the monthly effects of photosynthesis and decay processes and the general circulation of atmospheric CO2 are observable from monthly records of CO2 concentration at the Mauna Lao station. Hence, the lag between CO2 emission or absorption and atmospheric concentration would be one month [11]. This analysis is performed on a monthly-averaged basis, and thus any additional lag between CO2 emission and atmospheric CO2 concentration due to anthropogenic emissions would be minimized. The location of the Muka Head station is at the equator, similar to the Mauna Loa station, and it would register bi-annual cycles of atmospheric CO2 concentration. This observation also suggests that the lag is one month.
The global energy demand was analyzed using the available data from the International Energy Agency (IEA) Report of Global Energy Review and IEA Monthly Organization for Economic Cooperation and Development (OECD) Electricity Report for the year 2020 [12]. These data were accessed from the IEA Energy Data Centre, which provides an accurate, authoritative, comprehensive, and timely global energy source. The IEA are able to collect the data due to an agreement made among various countries that obligate the latter to report their energy data to the IEA. These data sources were used by many researchers for their studies on the impacts of the COVID-19 lockdown [13]. The researchers employ IEA dataset in their analyses because it is a reputable online platform that reports energy production.
In our analysis, the energy data were compared between Q1 (from January to March) 2020 and Q1 2019. The energy demand data for both Q1 2020 and 2019 were in TWh and were compared in terms of their percentage difference. The results showed energy demand reduction in some selected countries after the implementation of the strict lockdown. Total electricity production for November 2019 to May 2020 was obtained alongside the energy demands data from the IEA Statistics Report of Global Energy Review [12]. Up-to-date monthly energy demand data is currently unavailable to be directly compared with atmospheric CO2 concentrations, so electricity production is used as a proxy to energy demand.
Real-time atmospheric CO2 concentration data were measured from a weather station on a tropical coast. The station is located at the Centre for Marine and Coastal Studies (CEMACS) Universiti Sains Malaysia (USM) at the northwestern end of the Pulau Pinang island in Peninsular Malaysia. This station can be considered a station that measures atmospheric background CO2 because anthropogenic sources minimally influence it. Situated on latitudes 5°28′06″ N and longitudes 100°12′01″ E, as shown in Figure 2, the station was named the “Muka Head Station” where the instruments were mounted on a stainless-steel podium that was built in 2015. Further details on the station can be found in the published literature [14,15,16,17], and the website http://atmosfera.usm.my. It is also located approximately 3000 km from China and India and 14,000 km from the United States of America.
Atmospheric CO2 concentration in parts per million (ppm) was measured using an infrared gas analyzer (model LI-7550, LI-COR, Lincoln, NE, USA) at a frequency of 20 Hz. The analyzer was calibrated before installation. The CO2 concentration measurements were averaged in 30-min blocks. The high-frequency data were quality-checked and processed using the EddyPro software (version 6.2.0, LI-COR, Nebraska, USA) and the Tovi software (version 2.8.1, LI-COR Biosciences, Nebraska, USA). Further analyses were performed, and plots were produced using the statistical software R (version 3.6.3) and RStudio (version 1.2.5033). Atmospheric CO2 would be affected by the global general circulation pattern. Depending on the location and season, CO2 from China would flow to the equator and the Muka Head station during the analysis period. The winds would flow from China due to the Northeast Monsoon from November to February. During the Spring Transitional Monsoon from March to May, the air masses would be generally contained in the Southeast Asia region [18].
The different phases of the worldwide restriction of activities are defined in Table 1 that corresponds to decreased industrial activities and electricity production, which have been associated with CO2 emissions. Here, only electricity produced by coal, natural gas, and other combustibles is considered. This classification was adapted and simplified from [1], where activities that were restricted and could reduce CO2 emissions were categorized.
Phase 1 is for China’s lockdown, which has the largest drop in electricity production at −12% in February 2020 compared to February 2019, and China constitutes 28% of the global total CO2 emission. China was the first country to implement the national lockdown at the end of January 2020, which led to a nationwide restriction of activities [19]. By early March 2020, other regions around the world also charted positive and negative changes: United States (+0.002% electricity production at 14% of global CO2 emission) and Europe—Germany, United Kingdom, Italy, France, and Poland (−13% electricity production at 6% global CO2 emission). In Australia, during the lockdown, it was reported that the overall electricity production declined by 6.7% in March, which also resulted in CO2 emission reduction. The pre-lockdown and post-lockdown data were compared, and the findings showed a decrease in commercial and industrial demand for electricity by 7% and 1%, respectively.
Meanwhile, there was an increment of 14% in electricity demand in residential areas [12]. However, the overall demand has not dropped significantly compared to other countries [13]. Taking cues from foreign counterparts, India’s government decided the nationwide lockdown on 25 March [20]. This recorded changes in +16% of electricity production at 7% of global CO2 emissions. Similar trends were also observed in other countries, where their respective governments enforced national restriction on all activities, which further decreased electricity production and CO2 emissions. This duration is categorized as Phase 2. On the local front, the Malaysian government enforced the Movement Control Order (MCO) on 18 March 2020, which obligated most industries and factories, except essential services like the healthcare and food industries, to shut down. Workers were ordered to work from home [21].

3. Results and Discussion

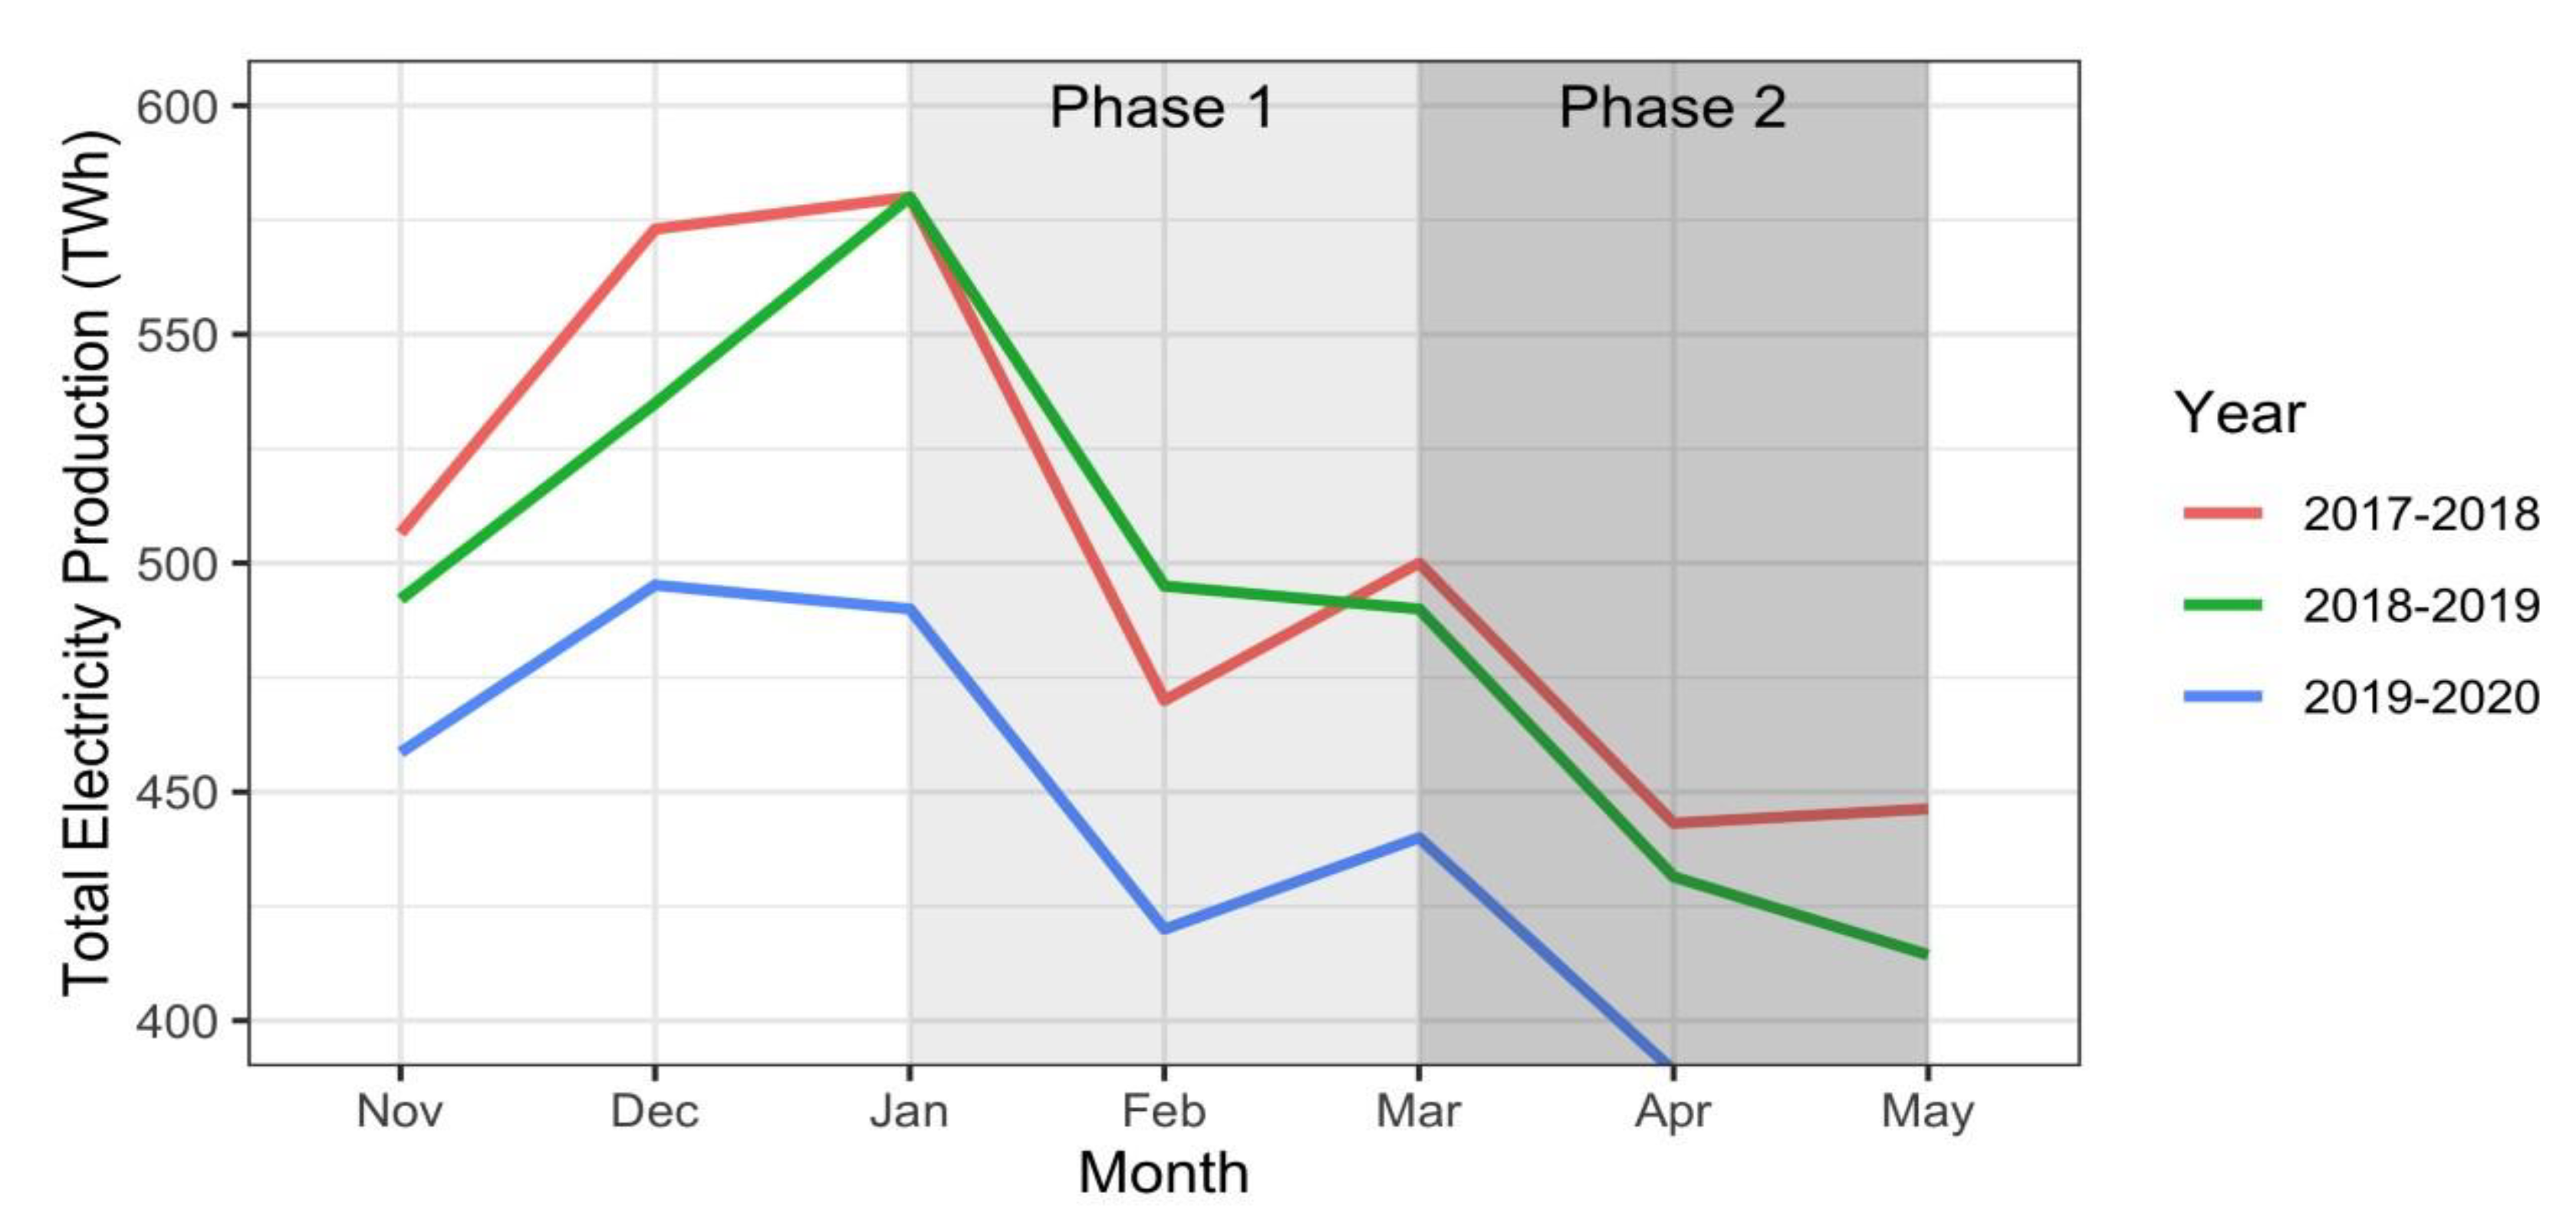
3.1. Reduction in Global Electricity Production During COVID-19

Energy is the input of all economic activities, and the expenditure of energy releases CO2 into the atmosphere. The COVID-19 pandemic is anticipated to lower global energy demand and consumption and thus decrease CO2 emission. A decline of 3.7%, at about 150 million tonnes of oil equivalent (Mtoe), in Q1 2020 global energy demand was reported as compared to Q1 2019 due to the cutback of international economic activities in various sectors [12]. The percentage of declined by sources and the contributed factors is summarized in Table 2.
Energy demand has declined significantly because of strict full and partial lockdowns imposed by governments around the globe. The IEA estimated energy demand sunk −15% in countries where comprehensive and stringent lockdowns were enforced [12].
The global or total demand for energy in the form of electricity produced from coal, natural gas, and other combustibles from November to May for three years, i.e., 2017–2018, 2018–2019, and 2019–2020 are presented in Figure 3. Phase 1 covers the period for the national restriction of activities in China. In contrast, Phase 2 covers the periods of lockdown for other parts of the world, i.e., the United States, Europe, and India. The data show the seasonal decline in the total electricity production from January until May in each period considered. It shows the peak productions of about 580 TWh, at the end of December, to 470 and 490 TWh, in the 2017–2018 and 2018–2019, respectively. The total electricity productions in 2019–2020 adhere to the same trend, although for the same period, it is consistently lower by 100 ± 50 TWh, from 485 TWh to 420 TWh. It shows that Phase 1 and Phase 2 did not affect the trend of electricity production but offsets it to a lower average, at approximately 9.20% from the total electricity production if restrictions or lockdowns were not enforced. The offset is also triggered by the lockdown of China (Phase 1), while Phase 2 did not further slash electricity production. The 9.20% decline is consistent with the overall decrease in energy demand reported by the IEA [12]. The procedures implemented by the countries in dealing with COVID-19 containment measures have drastically changed peoples’ habits and activities. This behavioral change was reflected in the electricity production and consumption between several European countries with extensive and less or no restriction measures, as reported in a study [22].
The MCO is unlikely to significantly decrease the total electricity production since Malaysia is a small country with low electricity production of 12,000 to 13,000 GWh monthly [12]. Other reports stated that the significant decrease of over 5% in Q1 2020 global energy demand has brought about a substantial decline in the CO2 emissions as compared to Q1 2019, which stem from disruptions of transport systems and industrial sectors of the economy, as well as the reduction in products and services demands [1,23]. In [1], and even more rapid decrease was projected across the remaining nine months of 2020 with the predicted reduction value of 30.6 Gt of carbon. However, as shown in Figure 3, our results exhibit the cutback in electricity production might unfold as an offset reduction and not a compounded drop in electricity production.
The lockdown placed stringent controls on almost all human activities such as restrictions on vehicles’ movement and shutting down industries, government, private commercial offices, educational institutes, and construction projects [24]. These contributed to the changes in electricity production and global CO2 emissions [25]. However, emissions reductions associated with the pandemic are likely to be only temporary and uncertain. Therefore, a long-term structural shift in countries’ economies of various existing systems such as production and energy supply chain towards green and sustainability is required to avoid emissions from skyrocketing again.

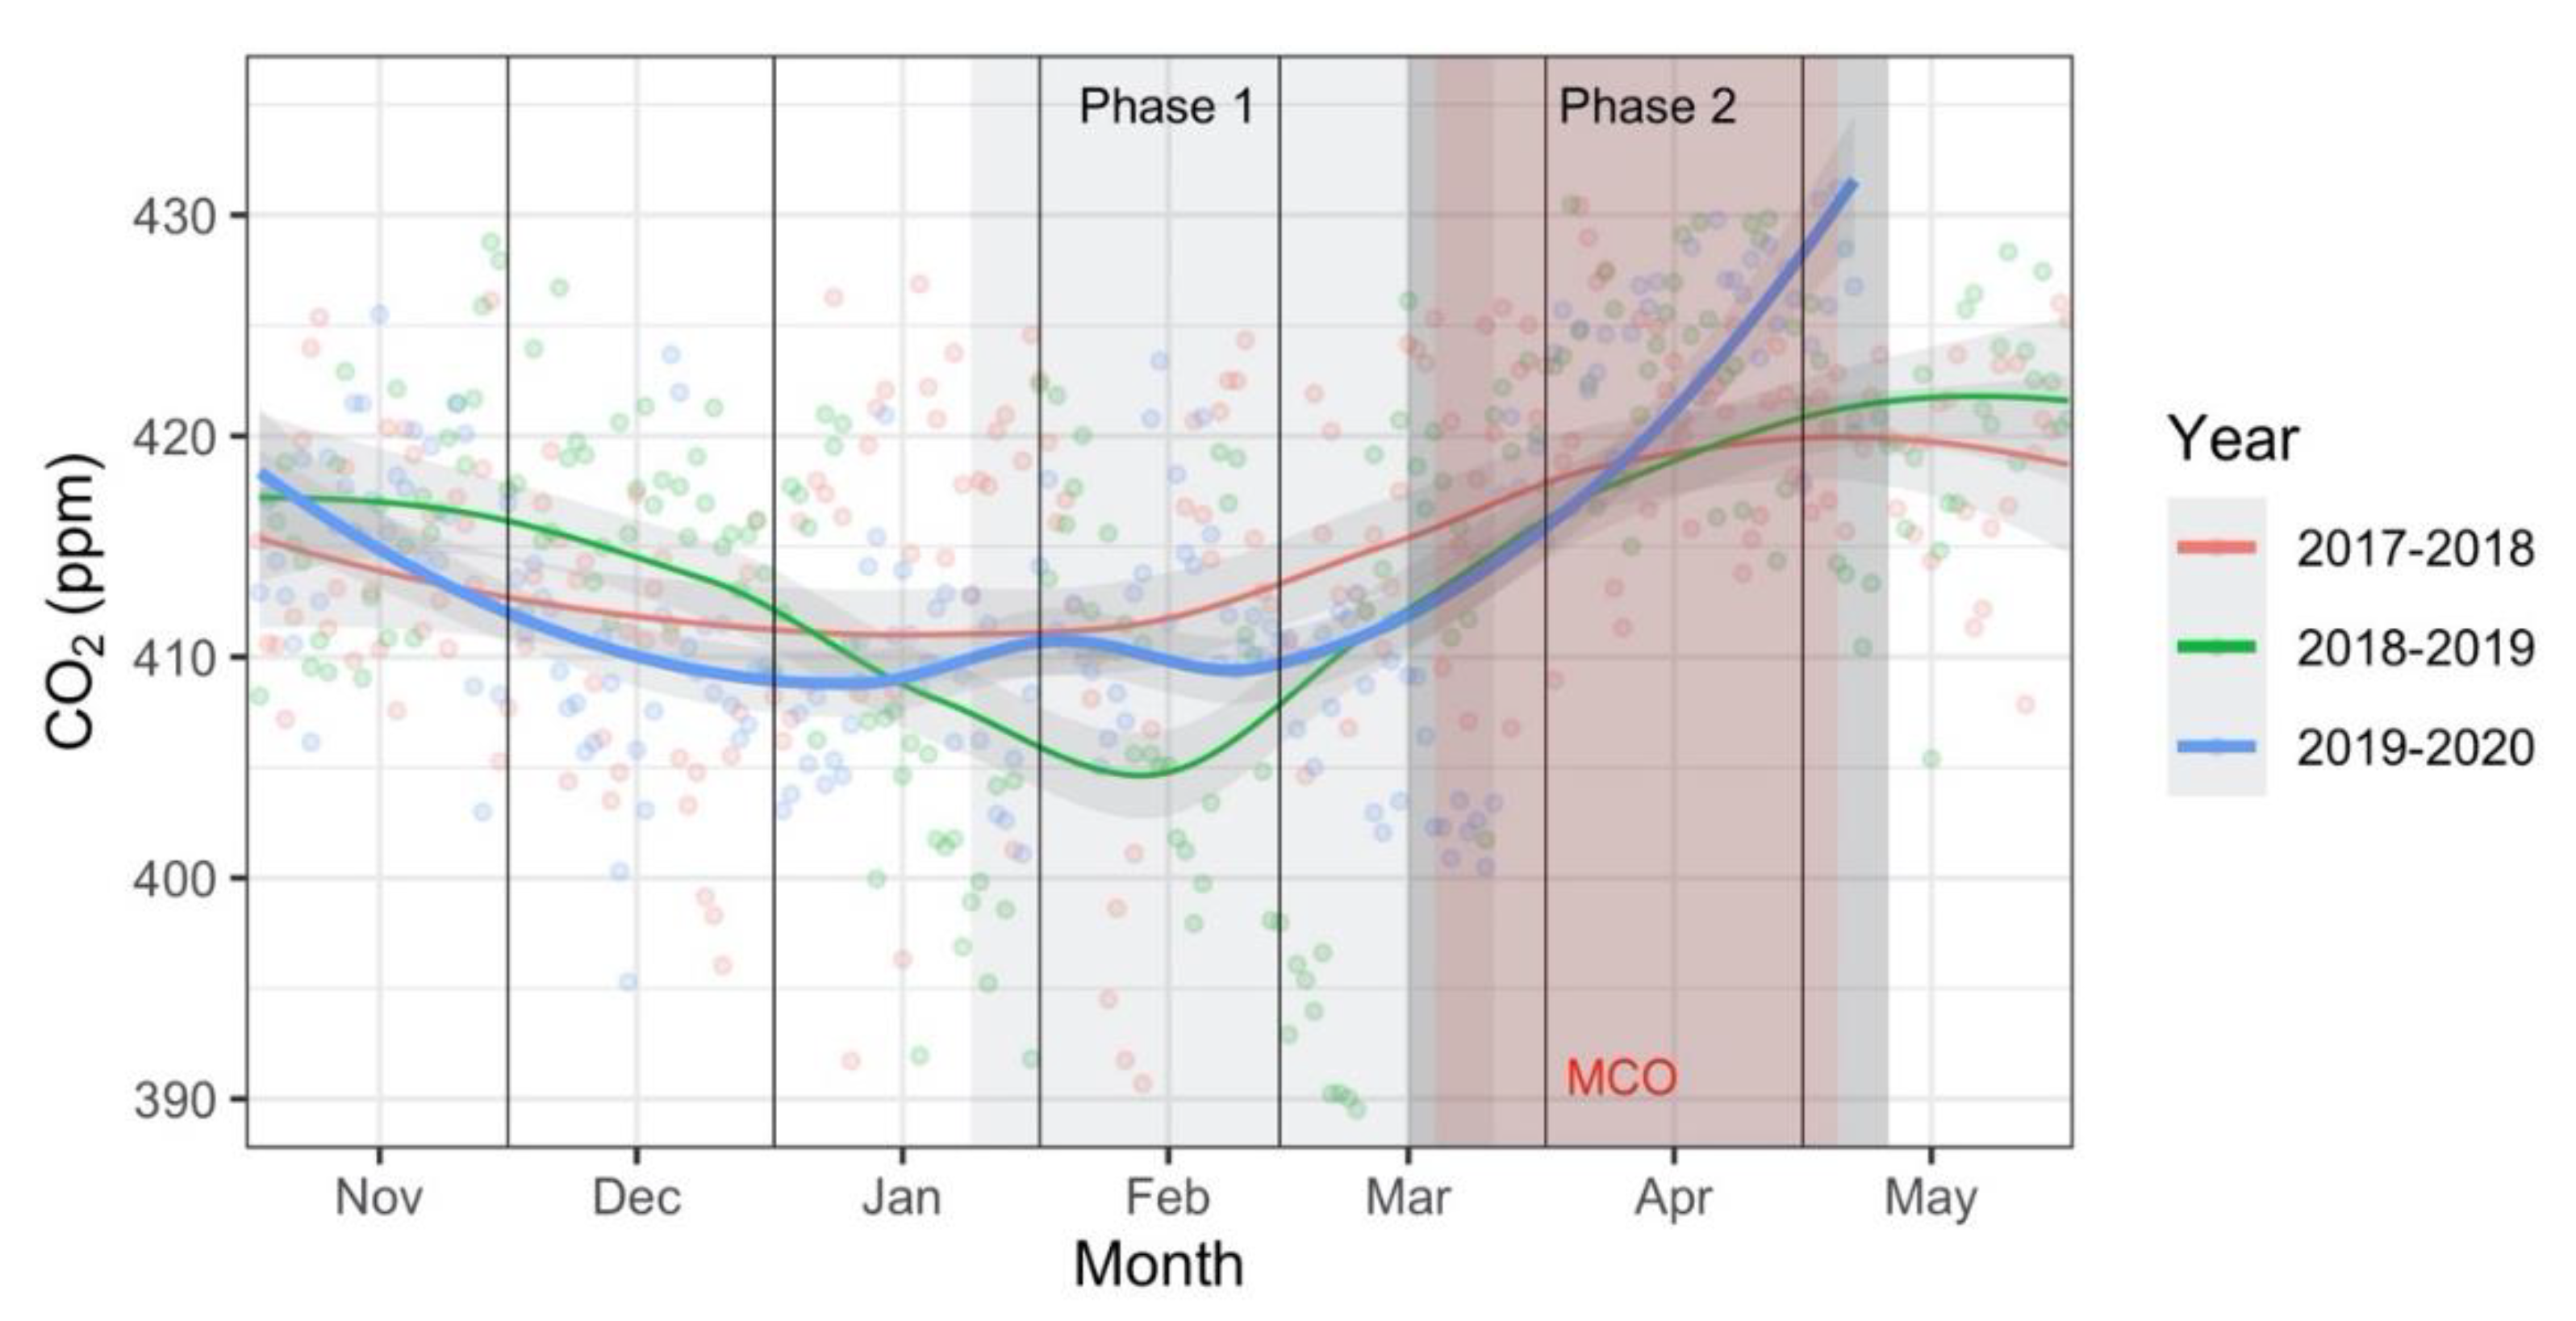
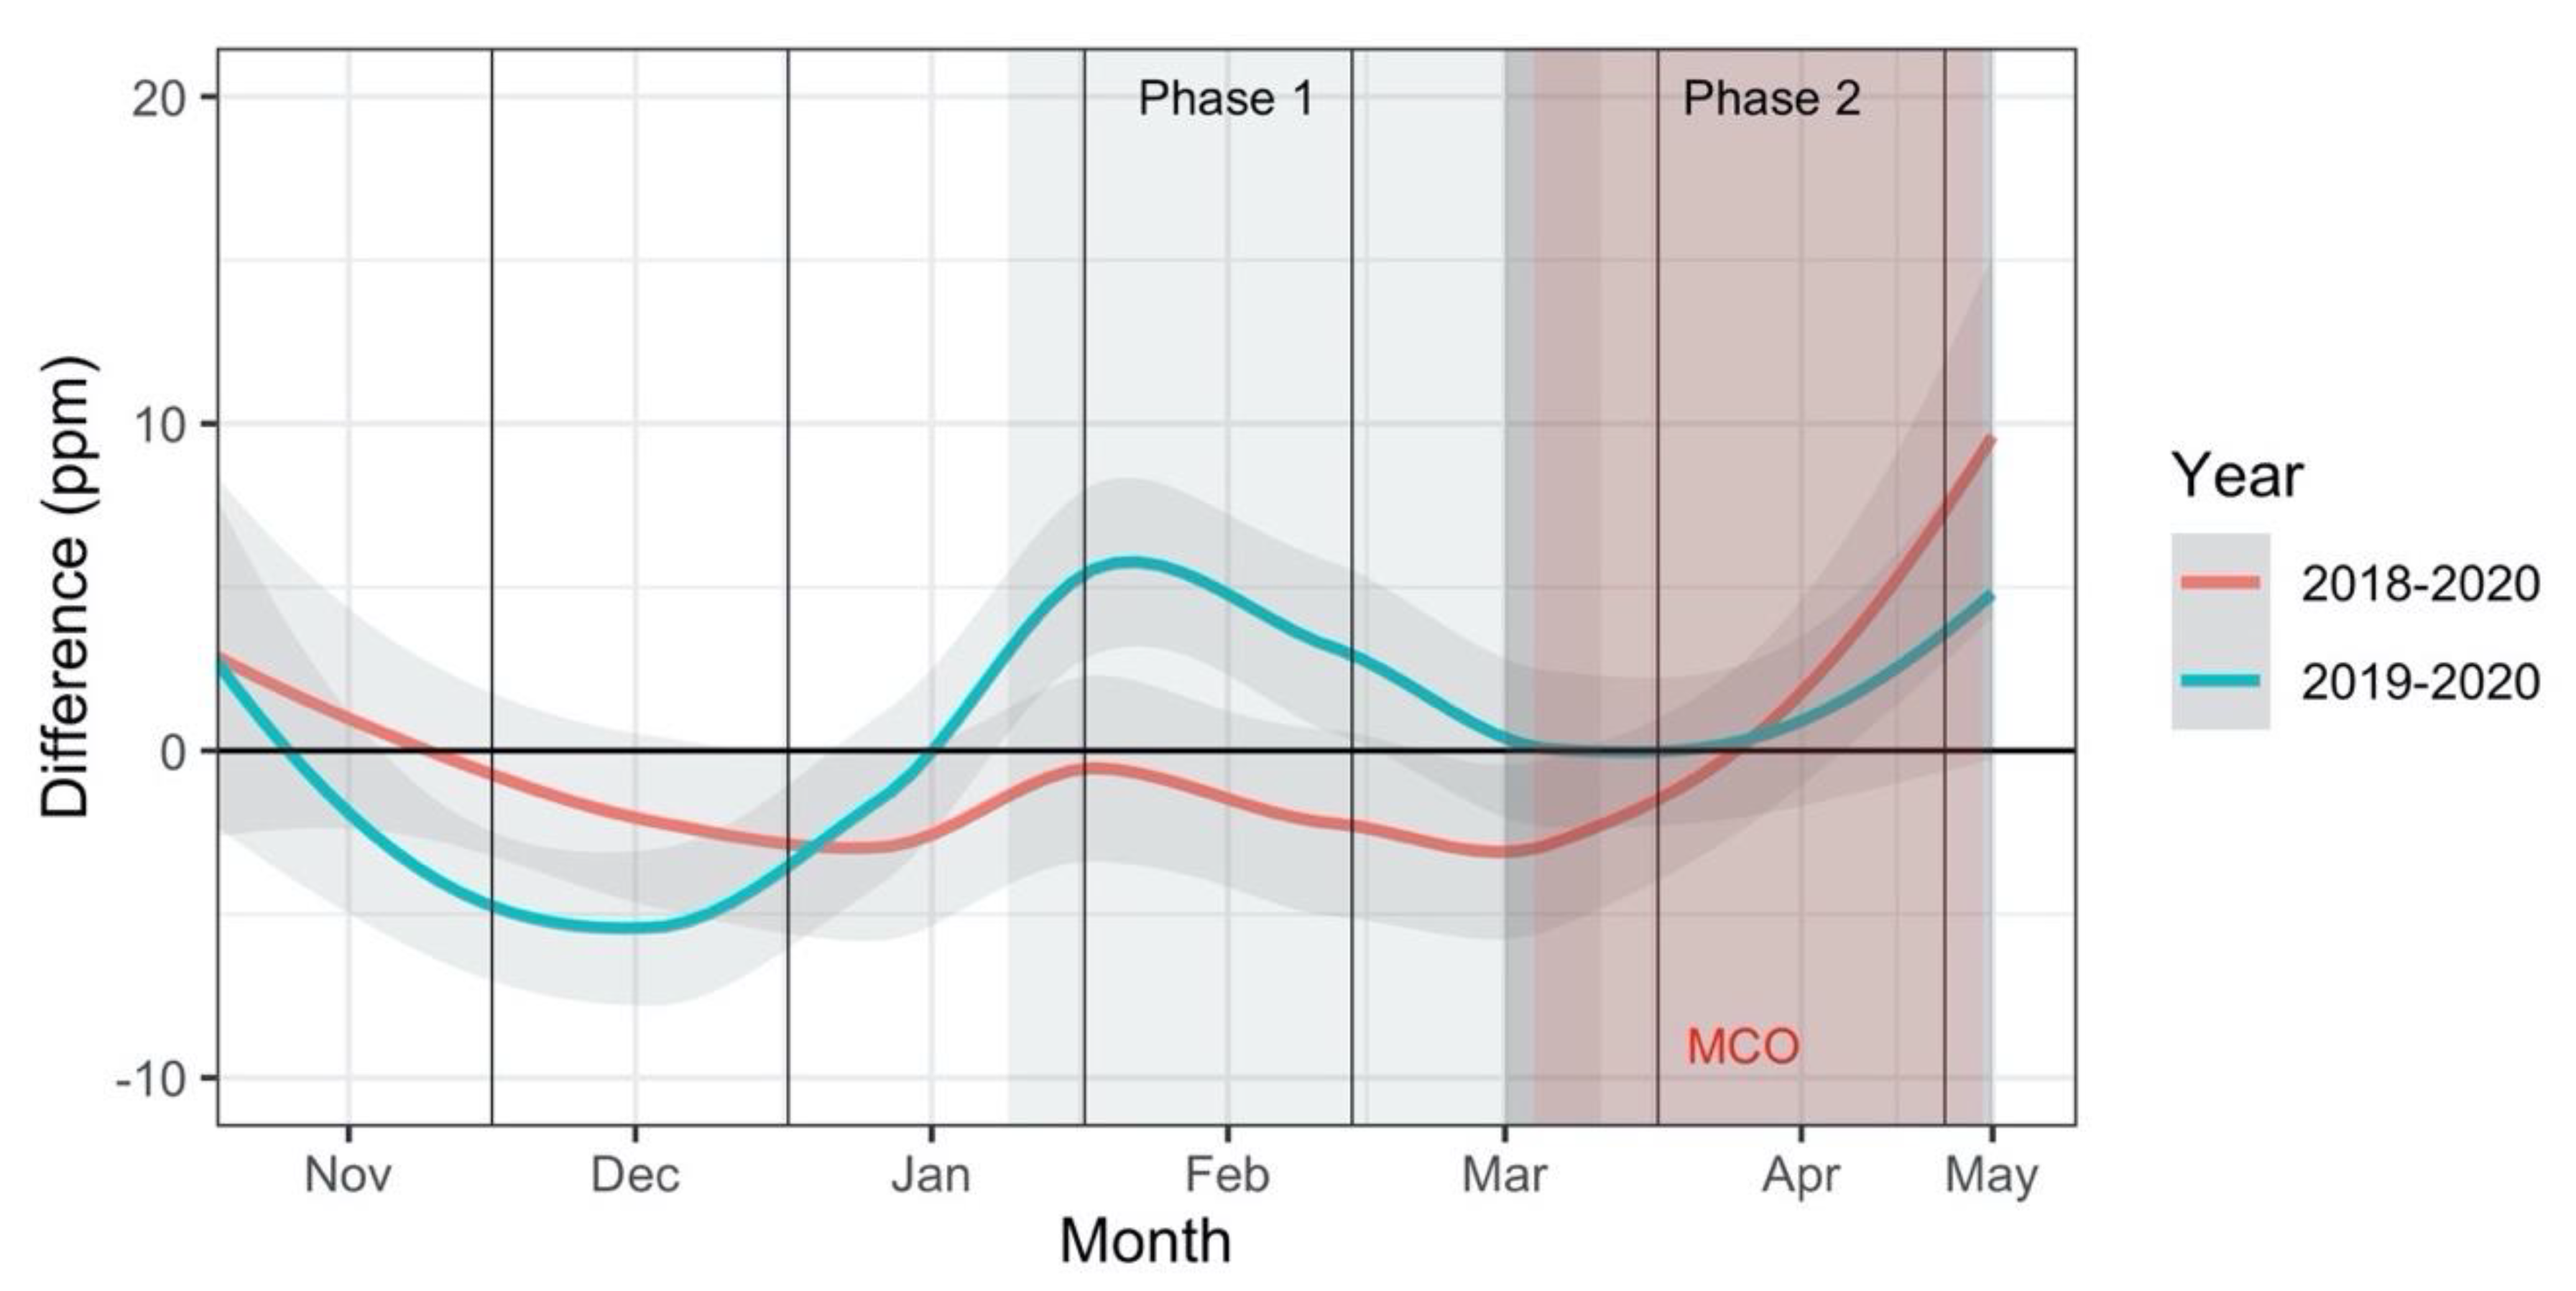
3.2. Atmospheric CO2 Concentrations Trends During COVID-19

The monthly-averaged atmospheric CO2 concentrations from November 2019 to May 2020 were lower than in November 2017 to May 2018 and November 2018 to May 2019. Note that the difference between the period November 2017 to May 2018 and November 2019 to May 2020 is referred to as “2018–2020” while the difference between the period November 2018 to May 2019 and November 2019 to May 2020 is referred to as “2019–2020.” The result is listed in Table 3.
The CO2 recorded an average of 408.7 ppm for January 2020 (Phase 1) with a maximum difference of −2.4 ppm (−1.7%) for 2018–2020 and 11.85 ppm (+0.7%) for 2019–2020. In March (Phase 2), the world witnessed strict lockdowns in most places worldwide, particularly the United States, Europe, and India. There was a reduction in the CO2 ppm recorded for 2018–2020, with −7.8, −24.5, and −3.3 for the mean, minimum, and maximum values, respectively, which is a decline of −1.9% in 2018. Yet, the CO2 ppm for the 2019–2020 period recorded was −1.9, −17.9, and 6.5 for the respective mean, minimum, and maximum values, which is a decrease of 0.5% from 2019. Resuming activities in March 2020 due to China’s easing of their lockdown suggests that it may influence the increasing atmospheric CO2 in April. However, this trend is consistent with previous periods, which indicates that the increase is a yearly recurring feature and not due to increased activities after the easement of restrictions.
It must be pointed out that the reduced CO2 emission might not solely relate to the lockdown. China and the United States were known to be partners and competitors in globalization. Both countries experienced a reduction in energy and an economic slowdown due to the US-China trade war. It has been reported that both energy consumption and trade were significant sources of CO2 emissions [26]. Thus, the effect of reduced energy demand due to the US-China trade war could also contribute to reducing CO2 emission.
Total electricity production trends reflect the changes in monthly-averaged atmospheric CO2 (Figure 2 and Table 3). Still, the most considerable negative difference occurred for the period 2018–2020, where they are −1.7% and −1.9% (averaged at −1.8%) in January and March, respectively. This difference was not mirrored by the difference in 2019–2020, where it was lower in December and March, but increased by approximately 0.10% during the same months of the lockdown. This growth suggests that the 2019–2020 restrictions had only a modest impact on atmospheric CO2. One reason could be due to a cut in CO2 emission in 2019 caused by the widespread adoption of renewable energy technologies in Europe [12]. The European Union has set a minimum CO2 reduction goal of 40.0% to meet current and future environmental developments aiming to develop a resource-efficient, green, and low-carbon economy with a 32.0% increase in renewable energy use [27,28]. The year 2019 was also the first year when CO2 emission did not increase at 2.0% per annum [1]. Furthermore, atmospheric CO2 has an average residence time of ten years in the atmosphere, and so an abrupt decrease in anthropogenic emission might not substantially decrease overall CO2 concentrations [29]. Therefore, the CO2 level in 2019–2020 (413.6 ppm) indicates that the lockdown only resulted in a slight reduction of atmospheric CO2 and it was only lower compared to the 2017–2018 CO2 level (414.3 ppm) and slightly lower to the 2018–2019 (413.9 ppm) CO2 level.
The daily-averaged CO2 for Phase 1, Phase 2, and MCO were analyzed (Figure 4). The CO2 recorded was slightly above 408.9 ppm in March, then rose to 424.2 ppm and 428.6 in April and May 2020. Before and during Phase 1, there were consistent downward trends during the middle of January for 2017–2018, 2018–2019, and 2019–2020 that align with yearly recurring trends. The concentration then increased after February, which is also due to the periodicity of yearly CO2 trends. The effect of the offset in total electricity production for 2019–2020 is not apparent here (Figure 3). Although Malaysia’s lockdown was comprehensive and strict, and the electricity production dropped to about 50.0% from February 2020 to April 2020, Malaysian MCO showed little effect on CO2 concentration as expected. Hence, the CO2 trends reported here are large-scale trends and not sensitive to local or even regional fluctuations.
Aside from electricity production, meteorological parameters may explain some of the seasonal patterns of CO2. The negative association between atmospheric CO2 and atmospheric temperature in the first quarter of the year is due to the effects of radiation perturbation caused by aerosol induction [30,31,32,33]. The CO2 trend here supports the authors’ results with the reduction of CO2 recorded for the period of dryness occasioned by excessive solar radiation and the absence or low precipitation along the western coastline of Peninsular Malaysia. Intense rainfall has been characterizing the local atmosphere since the middle of March occasioned by the Spring Transitional Monsoon that correlates with drops in atmospheric temperatures, which subsequently raised atmospheric CO2. Previous reports by [16] gave the same positive correlation during the same period.
A feature not evident in the monthly-averaged data is the abrupt but brief CO2 decrease in mid-February 2020 (Figure 4). This −0.9% dip is not apparent in the previous 2017–2018 and 2019–2020. The drop could be due to Phase 1 (China’s massive lockdown) in which electricity production in 2020 was 12.0% lower than in 2019. The following low CO2 concentration in mid-February and March 2020 could be due to Phase 2. Although not reported here, the lockdown has also impacted other anthropogenic emissions primarily sourced from the combustion of fossil fuels such as tourism and shipping, which further slashed CO2 emissions on top of reducing electricity production. After two months, the CO2 concentration approached and surpassed the seasonally averaged concentration in April 2020. Hence, contributions from the 12.0% decline in China’s total electricity production had a short-term influence on reducing atmospheric CO2. Emission data in China shows a 25.0% decrease at the beginning of the year as people were advised to stay at home and factories closed [34].
The difference in CO2 concentration from November to May for 2017–2018, 2018–2019, and 2019–2020 emphasized the reduction caused by the national restriction of activities, which only occurred between the periods November 2017 to May 2018 (i.e., 2017–2018) and November 2019 to May 2020 (i.e., 2019–2020), as shown in Figure 5. Note that the latter comparison is denoted as “2018–2020.” It occurred in two instances—December-January and March. Even though there were large decreases in electricity production from November 2019 to May 2020, it did not reflect in the reduction in CO2 concentration in the previous period of November 2018–May 2019 with November 2019–May 2020 as “2019–2020.” The massive decline in December 2019 for the period December 2019 to May 2020 (i.e., 2019–2020) was quickly compensated in January 2020, but Phase 1 restrictions in China suppressed the peak. After Phase 1 ended, the CO2 difference began to rise steadily, while the limits in Phase 2 did not seem to affect the latter. Again, Malaysia’s MCO did not affect the CO2 difference. The reason is primarily due to China’s overall electricity production that declined by 12.0%, while for Phase 2 countries, it increased by 1.0%. This result underlines the significant contribution of China to atmospheric CO2. The results also suggest that, without the national restriction of activities, CO2 concentration is set to exceed 2019 by 1.8%. Due to the lockdown, it quickly decreased and sustained for two months before climbing again in mid-April 2020.
The results highlight the reduction in atmospheric CO2 levels that can be achieved by reducing electricity production from combustible sources. The reduction can be apparent on the monthly time scale. Anthropogenic emissions play a significant role in the increasing amount of CO2 concentration in the atmosphere since the Industrial Revolution in 1750 [35]. So, when a substantial reduction in electricity production from combustible sources occurs as part of lockdown and national restriction activities, a relevant decrease in the carbon footprint burden is observed [36]. This finding’s impact could be useful for cost-benefit analyses of reducing electricity production from combustible sources and the effect of these reductions on atmospheric CO2. It is also essential to identify new opportunities for scaling up modern access to other energy sources by supporting cleaner and more effective energy options aligned with regional and global sustainability goals.

4. Conclusions

Our analysis reports on the effects of nationwide restriction of activities in China, the United States of America, Europe, and India, decreased electricity generation from combustible sources, and on monthly atmospheric CO2. The results show that electricity production for the same period in 2018, 2019, and 2020 shrunk at an offset of 9.2%. This resulted in a modest reduction (−1.8%) of atmospheric CO2 and in December-January and March from 414.32 ppm in 2017–2018. It only slightly decreased from the 2018–2019 CO2 level (413.9 ppm), likely due to breakthroughs in renewable energy technologies and increased adoption of renewable energy. China significantly contributes to atmospheric CO2 concentrations, and the concentration is set to exceed 2019 by 1.8% without the national restriction of activities. Due to the lockdown, it quickly decreased and sustained for two months before climbing again in mid-April 2020. The significant increase could be due to the ramping up of production in China and other parts of the world to compensate for the lack of activity during the lockdown. This trend could also be a yearly recurring feature and not due to increased activities after the easement of restrictions. A novel feature observed here is the non-seasonal, abrupt, and brief atmospheric CO2 decrease (−0.9%) in mid-February 2020 due to China’s Phase 1 restrictions. Hence, electricity production reduction is significant to the short-term variability of atmospheric CO2. The results underscore the atmospheric CO2 reductions on the monthly time scale that can be achieved if electricity production from combustible sources was slashed, which could be useful for cost-benefit analyses of reducing electricity production from combustible sources and the impact of these reductions to atmospheric CO2.

Author Contributions

Conceptualization, Y.Y., and J.S.K.; methodology, M.I.A. software, Y.Y. validation, Y.Y., and C.S.Y.; formal analysis, Y.Y.; investigation, Y.Y., N.K.R. and M.I.A.; resources, S.H. and H.M.I.; data curation, Y.Y.; writing—original draft preparation, J.S.K.; writing—review and editing, Y.Y., J.S.K., N.K.R., and M.I.A.; visualization, Y.Y. and C.S.Y.; supervision, Y.Y.; project administration, Y.Y., S.H. and H.M.I.; funding acquisition, Y.Y., S.H., and H.M.I.; All authors have read and agreed to the published version of the manuscript.

Funding

This research received no external funding.

Acknowledgments

The authors thank those who contributed to the success of this work. We especially acknowledge the efforts of the reviewers to better the readability of this paper.

Conflicts of Interest

The authors declare that they have no known competing financial interests or personal relationships which have or could be perceived to have influenced the work reported in this article.

References

  1. Le Quéré, C.; Jackson, R.B.; Jones, M.W.; Smith, A.J.P.; Abernethy, S.; Andrew, R.M.; De-Gol, A.J.; Willis, D.R.; Shan, Y.; Canadell, J.G.; et al. Temporary reduction in daily global CO2 emissions during the COVID-19 forced confinement. Nat. Clim. Chang. 2020, 10, 647–653. [Google Scholar] [CrossRef]
  2. Ather, A.; Patel, B.; Ruparel, N.B.; Diogenes, A.; Hargreaves, K.M. Coronavirus Disease 19 (COVID-19): Implications for Clinical Dental Care. J. Endod. 2020. [Google Scholar] [CrossRef]
  3. Amalina, S.A.; Mansorb, A.; Liyana, N.N.; Napia, M.; Mansora, W.N.W.; Ahmed, A.N.; Ismail, M.; Ahmad Ramlyfg, Z.T. Air quality status during 2020 Malaysia Movement Control Order (MCO) due to 2019 novel coronavirus (2019-nCoV) pandemic. Sci. Total Environ. 2020. [Google Scholar] [CrossRef]
  4. United Nations Industrial Development Organization. World Manufacturing Production Statistics for Quarter I, 2020; World Fig.; UNIDO: Wienna, Austria, 2020; pp. 1–19. [Google Scholar]
  5. Menut, L.; Bessagnet, B.; Siour, G.; Mailler, S.; Pennel, R.; Cholakian, A. Impact of lockdown measures to combat Covid-19 on air quality over western Europe. Sci. Total Environ. 2020, 741. [Google Scholar] [CrossRef]
  6. Chen, L.W.A.; Chien, L.C.; Li, Y.; Lin, G. Nonuniform impacts of COVID-19 lockdown on air quality over the United States. Sci. Total Environ. 2020, 745. [Google Scholar] [CrossRef] [PubMed]
  7. Wang, Q.; Su, M. A preliminary assessment of the impact of COVID-19 on environment—A case study of China. Sci. Total Environ. 2020, 728. [Google Scholar] [CrossRef] [PubMed]
  8. Sharma, S.; Zhang, M.; Anshika; Gao, J.; Zhang, H.; Kota, S.H. Effect of restricted emissions during COVID-19 on air quality in India. Sci. Total Environ. 2020, 728. [Google Scholar] [CrossRef]
  9. Barbieri, D.M.; Lou, B.; Passavanti, M.; Hui, C.; Lessa, D.A.; Maharaj, B.; Banerjee, A.; Wang, F.; Chang, K.; Naik, B.; et al. Survey data regarding perceived air quality in Australia, Brazil, China, Ghana, India, Iran, Italy, Norway, South Africa, United States before and during Covid-19 restrictions. Data Brief 2020, 32. [Google Scholar] [CrossRef]
  10. Wallace, J.M.; Hobbs, P.V. Atmospheric Science: An Introductory Survey, 2nd ed.; Elsevier: Amsterdam, The Netherlands, 2006. [Google Scholar]
  11. Wang, K.; Wang, Y.; Wang, X.; He, Y.; Li, X.; Keeling, R.F.; Ciais, P.; Heimann, M.; Peng, S.; Chevallier, F.; et al. Causes of slowing-down seasonal CO2 amplitude at Mauna Loa. Glob. Chang. Biol. 2020, 26, 4462–4477. [Google Scholar] [CrossRef]
  12. IEA. Global Energy Review 2020; International Energy Agency: Paris, France, 2020. [Google Scholar]
  13. Elavarasan, R.M.; Shafiullah, G.M.; Raju, K.; Mudgal, V.; Arif, M.T.; Jamal, T.; Subramanian, S.; Balaguru, V.S.S.; Reddy, K.S.; Subramaniam, U. COVID-19: Impact analysis and recommendations for power sector operation. Appl. Energy 2020, 279. [Google Scholar] [CrossRef]
  14. Yusup, Y.; Kayode, J.S.; Alkarkhi, A.F.M. A methodological approach to the air-sea energy fluxes data collection and analysis at the tropical coastal ocean. MethodsX 2018, 5, 448–453. [Google Scholar] [CrossRef] [PubMed]
  15. Yusup, Y.; Kayode, J.S.; Alkarkhi, A.F.M. Experimental data on the air-sea energy fluxes at the tropical coastal ocean in the southern South China Sea. Data Brief 2018, 19, 1477–1481. [Google Scholar] [CrossRef] [PubMed]
  16. Yusup, Y.; Kayode, J.S.; Alkarkhi, A.F.M. Data on micrometeorological parameters and Energy Fluxes at an intertidal zone of a Tropical Coastal Ocean. Data Brief 2018, 21, 13–17. [Google Scholar] [CrossRef]
  17. Yusup, Y.; Alkarkhi, A.F.M.; Kayode, J.S.; Alqaraghuli, W.A.A. Statistical modeling the effects of microclimate variables on carbon dioxide flux at the tropical coastal ocean in the southern South China Sea. Dyn. Atmos. Ocean 2018, 84, 10–21. [Google Scholar] [CrossRef]
  18. Piao, S.; Liu, Z.; Wang, Y.; Ciais, P.; Yao, Y.; Peng, S.; Chevallier, F.; Friedlingstein, P.; Janssens, I.A.; Peñuelas, J.; et al. On the causes of trends in the seasonal amplitude of atmospheric CO2. Glob. Change Biol. 2018, 24, 608–616. [Google Scholar] [CrossRef] [PubMed] [Green Version]
  19. Sun, Z.; Zhang, H.; Yang, Y.; Wan, H.; Wang, Y. Impacts of geographic factors and population density on the COVID-19 spreading under the lockdown policies of China. Sci. Total Environ. 2020, 746. [Google Scholar] [CrossRef]
  20. Barkur, G.; Vibha; Kamath, G.B. Sentiment analysis of nationwide lockdown due to COVID 19 outbreak: Evidence from India. Asian J. Psychiatr. 2020, 51. [Google Scholar] [CrossRef]
  21. Shah, A.U.M.; Safri, S.N.A.; Thevadas, R.; Noordin, N.K.; Rahman, A.A.; Sekawi, Z.; Ideris, A.; Sultan, M.T.H. COVID-19 outbreak in Malaysia: Actions taken by the Malaysian government. Int. J. Infect. Dis. 2020, 97, 108–116. [Google Scholar] [CrossRef]
  22. Bahmanyar, A.; Estebsari, A.; Ernst, D. The impact of different COVID-19 containment measures on electricity consumption in Europe. Energy Res. Soc. Sci. 2020, 68. [Google Scholar] [CrossRef]
  23. Tsai, T.L.; Chiou, Y.F.; Tsai, S.C. Overview of the nuclear fuel cycle strategies and the spent nuclear fuel management technologies in Taiwan. Energies 2020, 13, 2996. [Google Scholar] [CrossRef]
  24. Shakil, M.H.; Munim, Z.H.; Tasnia, M.; Sarowar, S. COVID-19 and the environment: A critical review and research agenda. Sci. Total Environ. 2020, 745. [Google Scholar] [CrossRef]
  25. Han, P.; Cai, Q.; Oda, T.; Zeng, N.; Shan, Y.; Lin, X.; Liu, D. Assessing the recent impact of COVID-19 on carbon emissions from China using domestic economic data. Sci. Total Environ. 2021, 750. [Google Scholar] [CrossRef]
  26. Xia, Y.; Kong, Y.; Ji, Q.; Zhang, D. Impacts of China-US trade conflicts on the energy sector. China Econ. Rev. 2019, 58. [Google Scholar] [CrossRef]
  27. European Commission. 2030 Climate & Energy Framework; E. Commission: Brussels, Belgium, October 2014. [Google Scholar]
  28. Töbelmann, D.; Wendler, T. The impact of environmental innovation on carbon dioxide emissions. J. Clean. Prod. 2020, 244. [Google Scholar] [CrossRef]
  29. Ballantyne, A.P.; Alden, C.B.; Miller, J.B.; Tans, P.P.; White, J.W.C. Increase in observed net carbon dioxide uptake by land and oceans during the past 50 years. Nature 2012, 488, 70–71. [Google Scholar] [CrossRef] [PubMed]
  30. Lee, S.; Lee, M.I.; Song, C.K.; Kim, K.M.; da Silva, A.M. Interannual variation of the East Asia Jet Stream and its impact on the horizontal distribution of aerosol in boreal spring. Atmos. Environ. 2020, 223. [Google Scholar] [CrossRef]
  31. Xie, X.; Wang, T.; Yue, X.; Li, S.; Zhuang, B.; Wang, M. Effects of atmospheric aerosols on terrestrial carbon fluxes and CO2 concentrations in China. Atmos. Res. 2020, 237. [Google Scholar] [CrossRef]
  32. Zhang, J.; Zheng, Y.; Li, Z.; Xia, X.; Chen, H. A 17-year climatology of temperature inversions above clouds over the ARM SGP site: The roles of cloud radiative effects. Atmos. Res. 2020, 237. [Google Scholar] [CrossRef]
  33. Wang, J.; Tang, K.; Feng, K.; Lv, W. High Temperature and High Humidity Reduce the Transmission of COVID-19. SSRN Electron. J. 2020. [Google Scholar] [CrossRef] [Green Version]
  34. Saadat, S.; Rawtani, D.; Hussain, C.M. Environmental perspective of COVID-19. Sci. Total Environ. 2020, 728. [Google Scholar] [CrossRef]
  35. Matsuno, T.; Maruyama, K.; Tsutsui, J. Stabilization of atmospheric carbon dioxide via zero emissions—An alternative way to a stable global environment. Part 1: Examination of the traditional stabilization concept. Proc. Jpn. Acad. Ser. B Phys. Biol. Sci. 2012, 88, 368–384. [Google Scholar] [CrossRef] [Green Version]
  36. Rugani, B.; Caro, D. Impact of COVID-19 outbreak measures of lockdown on the Italian Carbon Footprint. Sci. Total Environ. 2020, 737. [Google Scholar] [CrossRef] [PubMed]
Figure 1. The flowchart of the method.
Sustainability 12 09397 g001
Figure 2. The location of the Muka Head station (5°28′06″ N, 100°12′01″ E); data source: [14,15,16,17], and the website http://atmosfera.usm.my.
Sustainability 12 09397 g002
Figure 3. Total electricity production for November to May for three years periods; Phase 1 is the duration for the national restriction of activities in China, while Phase 2 is for parts of the United States of America, Europe, and India. Data source: International Energy Agency (IEA) Report of Global Energy Review and IEA Monthly Organization for Economic Cooperation and Development (OECD) Electricity Report for 2020 [12].
Sustainability 12 09397 g003
Figure 4. Atmospheric CO2 concentration for the months November to May for three years; Phase 1 is the duration of national restriction of activities in China, while Phase 2 is for parts of the United States of America, Europe, and India; the Movement Control Order (MCO) is the national restriction of activities for Malaysia. Data source: The Muka Head Station.
Sustainability 12 09397 g004
Figure 5. The difference in atmospheric CO2 concentration between the period November 2017–May 2018 and November 2019–May 2020 referred to as “2018–2020” and between the period November 2018–May 2019 and November 2019–May 2020, referred to as “2019–2020.” Data source: The Muka Head Station.
Sustainability 12 09397 g005
Table 1. Definitions were used for the different phases of the worldwide restriction of activities, leading to reduced electricity production and, subsequently, global CO2 emission.
Phase.Countries Imposing Nation-Wide or *Multiple-States Restrictions
Phase 1National restriction of activities for China (−12% electricity production and 28% global CO2 emission)
Phase 2National restriction of activities for *United States, Europe (Germany, United Kingdom, Italy, France, and Poland), and India (+1% electricity production and 27% global CO2 emission)
MCOMovement Control Order, the national restriction of activities for Malaysia (−50% electricity production and >1% global CO2 emission)
Table 2. Percentage of global energy decline by source, and the contributed factors in Q1 2020 compared to Q1 2019 [12].
Energy Demand by SourceQ1 2020 Change from Q1 2019 (%) Contributed Factors
Coal−8Reduction in electricity demand
Oil−5Restriction on travel reduced the need for vehicles
Natural gas−2China and Europe experiencing the most significant declines due to low consumer demand
Table 3. The monthly-averaged difference in atmospheric CO2 concentrations (ppm) between the period November 2017–May 2018 and November 2019–May 2020, referred to as “2018–2020,” and between the period November 2018–May 2019 and November 2019–May 2020, referred to as “2019–2020.”
Month2018–20202019–2020
MeanMinMax%MeanMinMax%
Nov1.1−17.85.90.2−1.2−22.94.6−0.3
Dec0.1−15.94.60.0−7.4−20.3−3.8−1.8
Jan−6.8−20.9−2.4−1.72.8−16.811.90.7
Feb4.4−13.911.81.13.6−10.713.30.9
Mar−7.8−24.5−3.3−1.9−1.9−17.96.5−0.5
Apr3.4−6.97.30.80.7−13.84.30.2
May9.06.09.02.110.25.514.72.4
Publisher’s Note: MDPI stays neutral with regard to jurisdictional claims in published maps and institutional affiliations.

