Article

A Smart Campus’ Digital Twin for Sustainable Comfort Monitoring

Engineering Department, La Salle–Universitat Ramon Llull, 08021 Barcelona, Spain
*
Author to whom correspondence should be addressed.
Sustainability 2020, 12(21), 9196; https://doi.org/10.3390/su12219196
Submission received: 21 September 2020 / Revised: 23 October 2020 / Accepted: 3 November 2020 / Published: 5 November 2020

Abstract

:
Interdisciplinary cross-cultural and cross-organizational research offers great opportunities for innovative breakthroughs in the field of smart cities, yet it also presents organizational and knowledge development hurdles. Smart cities must be large towns able to sustain the needs of their citizens while promoting environmental sustainability. Smart cities foment the widespread use of novel information and communication technologies (ICTs); however, experimenting with these technologies in such a large geographical area is unfeasible. Consequently, smart campuses (SCs), which are universities where technological devices and applications create new experiences or services and facilitate operational efficiency, allow experimentation on a smaller scale, the concept of SCs as a testbed for a smart city is gaining momentum in the research community. Nevertheless, while universities acknowledge the academic role of a smart and sustainable approach to higher education, campus life and other student activities remain a mystery, which have never been universally solved. This paper proposes a SC concept to investigate the integration of building information modeling tools with Internet of Things- (IoT)-based wireless sensor networks in the fields of environmental monitoring and emotion detection to provide insights into the level of comfort. Additionally, it explores the ability of universities to contribute to local sustainability projects by sharing knowledge and experience across a multi-disciplinary team. Preliminary results highlight the significance of monitoring workspaces because productivity has been proven to be directly influenced by environment parameters. The comfort-monitoring infrastructure could also be reused to monitor physical parameters from educational premises to increase energy efficiency.

1. Introduction

1.1. Research Motivation and Scope

Smart cities must be large towns able to sustain their citizens’ incremental needs while promoting environmental sustainability. With the emergence of new information and communication technologies (ICTs), such as the Internet of Things (IoT) and big data, smart cities are closer to this realization. However, the deployment of such an amount of technology in a wide geographical area requires experimentation and testing. Consequently, our research proposes to create smart campuses (SCs) to experiment with the deployment of these ICT technologies [1,2]. The aim is to support the efficient management of a “small” smart city. In the context of an SC, we consider the needs of students and campus staff while improving environmental sustainability.
This way, we narrow the scope of the present paper by focusing on two properties: students’ comfort and energy efficiency. We aim to integrate the ICTs to monitor and manage both of them; therefore, IoT devices are responsible for detecting comfort levels and energy efficiency on the campus and take consequent corrective action. We propose to conceptualize groups of smart devices that could be used to achieve a determined goal by acting as physical-world proxies for agents. For instance, an agent is responsible for improving energy efficiency and comfort in a given classroom, and it senses and actuates on the physical world (e.g., classrooms) through IoT sensors and actuators.
According to Eurostat and the European Commission report in Education and Training Monitor 2019, more than 31% of the European population is currently enrolled in educational programs. This percentage only includes physical-based learning. However, in recent years remote learning and distance education have grown significantly [3]. Hence, more than 138 million European people spend a considerable amount of their time in educational facilities (schools, universities, colleges, etc.). Most of these facilities were constructed a long time ago to rapidly address the educational needs of growing local populations due to the societal changes in which young adults began to complete a full education plan: primary school, high school, and university/vocational training. At that time, educational institutions were large infrastructures to allocate all students, faculty members, and staff. However, little or no attention was paid to the overall comfort of these environments—understood as a measure that balances the wellbeing of all users, the efficiency of the processes involved, and the pro-environmental footprint of their facilities.
Recent studies have suggested that comfort in educational environments is a critical parameter for the success of learning and the evolution of society [4]. Comfort is usually related to individual and isolated parameters such as air quality, temperature, or noise [5]. Measuring these parameters can be tackled seamlessly with unobtrusive equipment as an enabler to obtaining reasonable—yet incomplete—partial conclusions [6]. Indeed, much effort has been made to improve ICT-based solutions in the direction of more accurate and more complete systems (e.g., including more local variables) [7]. However, these recurrent solutions typically fail at quantifying the side effects of measuring comfort involving external parameters to the educational environment that still have a great impact on its associated issues (e.g., overall sustainability, energy efficiency, learning and teaching performance, etc.). For instance, they are unable to address dilemmas such as whether it would be worth increasing the energy consumption to keep the optimal thermal conditions in order to ensure an improvement in the students’ academic output or not.
In essence, current ICT-based proposals to monitor comfort either do not deal collectively with the vast amount of internal and external parameters to measure them, or only provide local (i.e., partial) qualitative views of comfort as they are more focused on keeping the technological paradigm of cost-effectiveness [5]. Hence, existing developments are incremental, concerning a conceptual and technological paradigm that remains unchanged. Understanding, monitoring, predicting, and optimizing comfort in educational environments requires a holistic and cross-layer view able to frame and quantify the dynamic and nonlinear relations of their involved users [8]. Indeed, addressing the comfort in educational facilities cannot be tackled in a linear way since several interdependent parts are continuously changing. Therefore, it is safe to say that comfort in educational environments has remained under-sampled for years mostly due to the complexity of objectively quantifying and acting on it.
Specifically, authors have examined, measured, and analyzed all the potential external (e.g., available open data, weather information, architectural issues, etc.) and internal (e.g., thermal or acoustic data) variables affecting such comfort to (1) quantify, monitor, predict and optimize comfort in physical and, eventually, virtual educational environments; (2) enhance overall sustainability and (3) overcome potential issues in the teaching-learning process. The proposed structural model of our SC will help to predict the impact of the distinct institutional policies on comfort and, as such, it will encourage drivers to address changes such as conducting active learning methodologies, adopting eco-friendly initiatives to reduce environmental footprint toward carbon neutrality, or incorporating renewable energies to save natural resources.
Overall, our research proposes a radical paradigm shift and the use of IoT technology in monitoring and optimizing comfort in university learning environments, where the frame for analysis and modeling of the comfort parameter holistically covers the internal and external meta-dimensions, as a whole, that characterize the socio-environmental interactions of three strategic stakeholders: teaching and learning community, facility management staff, and energy providers. If these dimensions, and their impact on comfort, were defined, quantified, and validated through innovative scientifically-grounded methods, this would drive the conception of a new technology able to transform the current generation of comfort analysis in physical and virtual educational environments. This achievement will endow them with a completely novel functionality to improve their sustainability while helping to understand, design, populate, monitor, and perceive comfortable learning environments.

1.2. The Importance of the University in the Promotion of Sustainability

Universities and colleges play a crucial role in the development of knowledge and innovation, especially in more environmentally benign technologies and goods to promote sustainable living [9]. They represent vital places to explore, test, develop, and communicate the necessary conditions for effective and sustainable change [10,11]. Many universities and colleges are similar to micro cities because of their population, size, and the many different types of activities happening on campus. According to the literature, a sustainable university is “a higher educational institution that addresses, involves and promotes, on a regional or a global level, the minimization of negative environmental, economic, societal, and health effects generated in the use of their resources in order to fulfill its functions of teaching, research, outreach and partnership, and stewardship in ways to help society make the transition to sustainable lifestyles” [12].
Although universities acknowledge their roles in our present culture, there is a part of university life that has been rendered a mystery and has never truly been solved universally among universities: sustainable development. Sustainable development is defined as “development that meets the needs of the present without compromising the ability of future generations to meet their own needs” [13]. Since sustainability is an issue of present-day and future societies, it is crucial that places of learning, such as universities, play a critical role in teaching sustainability to citizens who will be the future decision-makers. Sustainability practices begin at the university level by adapting environmentally sustainable policies and expanding to local, regional, national and international levels [14].
Since graduates of any discipline will need knowledge and skills related to sustainability, the challenges and possible solutions should be integrated within the main functions of a university: the development of an interdisciplinary curriculum, environmental literacy, sustainable academic research, sustainable physical operations of the campus, and collaboration amongst universities. The common ground of sustainable practices is the ethical and moral responsibility of universities to be leaders in promoting sustainability [15,16,17]. Campus sustainability has become an issue of global concern for university policymakers and planners as a result of the realization of the impacts the activities and operations of universities have on the environment. Generating more sustainable campus life, including actual innovative campus projects and administrative policies, creates opportunities for students within sustainability [18].
Due to their unique position, universities and colleges play a key role in educating the future generations of citizens who will have expertise in all fields of the labor market. This role includes both the promotion of environmental literacy among students and research in sustainability, as well as a contrived effort to decrease the university’s impact on the environment [19]. Although universities worldwide are constantly improving their vision and curricula to address future sustainability challenges, there is still much work to do. The goal of sustainability education is to give students knowledge and skills and help them find solutions to environmental, health-related, and economic challenges [20]. Another important element in the methodology used for teaching students about sustainability is the need to undertake hands-on projects to ensure the students’ understanding of the challenges and possible solutions. Self-sustainable campuses with many projects (e.g., composting, rooftop gardens and solar panels) teach students about sustainability and require the active work of the students. Students who participate in planning, building, and maintaining these projects will be more likely to develop lifelong sustainability habits.

1.3. The Statement for Our Smart Campus Comfort Challenge

The main goal of the Advanced Training in Health Innovation Knowledge Alliance (ATHIKA) [21] is to use knowledge transfer to duplicate, yet also locally customize, sustainability innovations undertaken by diverse institutions. The ATHIKA project will build a set of advanced training programs involving academia, public administrations, SMEs (Small and Medium Enterprises), start-ups, and health business consultants. The variety of profiles of the project partners will provide an overall perspective of the sector and will enable the identification of its most urgent challenges. They will guide and coach students and researchers during the development of novel technical and ethical-compliance solutions to implement ICT solutions in the health sector, especially the solutions related to the smart campus (SC) ATHIKA challenge. Authors envisage that the accurate monitoring, analysis, prediction, and management of comfort will lead to a reduction in the overall environmental footprint of educational environments while increasing the comfort of their users.
In this paper, we present the development and implementation of novel and advanced healthy SC by using comfort as a quality metric, based on ICT that relies on greater interaction between healthcare professionals, education communities, and technological experts. Available SC data are becoming massive, and needs to be handled in controlled environments, under proper ethical criteria. The goal is to establish a challenge-based learning program where teams of students from various disciplines and countries will compete to find solutions for our SC challenge. The devised solutions, or pretotypes, have been developed into prototypes, following a technology coaching (supported by universities) and the application-oriented coaching (conducted by the target company). This program will be used to reduce the learning and experience curve associated with targeting, developing, and implementing sustainability projects in university settings. The current paper introduces the research carried out in the smart campus challenge within the ATHIKA Erasmus+ project [21].
Reaching a comfortable and responsive SC implies focusing on the two interrelated concepts: “smartness”, mainly related to addressing the problems cities face with the aid of information and communication technologies (ICT), and “healthy sustainability”, emphasizing citizens’ inclusion (students and faculty) and social wellbeing (social dimension), ecosystem protection (environmental dimension) and boosting of the local economy (economic dimension) [22].
Nowadays, new ICTs make the real-time monitoring of university campus conditions possible. A variety of sensors and intelligent devices deployed throughout the campus can monitor pollution, noise, natural or artificial risks as well as epidemics, and manage public spaces and facilities to reduce or avoid negative impacts on educational community health. Our SC challenge also aims to build a platform capable of assisting contemporary university campuses in transforming towards sustainable and comfortable campuses by exploiting data from both existing data sets and on-field sensors. The proposed approach is based on an interdisciplinary digital twin modeling that can be integrated into existing decision support systems by providing quantitative hints and suggestions on architecting and ICT engineering sustainable policies. Using novel trends in ICTs—such as cloud computing, big data, artificial intelligence and Internet of Things—to process, visualize and analyze real-time data is now feasible to accurately monitor citizens and their interactions with the physical infrastructures, and thus, identify, learn, and act to improve the future public health conditions.
In fact, ATHIKA aims to (1) explore innovative approaches to contribute to the sustainable campus transformation, employing technologically advanced pedagogy in a multi-disciplinary way through ICT engineering and architecture frameworks, (2) propose innovative good practices for managing a university campus, involving data-driven sustainable products and service outcomes in order to support environmental policymaking and (3) use novel edge computing architectures for advanced submetering and distributed hybrid intelligence algorithms [23]. Nevertheless, in this paper, the authors introduce a quantitative and measurable definition of comfort, together with the first-ever accurate and unbiased measurement of the concept. It includes the development of computational models and low-cost infrastructures for automated, resilient, and reliable data acquisition, storage, processing, and visualization of comfort. The innovative and scientifically grounded technologies of our proposal have been validated in our real-world university campus.

1.4. Framework-Based Methodology

Smart cities are usually associated with complex systems [24]. Complex systems are defined as systems formed by heterogeneous elements that interact with each other and their environment [25,26,27]. The diversity of these elements, the non-linearity of relationships between them and the multiple influences of the environment determine their complexity [28]. Indeed, the level of complexity of smart cities and their ability to achieve urban sustainability has called for debate [29]. Additionally, adding smartness to the city leads to an increase in complexity—and more complexity requires more energy [30,31]. Therefore, in light of the debate surrounding the sustainability of smart cities and with the acknowledgment that smart campuses are similar to small smart cities [1,2]—thus, potentially able to shed light on the debate—the methodological framework used in this work considers the smart campus as a complex system.
Under the umbrella of complexity theory comes the framework of complex adaptive systems (CAS) [25]. CAS refers to systems that involve “a large number of components, often called agents, which interact and adapt or learn” [32]. General top-level properties and features such as self-similarity, complexity, emergence and, self-organization induce CAS to be considered as an appropriate framework for the methodological sequence of the presented research project proposal on comfort in educational environments: agents (i.e., teaching and learning community, facility managers, and energy providers) and the system (i.e., physical and virtual educational environments) are adaptive, and the system is a complex self-similar collectivity of interacting, adaptive agents.
In juxtaposition with the vision of smart campuses as CAS, some authors model the IoT—an enabler technology for SCs—as a complex system too [30,33,34,35,36]. To exemplify our SC modeling approach, we consider the increase in students’ comfort and energy efficiency. We allocate each space (e.g., classroom) with an agent with two goals. The first, concerning students’ comfort, the second, aiming at energy efficiency. The agent is responsible for sensing different properties of both students and classrooms through IoT sensors, gathering contextual information, and acting according to the desired level of comfort and energy efficiency through IoT devices. Therefore, we allocate several agents in the campus.
Agents in a multi-agent system (MAS) cooperate to maximize their goal [37]. For example, given a determinate number of students in a classroom, the agent sets a level of comfort for the classroom. At the same time, the agent sets a determinate energy efficiency goal. Then, the agent needs to carry out actions to achieve a reasonable level of students’ comfort and energy efficiency. Additionally, the environment in which the agent operates might be modified by other agents and external factors. Modification by other agents might be due to their operation in other spaces (e.g., spaces on the same floor or building), and modification by external factors might be due to weather conditions, for example.
With regard to the characterization of the hierarchical structure of the system comprehended by IoT devices and agents (in our framework, guardians), we add a higher-level module providing a decision support system: the wise module. Therefore, IoT devices, the guardian module, and the wise module have a hierarchical relationship in the digital twin as well. IoT devices are deployed in a zone or section of an SC building, and the guardian perceives and acts on the physical world using those devices; therefore, the relationship between the guardian and the IoT devices is one-to-many. In turn, the wise module is connected to the guardians in a one-to-many relationship and contains the support decision system to coordinate the guardians, so they operate towards a common goal: students’ comfort and energy efficiency.
Essentially, at a lower scale, an IoT-enabled device is a system of software and hardware components; at an upper scale, in consideration of the model we propose, devices (sensors and actuators) cooperate to enable an agent to sense and actuate on the physical world (guardian), zooming out, agents in a MAS form a system (wise module), and beyond these scales, more systems of systems arise.
In addition, regarding the interaction between agents in a CAS and their implementation using ICTs, we now set our focus on the relationship between agents. The authors in [38] compare network and complexity theories and define CAS as “a pattern of relationships among adaptive, self-organizing and interdependent elements (agents)”. As stated, our technological framework is under the umbrella of IoT technologies among other novel ICTs. To frame the relationships between agents—and the organizing dynamics of their relationships—we use the Social Internet of Things (SIoT) paradigm.
The SIoT [39] promotes a scalable and flexible network structure between things. It enables things to be part of a social network to search for required services or things. The search is influenced by the trust assigned, subjectively or objectively, to each thing. In an SC, sensors and actuators might be placed at relevant locations such as classrooms. Then, according to the proposed SIoT relationships, sensors and actuators in a classroom create social relationships between each other, either by their closeness in space (called co-location relationships) or by their need to cooperate and work together to achieve a certain goal (called co-work relationships). Moreover, in the presence of an agent per classroom (the guardian), they create a hierarchical relationship; the agent on top, sensors, and actuators (things) at the bottom.
Some properties of our study (e.g., air quality, humidity, and temperature) might share a greater space than a classroom. For example, the temperature in a classroom dissipates and affects other classrooms in the same building. Consequently, when considering the spaces and locations in a building, agents need to cooperate to achieve balance and to improve students’ comfort and energy efficiency, agents in different classrooms and spaces cooperate and create SIoT relationships between them by using the wise module. Furthermore, agents need to perceive the state of the physical world to validate that their acts work towards the desired behaviors in the digital twin model. In a large deployment, communication between all agents would create communication overhead. To reduce this overhead, the state of the world should be perceived within the agents’ neighborhood [33].
Concluding, the SC is considered a small smart city in the scope of our research. SCs, similar to smart cities, are CAS but on a smaller scale, where heterogeneous elements adapt, interact, and create a pattern of relationships. The main elements in our SC model are IoT devices, guardians and the wise module, which have been modeled in the digital twin environment. The guardians and the wise module create relationships, interact, and adapt, whereas IoT devices (which may have limited resources) create relationships and interact. Additionally, we frame the potential relationships under the IoT paradigm called SIoT. The SIoT aims to provide a scalable and flexible network of things to facilitate their search and discovery, both processes influenced by security-related trust mechanisms. Those interactions are depicted in Figure 1.

1.5. IoT Platforms

In the literature, there are only a few papers that present descriptions of current SC proposals [8,40]. Nevertheless, authors in [41,42,43] have carried out extensive research on previous SC designs and have encountered several examples. There are SCs based on the development of an open data platform or based on cloud computing, service-oriented architecture, and IoT platforms.
As stated before, the main principle of communication inside an IoT system implies that each collector node must “speak” the same language. In IoT, this is a big issue since there is a deluge of devices, each with its own language that does not follow the standards [44]. However, this compatibility problem is solved through a middleware [37,45,46] (i.e., a software that provides interoperability between incompatible devices and applications). In the literature, IoT middleware solutions are sometimes referred to as IoT platforms or IoT middleware platforms because generally, the middleware is a platform. However, as it is proven in this project, other middleware tools exist, such as building information modeling (BIM) or computational simulation software, which can act as a middleware [47,48,49].
Various IoT platforms can be generally categorized into four categories known as (1) public traded IoT cloud platforms, (2) open source IoT cloud platforms, (3) developer friendly IoT cloud platforms, and (4) end to end connectivity IoT cloud platforms [50]. Table 1 describes various platforms in each of these categories that could be used in deployments of smart cities and IoT environments [21,50].

2. A Proposal for Smart Campus’ Metrics to Obtain a Digital Twin Model

The term smart campus (SC) has been used to refer to digital online platforms that manage university content and the set of techniques aimed to increase university student smartness and knowledge transmission ease [51]. Several research questions have to be addressed in order to model the SC concept. In [52], a systematic literature review is performed to explain the problem by analyzing more than 300 tracked publications: (1) what are the SC features? (2) What kinds of technologies support the implementation? (3) Is there any standard model? (4) What are the main applications? (5) What are the SC contributions? The main conclusion of the research community is that the research in the smart campus area is still growing, and there is no standard used for the development of the smart campus concept and implementation. In essence, an SC is generally considered as the integration of cloud computing and the IoT, which pursues intelligent management, teaching, research, and other activities of universities [8,52,53]. As stated in [8,52], the main challenges of a sustainable SC are (1) the promotion of intelligent energy management by inner facility management, (2) the existence of a digital twin model that facilitates simulations and knowledge extraction for intelligent decision-making and (3) obtaining real-time data to render campus map information ergonomically, to generate event response and warning services, etc.
The parameters that influence the SC’s environment are interconnected, so a specific component of comfort can make a space not comfortable in academic terms [54]. According to the American Society of Heating, Refrigerating and Air-Conditioning Engineers (ASHRAE) Technical Committee Terminology [55], the indoor environmental quality (IEQ) is the perceived indoor experience of the building’s indoor environment that includes aspects of design, analysis, and operation of energy-efficient, healthy, and comfortable buildings. Fields of specialization include architecture, heating, ventilation, and air conditioning (HVAC) design, thermal comfort, indoor air quality, lighting, acoustics, and control systems.
Thus, the term that comprises the evaluative numerical summary of IEQ performance data is known as the IEQ model [56]. To provide an outline picture of how well a workspace is performing, IEQ models require the aggregation of data by using objective physical measurements (e.g., air temperature, humidity, measurement of noise level, dioxide concentration, luminance, etc.), subjective occupant perceptions (e.g., how satisfied are you with the temperature in your workstation? Does the air quality in your workspace enhance or interfere with your ability to get your job done? etc.) collected with manual surveys or both objective and subjective data [5,17]. The measurement of subjective IEQ indexes is widely achieved by methods such as the Building Use Studies Ltd. (BUS) [57] and through the Center for the Built Environment (CBE) survey [58]. Nevertheless, surveys do not always capture IEQ issues that may have energy implications (e.g., over-lighting or economizer operation) and have incomplete diagnostic capability, and they also have a difficulty finding a general interpretation criterion of results [59].
This paper will focus on several objective measurement methods that have been developed and justified in the literature, since our goal is to quantify the comfort level experienced at the campus facilities by collecting environmental data in order to maintain the updated digital twin. The criterion followed to review the studies previously completed has been the same as the proposed by David Heinzerling et al. [56], without forgetting our introduced restrictions related to energy efficiency.

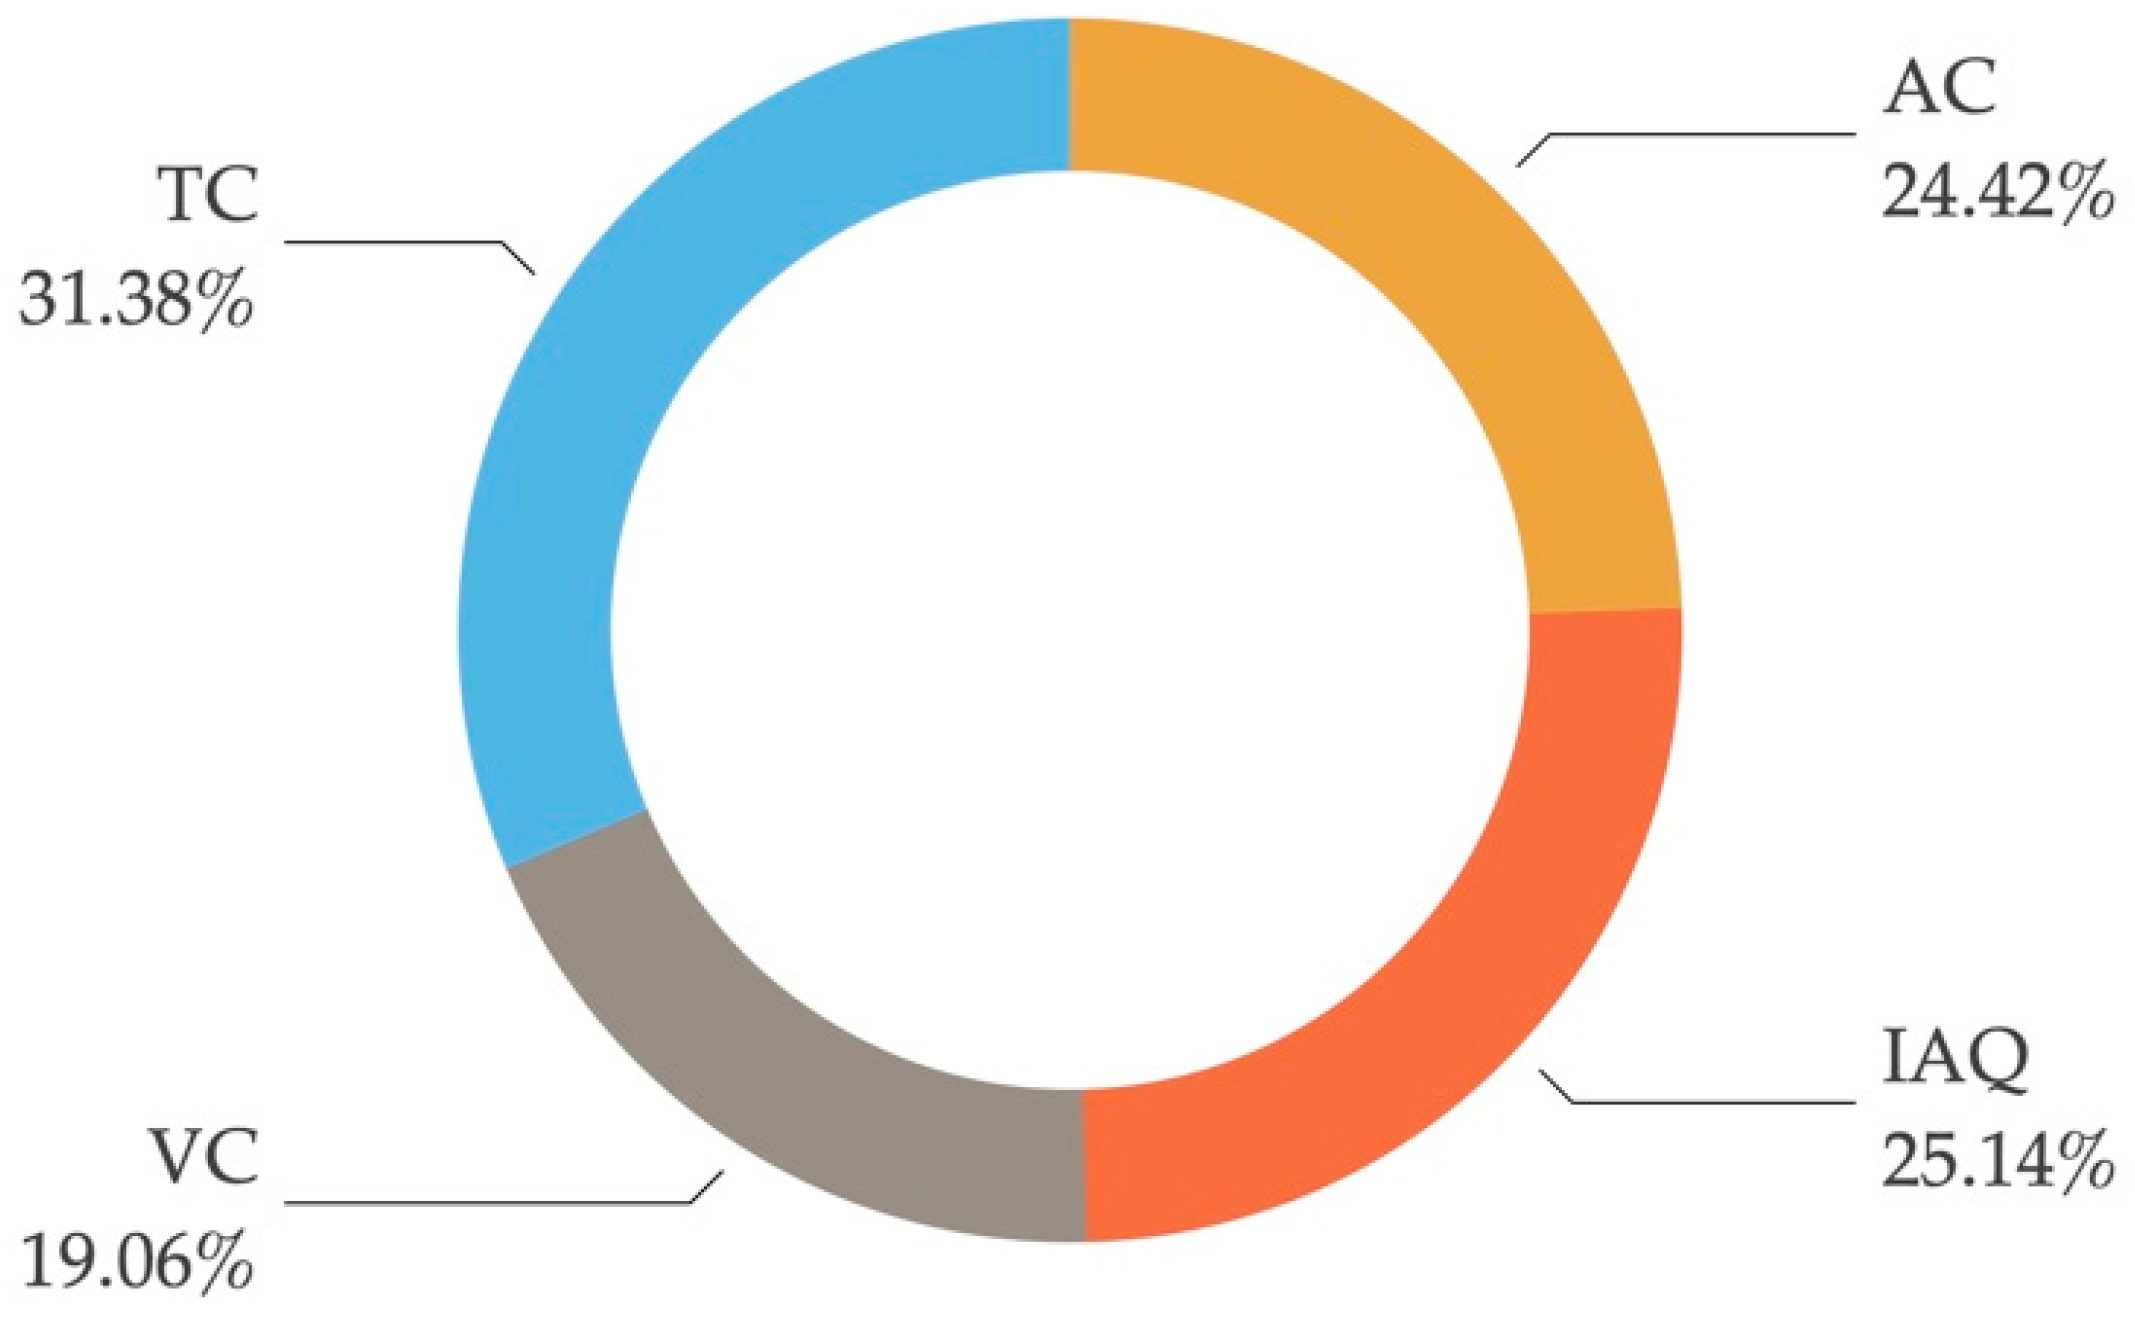
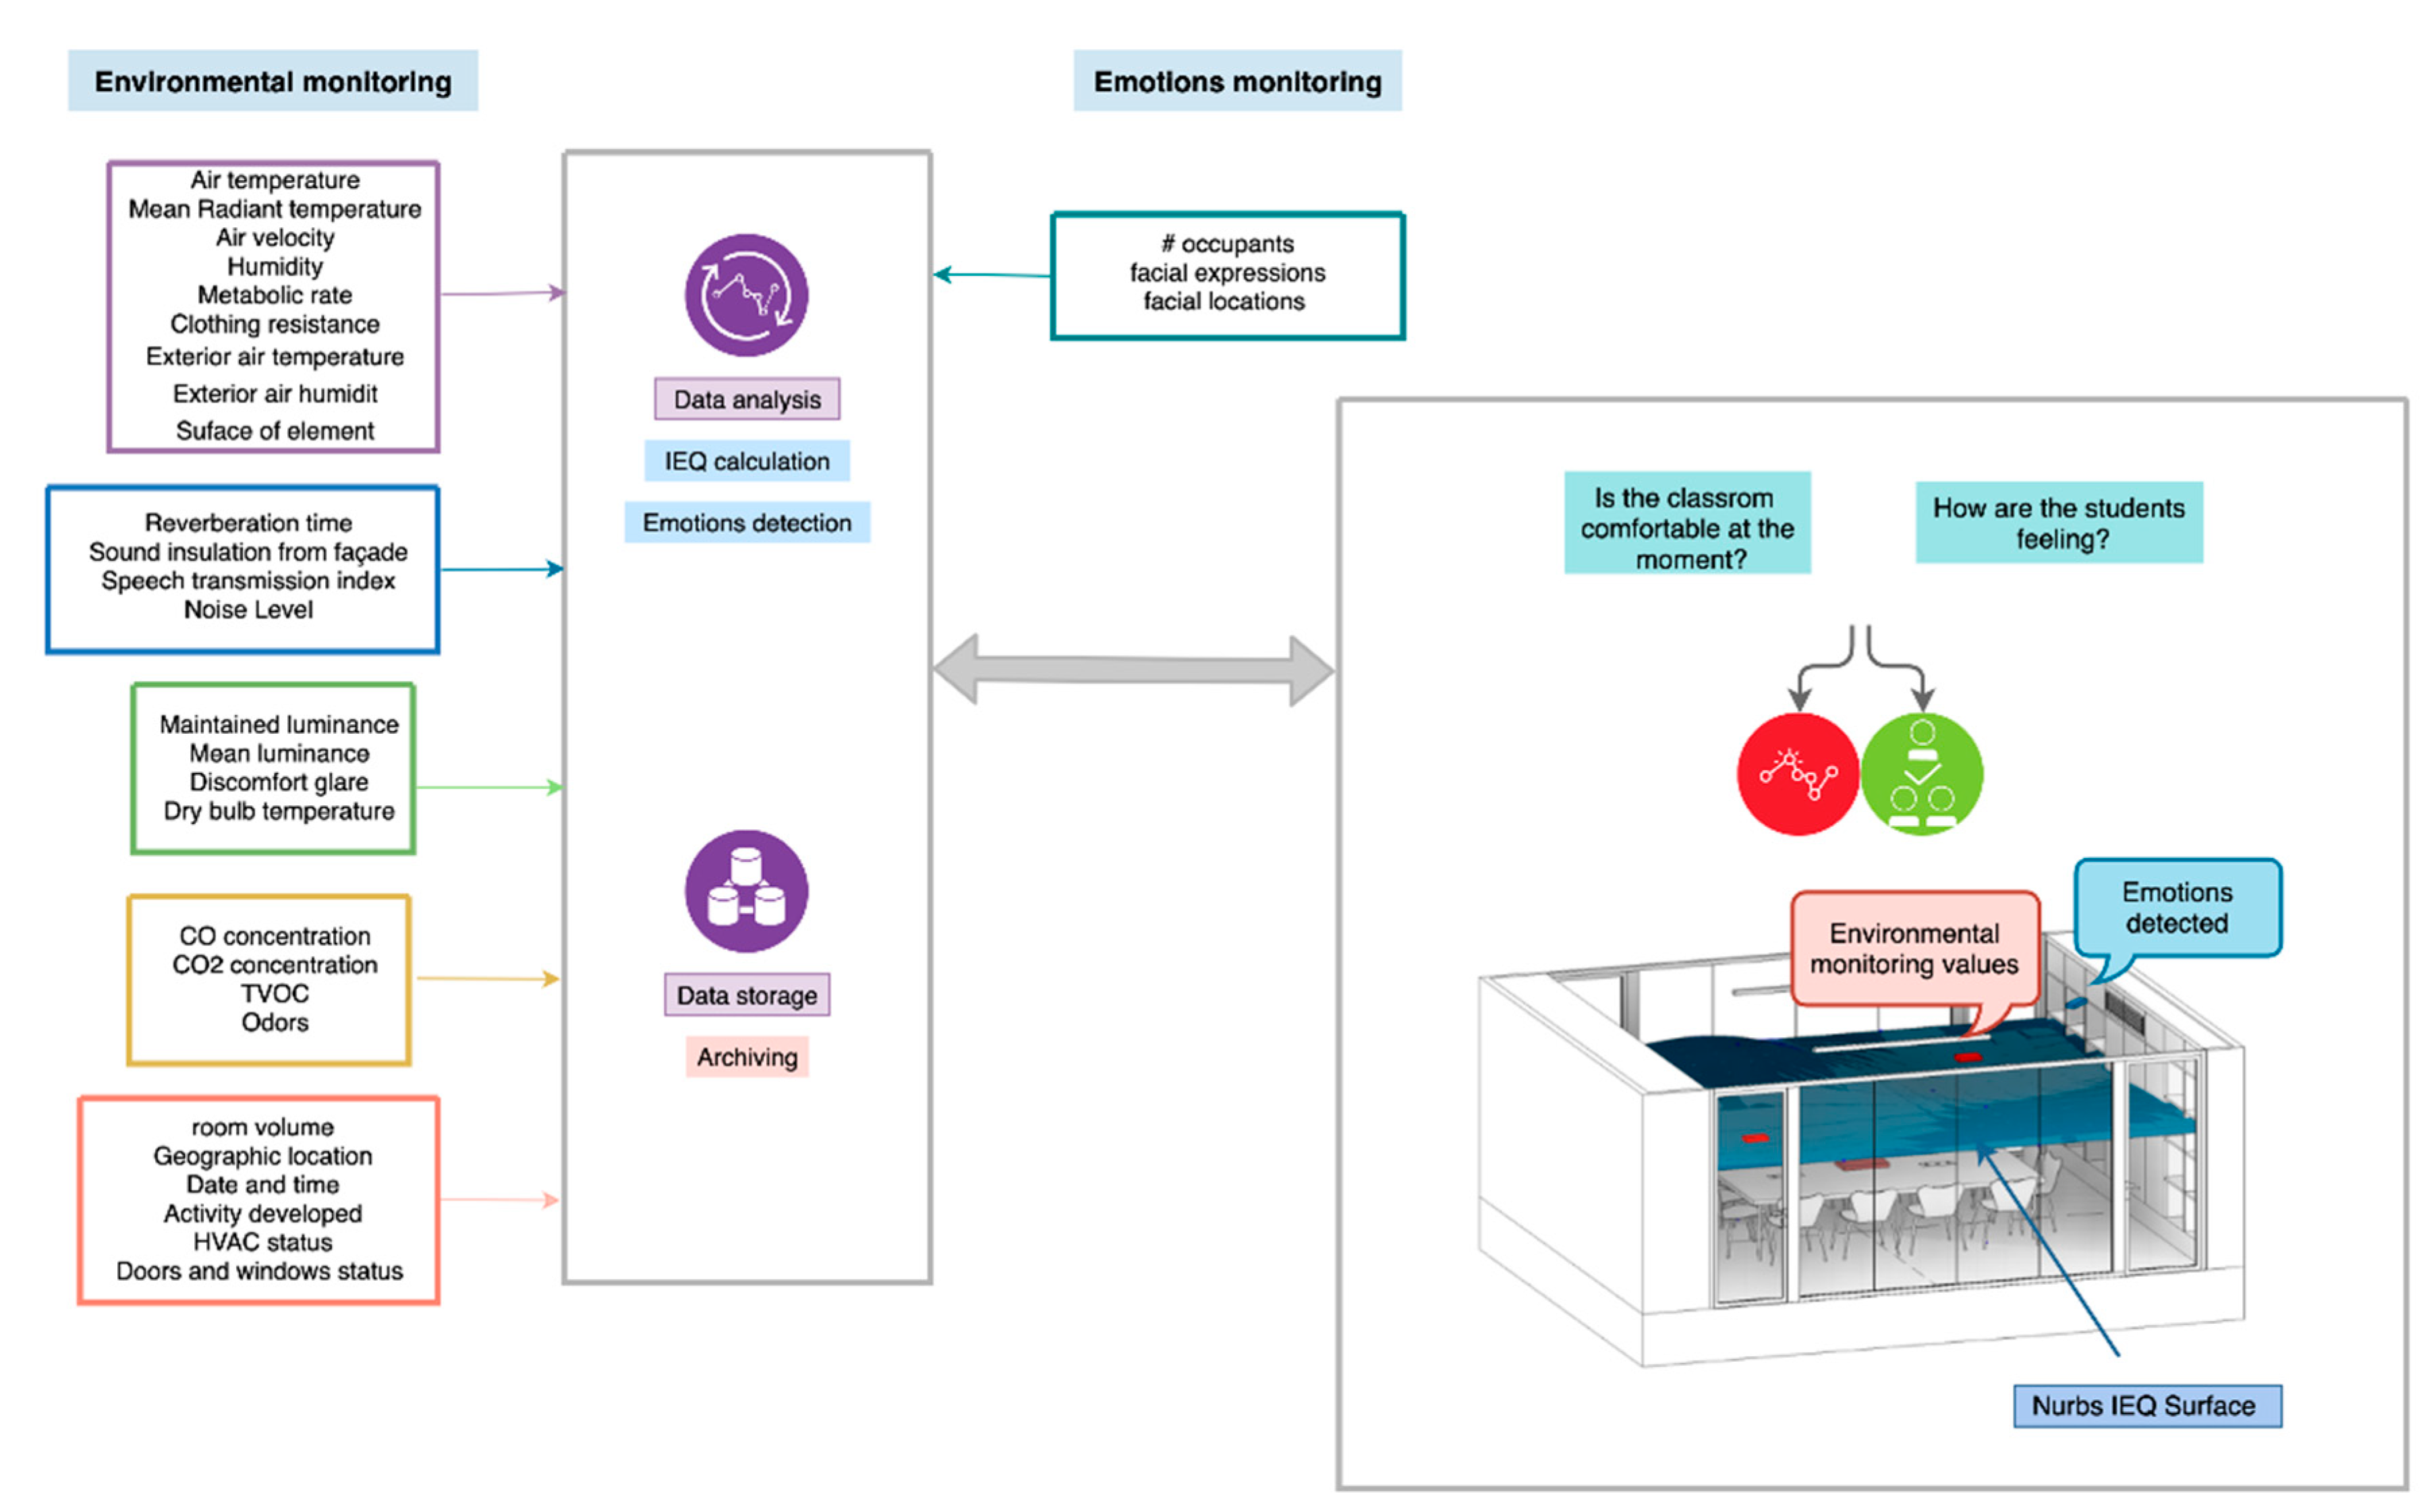
2.1. Comfort Modeling

As stated in [55], the indoor environmental quality models combine multiple IEQ parameters, comprised of acoustic comfort (AC), indoor air quality (IAQ), visual comfort (VC), thermal comfort (TC), and represent the relation between occupant satisfaction and objective measurements by way of a single number. Nevertheless, not all physical environments of indoor comfort are equally important to the occupants. In [56], authors have defined the weighting scheme regarding the four types of comfort that comprise the IEQ model. The existing literature on indoor environmental quality (IEQ) evaluation models is explored from previous literature studies [60,61,62,63,64]. Then, a new weighting and classification scheme is proposed.
The criteria followed in this paper to select an existing IEQ weighting and model schema are not only settled on the weighting schema closest to the one defined by experts in the field, but are also based on observations (surveying), creating a generic formula for each of the four comfort metrics. As a result of applying the above foundation, the proposed schema that our research has followed [63,64,65] is the one weighted in Figure 2 and quantified in Table 2.
Table 3 shows our proposal for physical environmental parameters to be measured and the sensors that could be used, specifying the comfort metric.

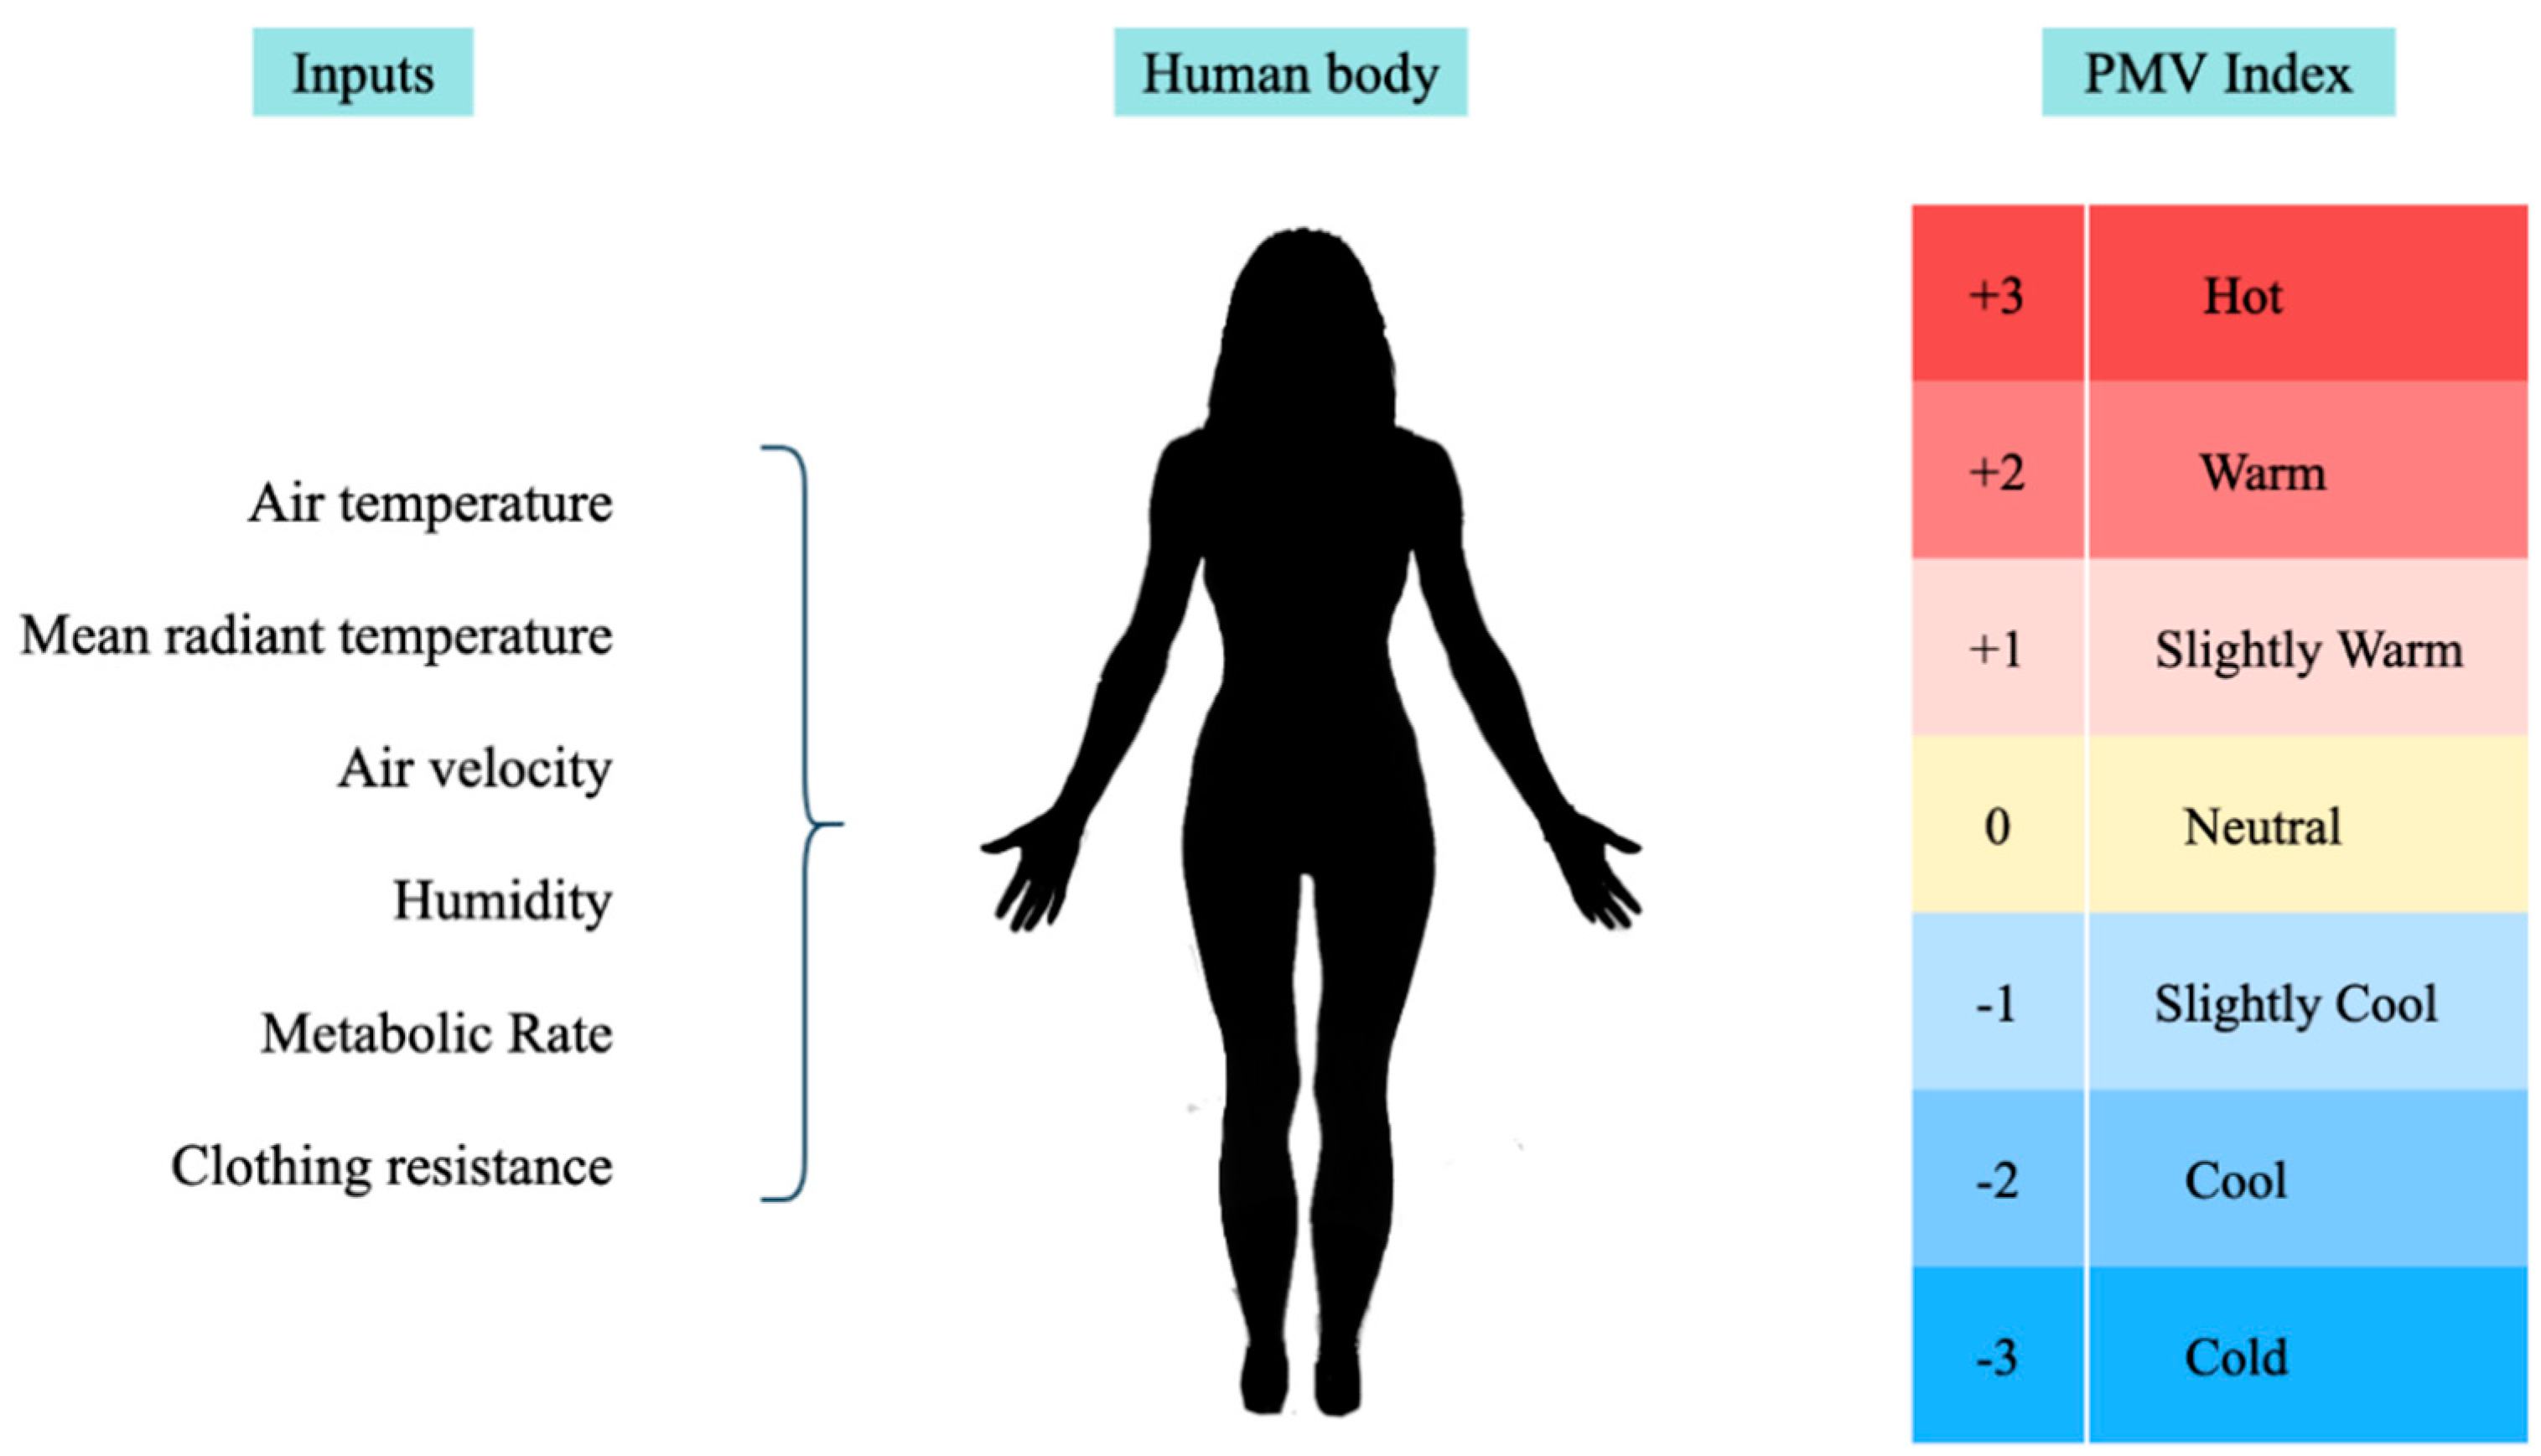
2.1.1. Thermal Comfort (TC)

The human body tries to maintain a temperature of around 37 °C. The temperature is maintained through heat exchange between the human body and the environment through convection, radiation, and evaporation [66]. In a building, any sense of discomfort of the occupants motivates them to modify comfort parameters (e.g., those of the HVAC system or opening/closing windows) to obtain the desired comfort, usually obtaining non-optimal levels regarding energy efficiency [54]. A thermal comfort model based on the thermal balance of the human body was developed by Fanger [67] for living spaces in 1970 (see Figure 3). In this model, Fanger calculated the predicted mean vote (PMV) index (seven-point scale) by relating the net heat in the human body and the surrounding thermal equilibrium, using six different parameters consisting of four environmental factors (indoor air temperature, mean radiant temperature, air velocity, and humidity) and two personal factors (activity or metabolic rate and clothing resistance) [66,68].
In terms of thermal preferences, various studies collected by Zheng Yang et al. [69] have shown that students easily accept slightly cool thermal conditions [70] but prefer slightly warm environments [71] (e.g., temperatures above 23.33 °C (74 °F) influence student performance in math and reading [72]).

2.1.2. Acoustic Comfort (AC)

In classrooms, knowledge is mainly transmitted through oral communication. The quality of this communication, and ultimately, of classroom education itself, is closely linked to the classroom’s acoustic quality [73]. This acoustic quality can be characterized based on some parameters described in the International Organization for Standardization (ISO) 3382 standard [74], where methods include measuring the reverberation time [75], speech transmission index [76], sound insulation [73], and the noise levels inside and outside the classroom [77,78,79]. According to these authors, high noise levels in the classroom impair oral communication, causing students to become tired sooner more often. This premature fatigue tends to provoke a negative effect on their cognitive skills. In fact, the recommended noise level in [77] is 40 dB(A) for classroom purposes.

2.1.3. Visual Comfort (VC)

The main focus on visual comfort has traditionally been light levels, contrast, and discomfort glare. Upon these, there is agreement on many principles [80], defined by the International Commission on Illumination (CIE) [81,82], the European Committee for Standardization (CEN) [83], and also lighting guides for specific building properties, such as the Lighting Guide LG5 for educational buildings [84] or the recommended practice for office lighting [85] by the Illuminating Engineering Society of North America (ANSI/IES).
The light levels are determined by the maintained luminance, which is provided by artificial lighting, and the luminous flux (either artificial or natural), which describes the quantity of light measured at 0.75 m above the ground with a lux meter (see Table 4, where the discomfort glare rating is used).

2.1.4. Indoor Air Quality (IAQ)

According to [55], indoor air quality is defined as the attributes of the respirable air inside a building (indoor climate), including gaseous composition, humidity, temperature, and contaminants (Table 5). Having poor indoor air quality (IAQ) is related to sick-building-syndrome (SBS), which can be tied to a lack of adequate outdoor air ventilation, improper exhaust, ventilation of odors, chemicals or fumes, or poor indoor air quality. Other sources of sick buildings may be linked to contaminants produced by outgassing of some types of building materials, volatile organic compounds (VOC), bacteria molds, etc. This syndrome does not conform to a particular illness and is difficult to trace to a specific source.
Air quality does not only affect the health status of the occupants, but it also affects the monitoring of odorous compounds in ambient air, which is an important task for environmental researchers because of the presence of some toxic volatile organic compounds (VOC) and carbonyl compounds in odorous compounds [87]. The VOC and carbonyl compounds present in malodors have adverse effects on the air quality in the surrounding areas of the sources as well as on the health of the people residing near the sources [88].

2.2. Energy Efficiency Monitoring

Energy efficiency is the objective of reducing the amount of energy required to provide products and services. There are many motivations to improve energy efficiency (e.g., financial cost savings and solutions to the problem of reducing greenhouse gas emissions). According to Leadership in Energy and Environmental Design standards (LEED standards [89]), the design of an energy-efficient building consists of implementing a whole-building system approach in the most efficient way to achieve an energy-efficient building. The whole-building approach treats the building as one energy system with separate but dependent parts. This means that, in order to fulfill our objective, we have to make our university campus an energy-efficient building capable of measuring and reducing its energy consumption by defining a whole-building’s digital twin where IoT sensors and agents are in charge of the real-time data updating. The most relevant tactics for this objective are the following [89]:
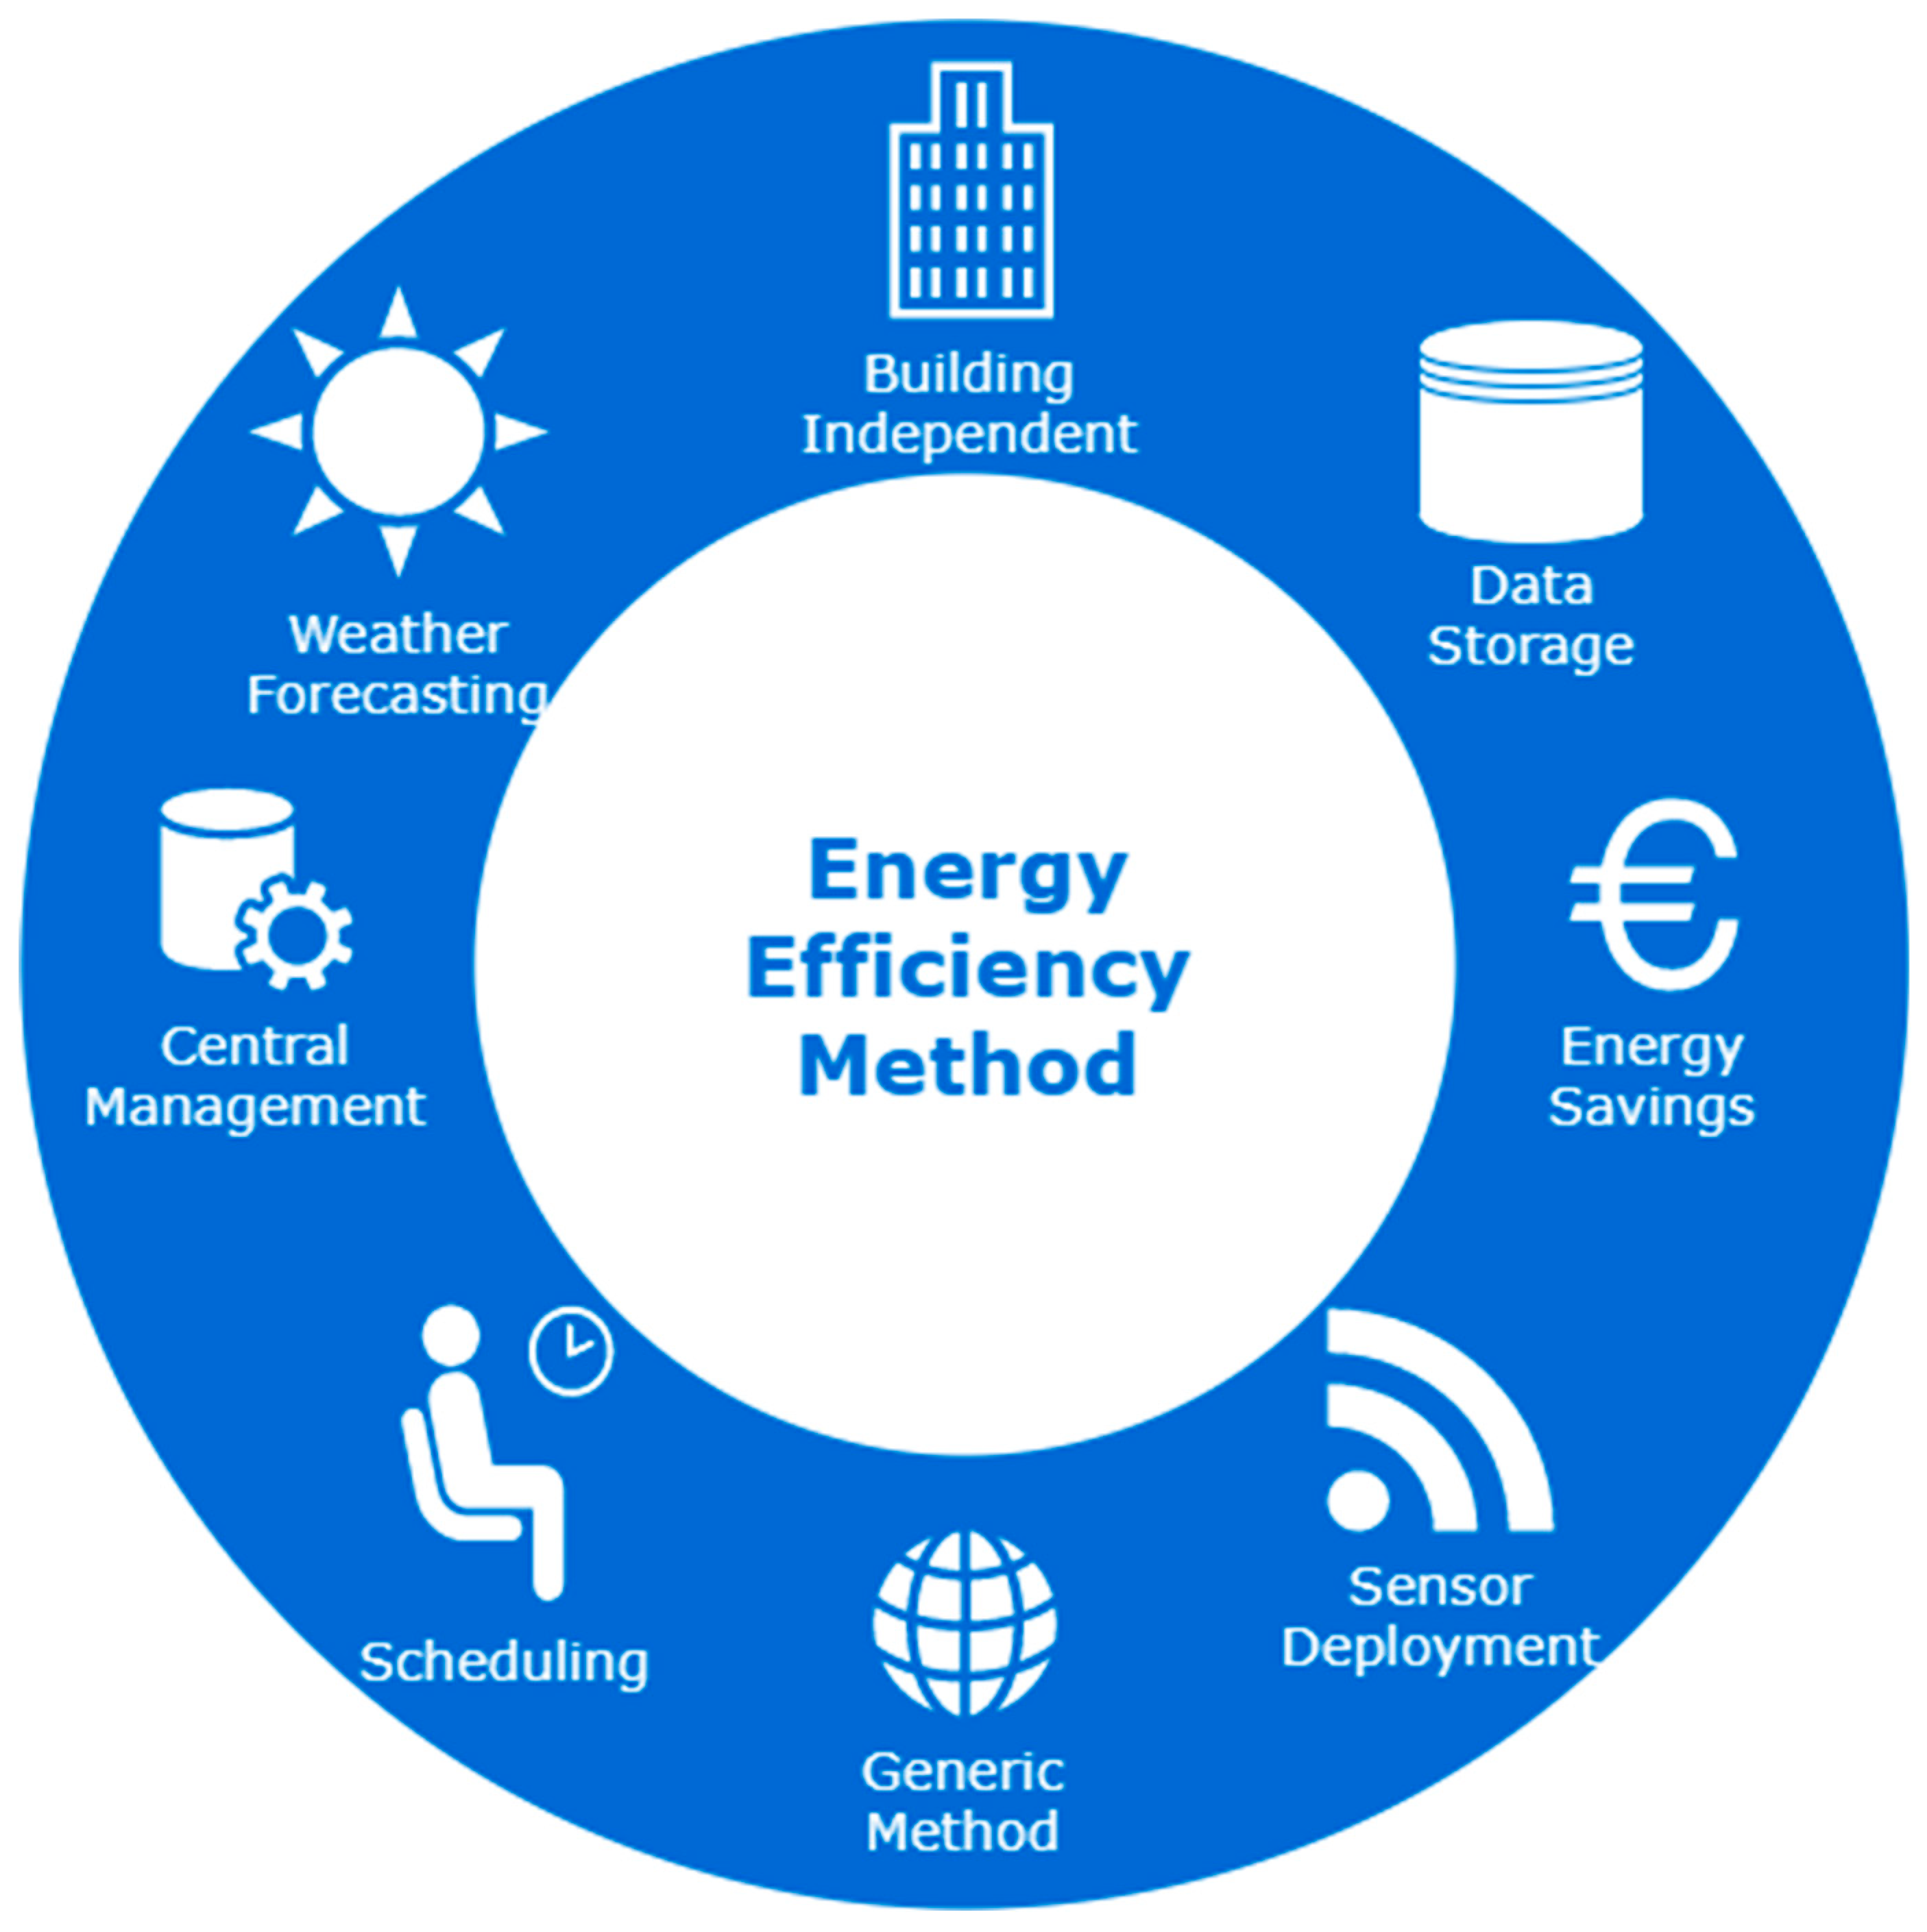
  • Design of an energy-efficient building: the implementation of a whole-building system approach to new construction is the most efficient way to achieve an energy-efficient building (see Figure 4).
  • Weather usage: the design should take into consideration the building orientation. The way a structure is situated on a site and the placement of its windows, rooflines, and other architectural features is critical for efficiency. Weather data could be incorporated by outdoor sensor agents or by using a public Application Programming Interface (e.g., Meteostat’s API offers historical and daily weather data from anywhere [90]).
  • Ventilation: in a traditional building that uses natural ventilation or extract ventilation, 20 to 40 percent of energy consumed for heating is caused by ventilation.
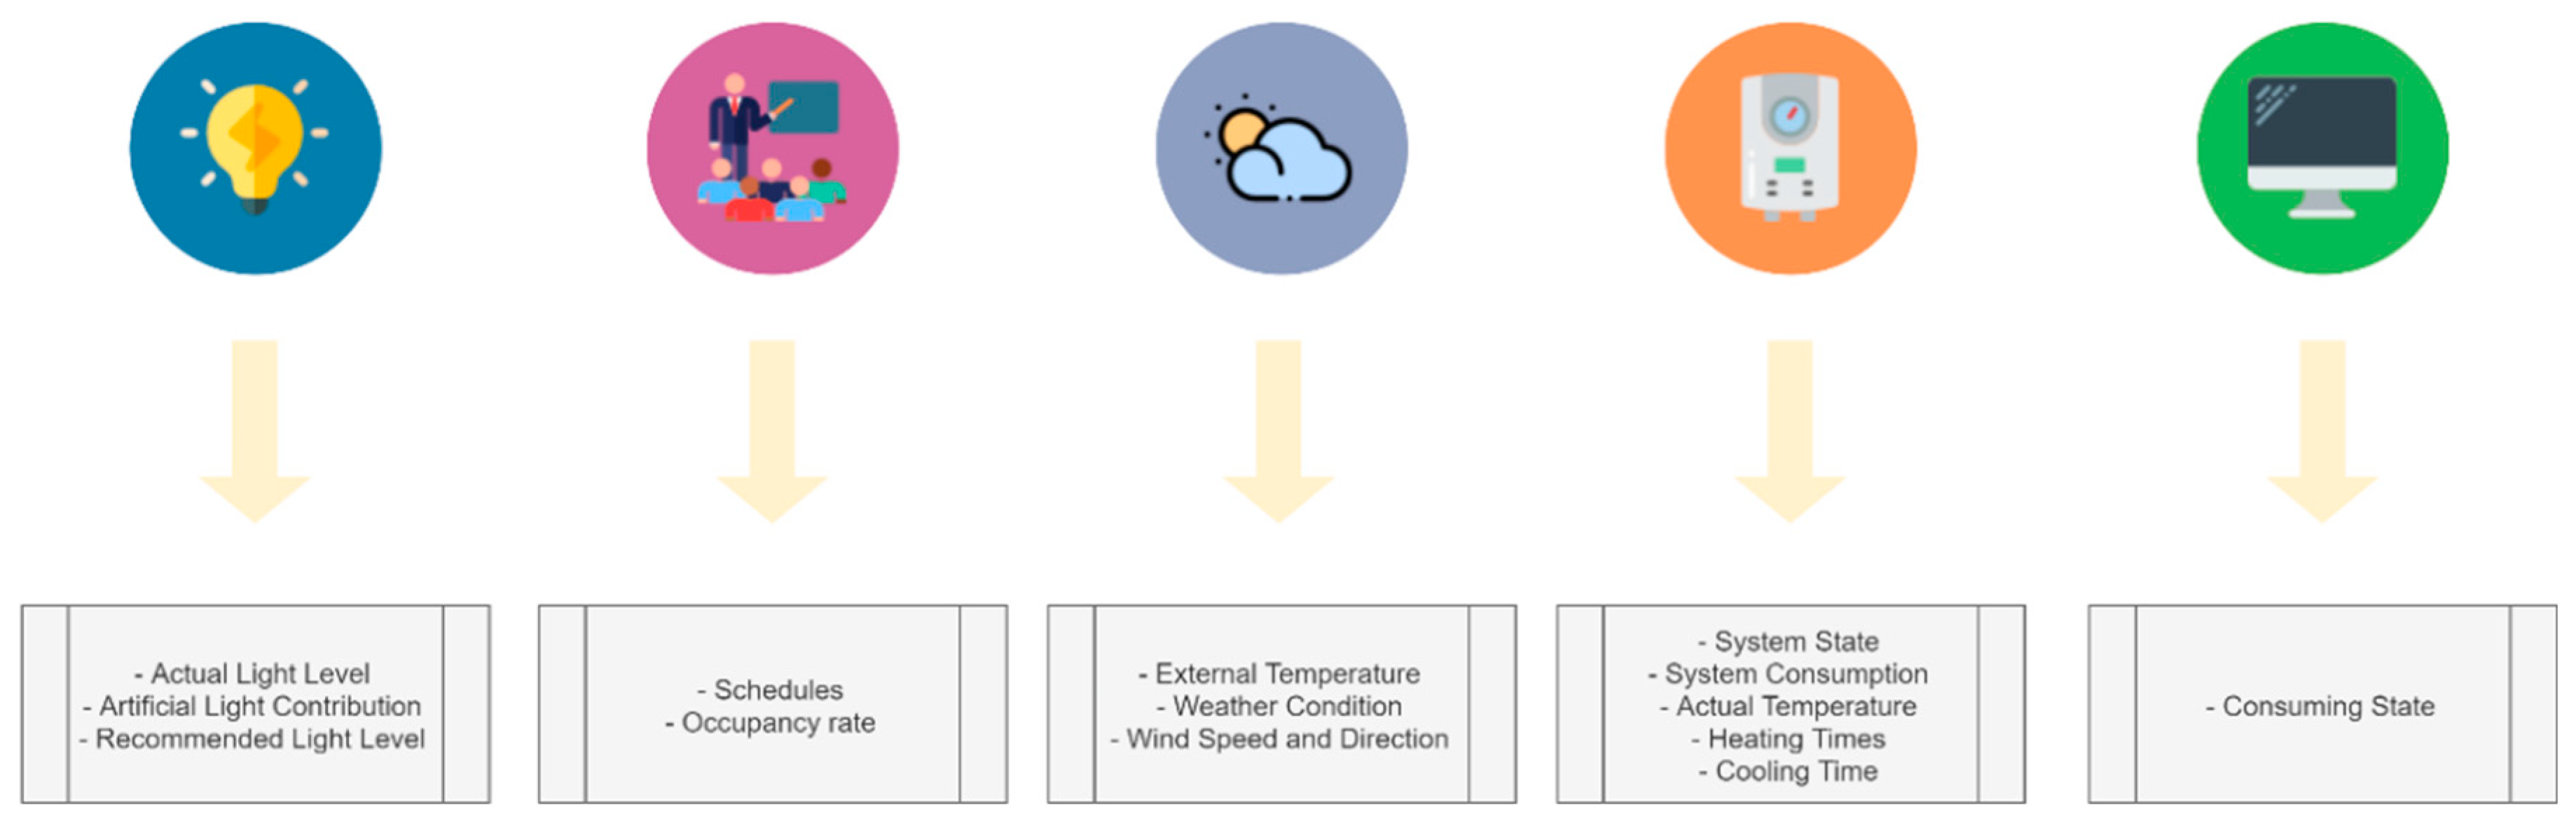
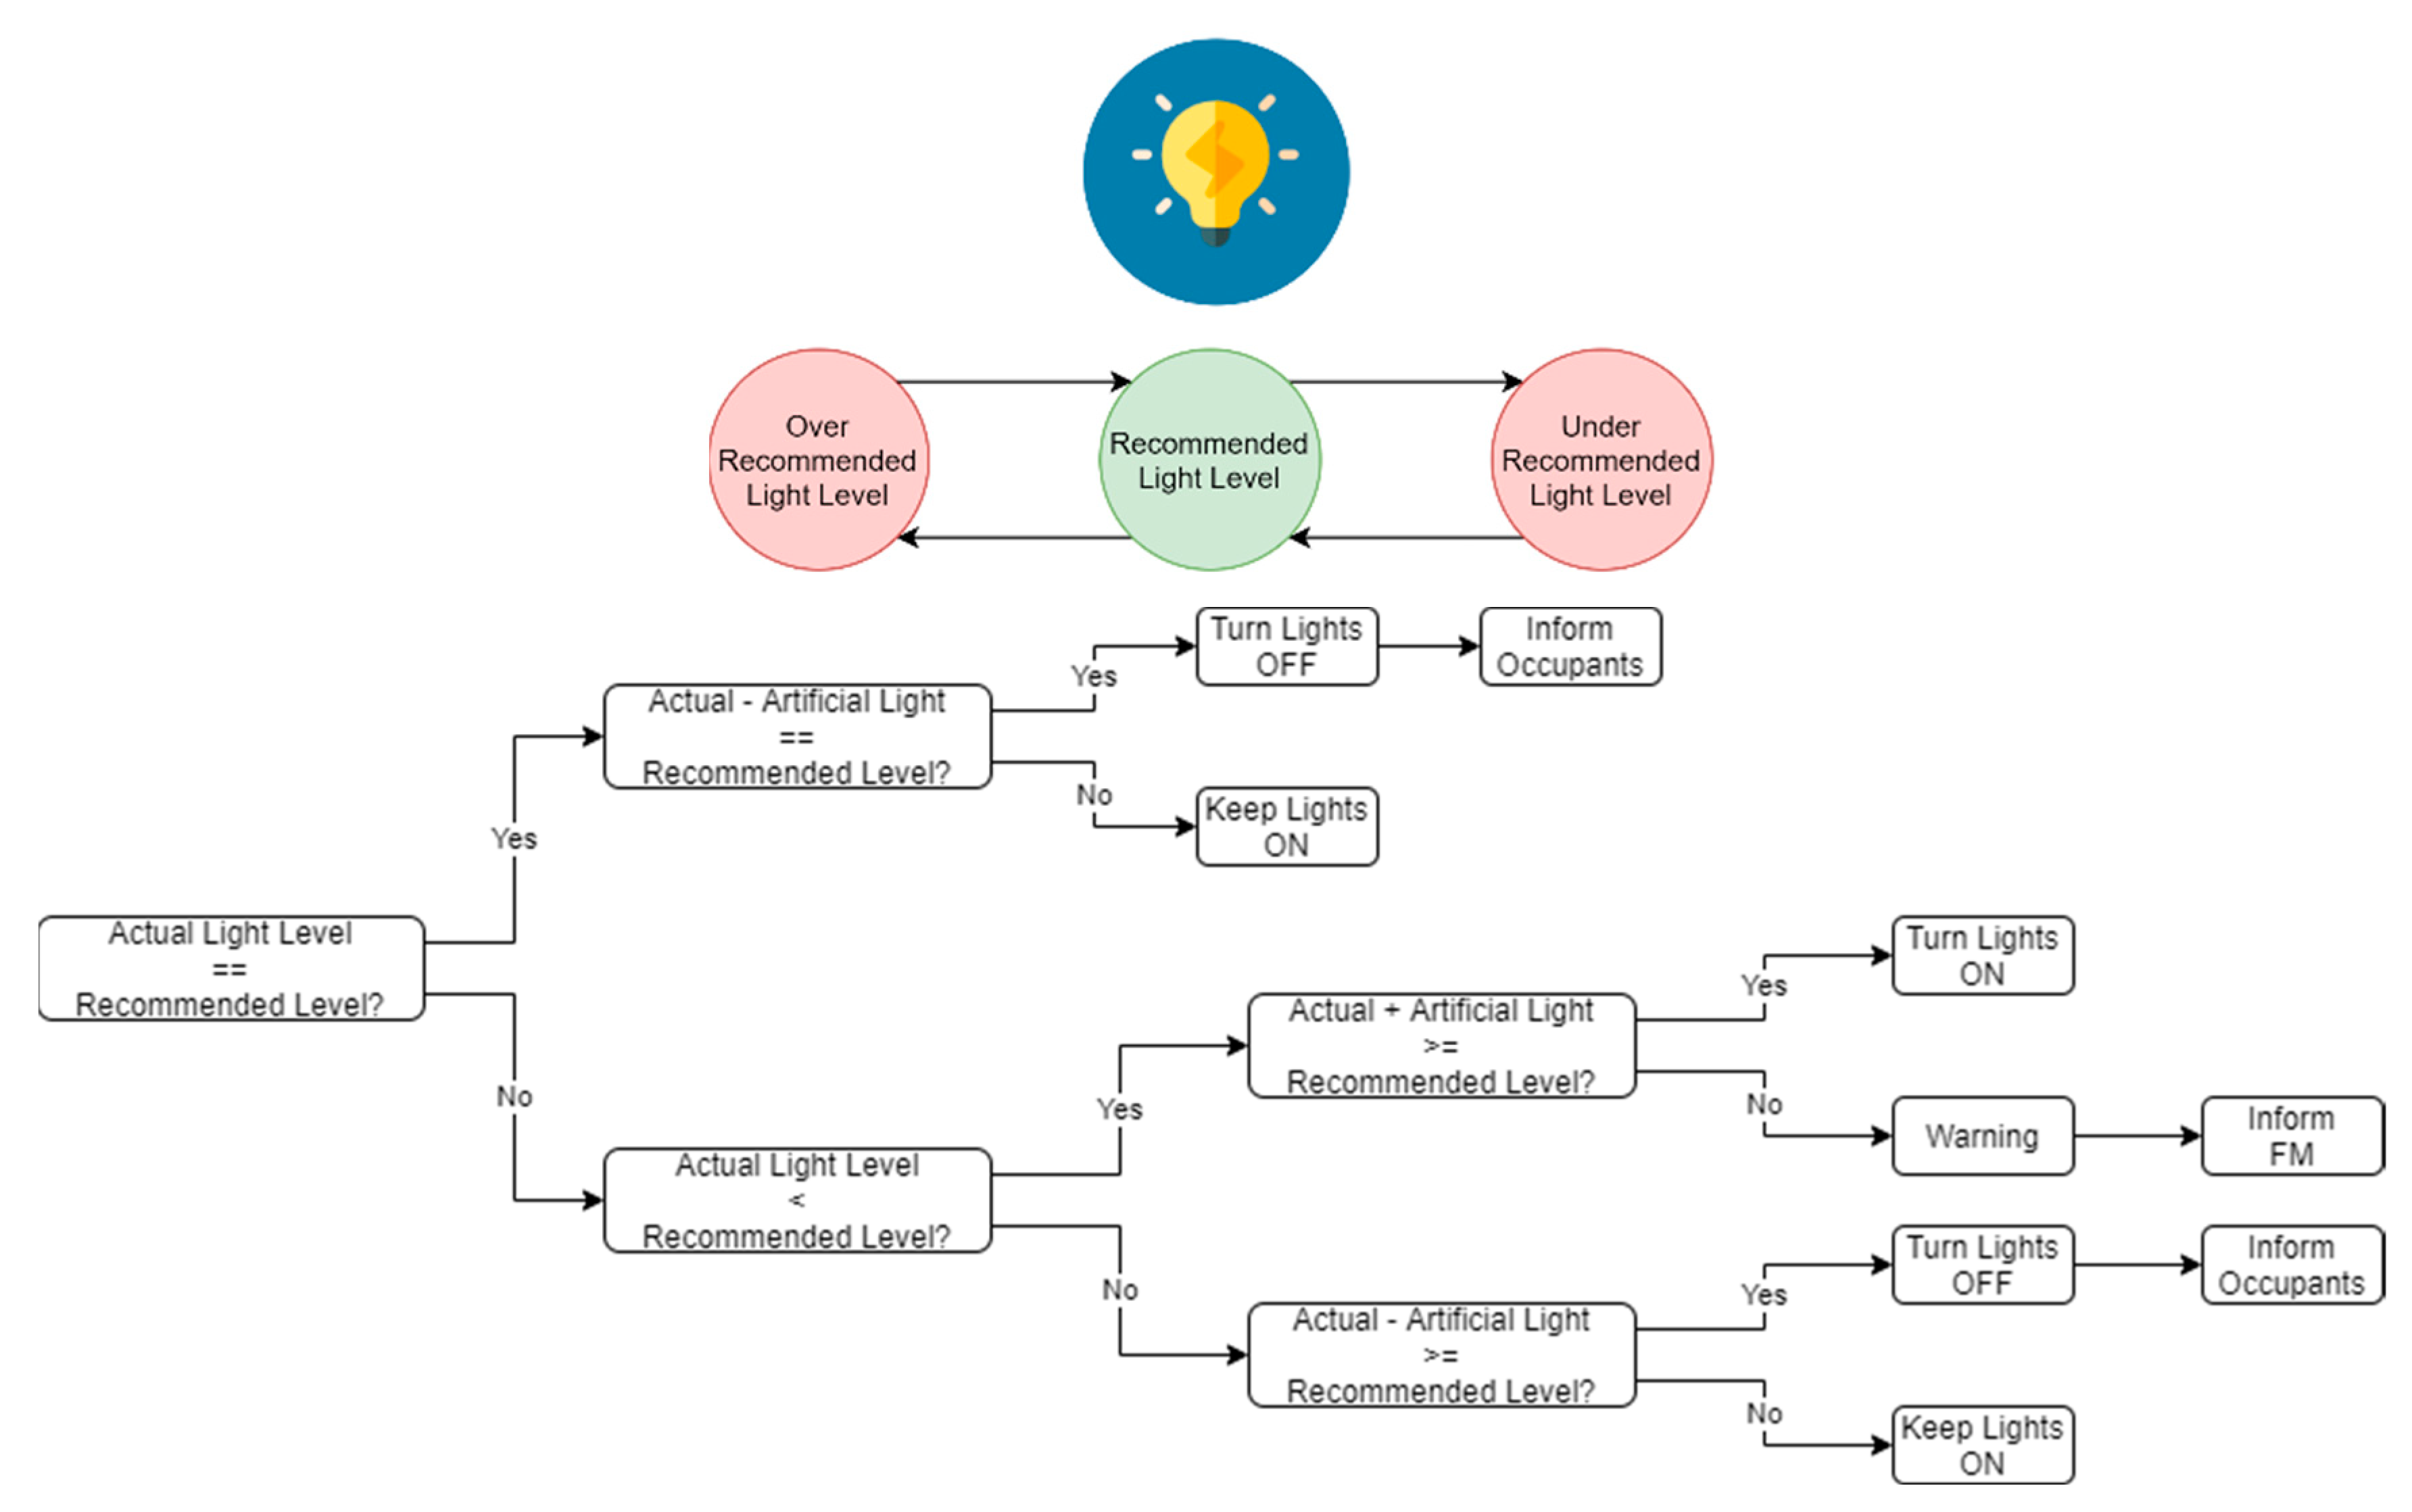
  • Lighting: the decision to install (1) IoT sensors such as timers and photocells that turn lights off when not in use and (2) dimmers, when used to lower light levels are good decisions to save money and energy. Light over ethernet or digital addressable lighting interfaces are smart solutions that make luminaries controllable. These methods are applied with light-emitting diode (LED) technology and allow a total control and monitoring of the whole building’s luminaries [91,92].
  • Heating: this concept is the largest energy expense in educational and commercial buildings. The incorporation of energy-efficient and real-time measures into a building’s heating and cooling systems is essential to create an energy-efficient accurate model of the current behavior inside the digital model. In terms of heating, a programmable or smart thermostat is one of the best options to work hand in hand with the wise module. When you install a programmable thermostat, it is easier to eliminate wasteful energy use from heating and cooling without upgrading the HVAC system or sacrificing any comfort [93].
  • Monitoring: an energy modeling software is an effective way to bridge the physical and the virtual world. The digital twin could also integrate historical data from past usage to factor into its digital model. Thus, data must be transmitted seamlessly, allowing the virtual entity to exist simultaneously with the physical entity [94,95].
In an SC, the integration of systems can be used to reduce operating costs through experimentation with a digital twin model. This would result from applying most of the engineering and architectural characteristics mentioned before. If we divide the whole campus into zones, the smart system can easily control each room’s energy consumption [96]. We assume that the data sensed by IoT agents for the SC’s comfort must be useful enough for a system that aims to find energy efficiency as well, which can use them to generate efficiency improvements. However, these benefits should not be imposed on the comfort of the occupants of the building. Our proposal aims for efficient energy usage by using the data measured by sensors deployed inside the building for the TC, AC, VC, and IAQ assessment (Section 2.1), and other accessible data such as room schedules and weather forecasting (Figure 5).
In the SC that we propose, a zone defines a limited space within the building. The zone, which is usually a room or a section of the building, is described by a list of parameters such as capacity, occupancy schedules, daylight availability, current and historical occupancy, and comfort metrics (e.g., temperature and humidity). The guardian, a digital agent, is responsible for a unique zone (in a one-to-one relationship). It has the autonomy and responsibility to control the IoT devices and maximize the comfort and energy efficiency of the zone. Once the guardian gathers the data from the IoT sensors, it processes the data and stores them in the storage subsystem. Moreover, the guardians relay this information to a digital entity that aggregates them (and is on top of the hierarchy), the wise module. The wise module contains the support decision system that manages the entire building and guides each guardian, with the overarching goal of providing optimal comfort and energy efficiency (Figure 6). Thus, the wise module is the main actor for the inferred level of the smartness of the campus [97].

3. The Digital Twin Deployment

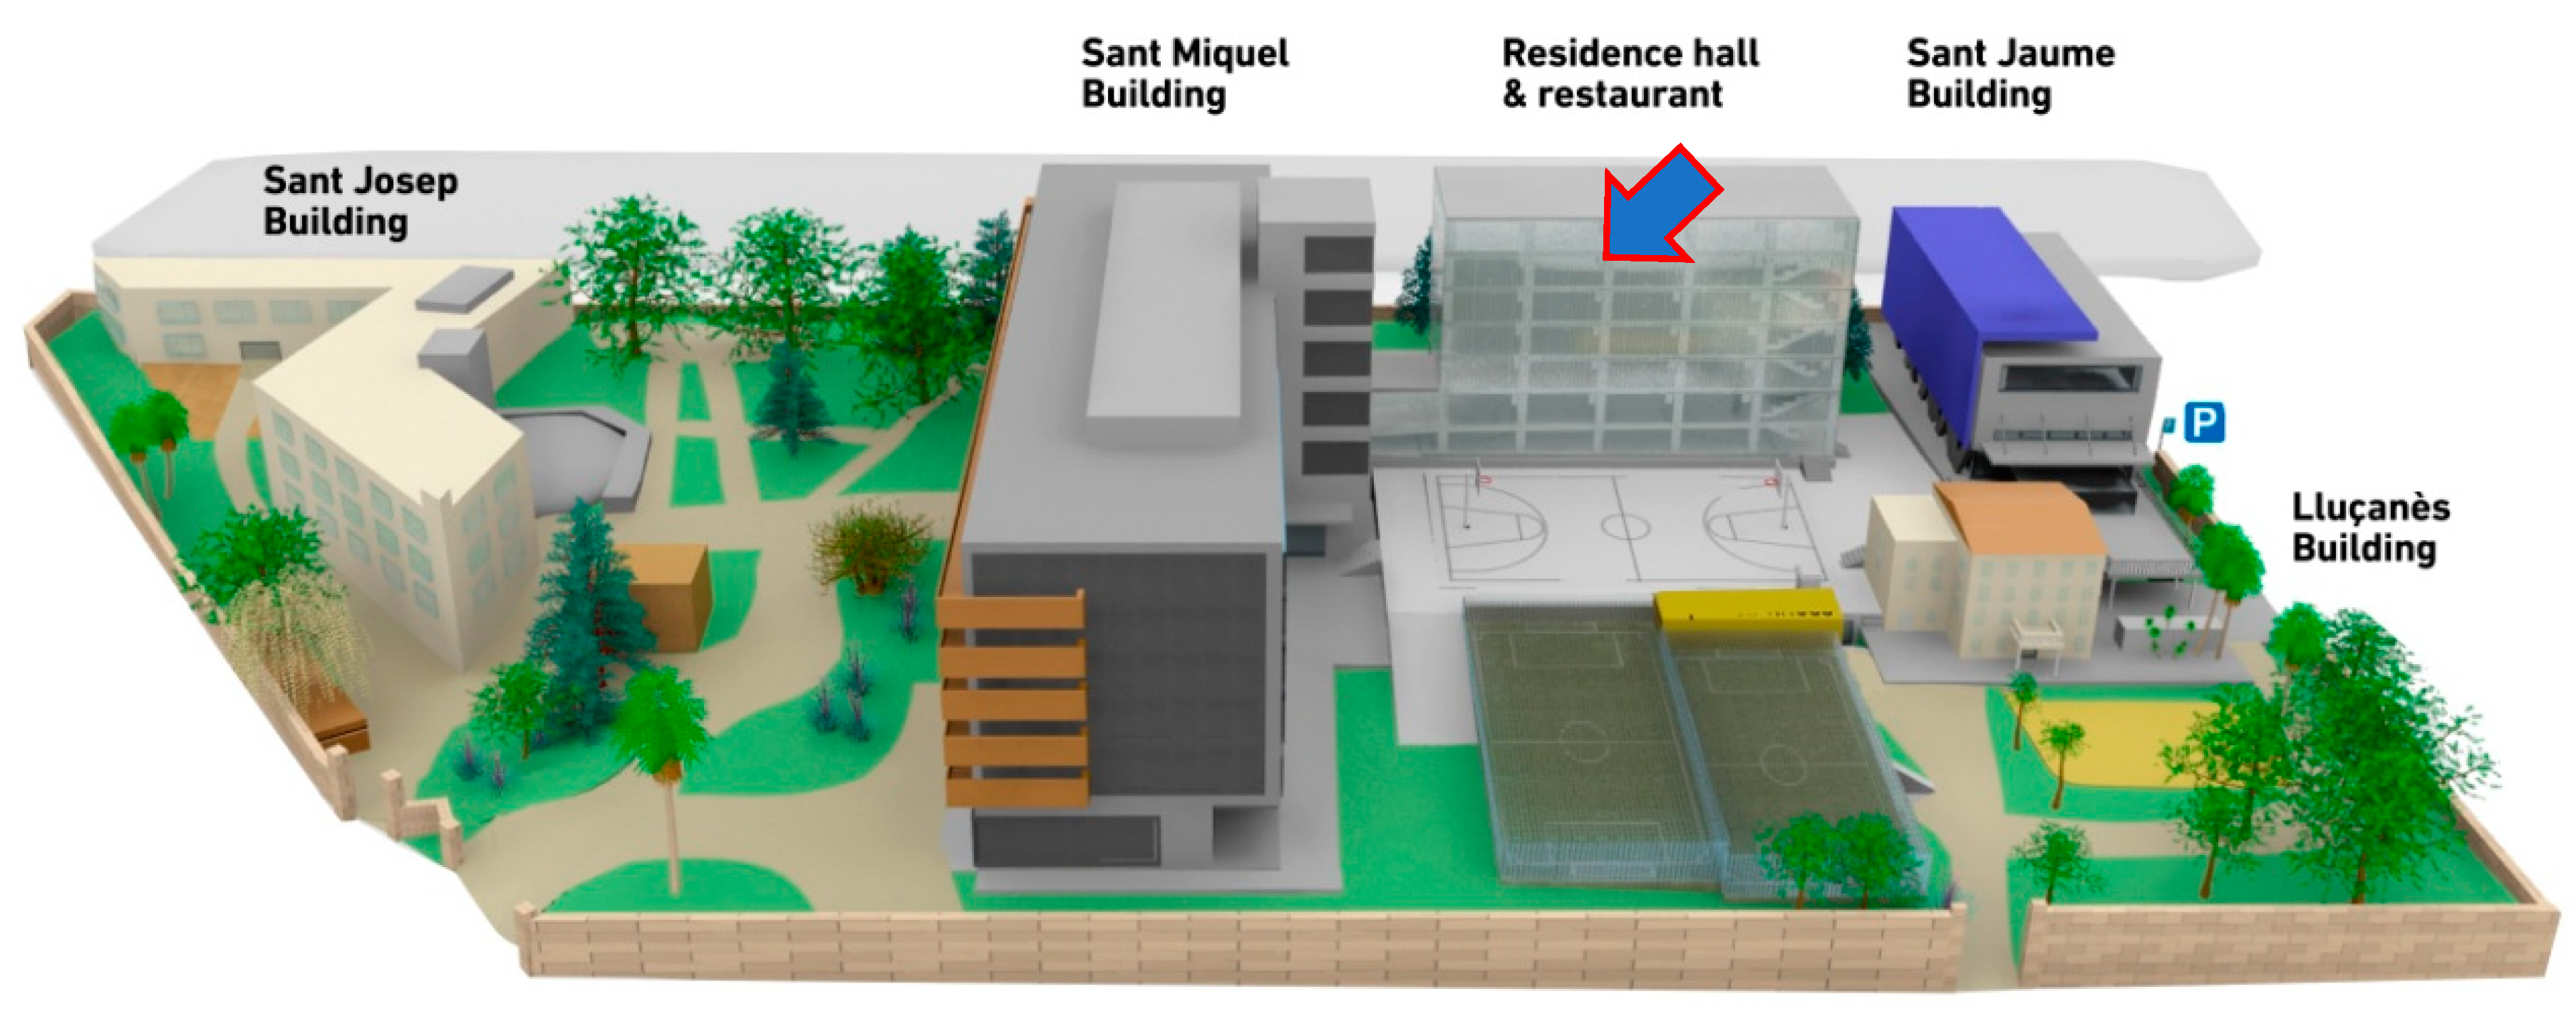
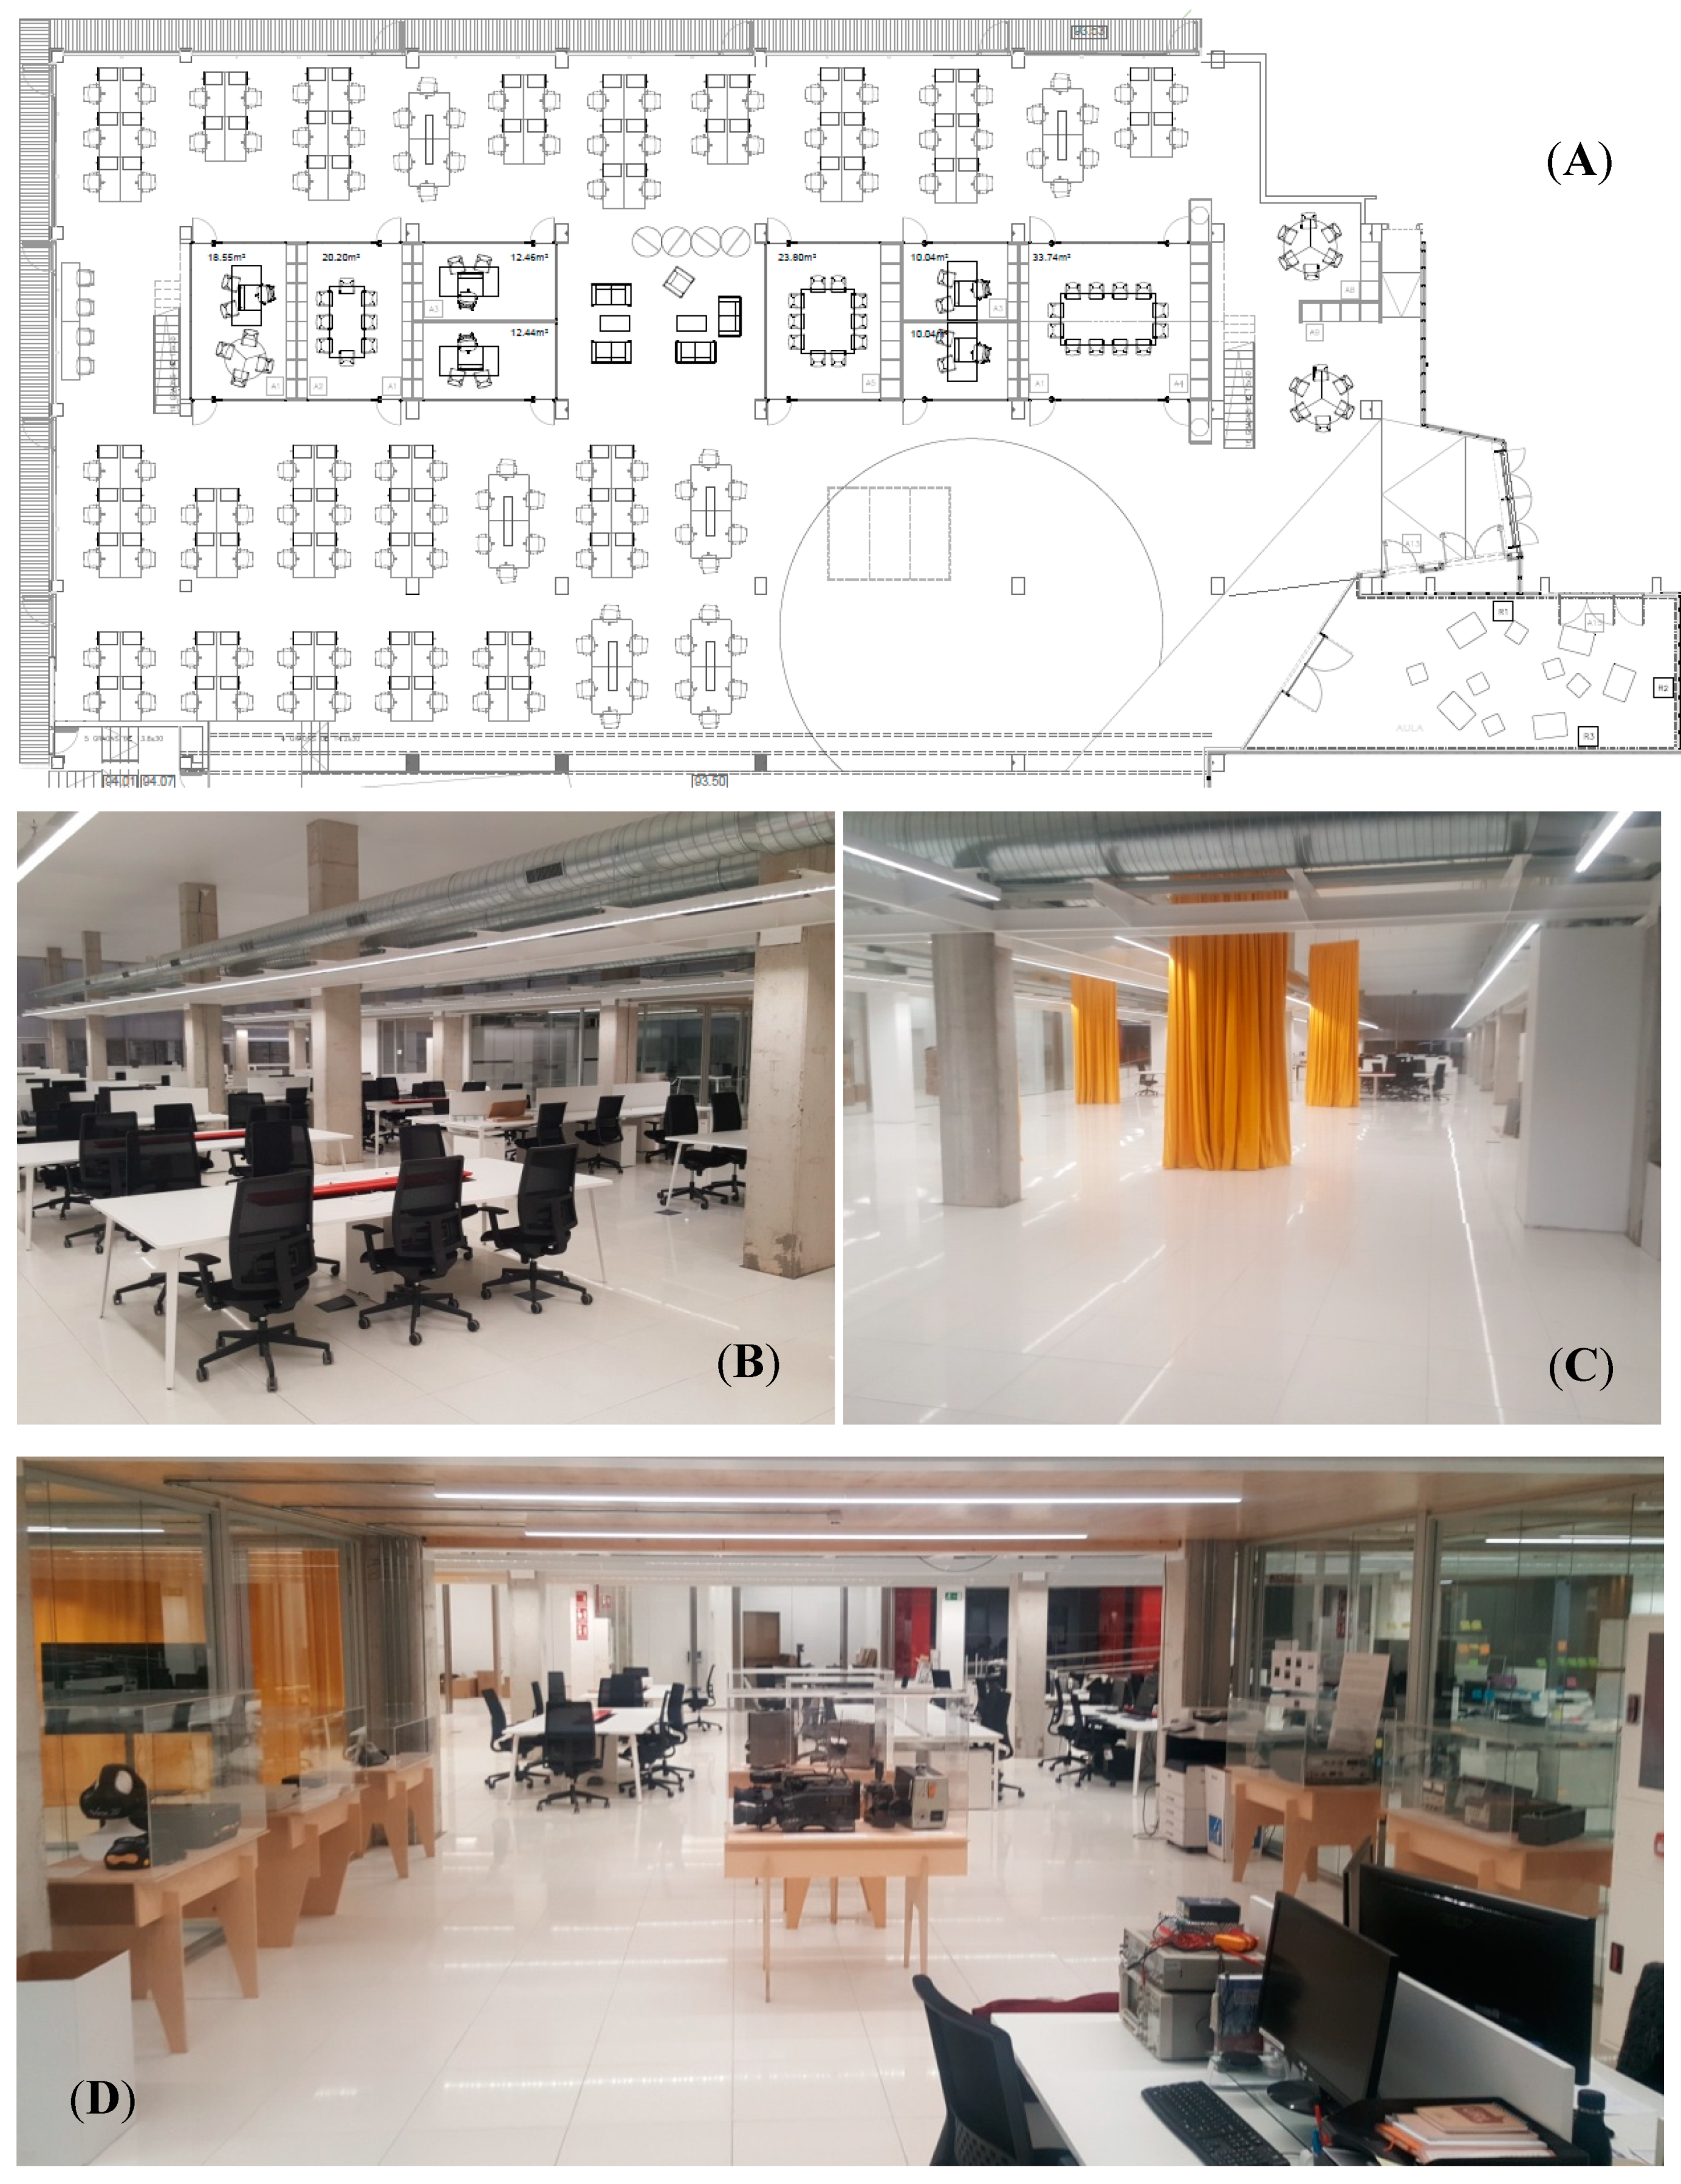
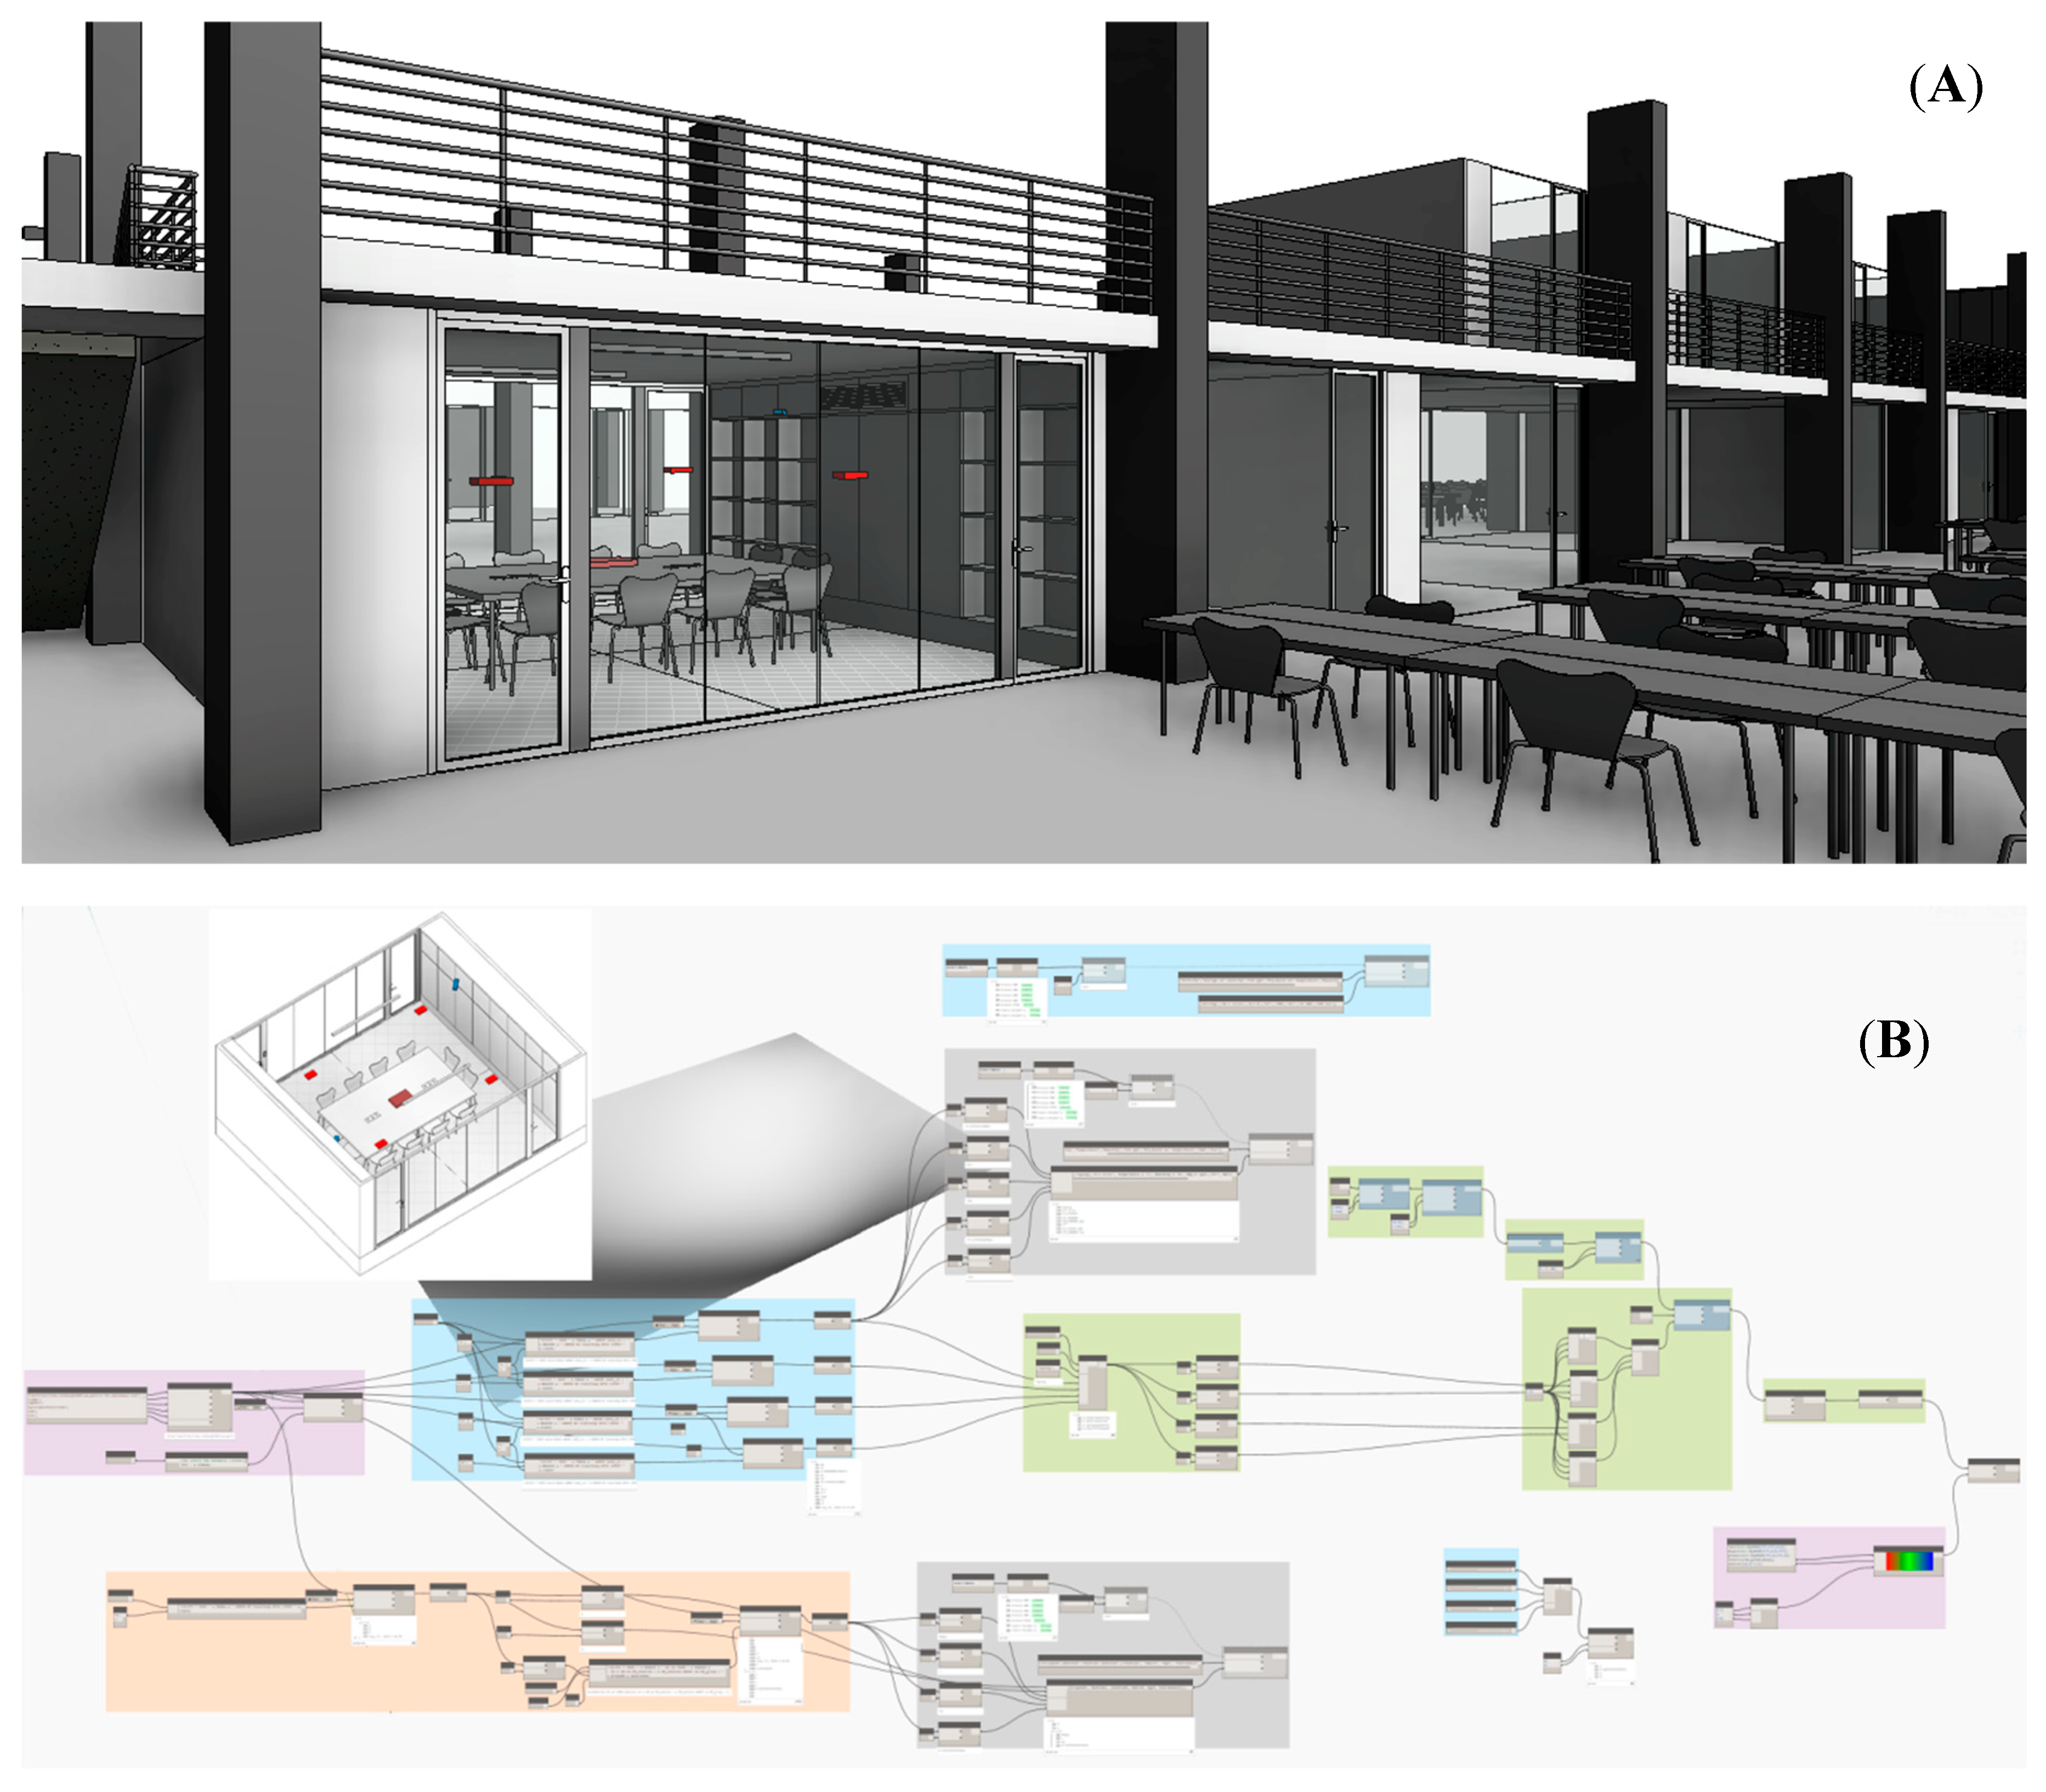
3.1. The Building Premises Modeling

The Internet of Things Institute of Catalonia (facilities of LaSalle-URL (University Ramon Llull at Barcelona)) is the first interdisciplinary European R&D laboratory in which everything related to the interaction of people with the social and technological changes of their environment will be worked on, with a focus on the Internet of Things (digital interconnection of everyday objects with the internet). In fact, it is a space for the development of innovation initiatives and start-ups, in which business technological challenges coexist, in search of differentiating answers, with start-ups propelling new value propositions, with demonstrations of talent (researchers, professors, university students, experts, and consultants, among others) of a diverse nature and with connection to other technological parks.
The IoT institute has been co-financed since 2020 by the European Regional Development Fund (ERDF) under the framework of singular institutional projects in R&D infrastructures in the generation of excellent research, the attraction of talent, and the development of knowledge transfer activities. The laboratory is based on design, prototyping, and scaling the products and services of tomorrow for society and the business world, as well as taking students and professors toward the new realities and needs of future societies. The 2000 m2 space (situated below the international students’ residence) will be dedicated to research, innovation, and the promotion of talent and entrepreneurship (Figure 7 and Figure 8).
The laboratory has four different areas (Figure 9):
  • A common social meeting point where people can debate, show, and even try out any idea that has been conceived during the innovation process. Ideas can later be tried out in the design and testing processes.
  • Creativity room: spaces designated to fomenting creativity and information exchanges and where challenges are born into a creative and imaginative environment. These spaces can be used for structured activities, but also to facilitate an idea flow, which can be used to set off new innovation and research processes.
  • Maker space: workspace designed to provide tools to develop projects for the group of researchers from the areas of architecture, management and engineering, together with designers, students, inventors, and entrepreneurs.
  • City lab: space for the assembly and testing of technologies that have been developed. This is the showroom where the final products of projects are displayed, which promotes learning through overcoming challenges and is now being used all over our campus. This new laboratory will enable students to go further than case-studies, using new research and transfer techniques, with systemized processes to face tomorrow’s challenges.
This paper is focused on the case-study location modeling regarding the co-creation rooms in the medium center of the laboratory. By grouping together the aforementioned information, a global vision of the system can be obtained as follows: on the one hand, IoT agents that measure the environmental monitoring are used to calculate the IEQ index, whereas the information regarding the emotions of the occupants provided by the middleware intelligence is used for a double-check of the objectively perceived comfort. Furthermore, the middleware layer is responsible for archiving the data in a database and communicating with the visualization platform to make a predictive analysis about the monitored space’s comfortability, by rendering the data into a virtual classroom model and taking into account the energy monitoring (see Figure 10).
We have to consider that comfort is directly related to the monitored space and the environment parameters, as analyzed in the previous sections. This relation between space and parameters is where the usual IoT platforms would limit the project, most IoT platforms only consider the readings produced by IoT devices, but they do not relate those readings with the location of production (revisit Table 1). Conversely, if building information modeling (BIM) is used [98], the collected data can be linked with the building environment parameters and characteristics (such as other indoor and outdoor characteristics) and with data from external sources, adding value to the collected data.
BIM is one of the emerging developments in architecture, engineering and construction (AEC) industries [98], and there are three main concepts regarding BIM that we cover in the project:
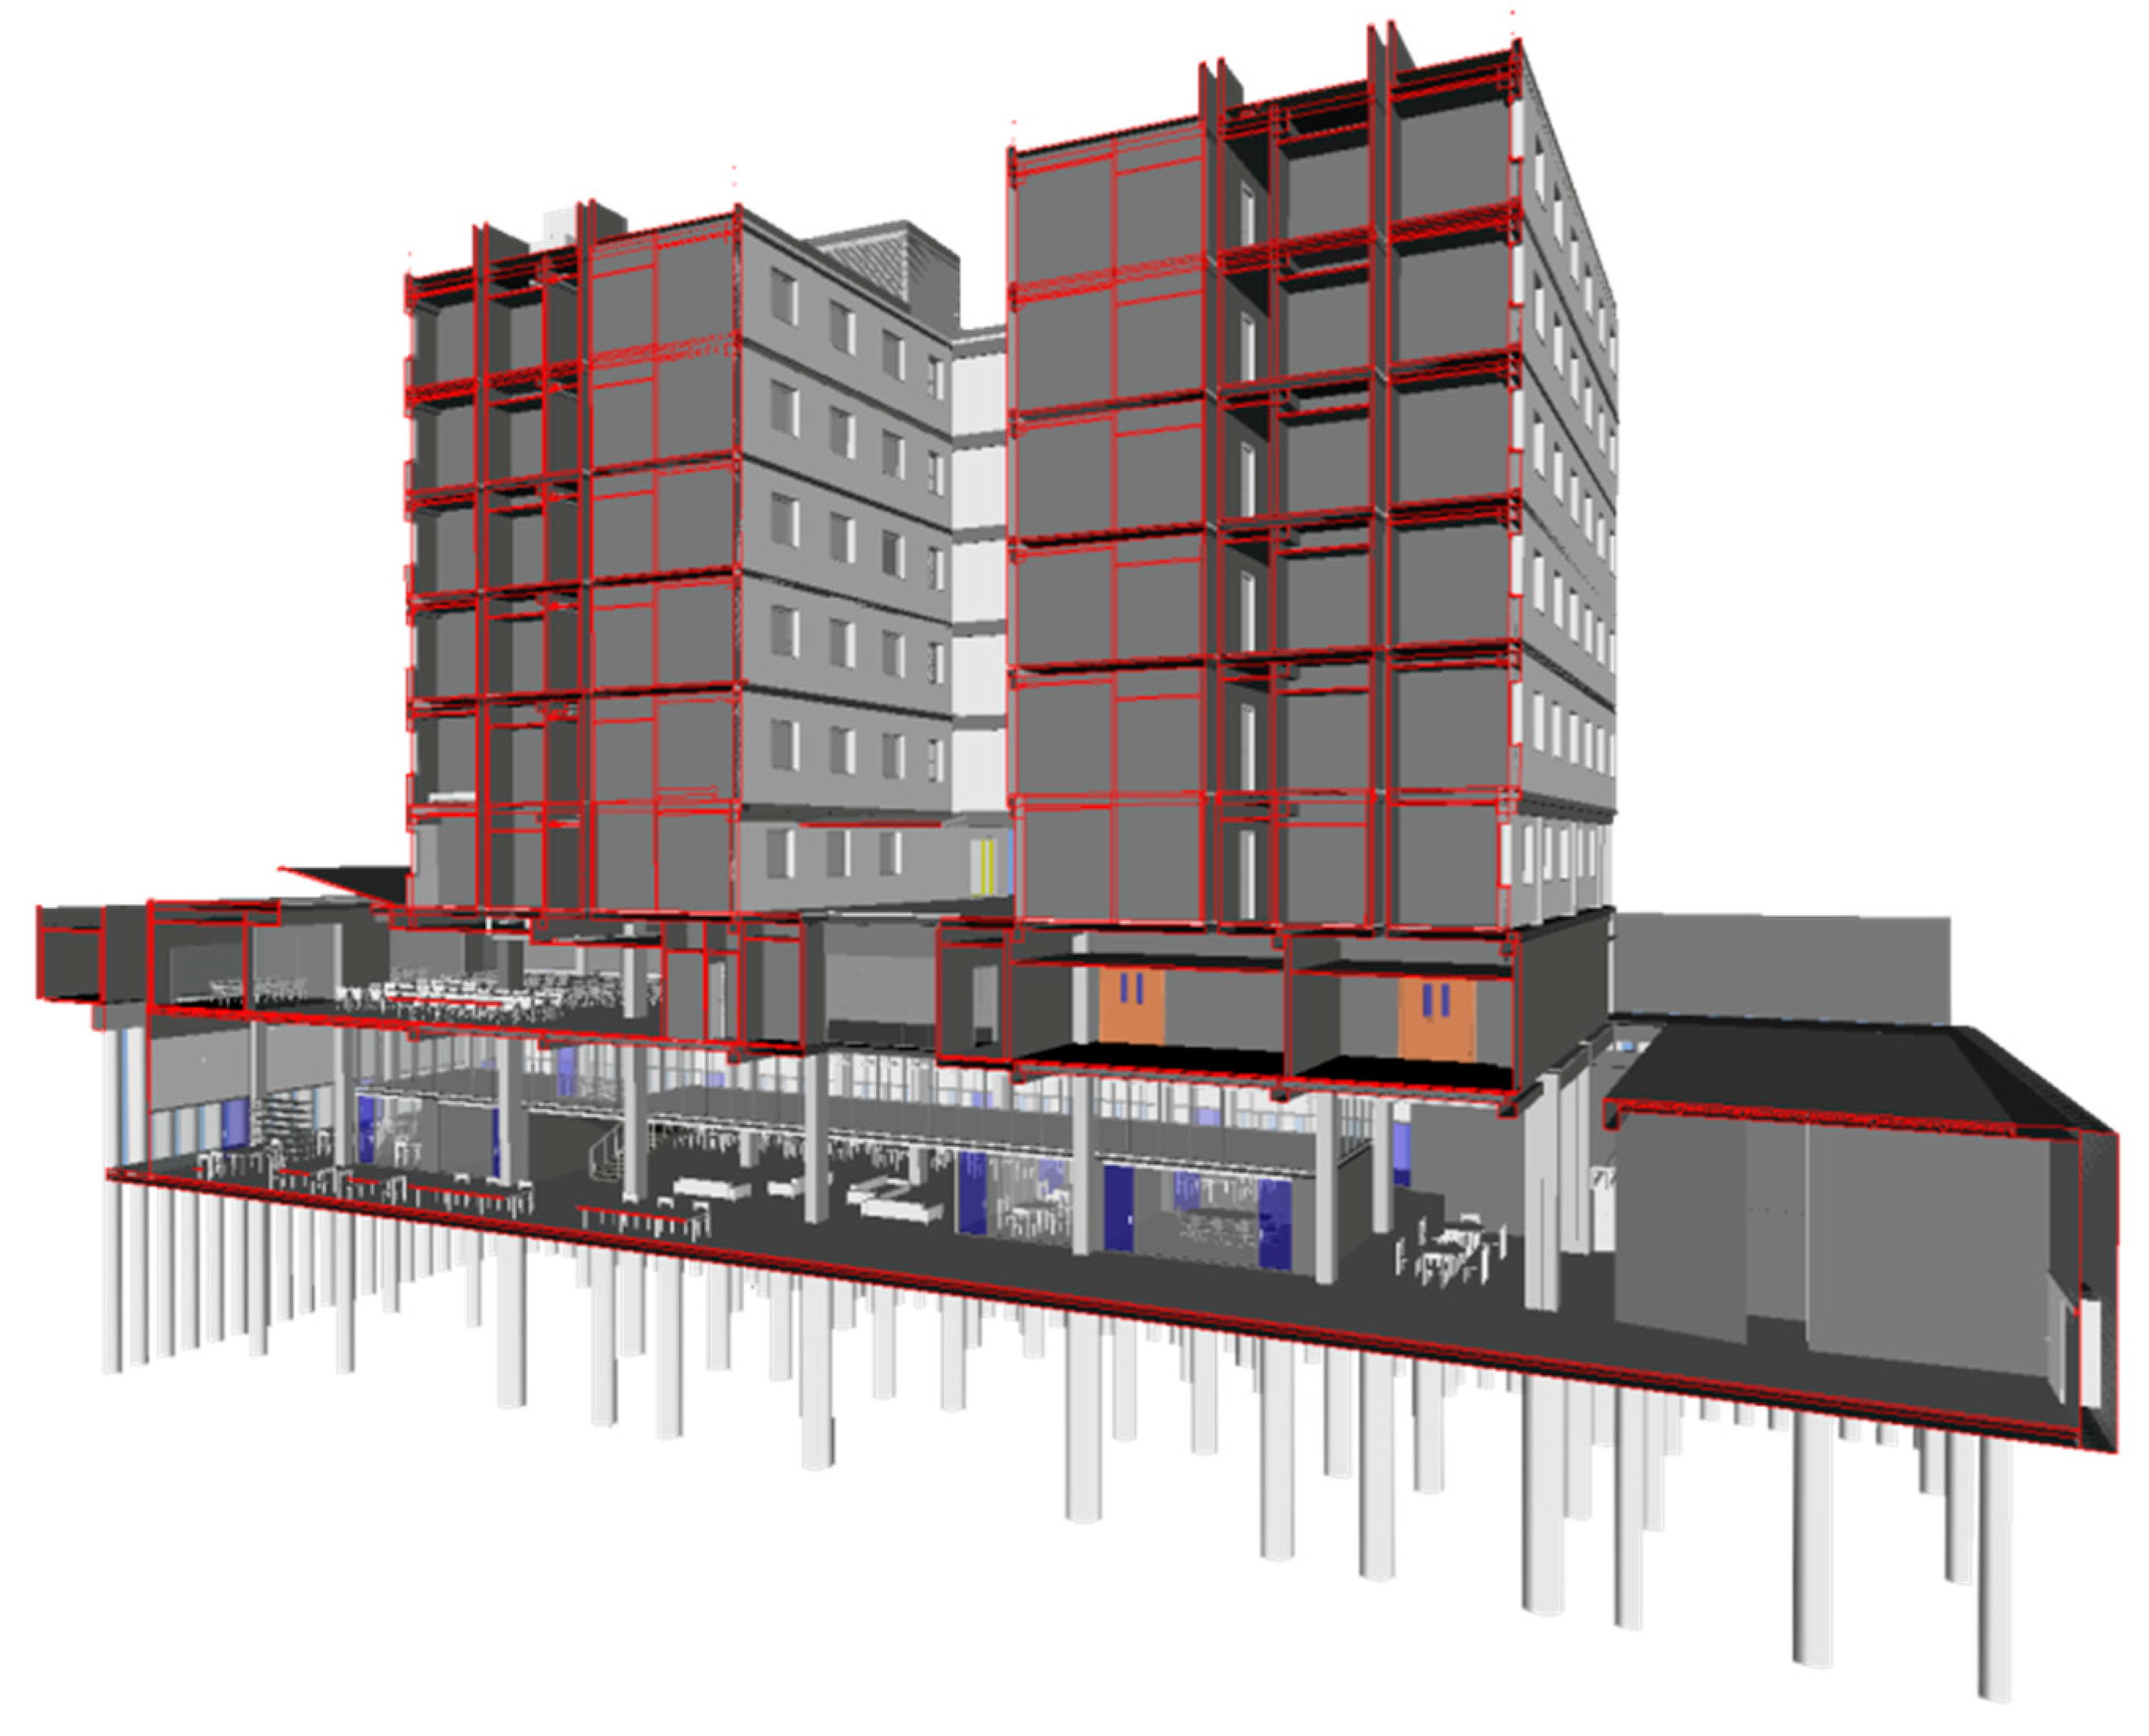
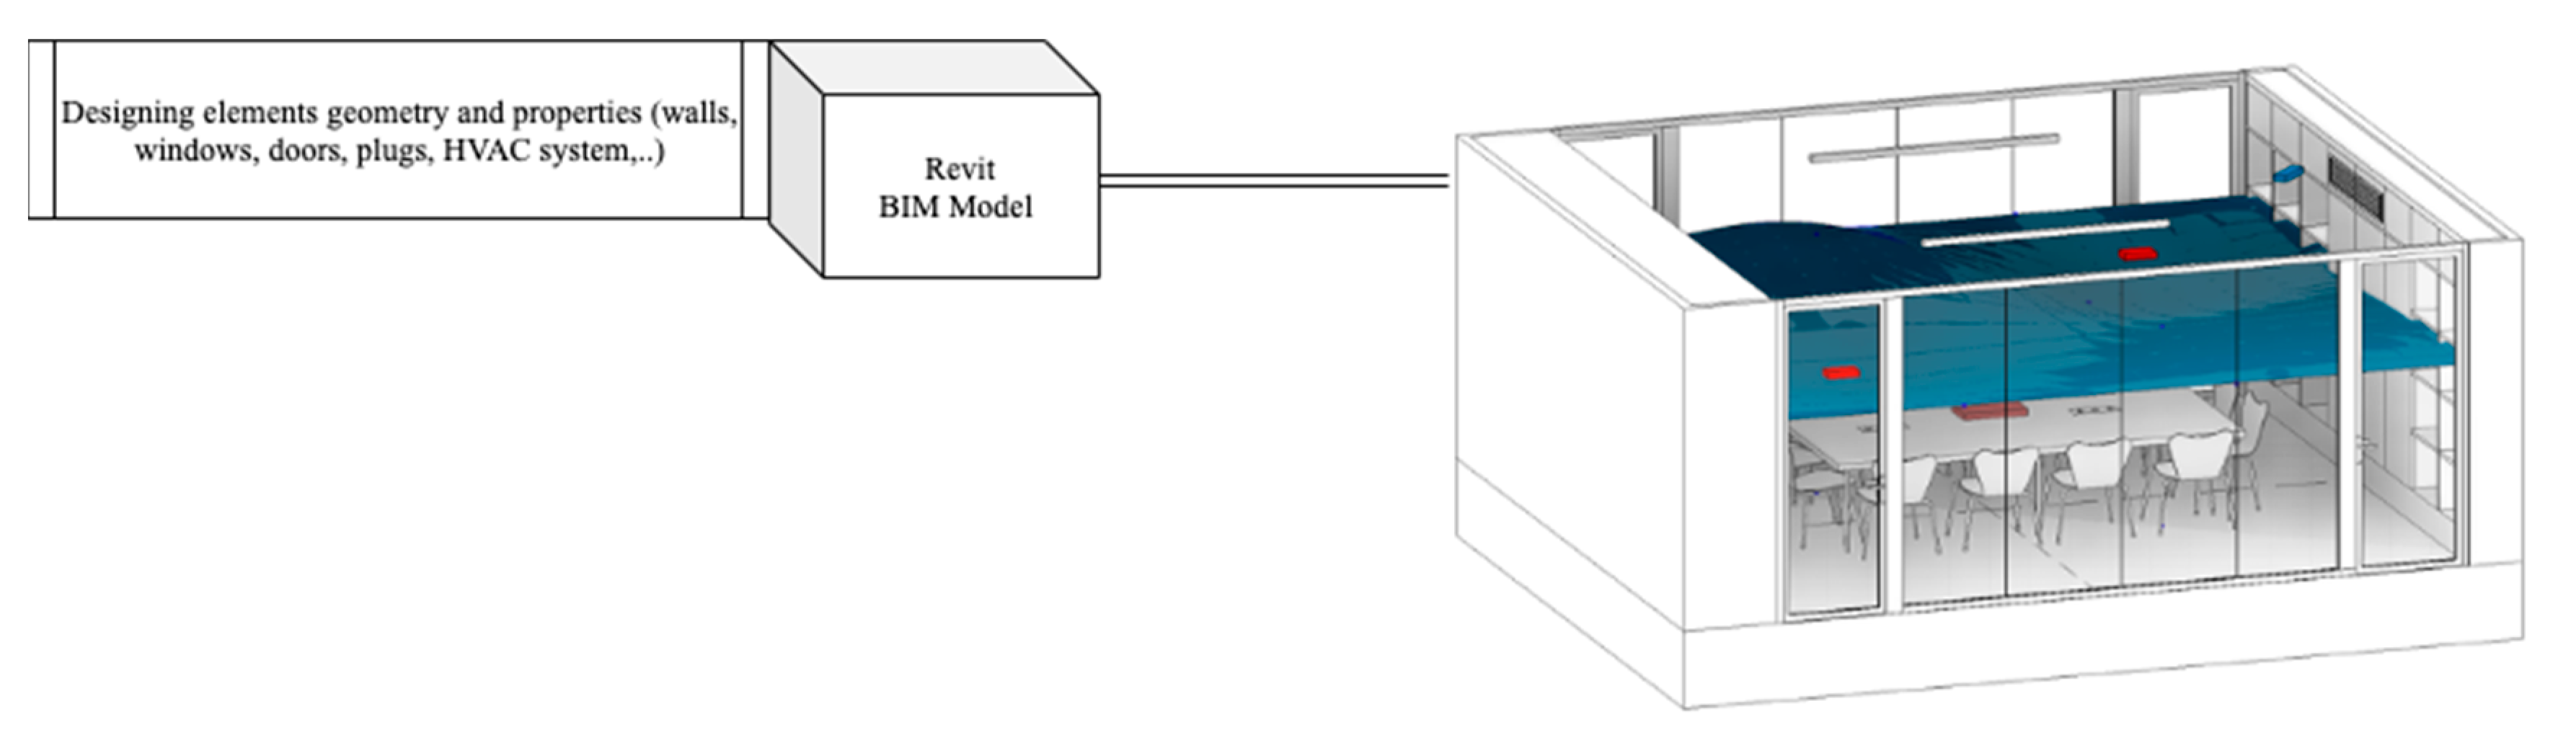
  • BIM or building information modeling is a process, not an application, to create and manage information on a construction project across the project’s lifecycle. It refers to a virtual model that contains a data-rich, object-oriented, intelligent and parametric digital representation of facilities [99], coinciding with the main benefits over conventional 3D computer-aided design (CAD) [100]. Thus, BIM enables those who interact with the building to predict performance appearance and cost, resulting in a greater whole life value for the asset.
  • Revit is a modeling software to simulate, visualize, and collaborate in order to capitalize on the advantages of the interconnected data within a BIM model [98]. When one piece of datum changes in one view, it is updated in all other views automatically by Revit because each view is displaying the same data.
  • Dynamo Revit is a graphical programming interface that enables the customization of the building information workflow [98]. Dynamo is an open-source visual programming platform for designers and has been installed as part of Revit since 2020, and hence it allows designers to set up automated computing processes or platforms in order to correlate processed data to structural and geometric models.
Lately, the challenge of bringing environmental monitoring of energy efficiency in buildings to BIM modeling has been discussed and designed by many researchers [47,48,49,100,101]. Consequently, the integration of IoT into BIM can be considered a fusion between physical things and virtual models—the information acquired from objects in the environment joined with information that resides in digital models of buildings. Once this fusion of information is achieved, many fields, such as facility management, assets management, environmental monitoring, energy efficiency, and the maintenance or visualization of components, among other applications, will experience potential benefits (see Figure 11).

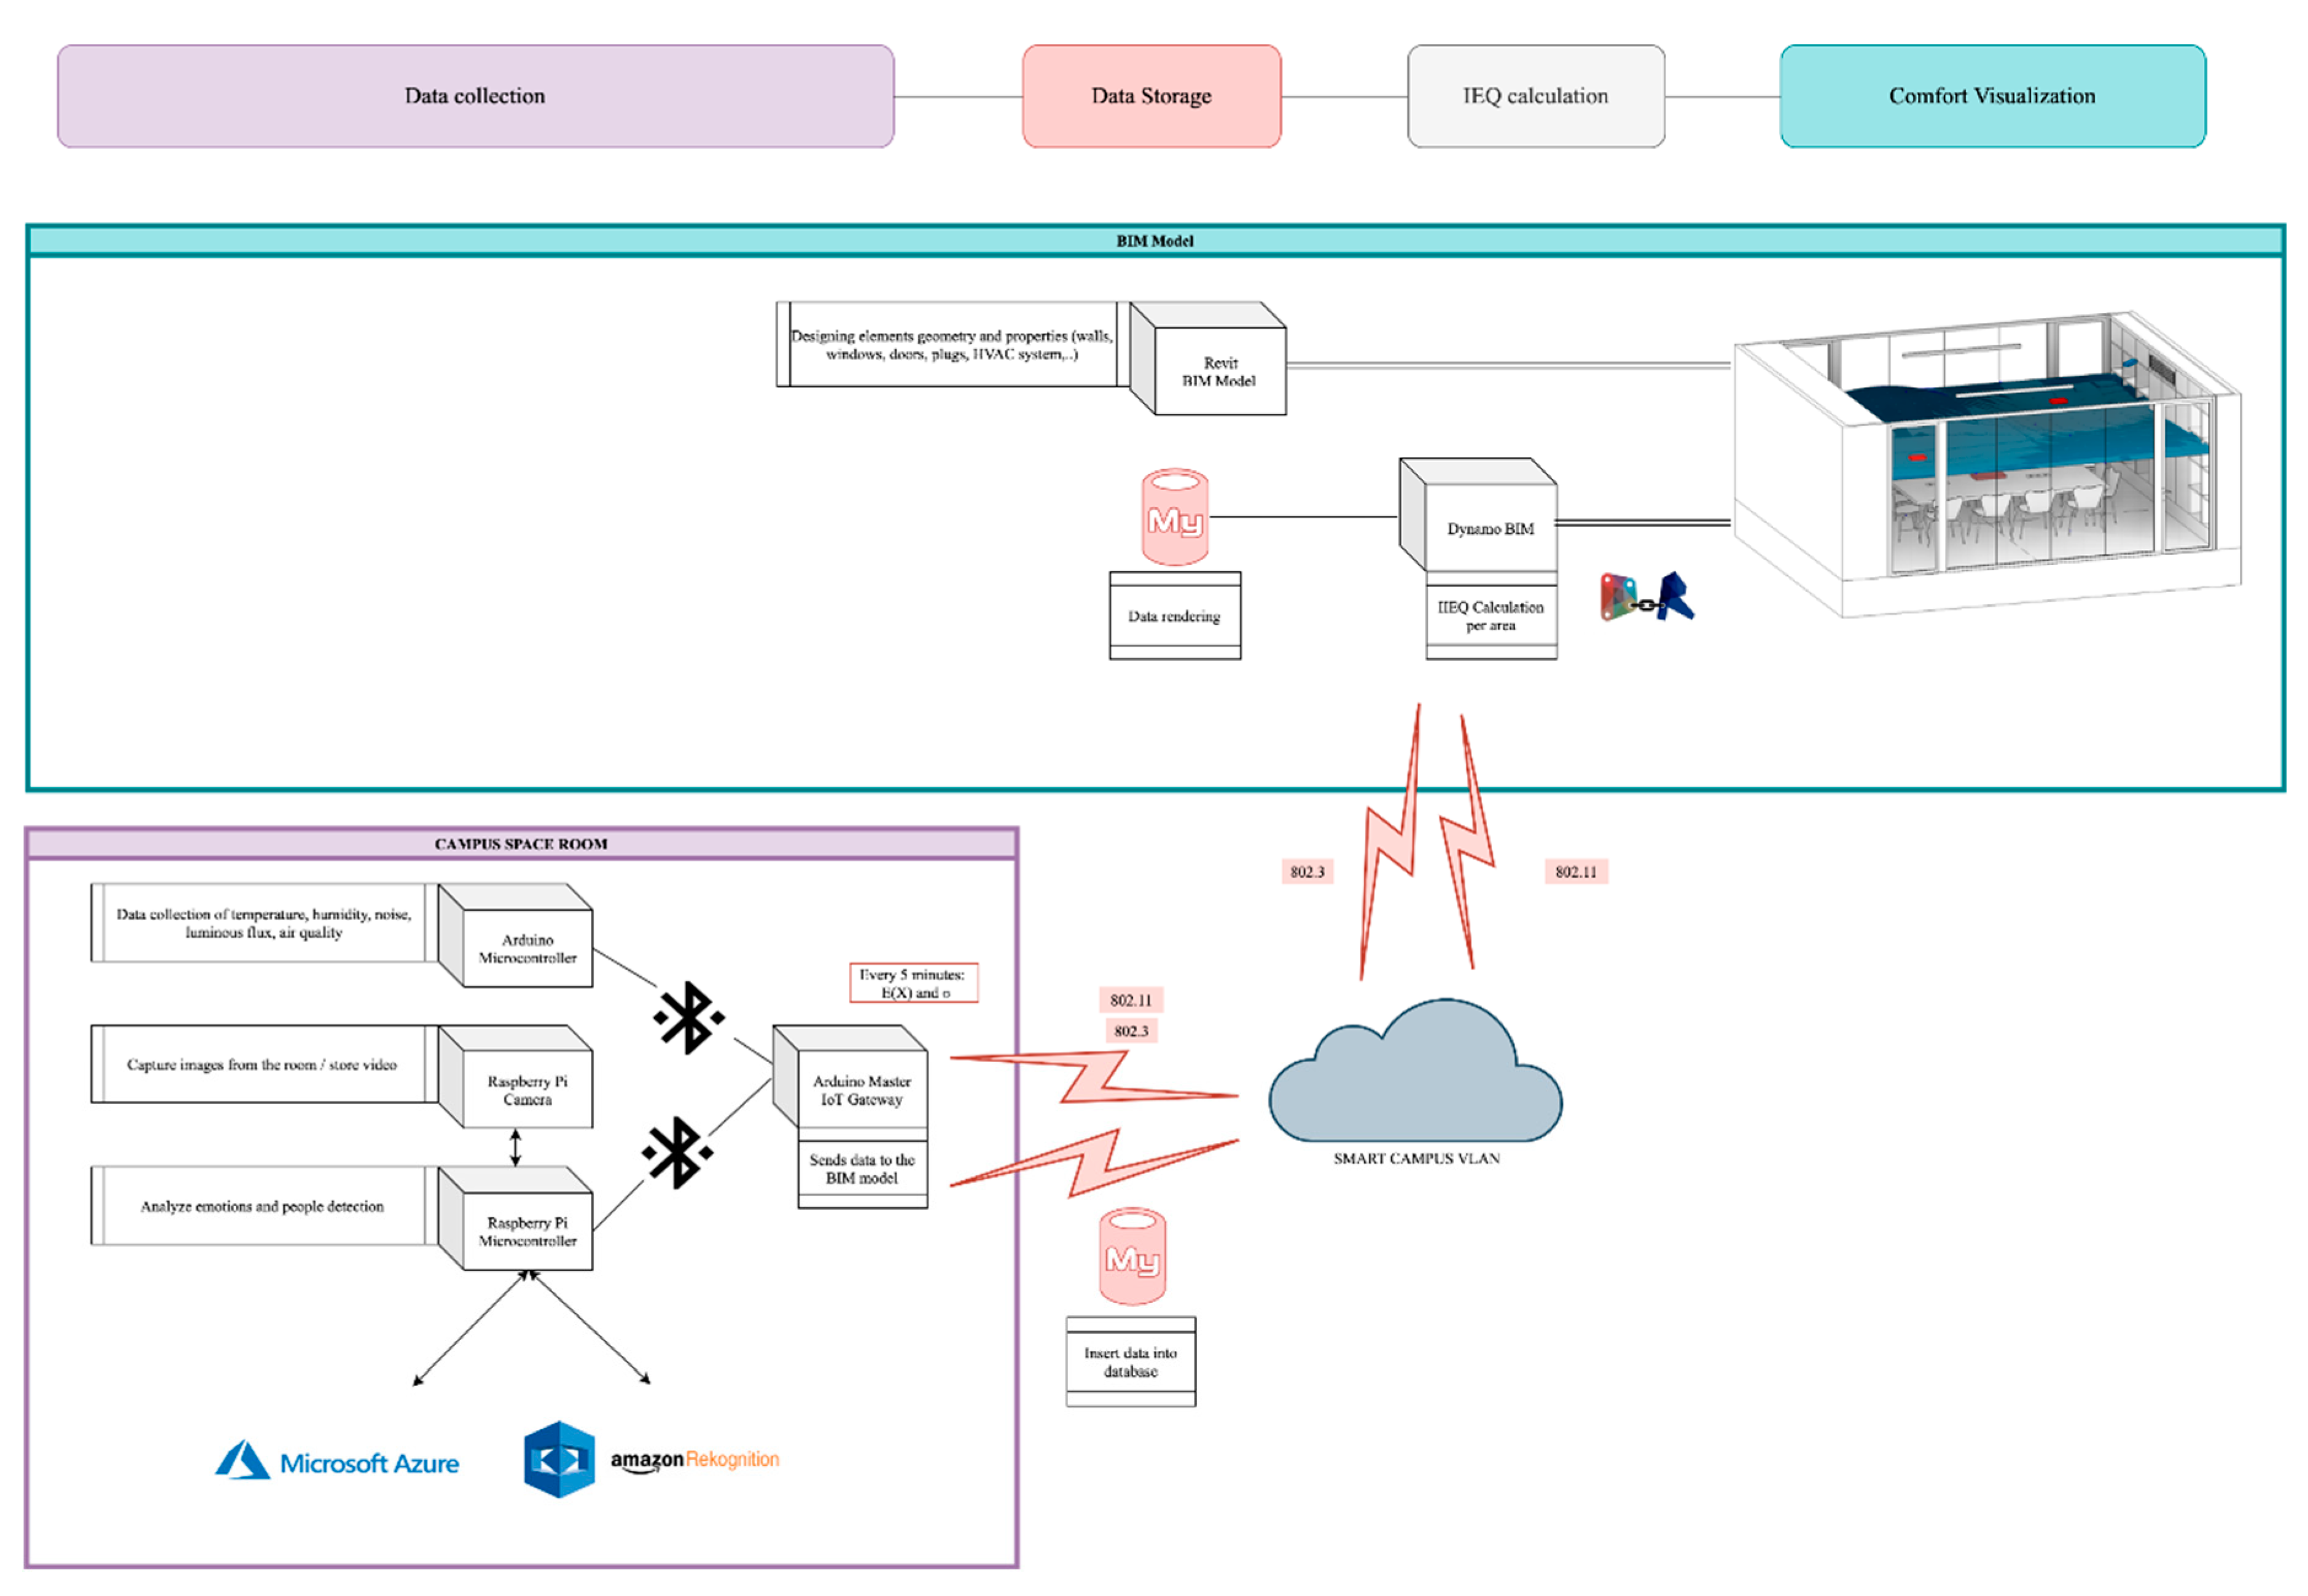
3.2. High-Level Design For The Sensing Level

The proposed monitoring system is divided into four main sections. They are necessary to model the behavior of the campus digital twin and make suitable recommendations to the management of the facility. This will allow us to infer the level of smartness [97] by taking into account the energy efficiency issues (see Figure 12):

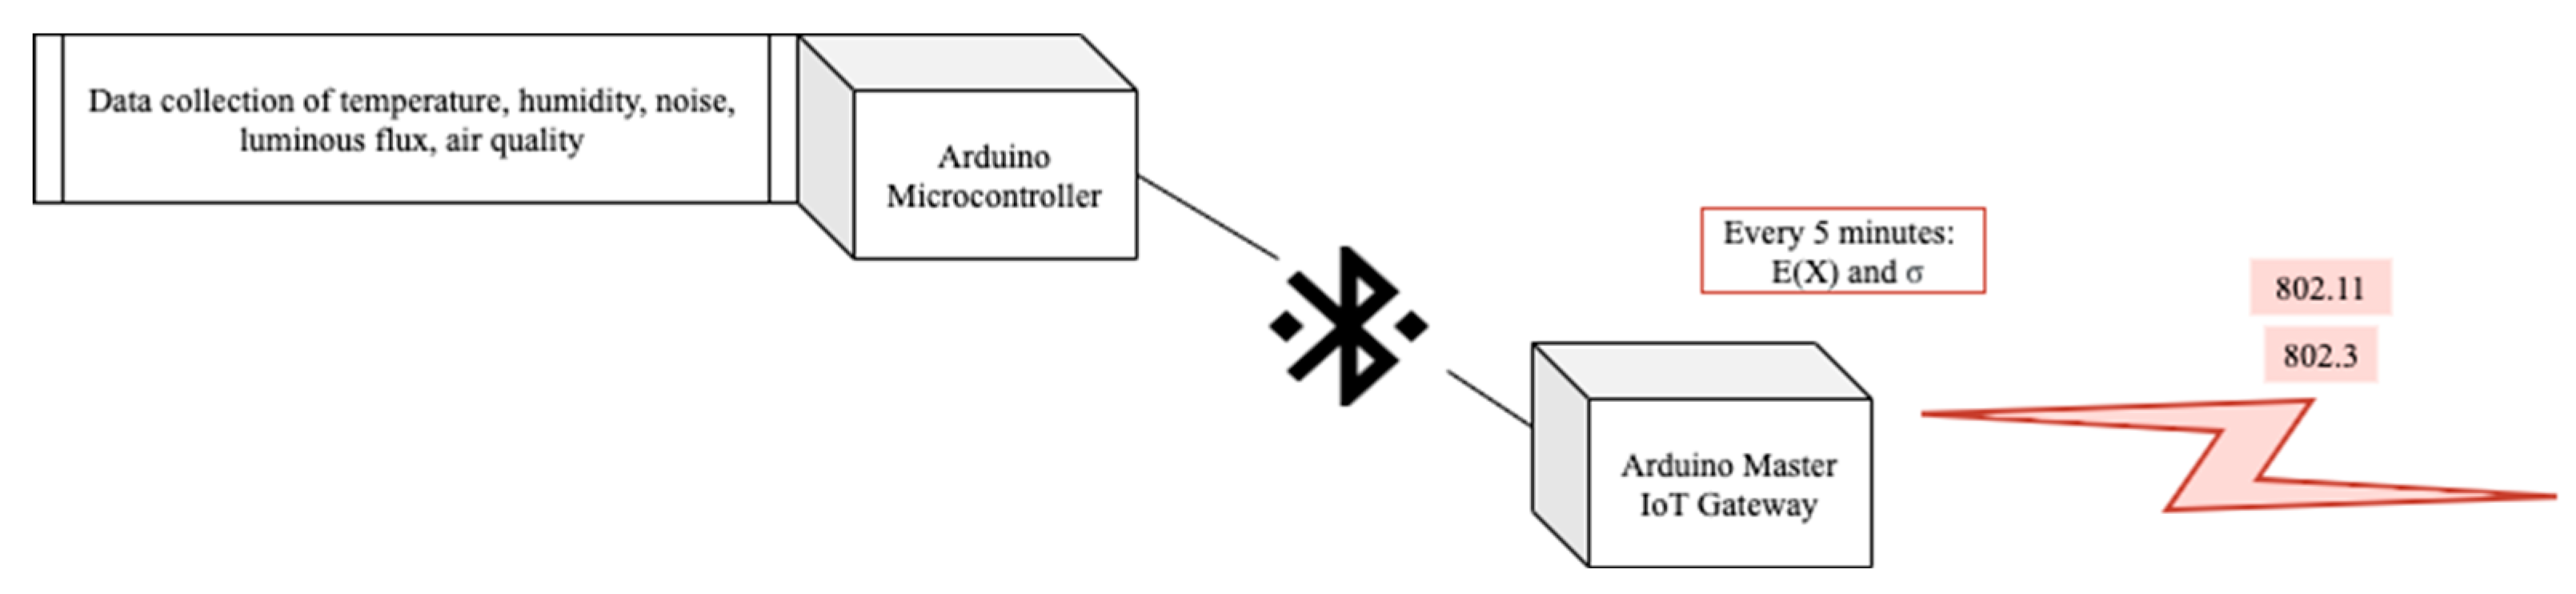
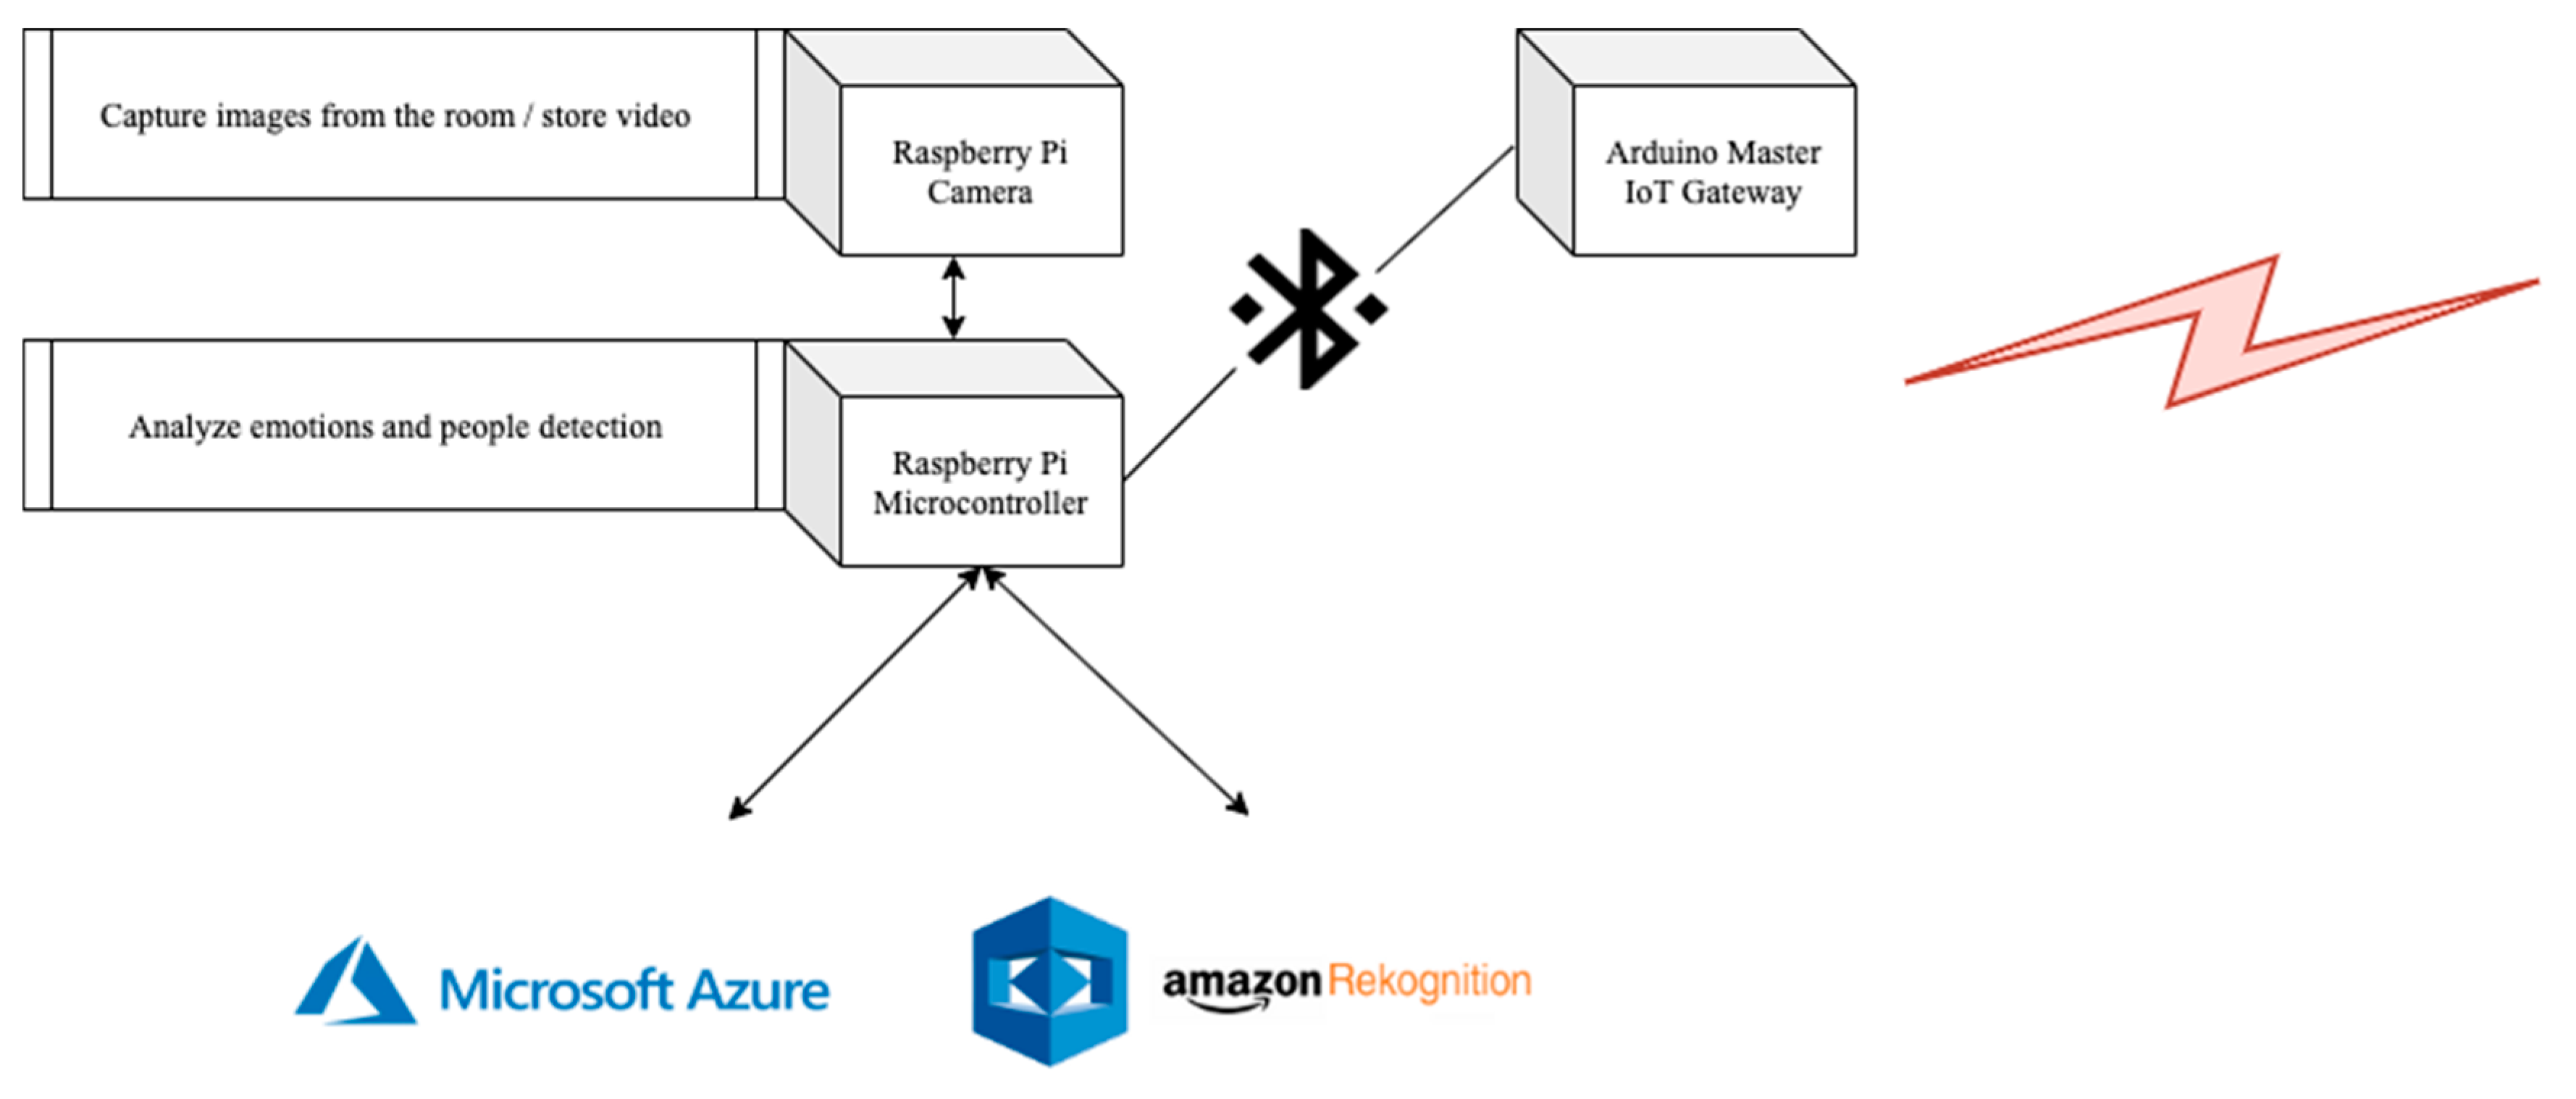
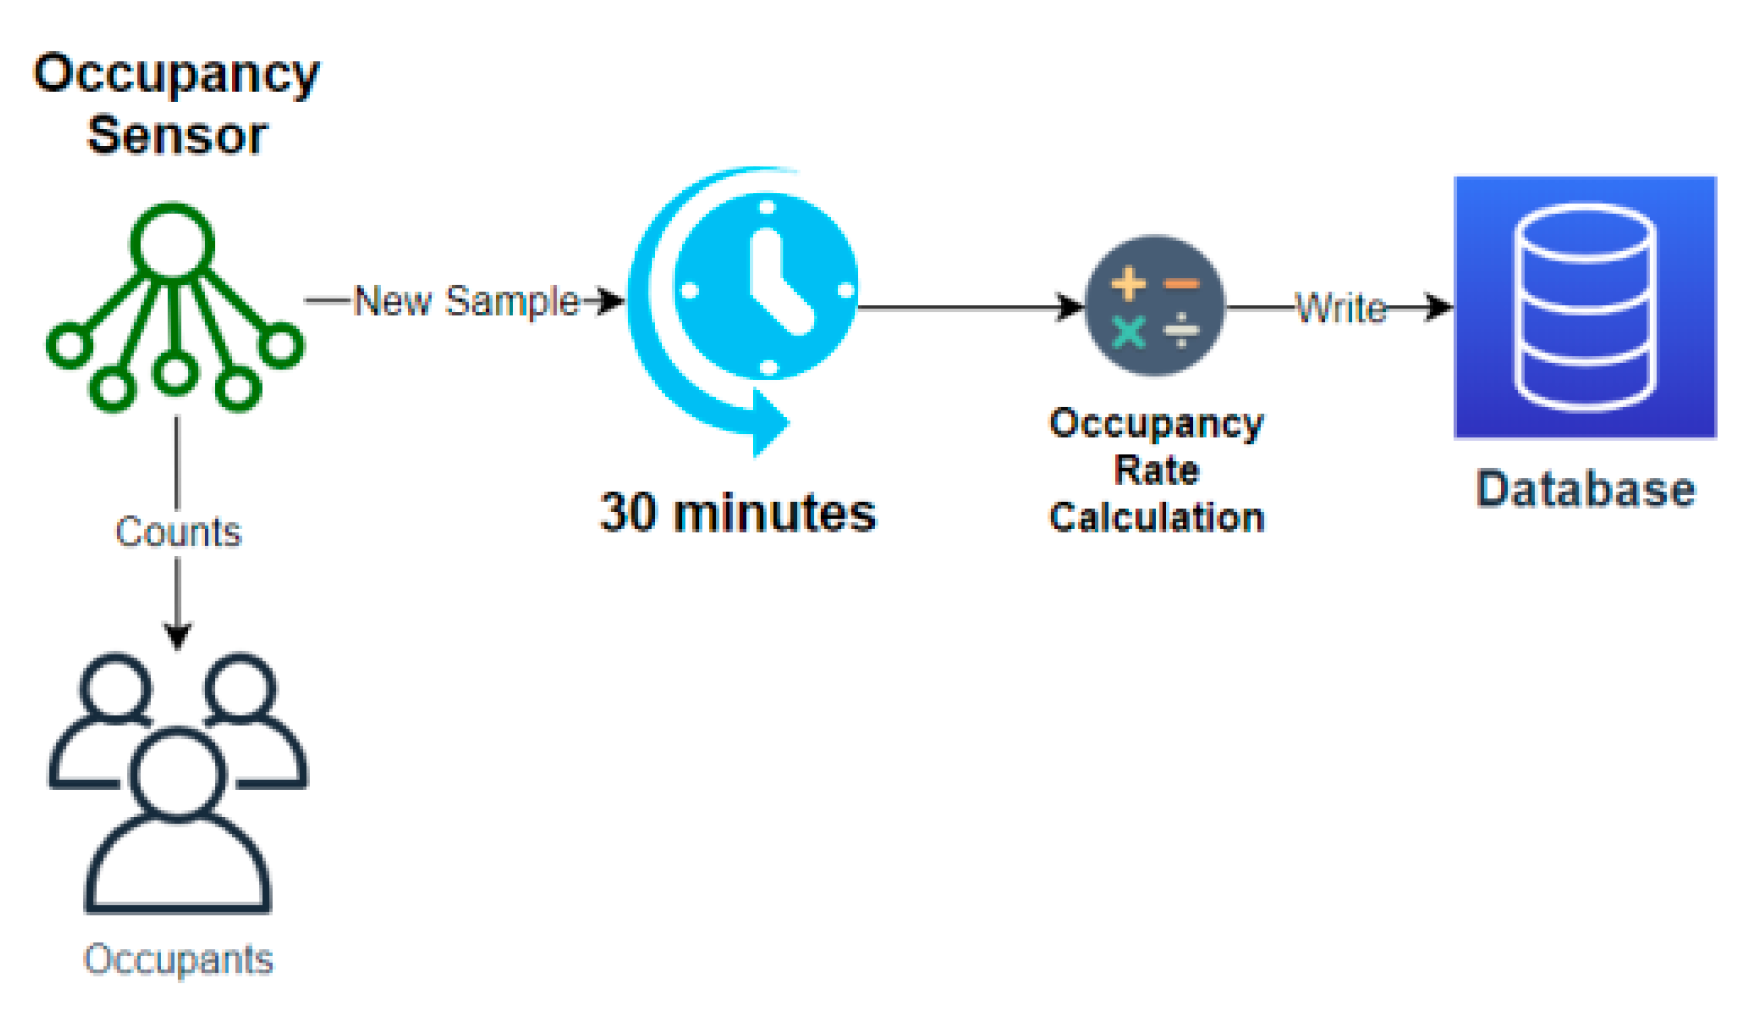
3.2.1. Data Collection
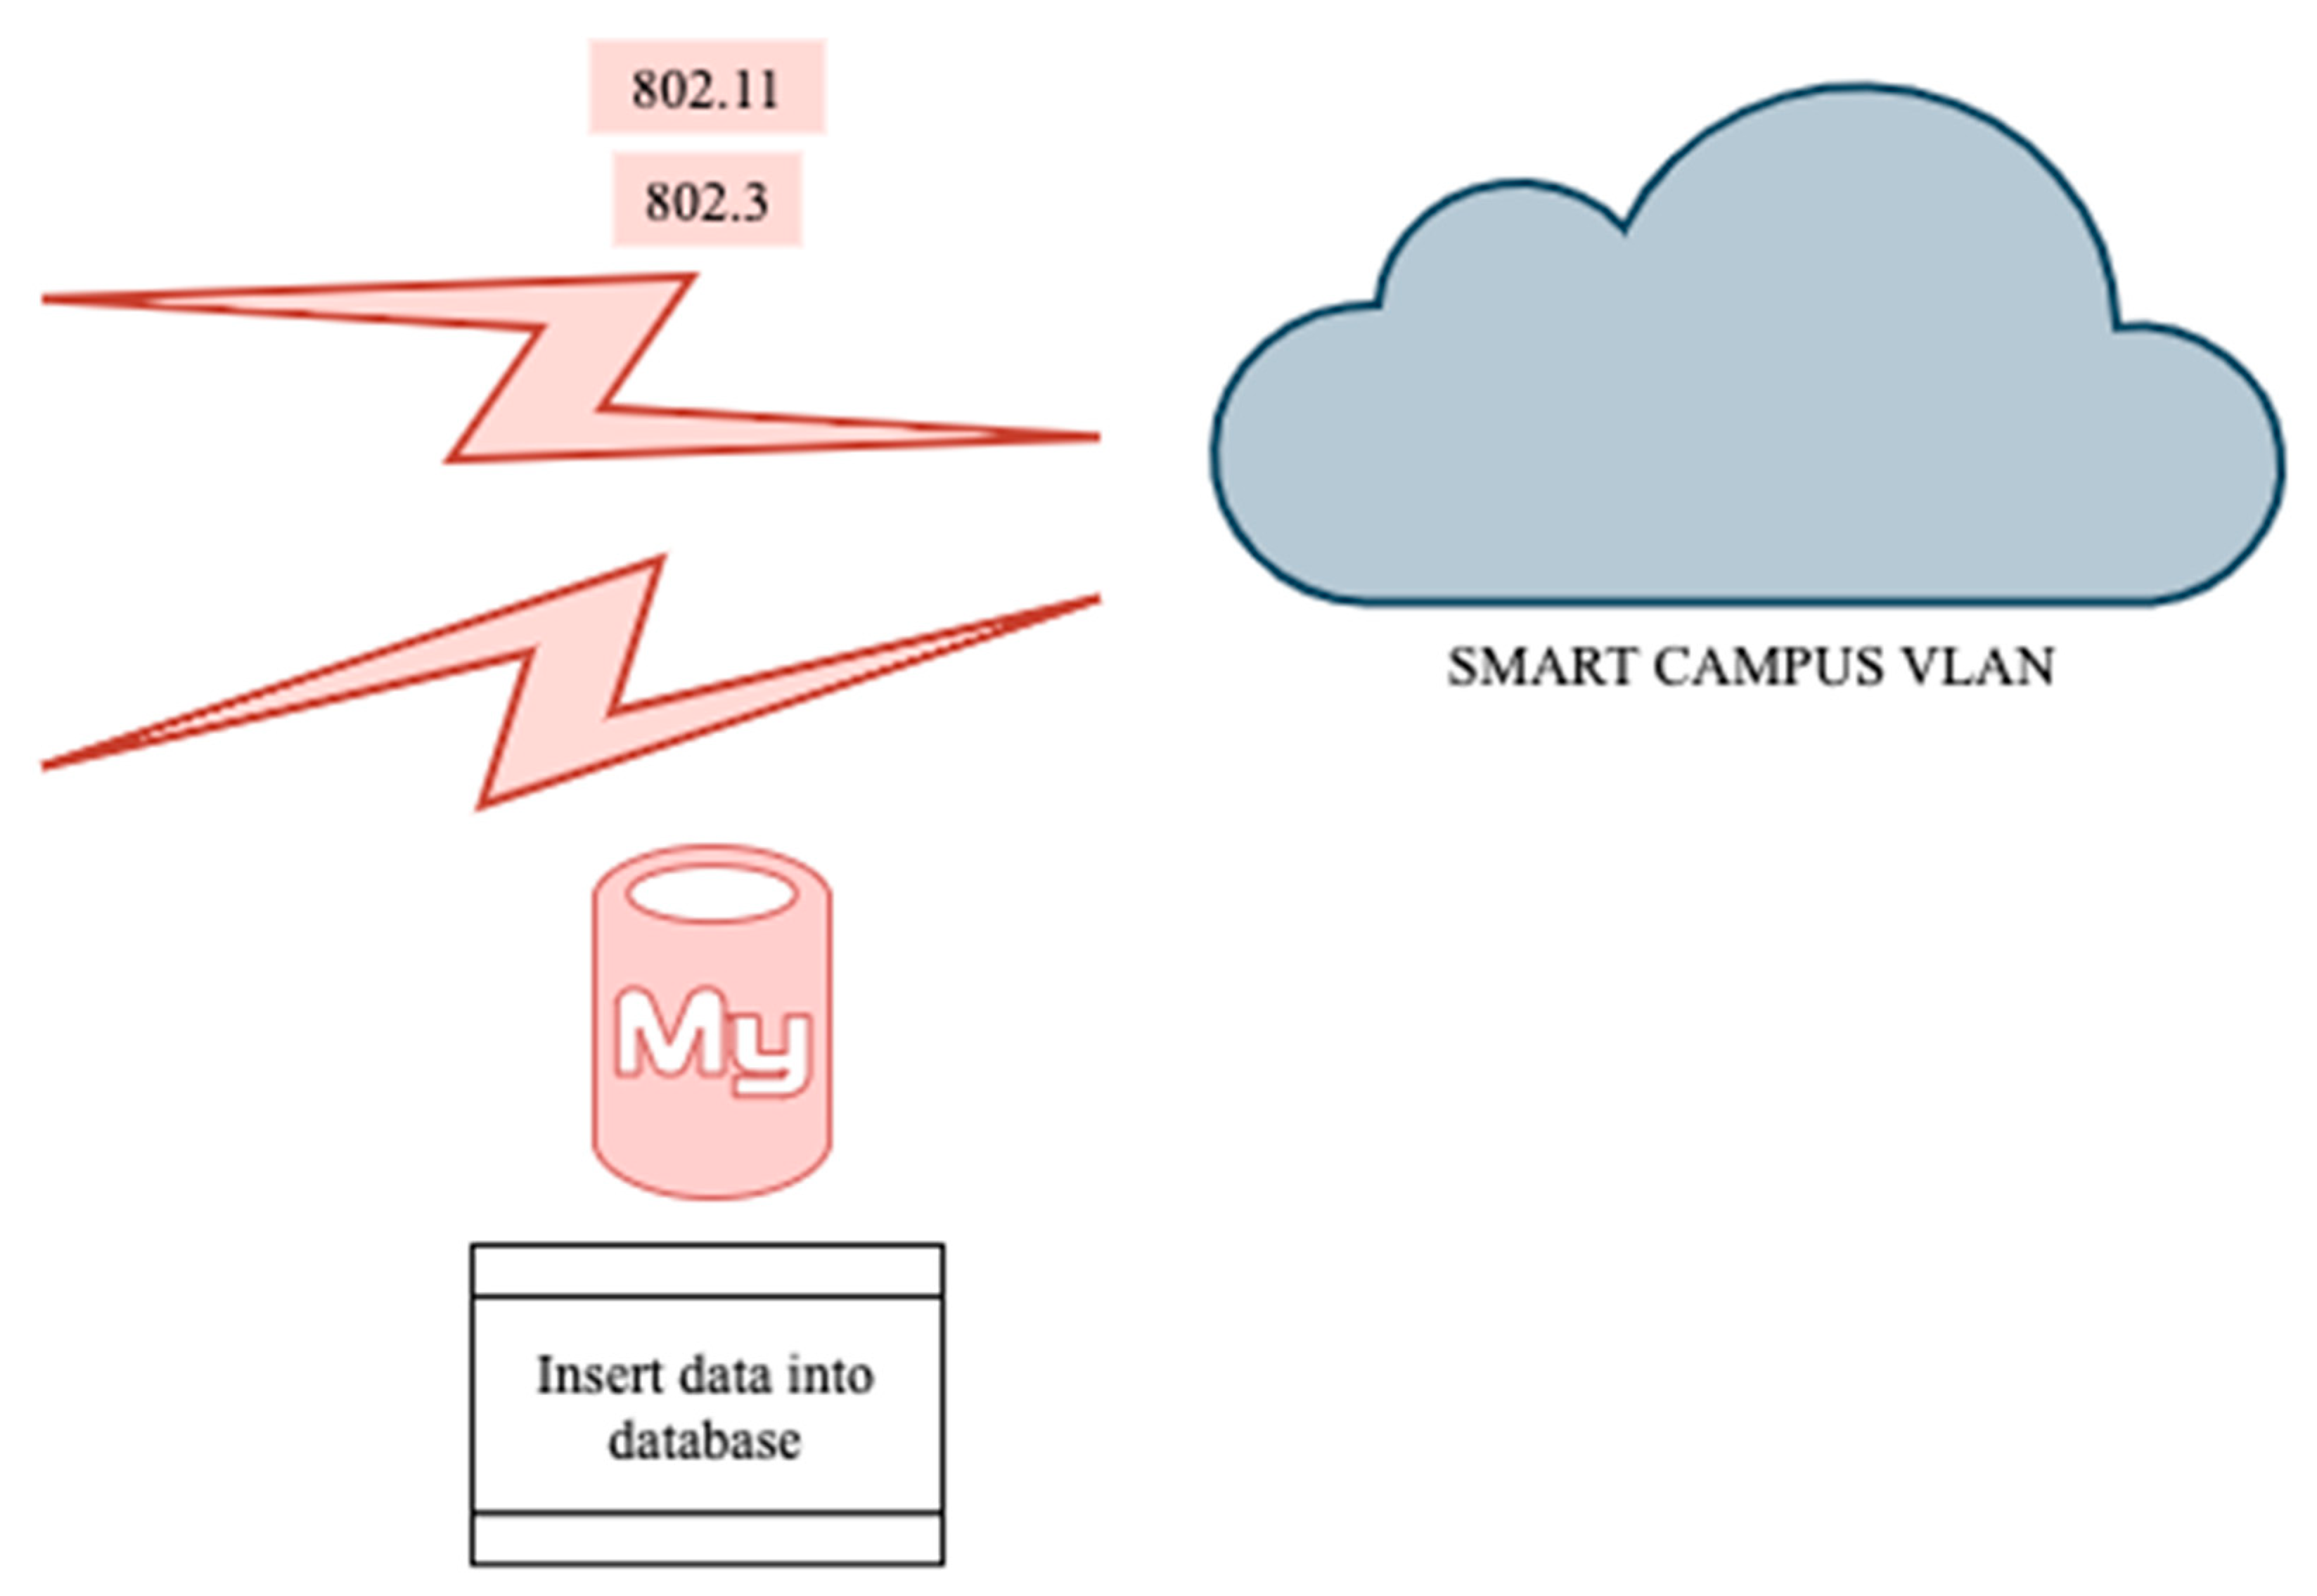
The environmental monitoring data are measured with sensors embedded in Arduino UNO microcontroller boards with a sampling frequency of 30 s for each node (revisit Table 3). The data collected in the nodes from every sensor are sent to an Arduino MEGA 2560 board, which corresponds to the master node (Figure 13). The latter is in charge of collecting the nodes data and calculate the mean (E(X)) and the standard deviation (σ(X)) of each metric. Once 10 metrics are collected (5 min), the master node then sends an HTTP POST (Hypertext Transfer Protocol) request to the database middleware by sending out the metrics E(X) and σ(X).
The occupants’ emotions are validated by an intelligent emotion detection algorithm in charge of implementing a double check to detect IEQ inconsistencies with the modeled reality. The emotion detection system consists of capturing the faces of the occupants with a camera lens assembled in a Raspberry Pi 3b+ and subsequently sending the obtained frame to the “Microsoft Cognitive Services Face API” service for a simple emotion recognition response or continuous video recording to “Amazon AWS Rekognition” for a full pattern analysis at the end of the session. The results, containing the detected emotion for each recognized occupant, are sent to the master node, which in turn will aggregate the data with the environmental data and dispatch them to the implemented middleware (Figure 14).

3.2.2. Data Storage

The designed middleware encompasses customized Hypertext Preprocessor files (PHP) that permit inserting new data records into a MySQL relational database in order to store the structured environmental monitoring and emotion recognition data (Figure 15).
If you look at Figure 11 and Figure 12 more closely, you will notice that the update of the real-time sensed data is performed from the IoT deployed physical infrastructure to the Revit model through the Dynamo interface. Thus, the digital twin of the smart campus is updated by accessing real-time stored data in the cloud (see Figure 16).

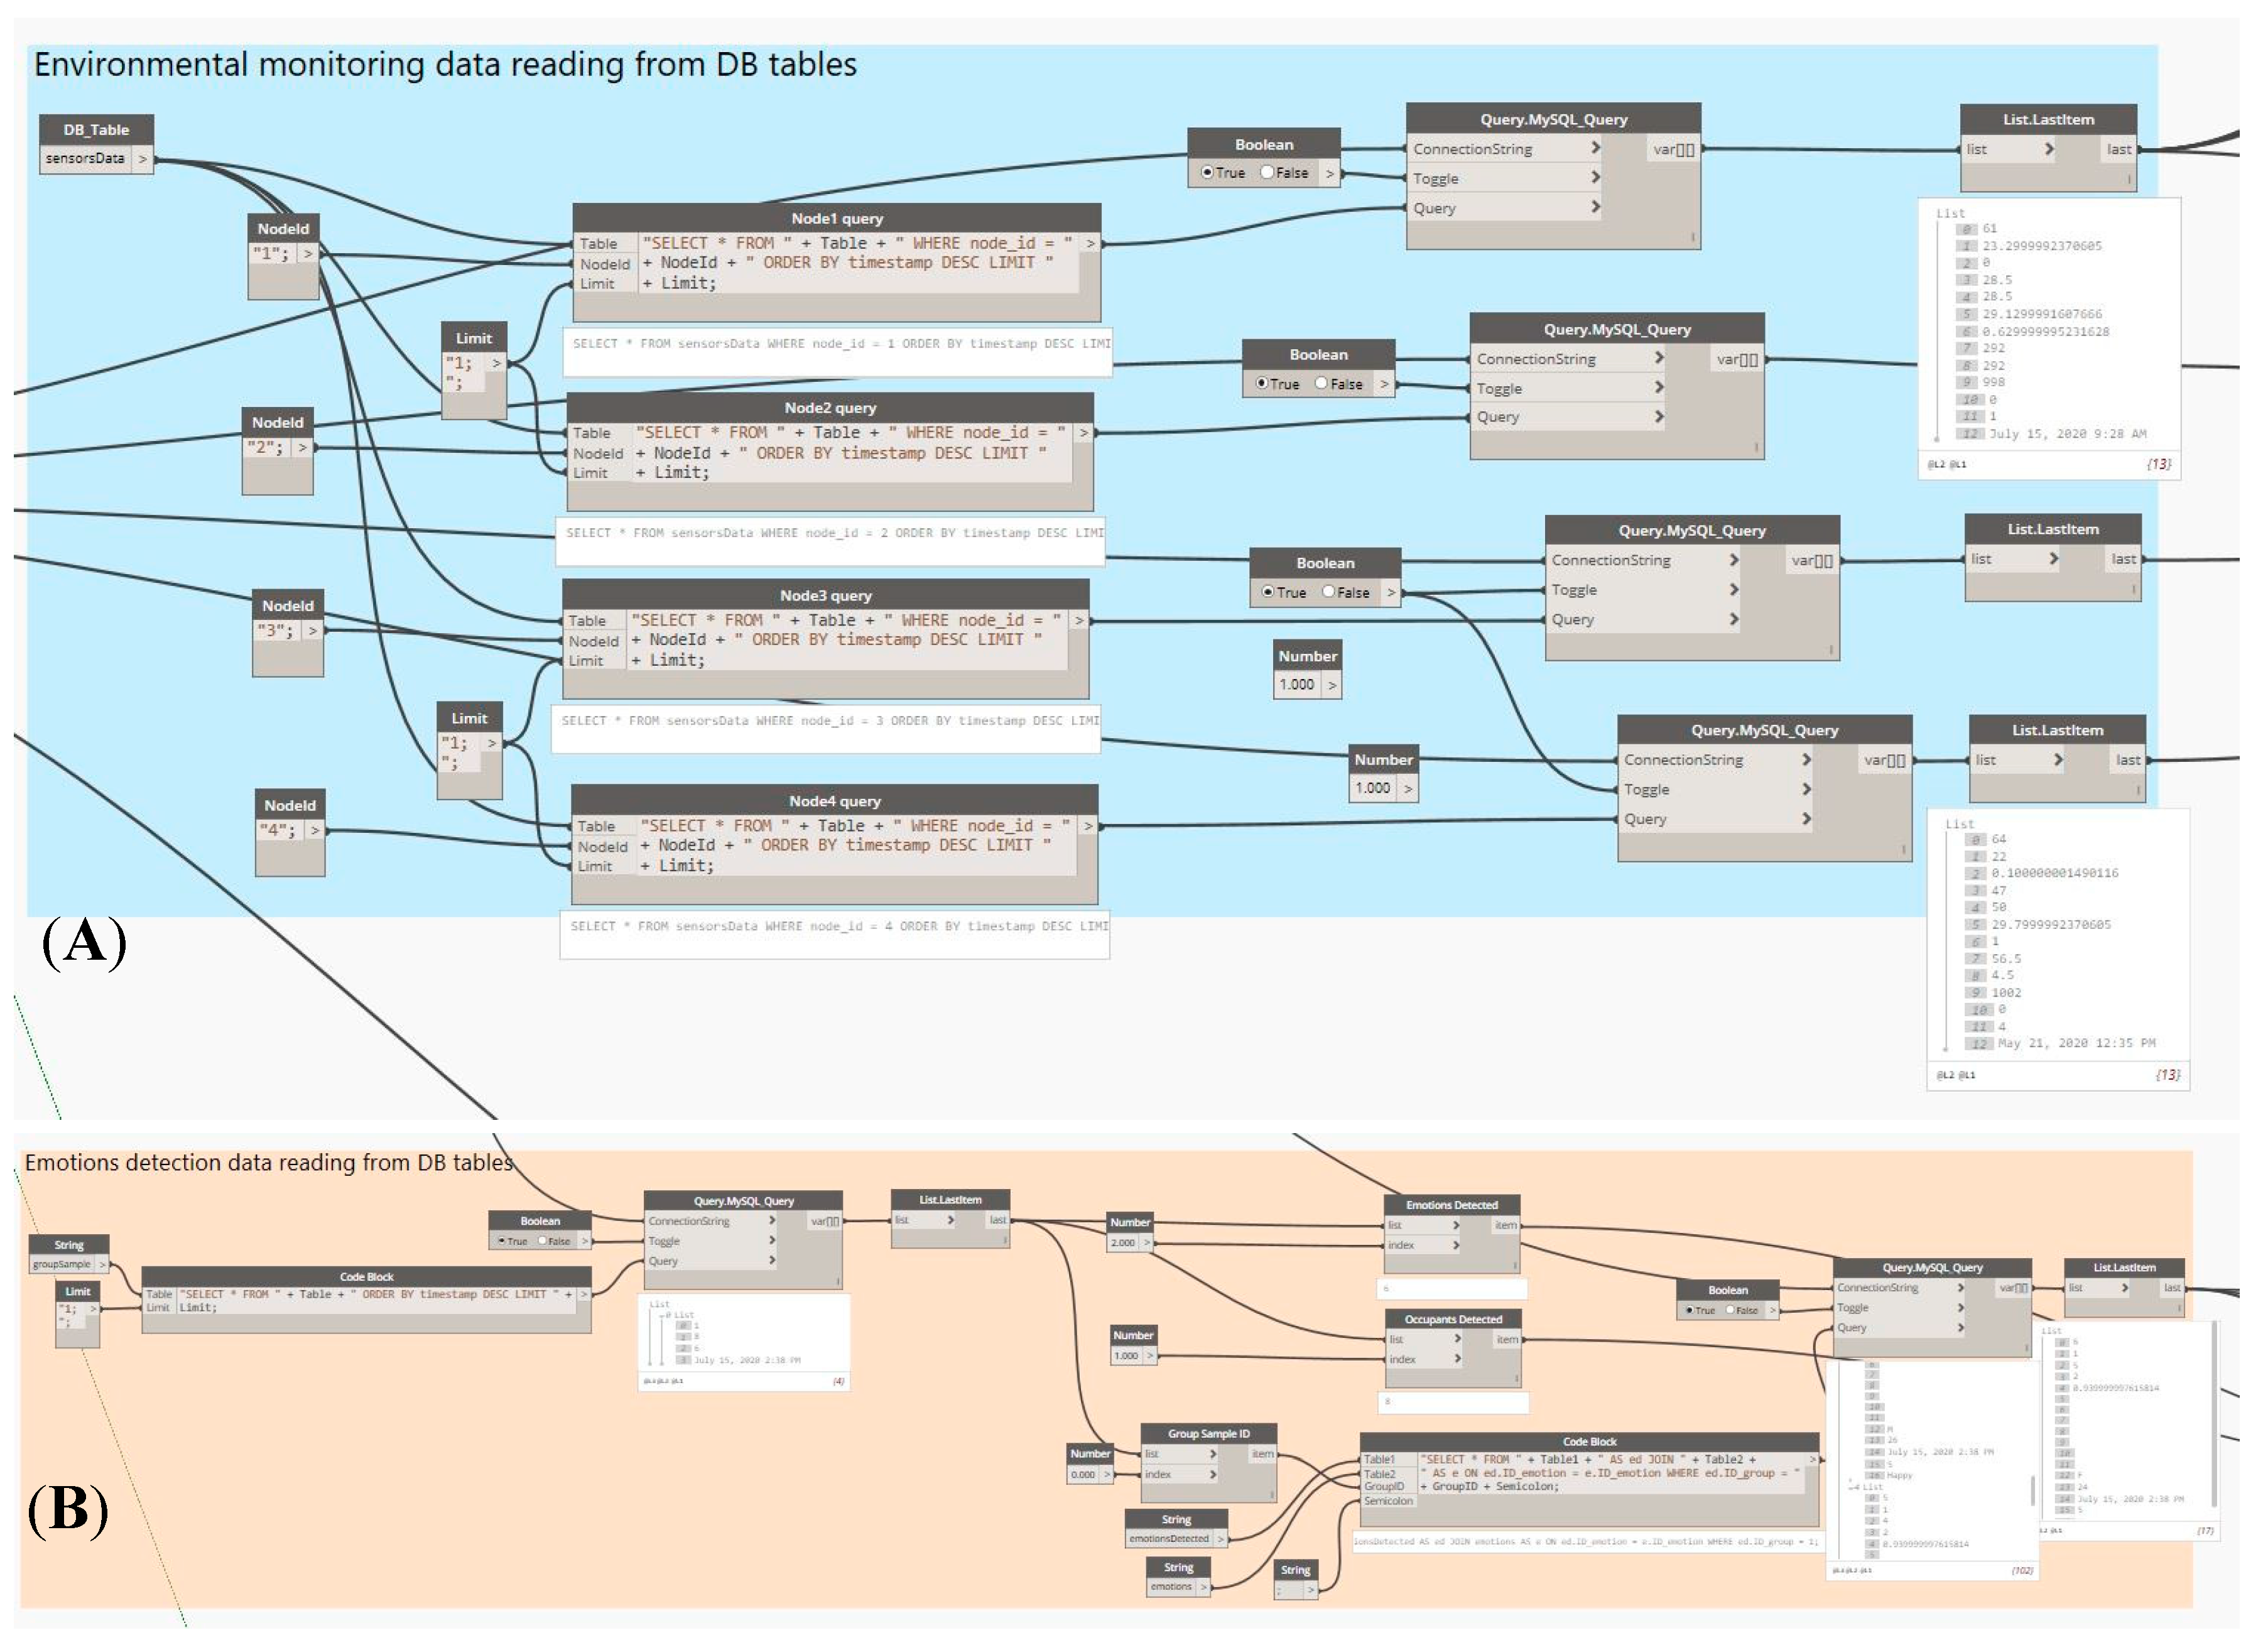
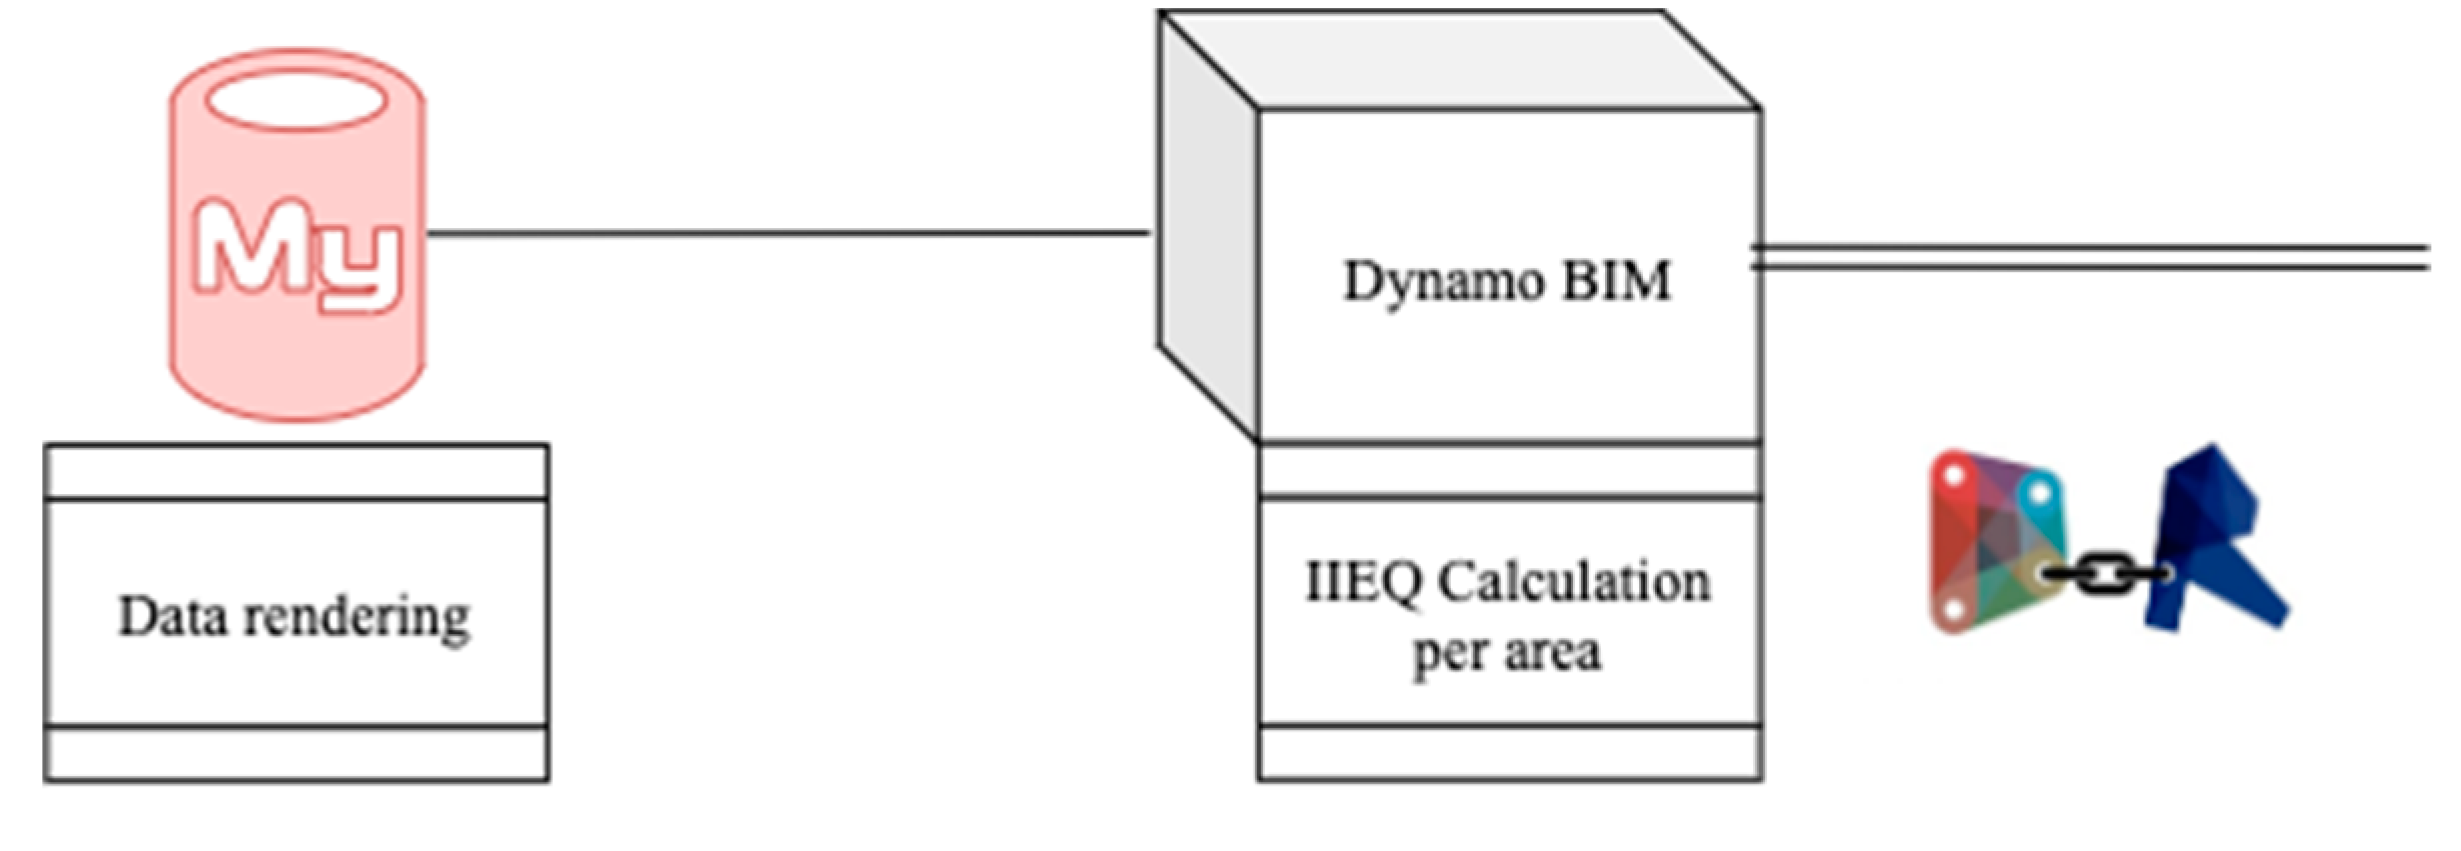
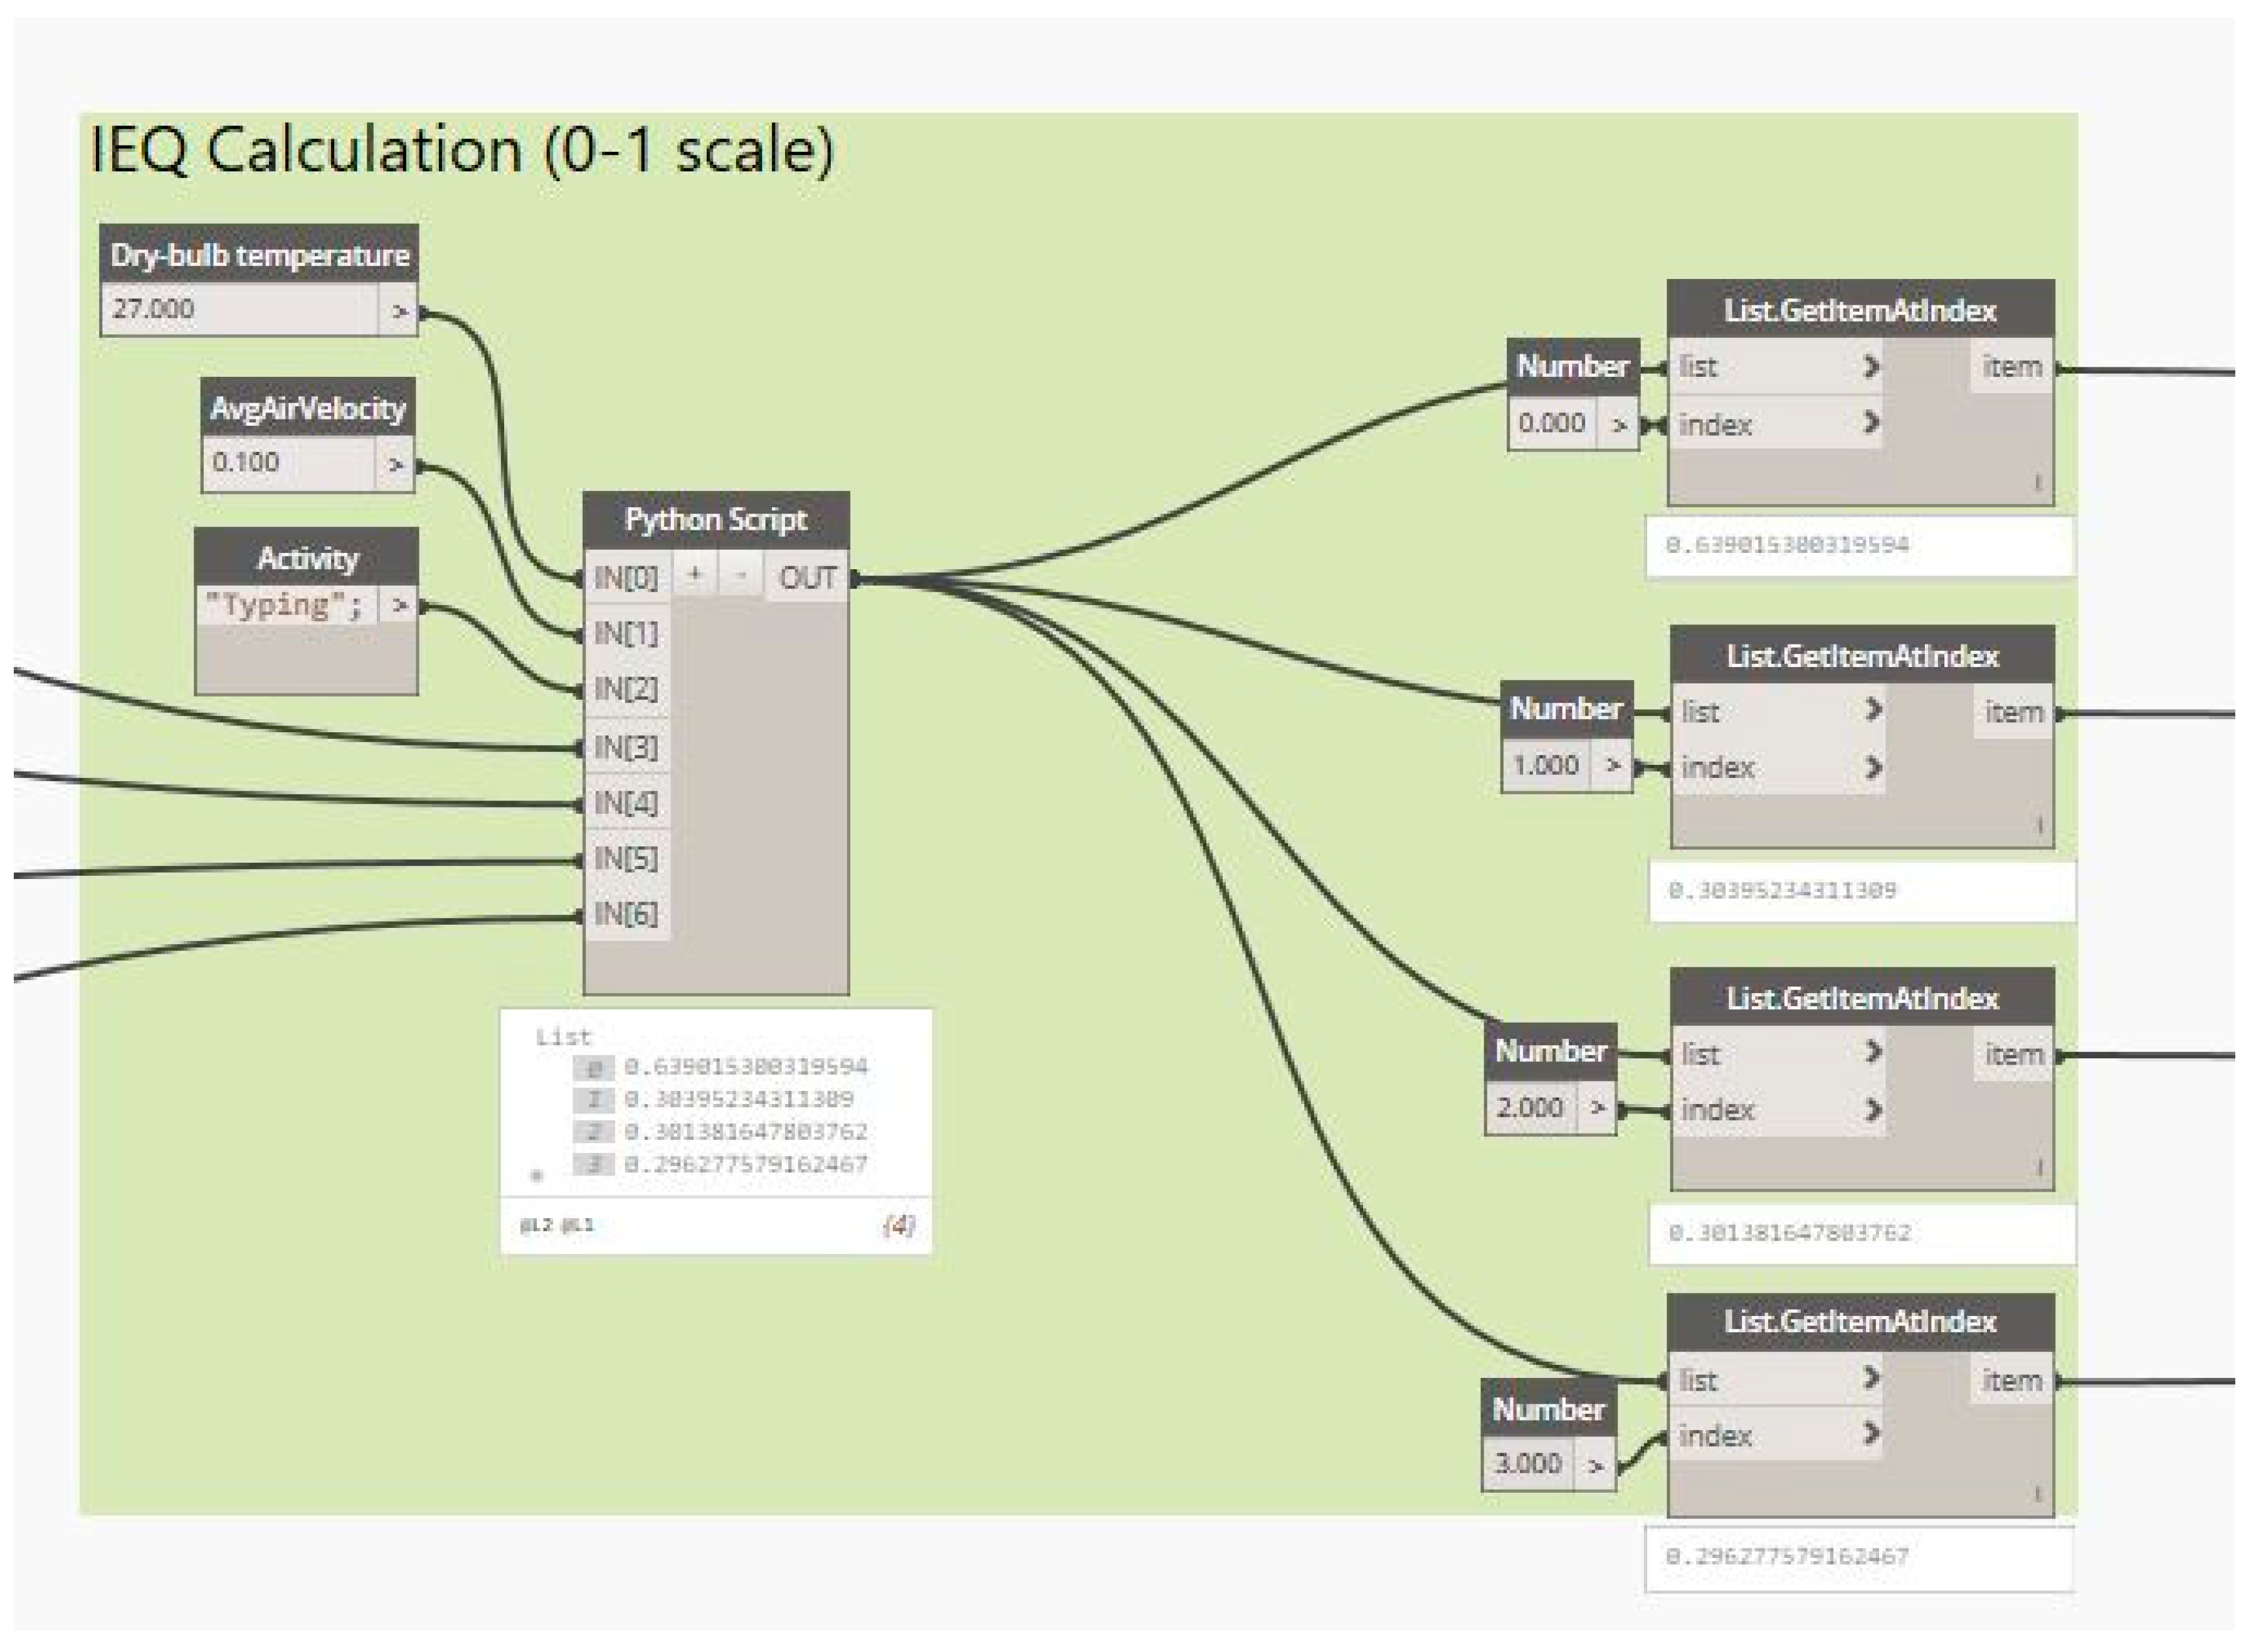
3.2.3. IEQ and Energy-Efficient Calculations

The guardians for each zone provide sensed information to the wise module, which aggregates the information for the final visualization application (i.e., the IoT middleware). Our middleware is based on the visual programming software Dynamo Revit, usually embedded in BIM systems. The wise module reads the database in real-time and calculates the IEQ index using a Python script (Figure 17). Furthermore, an interpolation is made by the guardian between all the resulting indexes of each node of the monitored zone and is subsequently rendered on a color scale.
With the geometric room parameters defined in our BIM model, sensed information is collected from the database. It is then submitted into a Python-script object (Figure 18), which calculates the IEQ index based on the ASHRAE standard and figures out the proposed weighted model stated in this paper for the real-time IEQ value.
As stated before, a zone identifies a section of a building. This zone is defined by a list of parameters such as zone ID, maximum capacity, occupancy schedules, daylight availability, occupancy and temperature samples, artificial light contribution, and a digital twin zone rating. The zone rating is a quantitative parameter that tries to rate the energy efficiency of the zone in order to compare it with others and therefore establish recommendations for the facility manager. In order to formulate recommendations, the sets of data mentioned previously will be used to build a light efficiency rating (LER) and a temperature efficiency rating (TER).
For example, a LER is used for the recommended light level interval that defines the amount of light needed inside the zone. This value is constantly calculated by the zone guardian, and the state can be one out of the three following states: (1) over, (2) under, or (3) inside the recommended light level interval (Figure 19). For this reason, the guardian calculates the occupancy rate (occupants divided by maximum occupancy) and provides the actual number of occupants of the zone (Figure 20). Moreover, each sensed sample is classified considering the occupation case. For example, the machine learning algorithm should avoid comparing samples obtained on weekdays with samples obtained on weekends or holidays. If the zone is in use, the system will first measure if the current light level is inside the recommended interval in order to recommend occupants turn on/off the light, and the facility manager will be informed about the situation as well. For heating and cooling, a recommended interval has also been specified. In this case, the wise module also considers weather forecast, occupation, and temperature samples to recommend actuation of heating and cooling systems.

3.2.4. Comfort Visualization

Lastly, the resulting data (raw data, IEQ indexes, and recommendations) are represented in a virtualized model of the campus area in the Revit for BIM software. The model also represents the sensors and cameras and their location and allows the user to navigate the virtual model, enabling the mesh of points that represent the level of comfort calculated since Revit and Dynamo are directly integrated, and changes are updated in real-time (Figure 21).

4. Discussion and Conclusions

The collaboration between the ICT engineering and architecture faculties in sustainability education and research will help students and future citizens to both understand and be a part of the solution to contemporary real-life sustainability challenges. This study explored the structures, processes, and activities related to the SC concept, which promotes sustainability from a multicultural and interdisciplinary perspective. Today, nineteen Lasallian universities are involved in a global initiative to promote sustainability through research projects focused on campus transitions via sustainability development projects. The joint efforts provide a broad range of experts and knowledge that will create innovative solutions to complex sustainability challenges, as well as creative opportunities with the hope of helping the planet through concrete and real actions, which should be the backbone on which all degrees base their teaching, research, and learning programs.
The key findings to date relate to (1) multi-disciplinary and multi-actor cooperation, where students (architects and ICT engineers), as well as researchers and teachers, are all sustainable development learners (encouraging engagement and active contribution to societal processes); (2) crossing the boundaries between education and the world of work through joint activities and common languages; (3) connecting generations, such as students, lifelong learners, and schoolchildren, by reaching out to work more closely with primary and secondary schools in developing competences in sustainability learning and (4) improving sustainability knowledge, not merely curriculum-based, but learning from practice, learning in the ecosystem (and also about the ecosystem), and making this learning accessible throughout the ecosystem.
This paper proposes an SC concept to investigate the integration of building information modeling (BIM) with IoT-based wireless sensor networks (WSN) in the fields of environmental monitoring and emotion detection systems in order to provide insights into the occupants’ level of comfort. Preliminary results highlight the significance of monitoring workspaces given that it has been proven that productivity is directly influenced by environmental parameters, including thermal, visual, acoustic, and air quality comfort (our proposed primary quality goal), which could be reused to collect, store, and visualize physical parameters of educational premises for energy efficiency (our proposed secondary restrictive goal). In this way, the preliminary research presented in this paper will allow the establishment of a basis for the SC’s comfort digital twin experimentation.
The designed experimentation is implemented within the software environment of Autodesk Revit 2020, which integrates the Dynamo BIM visual programming interface in order to act as an IoT middleware, by reading data stored in a remote database, processing the data, calculating the IEQ indexes and rendering the obtained comfort levels into a virtual classroom model. It has been observed that the integration between BIM and IoT provides many benefits, including: (1) real-time access to information and process automation; (2) comfort level monitoring is fully accomplished using BIM tools, the transformation of BIM data to a relational database is the basis for linking this information; (3) big data techniques are added in the construction industry for statistical analysis (machine learning, intelligent monitoring, augmented reality, virtual reality and performance in spaces) and (4) it has allowed multiple disciplines (architecture and ICT engineering) to collaborate together in the same model where data are processed and visualized in a unique model.
Nevertheless, although we have modeled, designed, and implemented the comfort-aware digital twin of the Internet of Things institute facilities to evaluate energy efficiency as well, the smartness concept of the campus has yet to be exhaustively tested. The intelligence of the deployed model, as stated before, is based on static rules and relies on recommendations for the occupants and the facility manager. Despite noticeable progress in our university campus, the concepts and principles of the smartness level are not fully clarified yet. This can be attributed to the obvious novelty of the concept and numerous types of smart systems, technologies, and devices available to students, learners, faculty, and academic institutions.
As stated in [8], these kinds of projects usually emphasize the fact that many aspects of contemporary education need new flexible organizational structures, which can be referred to as smart. In this paper, the sensing and the fundamental inferred issues of the smartness level are addressed for a comfort-aware and energy-efficient SC, where:
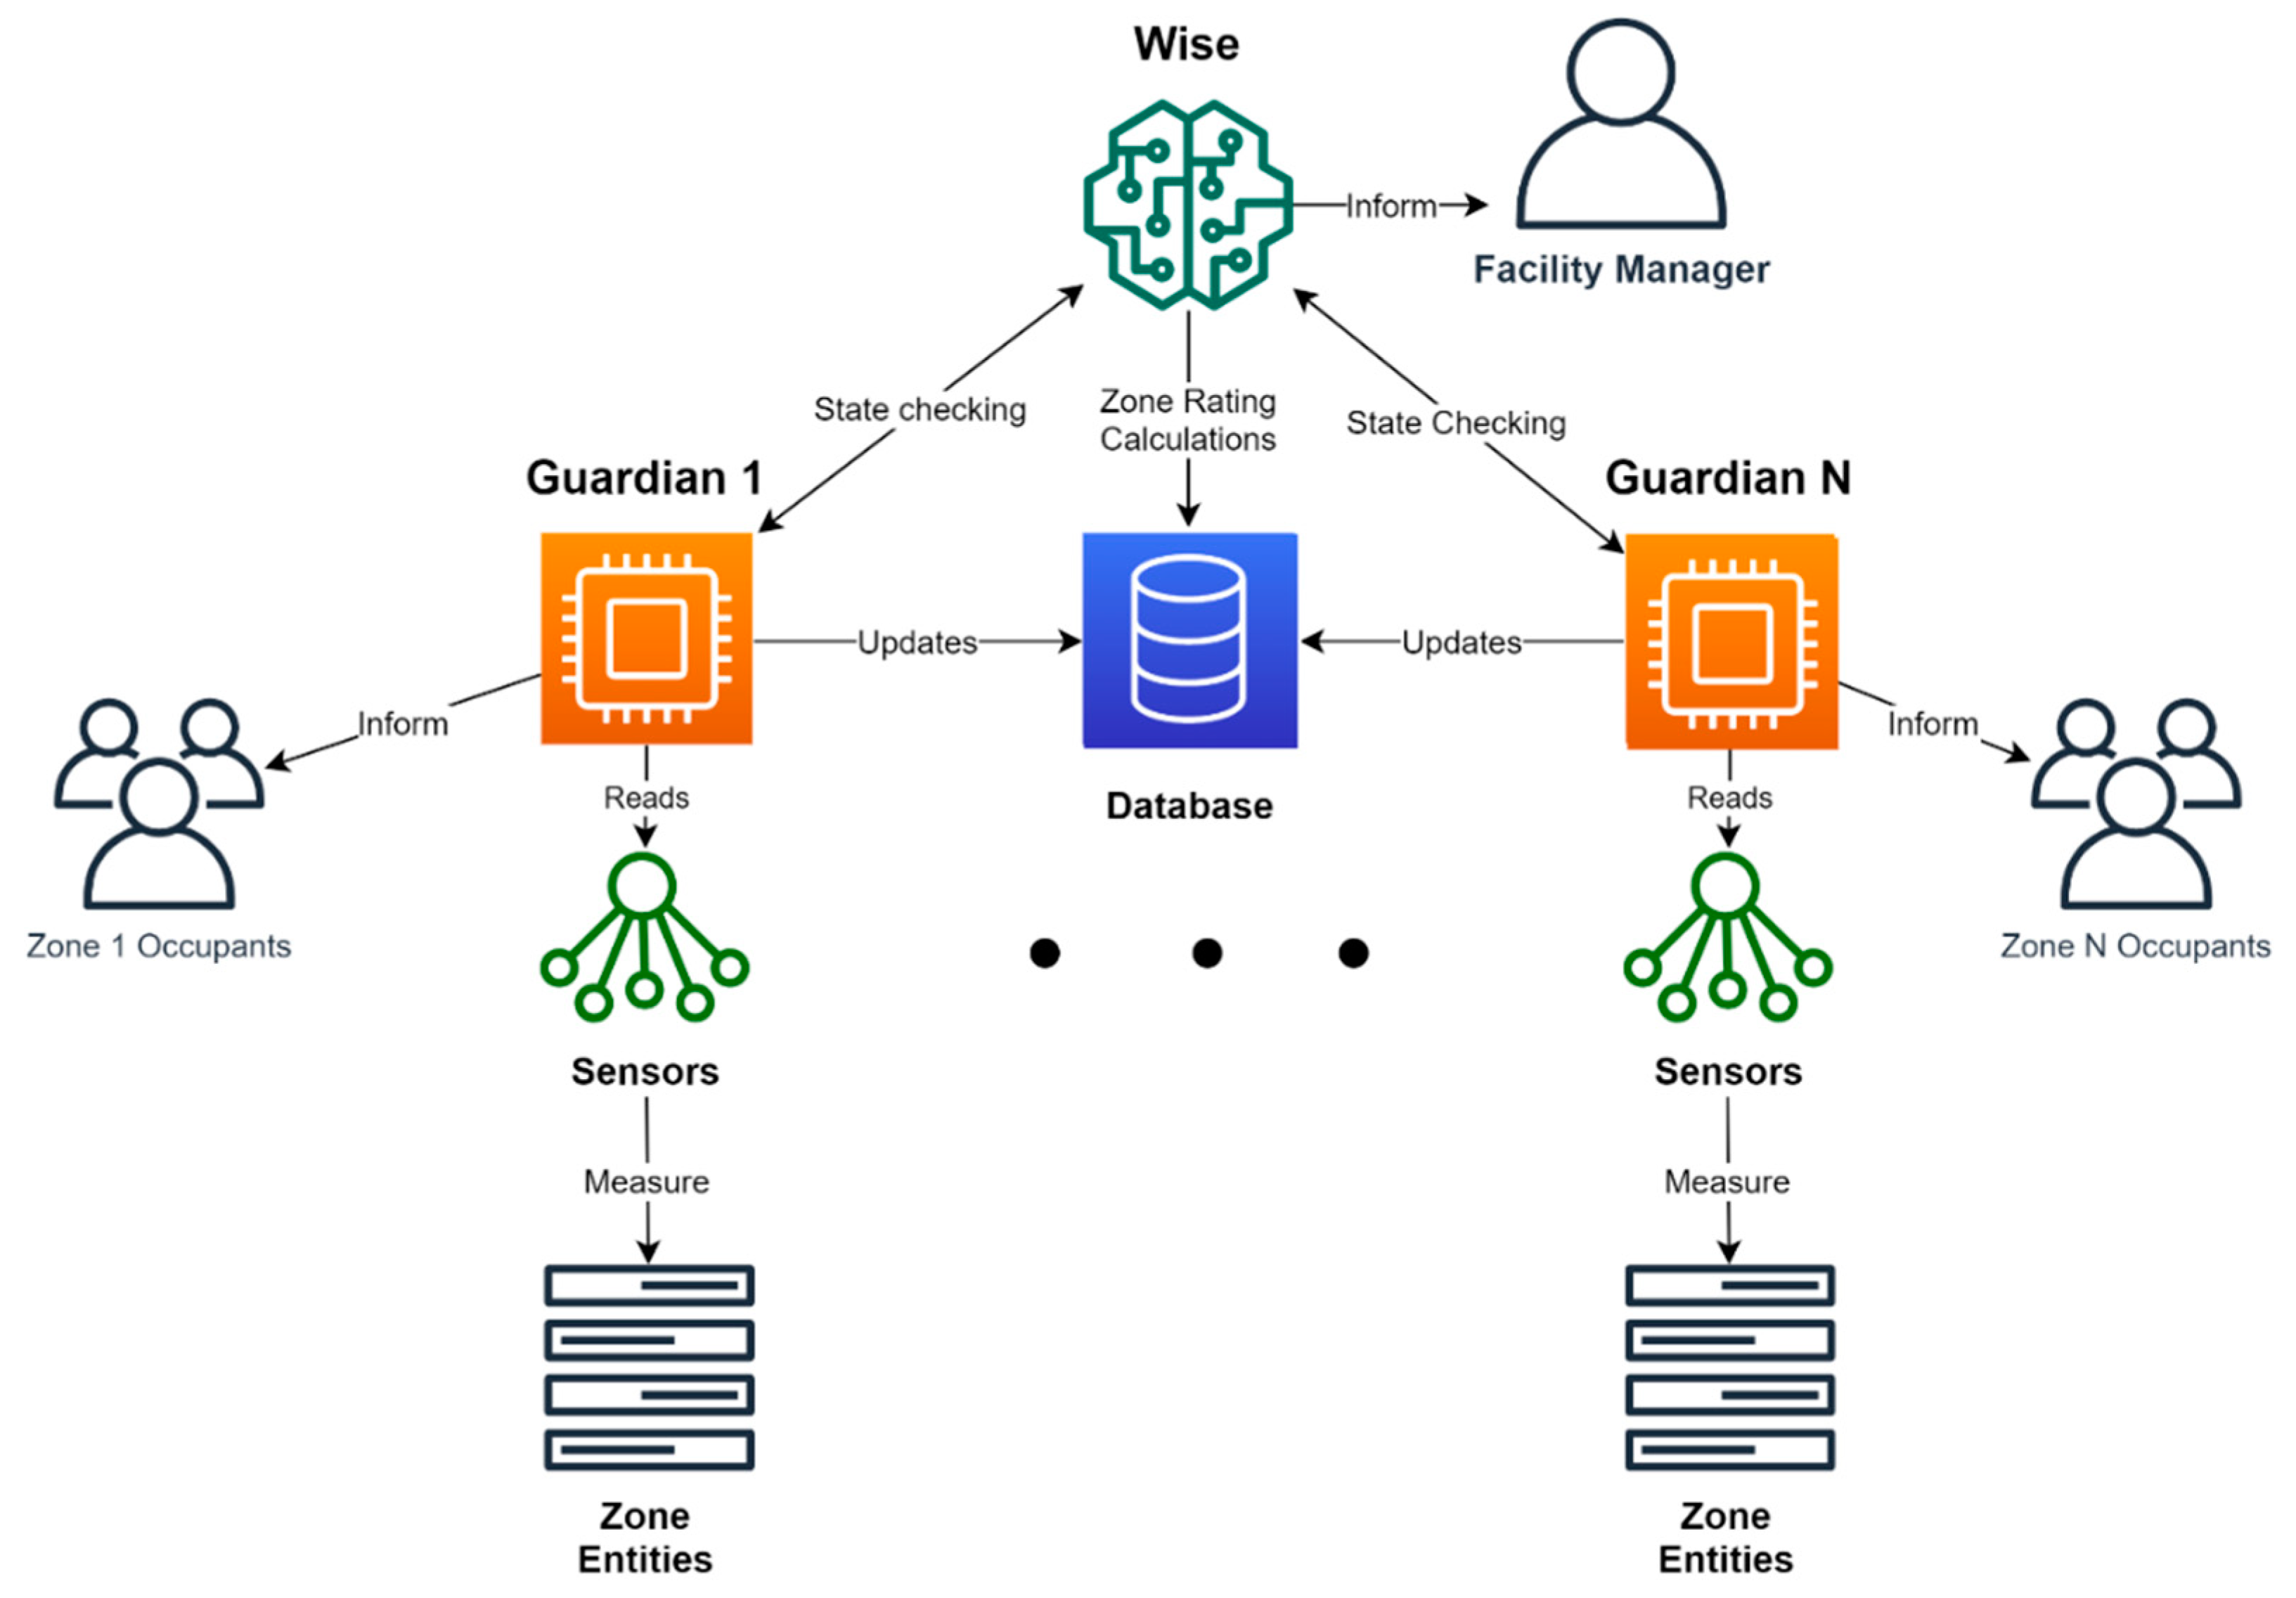
  • Sensing level is defined as the ability to automatically identify and become aware of a phenomenon and its impact (positive or negative) by using sensors.
  • The inferred level is defined as the ability to make logical conclusions based on sensed data (e.g., activate HVAC, turn off lights, and recommend administrators to take certain pro-active countermeasures).
  • Further work is required to consolidate in our digital twin campus the adaptation, learning, anticipation, and self-organization smartness levels [97].
In conclusion, we can summarize the objectives and contributions of our work in the following:
  • This paper proposes a digital twin modeling procedure that merges well-known approaches used in SC to integrate a set of advanced intelligent features: the use of technology for a digital SC by using an IoT network and cloud computing to transform university spaces into information sources for intelligent decision-making processes. SC will adopt the technological paradigm in order to support multiple tasks in multi-functional buildings (teaching, research, management, and services) and include different users (students, researchers, guests, etc.). Our proposal is to develop the SC through the efficient use of resources, thereby reducing operational costs and making life more comfortable.
  • Our contributions tackle three intelligence domains that should be equipped with various capabilities [8,52]. (1) Green campus, in line with the issue of climate change, which includes the intelligent energy consumption and the implementation of sensor technology for accurate reporting. (2) Healthy campus, to monitor and promote the level of comfort by tracking and recording the status of the campus activity and (3) real-time facility management, which includes the facilities, infrastructures and people (staff, students and visitors).
  • The proposed SC concept is not limited to supporting smart learning processes and can also support other aspects of campus life (the comfort of the academy community understood as a quality metric).
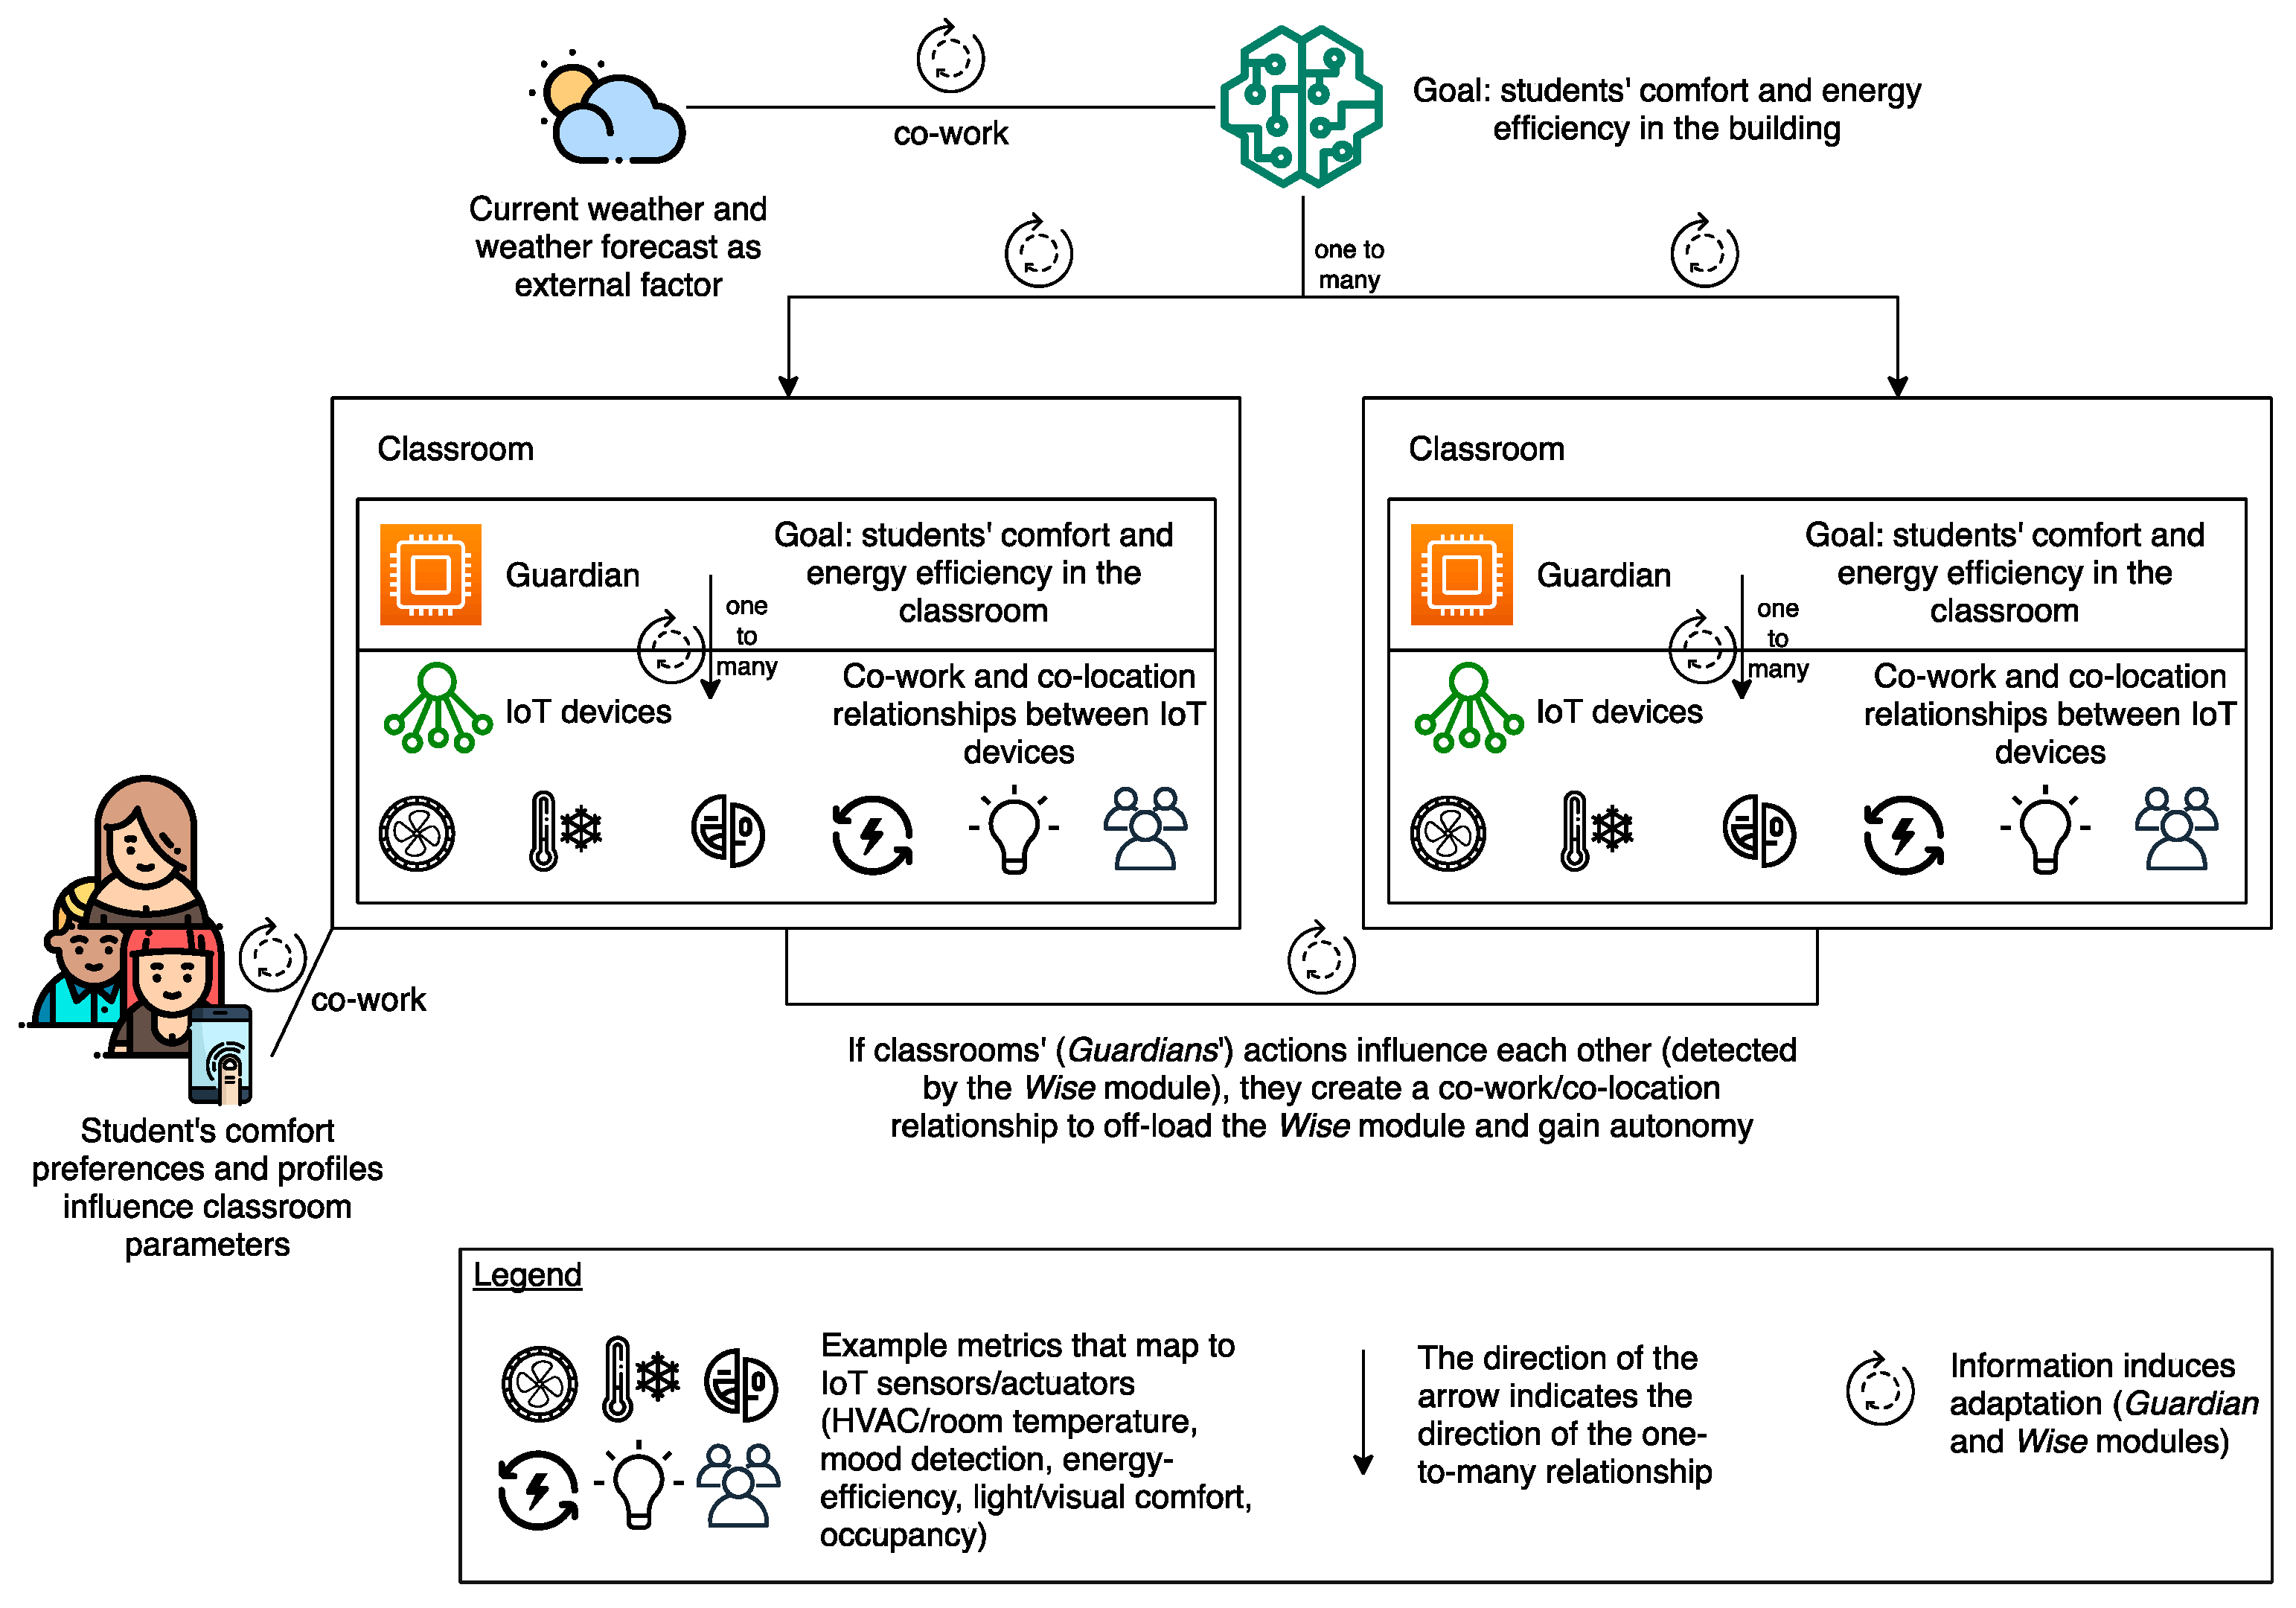
  • In the developed model, all the smart campus devices, the energy consumption performance, and the comfort evaluation dashboard can be accessed by the stakeholders through the BIM platform. This middleware facilitates the interoperability and the co-working between engineering and architecture staff by promoting an interdisciplinary task force. We envisage that if sustainable policies have to be defined, an interdisciplinary team could easily cope with the identification of patterns and the suitability assessment of the proposed improvements.
  • The main goal of our ongoing research project is to develop SC concepts, digital twin, and complex adaptive systems, and identify the main distinctive characteristics, modules, and technologies of a multi-disciplinary SC. The aim is to improve sustainability beyond that of a traditional campus with heterogeneous learning activities.

Author Contributions

Conceptualization: A.Z. and A.B.; methodology: A.Z. and A.B.; software: A.M. and P.C.; validation: V.C.; investigation: A.M., P.C., A.B. and A.Z. All authors have read and agreed to the published version of the manuscript.

Funding

This research received no external funding.

Acknowledgments

Part of the work of this article was carried out within the framework of the Advanced Training in Health Innovation Knowledge Alliance (ATHIKA) project, funded by the European Commission Erasmus+ Programme—KA2 cooperation for innovation and the exchange of good practices—Knowledge Alliances (601106-EPP-1-2018-1-ES-EPPKA2-KA). This work has also received funding from the “Agència de Gestió d’Ajuts Universitaris i de Recerca (AGAUR)” of “Generalitat de Catalunya” (grant identification “2017 SGR 977”). We would also like to thank to International Lasallian Advisory Research Group (ILARG) for its support. Some of the icons used in the figures of this article are made by Pixel perfect, Vectors Market and Freepick from www.flaticon.com.

Conflicts of Interest

The authors declare no conflict of interest.

Abbreviations

The following abbreviations are used in this paper:
ACacoustic comfort
AECarchitecture, engineering and construction
AMQPadvanced message queuing protocol
ATHIKAAdvanced Training in Health Innovation Knowledge Alliance
ASHRAEAmerican Society of Heating, Refrigerating and Air-Conditioning Engineers
AWSamazon web services
APIapplication programming interface
BIMbuilding information modeling
BUSBuilding Use Studies Ltd.
CADcomputer-aided design
CBECenter for the Built Environment
CENEuropean Committee for Standardization
CIEInternational Commission on Illumination
CoAPconstrained application protocol
CAScomplex adaptive systems
ERDFEuropean Regional Development Fund
HTTPhypertext transfer protocol
HVACheating, ventilation, and air conditioning
IaaSinfrastructure as a service
IAQindoor air quality
ICTsinformation and communication technologies
IEQindoor environmental quality
IES/ANSIIlluminating Engineering Society of North America
IoTInternet of Things
ISOInternational Organization for Standardization
JSONJavaScript object notation
LEDlight-emitting diode
LEEDLeadership in Energy and Environmental Design
LERlight efficiency rating
MQTTmessage queuing telemetry transport
MASmulti-agent system
PaaSplatform as a service
PHPhypertext preprocessor
PMVpredicted mean vote
SBSsick building syndrome
SCsmart campus
SMEssmall and medium enterprises
SIoTSocial Internet of Things
TERtemperature efficiency rating
TCthermal comfort
URLUniversity Ramon Llull
UWPuniversal windows platform
VCvisual comfort
VOCvolatile organic compounds
WSNwireless sensor networks

References

  1. Vasileva, R.; Rodrigues, L.; Hughes, N.; Greenhalgh, C.; Goulden, M.; Tennison, J. What smart campuses can teach us about smart cities: User experiences and open data. Information 2018, 9, 251. [Google Scholar] [CrossRef] [Green Version]
  2. Villegas-Ch, W.; Palacios-Pacheco, X.; Luján-Mora, S. Application of a smart city model to a traditional university campus with a big data architecture: A sustainable smart campus. Sustainability 2019, 11, 2857. [Google Scholar] [CrossRef] [Green Version]
  3. Owusu-Boampong, A.; Holmberg, C. Distance Education in European Higher Education—The Potential. Report 3 (of 3) of the IDEAL (Impact of Distance Education on Adult Learning Project. Extended Version. UNESCO Inst. Lifelong Learn. 2015, 3, 1–218. [Google Scholar]
  4. Zomorodian, Z.S.; Tahsildoost, M.; Hafezi, M. Thermal comfort in educational buildings: A review article. Renew. Sustain. Energy Rev. 2016, 59, 895–906. [Google Scholar] [CrossRef]
  5. Ricciardi, P.; Buratti, C. Environmental quality of university classrooms: Subjective and objective evaluation of the thermal, acoustic, and lighting comfort conditions. Build. Environ. 2018, 127, 23–36. [Google Scholar] [CrossRef]
  6. Lee, M.; Mui, K.; Wong, L.; Chan, W.; Lee, E.; Cheung, C. Student learning performance and indoor environmental quality (IEQ) in air-conditioned university teaching rooms. Build. Environ. 2012, 49, 238–244. [Google Scholar] [CrossRef]
  7. Buratti, C.; Ricciardi, P. Adaptive analysis of thermal comfort in university classrooms: Correlation between experimental data and mathematical models. Build. Environ. 2009, 44, 674–687. [Google Scholar] [CrossRef]
  8. Uskov, V.L.; Bakken, J.P.; Howlett, R.J.; Jain, L.C. Smart Universities: Concepts, Systems, and Technologies; Springer: Berlin/Heidelberg, Germany, 2018; ISBN 978-3-319-59453-8. [Google Scholar]
  9. Rowe, D. Education for a sustainable future. Science 2007, 317, 323–324. [Google Scholar] [CrossRef]
  10. Disterheft, A.; Caeiro, S.; Azeiteiro, U.; Leal Filho, W. Sustainability Science and Education for Sustainable Development in Universities: Away for Transition. In Sustainability Assessment Tools in Higher Education Institutions: Mapping Trends and Good Practices around the World; Springer: Cham, Switzerland, 2013; pp. 3–28. [Google Scholar]
  11. Leal Filho, W. Sustainable Development at Universities, 2nd ed.; Peter Lang: Frankfurt, Germany, 2012. [Google Scholar]
  12. Velazquez, L.; Munguia, N.; Platt, A.; Taddei, J. Sustainable university: What can be the matter? J. Clean. Prod. 2006, 14, 810–819. [Google Scholar] [CrossRef]
  13. WCED. World Commission on Environment and Development. Our Common Future 1987, 17, 1–19. [Google Scholar]
  14. Wright, T.S.A. Definitions and frameworks for environmental sustainability in higher education. High. Educ. Policy 2002, 15, 105–120. [Google Scholar] [CrossRef]
  15. Brundiers, K.; Wiek, A.; Redman, C.L. Real-world learning opportunities in sustainability: From classroom into the real world. Int. J. Sustain. High. Educ. 2010, 11, 308–324. [Google Scholar] [CrossRef] [Green Version]
  16. Lozano, R.; Barreiro-Gen, M.; Lozano, F.J.; Sammalisto, K. Teaching Sustainability in European Higher Education Institutions: Assessing the Connections between Competences and Pedagogical Approaches. Sustainability 2019, 11, 1602. [Google Scholar] [CrossRef] [Green Version]
  17. Fabio, F.; Hassan, H.; Michele, R.; Stefano, V. Use of Automated Control Systems and Advanced Energy Simulations in the Design of Climate Responsive Educational Building for Mediterranean Area. Sustainability 2019, 116, 1660. [Google Scholar]
  18. Koester, R.J.; Eflin, J.; Vann, J. Greening of the campus: A whole-systems approach. J. Clean. Prod. 2006, 14, 769–779. [Google Scholar] [CrossRef]
  19. Filho, W.L.; Raath, S.; Lazzarini, B.; Vargas, V.; De Souza, L.; Anholon, R.; Quelhas, O.; Haddad, R.; Klavins, M.; Orlovic, V. The role of transformation in learning and education for sustainability. J. Clean. Prod. 2018, 199, 286–295. [Google Scholar] [CrossRef]
  20. Lozano, R. A Holistic Perspective on Corporate Sustainability Drivers. Corp. Soc. Responsib. Environ. Manag. 2013, 22, 32–44. [Google Scholar] [CrossRef]
  21. Advanced Training in Health Innovation Knowledge Alliance (ATHIKA European Project, Erasmus+). Available online: https://athika.eu/ (accessed on 1 September 2020).
  22. Global Report on Urban Health: Equitable, Healthier Cities for Sustainable Development; World Health Organization: Geneva, Switzerland, 2016; ISBN 978-924-156-527-1.
  23. Víctor, C.; David, V.; Agustín, Z. A Heuristic to Create Prosumer Community Groups in the Social Internet of Energy. Sensors 2020, 20, 3704. [Google Scholar]
  24. Michal, L.; Ondrej, P. Smart city model based on systems theory. Int. J. Inf. Manag. 2020, 102092, in press. [Google Scholar]
  25. Chiva, R.; Ghauri, P.; Alegre, J. Organizational Learning, Innovation and Internationalization: A Complex System Model. Br. J. Manag. 2013, 25, 687–705. [Google Scholar] [CrossRef]
  26. Boulton, J.G.; Allen, P.M.; Bowman, C. Embracing Complexity: Strategic Perspectives for an Age of Turbulence; OUP Oxford: Oxford, UK, 2015; ISBN 10 0199565260. [Google Scholar]
  27. Simon, H.A. The Sciences of the Artificial, 3rd ed.; MIT Press: Cambridge, MA, USA, 1996. [Google Scholar]
  28. Ladyman, J.; Lambert, J.; Wiesner, K. What is a complex system? Eur. J. Philos. Sci. 2013, 3, 33–67. [Google Scholar] [CrossRef]
  29. Johan, C.; Magnus, C.; Stephan, B. The smart city model: A new panacea for urban sustainability or unmanageable complexity? Environ. Plan. B Urban Anal. City Sci. 2020, 47, 179–187. [Google Scholar]
  30. Dzaferagic, M.; Kaminski, N.; Macaluso, I.; Marchetti, N. Relation between functional complexity, scalability and energy efficiency in WSNs. In Proceedings of the 13th International Wireless Communications and Mobile Computing Conference, Valencia, Spain, 26–30 June 2017; pp. 675–680. [Google Scholar]
  31. Chaisson, E.J. Energy Flows in Low-Entropy Complex Systems. Entropy 2015, 17, 8007–8018. [Google Scholar] [CrossRef]
  32. Holland, J.H. Studying Complex Adaptive Systems. J. Syst. Sci. Complex. 2006, 19, 1. [Google Scholar] [CrossRef]
  33. Jarrar, A.; Ait Wakrime, A.; Balouki, Y. Formal approach to model complex adaptive computing systems. Complex Adapt. Syst. Model. 2020, 8, 3. [Google Scholar] [CrossRef] [Green Version]
  34. Marchetti, N.; Macaluso, I.; Kaminski, N.; Dzaferagic, M.; Butt, M.M.; Ruffini, M.; Friedner, S.; Bradford, J.; Zanella, A.; Zorzi, M.; et al. Complex Systems Science meets 5G and IoT. arXiv 2017, arXiv:1710.11548. [Google Scholar]
  35. Abbasi, K.M.; Khan, T.A.; Haq, I.U. Hierarchical Modeling of Complex Internet of Things Systems Using Conceptual Modeling Approaches. IEEE Access 2019, 7, 102772–102791. [Google Scholar] [CrossRef]
  36. Nikolopoulos, B.; Dimopoulos, A.C.; Nikolaidou, M.; Dimitrakopoulos, G.; Anagnostopoulos, D. A system of systems architecture for the internet of things exploiting autonomous components. Int. J. Syst. Syst. Eng. 2019, 9, 167–199. [Google Scholar] [CrossRef]
  37. Víctor, C.; David, V.; Agustín, Z. Social Internet of Energy—A New Paradigm for Demand Side Management. IEEE Internet Things J. 2019, 6, 9853–9867. [Google Scholar]
  38. Göktuğ, M.; Aaron, W. Network and Complexity Theories: A Comparison and Prospects for a Synthesis. Adm. Theory Prax. 2009, 31, 44–58. [Google Scholar]
  39. Atzori, L.; Iera, A.; Morabito, G.; Nitti, M. The social internet of things (SIoT)—When social networks meet the internet of things: Concept, architecture and network characterization. Comput. Netw. 2012, 56, 3594–3608. [Google Scholar] [CrossRef]
  40. Fernández-Caramés, T.; Fraga-Lamas, P. Towards Next Generation Teaching, Learning, and Context-Aware Applications for Higher Education: A Review on Blockchain, IoT, Fog and Edge Computing Enabled Smart Campuses and Universities. Appl. Sci. 2019, 9, 4479. [Google Scholar] [CrossRef] [Green Version]
  41. Verstaevel, N.; Boes, J.; Gleizes, M. From smart campus to smart cities issues of the smart revolution. In Proceedings of the IEEE SmartWorld, Ubiquitous Intelligence & Computing, Advanced & Trusted Computed, Scalable Computing & Communications, Cloud & Big Data Computing, Internet of People and Smart City Innovation (2017), San Francisco, CA, USA, 4–8 August 2017. [Google Scholar]
  42. Alvarez-Campana, M.; López, G.; Vázquez, E.; Villagrá, V.A.; Berrocal, J. Smart CEI Moncloa: An IoT-based Platform for People Flow and Environmental Monitoring on a Smart University Campus. Sensors 2017, 17, 2856. [Google Scholar] [CrossRef] [Green Version]
  43. Guo, M.; Zhang, Y. The research of smart campus based on Internet of Things & cloud computing. In Proceedings of the 11th International Conference on Wireless Communications, Networking and Mobile Computing (WiCOM 2015), Shanghai, China, 21–23 September 2015. [Google Scholar]
  44. Xiao, G.; Guo, J.; Xu, L.D.; Gong, Z. User Interoperability with Heterogeneous IoT Devices through Transformation. IEEE Trans. Ind. Inform. 2014, 10, 1486–1496. [Google Scholar] [CrossRef]
  45. Caballero, V.; Valbuena, S.; Vernet, D.; Zaballos, A. Ontology-Defined Middleware for Internet of Things Architectures. Sensors 2019, 19, 1163. [Google Scholar] [CrossRef] [PubMed] [Green Version]
  46. Razzaque, M.A.; Milojevic-Jevric, M.; Palade, A.; Cla, S. Middleware for internet of things: A survey. IEEE Internet Things J. 2016, 3, 70–95. [Google Scholar] [CrossRef] [Green Version]
  47. Kazado, D.; Kavgic, M.; Eskicioglu, R. Integrating Building Information Modeling (BIM) and sensor technology for Facility Management. Electron. J. Inf. Technol. Constr. 2019, 24, 440. [Google Scholar]
  48. Teizer, J.M.; Golovina, W.O.; Perschewski, M.; Propach, M.; Neges, M.; König, M. Internet of Things (IoT) for integrating environmental and localization data in Building Information Modeling (BIM), ISARC 2017. In Proceedings of the International Symposium on Automation and Robotics in Construction, Taipei, Taiwan, 28 June–1 July 2017; pp. 1–7. [Google Scholar]
  49. Chang, K.-M.; Dzeng, R.-J.; Wu, Y.-J. An Automated IoT Visualization BIM Platform for Decision Support in Facilities Management. Appl. Sci. 2018, 8, 1086. [Google Scholar] [CrossRef] [Green Version]
  50. Agarwal, P.; Alam, M. Investigating IoT Middleware Platforms for Smart Application Development. arXiv 2020, arXiv:1810.12292. [Google Scholar]
  51. Atif, Y.; Mathew, S.S.; Lakas, A. Building a smart campus to support ubiquitous learning. J. Ambient Intell. Humaniz. Comput. 2015, 6, 223–238. [Google Scholar] [CrossRef]
  52. Muhamad, W.; Kurniawan, N.B.; Suhardi; Yazid, S. Smart campus features, technologies, and applications: A systematic literature review. In Proceedings of the International Conference on Information Technology Systems and Innovation (ICITSI), Bandung, Indonesia, 23–24 October 2017; pp. 384–391. [Google Scholar] [CrossRef]
  53. Nasro, M.-A.; Saleh, A. Smart campus—A sketch. Sustain. Cities Soc. 2020, 59, 102231. [Google Scholar] [CrossRef]
  54. Catalina, T.; Iordache, V. IEQ assessment on schools in the design stage. Build. Environ. 2012, 49, 129–140. [Google Scholar] [CrossRef]
  55. Index|ASHRAE 1.6 Terminology. 2020. Available online: https://tc0106.ashraetcs.org (accessed on 1 September 2020).
  56. Heinzerling, D.; Schiavon, S.; Webster, T.; Arens, E. Indoor environmental quality assessment models: A literature review and a proposed weighting and classification scheme. Build. Environ. 2013, 70, 210–222. [Google Scholar] [CrossRef] [Green Version]
  57. Cohen, R.; Standeven, M.; Bordass, B.; Leaman, A. Assessing building performance in use 1: The Probe process. Build. Res. Inf. 2001, 29, 85–102. [Google Scholar] [CrossRef]
  58. Center for the Built Environment (CBE). Occupant Indoor Environmental Quality Survey and Building Benchmarking. Occupant Survey Toolkit. 2008. Available online: https://cbe.berkeley.edu/research/occupant-survey-and-building-benchmarking/ (accessed on 1 September 2020).
  59. Nicol, J.F.; Wilson, M. A critique of European Standard EN 15251: Strengths, weaknesses and lessons for future standards. Build. Res. Inf. 2011, 39, 183–193. [Google Scholar] [CrossRef]
  60. Marino, C.; Nucara, A.; Pietrafesa, M. Proposal of comfort classification indexes suitable for both single environments and whole buildings. Build. Environ. 2012, 57, 58–67. [Google Scholar] [CrossRef]
  61. Ncube, M.; Riffat, S. Developing an indoor environment quality tool for assessment of mechanically ventilated office buildings in the UK—A preliminary study. Build. Environ. 2012, 53, 26–33. [Google Scholar] [CrossRef] [Green Version]
  62. Cao, B.; Ouyang, Q.; Zhu, Y.; Huang, L.; Hu, H.; Deng, G. Development of a multivariate regression model for overall satisfaction in public buildings based on field studies in Beijing and Shanghai. Build. Environ. 2012, 47, 394–399. [Google Scholar] [CrossRef]
  63. Lai, C.K.; Mui, K.W.; Wong, L.T.; Law, L.Y. An evaluation model for indoor environmental quality (IEQ) acceptance in residential buildings. Energy Build. 2009, 41, 930–936. [Google Scholar] [CrossRef]
  64. Mui, K.W.; Chan, W.T. A New Indoor Environmental Quality Equation for Air-Conditioned Buildings. Archit. Sci. Rev. 2005, 48, 41–46. [Google Scholar] [CrossRef]
  65. Wong, L.T.; Mui, K.W. An energy performance assessment for indoor environmental quality (IEQ) acceptance in air-conditioned offices. Energy Convers. Manag. 2009, 50, 1362–1367. [Google Scholar] [CrossRef]
  66. American Standards of Heating. Refrigerating and Air-Conditioning Engineers (ASHRAE). Standard 55-2004. Atlanta ASHRAE 2004, 1, 1–26. [Google Scholar]
  67. Fanger, O. Thermal Comfort; Danish Technical Press: Copenhagen, Denmark, 1970. [Google Scholar]
  68. International Organization for Standardization. ISO 7730:2005 Ergonomics of the Thermal Environment—Analytical Determination and Interpretation of Thermal Comfort Using Calculation of the PMV and PPD Indices and Local Thermal Comfort Criteria; International Organization for Standardization: Geneva, Austria, 2005. [Google Scholar]
  69. Yang, Z.; Becerik-Gerber, B.; Mino, L. A study on student perceptions of higher education classrooms: Impact of classroom attributes on student satisfaction and performance. Build. Environ. 2013, 70, 171–188. [Google Scholar] [CrossRef]
  70. Hwang, R.-L.; Lin, T.-P.; Kuo, N.-J. Field experiments on thermal comfort in campus classrooms in Taiwan. Energy Build. 2006, 38, 53–62. [Google Scholar] [CrossRef]
  71. Jung, G.J.; Song, S.K.; Ahn, Y.C.; Oh, G.S.; Bin Im, Y. Experimental research on thermal comfort in the university classroom of regular semesters in Korea. J. Mech. Sci. Technol. 2011, 25, 503–512. [Google Scholar] [CrossRef]
  72. Lackney, J.A. Thirty-three educational design principles for schools & community learning centers. ERIC Clearinghouse 2000, 1, 1–33. [Google Scholar]
  73. Zwirtes, D.P.Z.; Passero, C.R.M. Assessment of Acoustic Quality in Classrooms Based on Measurements, Perception and Noise Control. In Noise Control, Reduction and Cancellation Solutions in Engineering; Daniela, S., Ed.; IntechOpen: London, UK, 2012; ISBN 978-953-307-918-9. [Google Scholar]
  74. International Organization for Standardization. ISO 3382-1. Acoustics—Measurement of Room Acoustic Parameters—Part 1: Performance Spaces; International Organization for Standardization: Geneva, Switzerland, 2009. [Google Scholar]
  75. Zannin, P.H.T.; Passero, C.R.M.; Sant’ana, D.Q.; Bunn, F.; Fiedler, P.E.K.; Ferreira, A.M.C. Classroom Acoustics: Measurements, Simulations and Applications. In Newley in Classrooms: Management, Effectiveness and Challenges (Education in a Competitive and Globalizing World); Rebecca, J., Ed.; NOVA Science Publishers: Hauppauge, NY, USA, 2011; pp. 133–162. ISBN 10 1613246013. [Google Scholar]
  76. International Electrotechnical Commission. IEC 60268-16: Sound System Equipment—Part 16: Objective Rating of Speech Intelligibility by Speech Transmission Index; IEC Publications: Geneva, Switzerland, 2003. [Google Scholar]
  77. Associacão Brasileira de Normas Técnicas. NBR 10152: Níveis de ruído para conforto acústico—procedimento. Rio de Janeiro 1987, 1, 1–4. (In Portuguese) [Google Scholar]
  78. Lubman, D.; Sutherland, L.C. Good Classrooms Acoustic is a god investment. In Proceedings of the 17th Meeting of the International Congress for Acoustics, edited by Educational Resources Information Center (ERIC 2001), Roma, Italy, 2–7 September 2001; pp. 1–6. [Google Scholar]
  79. Zannin, P.H.T.; Zwirtes, D.P.Z. Evaluation of the acoustic performance of classrooms in public schools. Appl. Acoust. 2009, 70, 626–635. [Google Scholar] [CrossRef]
  80. Fincher, W.; Boduch, M. Standards of Human Comfort: Relative and Absolute; University of Texas: Austin, TX, USA, 2009. Available online: https://repositories.lib.utexas.edu/handle/2152/13980 (accessed on 1 September 2020).
  81. CIE. International Comission On Illumination CIE Publication 117:1995; Technical Report; 1221 Discomfort Glare in Interior Lightning; CIE: Vienna, Austria, 1995. [Google Scholar]
  82. CIE. International Comission On Illumination CIE Publication 190:2010; Technical Report; Calculation and Presentation of Unified Glare Rating Tables for Interior Lightning Luminaires; CIE: Vienna, Austria, 2010. [Google Scholar]
  83. CEN. Light and Lighting—Lighting in Work Places—Part 1: Indoor Work Places. EN Standard 12464-1; Euripean Committee for Standarization, CEN: Brussels, Belgium, 2011. [Google Scholar]
  84. CIBSE. Code for interior Lighting: Lighting for Education—LG5, Chartered Institution of Building Services Engineers; The Chartered Institution of Building Services Engineers: London, UK, 2011. [Google Scholar]
  85. ANSI/IES. Design Guide: Recommended Practice for Office Lighting, Illuminating Engineering Society of North America; Illuminating Engineering Society: New York, NY, USA, 2018. [Google Scholar]
  86. CIBSE. Indoor Air Quality & Ventilation—KS17, Chartered Institution of Building Services Engineers; The Chartered Institution of Building Services Engineers: London, UK, 2011. [Google Scholar]
  87. Seo, Y.K.; Suvarapu, L.N.; Baek, S.O. Characterization of odorous compounds (VOC and carbonyl compounds) in the ambient air of Yeosu and Gwangyang, large industrial areas of South Korea. Sci. World J. 2014, 2014, 824301. [Google Scholar] [CrossRef]
  88. Both, R. Directive on odour in ambient air: An established system of odour measurement and odour regulation in Germany. Water Sci. Technol. 2001, 44, 119–126. [Google Scholar] [CrossRef]
  89. Leadership in Energy and Environmental Design, LEED. Available online: https://www.usgbc.org/leed (accessed on 1 September 2020).
  90. Meteostat. Meteostat API Documentation. 2020. Available online: https://dev.meteostat.net/ (accessed on 1 September 2020).
  91. Lighting Phillips. PoE Lighting for Offices. 2019. Available online: https://www.usa.lighting.philips.com/systems/connected-lighting-for-offices (accessed on 1 September 2020).
  92. BUILDINGS Smarter Facility Management. DALI Explained. 2018. Available online: https://www.buildings.com/news/industry-news/articleid/1463/title/dali-explained (accessed on 1 September 2020).
  93. Yusuf, Y.; Durmus Arsan, Z. Identification of the building parameters that influence heating and cooling. Energy 2011, 36, 4287–4429. [Google Scholar]
  94. Martín de Pozuelo, R.; Zaballos, A.; Navarro, J.; Corral, G. Prototyping a Software Defined Utility. Energies 2017, 10, 818. [Google Scholar] [CrossRef] [Green Version]
  95. Caballero, V.; Vernet, D.; Zaballos, A.; Corral, G. Prototyping a Web-of-Energy Architecture for Smart Integration of Sensor Networks in Smart Grids Domain. Sensors 2018, 18, 400. [Google Scholar] [CrossRef] [Green Version]
  96. Cockroft, J.; Cowie, A.; Samuel, A.; Strachan, P. Potential energy savings achievable by zoned control of individual rooms in UK housing compared to standard central heating controls. Energy Build. 2017, 136, 1–11. [Google Scholar] [CrossRef] [Green Version]
  97. Uskov, V.L.; Bakken, J.P.; Pandey, A.; Singh, U.; Yalamanchili, M.; Penumatsa, A. Smart University taxonomy: Features, components, systems. In Smart Education and e-Learning; Springer: Berlin/Heidelberg, Germany, 2016; pp. 3–14. ISBN 978-3-319-39689-7. [Google Scholar]
  98. Azhar, S. Building Information Modeling (BIM): Trends, Benefits, Risks, and Challenges for the AEC Industry. Leadersh. Manag. Eng. 2011, 11, 241–252. [Google Scholar] [CrossRef]
  99. Motamedi, A.; Hammad, A. Lifecycle management of facilities components using radio frequency identification and building information model. J. Inf. Technol. Constr. (ITcon) 2009, 14, 238–262. [Google Scholar]
  100. Arslan, M.; Riaz, Z.; Kiani, A.; Azhar, S. Real-time environmental monitoring, visualization and notification system for construction H&S management. J. Inf. Technol. Constr. (ITcon) 2014, 19, 72–91. [Google Scholar]
  101. Kim, E.; Cho, Y.; Kim, G. Real Time Building Data collecting Using IoT and BIM. In Proceedings of the 2018 Asian Conference on Design and Engineering, Okinawa, Japan, 1–3 November 2018; pp. 1–10. [Google Scholar]
Figure 1. Complex adaptive system and Social Internet of Things (SIoT) relationships in the smart campus digital twin.
Sustainability 12 09196 g001
Figure 2. IEQ metric weighting chart.
Sustainability 12 09196 g002
Figure 3. Predicted mean vote (PMV) index parameters and the American Society of Heating, Refrigerating and Air-Conditioning Engineers (ASHRAE) thermal sensation scale.
Sustainability 12 09196 g003
Figure 4. Subtopics for an energy efficient zone.
Sustainability 12 09196 g004
Figure 5. Sensed parameters for efficient energy and comfort assessment.
Sustainability 12 09196 g005
Figure 6. The decision support system for the facility manager by using the digital twin information.
Sustainability 12 09196 g006
Figure 7. La Salle-University Ramon Llull (URL) (Barcelona).
Sustainability 12 09196 g007
Figure 8. IoT institute premises; digital twin model for automatic monitoring.
Sustainability 12 09196 g008
Figure 9. IoT institute at La Salle-URL: (A)—architectural plan, (B)—maker Space, (C)—agora, (D)—city lab.
Sustainability 12 09196 g009
Figure 10. Conceptual system flow.
Sustainability 12 09196 g010
Figure 11. General overview of the digital twin developed in Dynamo Revit ((A)—spaces, (B)—sensed data and acquisition methods).
Sustainability 12 09196 g011
Figure 12. System high-level design.
Sustainability 12 09196 g012
Figure 13. Environmental monitoring high-level design.
Sustainability 12 09196 g013
Figure 14. Occupants’ emotions high-level design.
Sustainability 12 09196 g014
Figure 15. Data storage high-level design.
Sustainability 12 09196 g015
Figure 16. Dynamo flow representing (A) the current environmental data collection and rendering from each node stored in the database and (B) the current emotion data collection and rendering from each camera stored in the database.
Sustainability 12 09196 g016
Figure 17. Data rendering and IEQ calculation high-level design.
Sustainability 12 09196 g017
Figure 18. Dynamo flow representing the IEQ calculation.
Sustainability 12 09196 g018
Figure 19. Finite state machine for light recommendations.
Sustainability 12 09196 g019
Figure 20. Occupancy monitoring.
Sustainability 12 09196 g020
Figure 21. Comfort visualization high-level design.
Sustainability 12 09196 g021
Table 1. Comparisons among some of the most used Internet of Things (IoT) platforms.
IoT MiddlewareTypeAccess ModelData Format SupportedProgramming Language SupportedProtocolsPricingTechnologies Used
AWS IoT Platform1PaaS, IaaSJSONJava, C, NodeJS, Javascript, Python, SDK for Arduino, iOS, AndroidHTTP, MQTT, WebsocketsPay when executing your own written functionsAll Amazon services
Microsoft Azure IoT Hub1IaaSJSON.NET, UWP, Java, C, NodeJS, Ruby, Android, iOSHTTP, AMQP, MQTTPay according to the number of devices and messages per dayAzure Cosmos DB, Azure Tables, SQL database
IBM Watson IoT Platform1PaaS, IaaSJSON, CSVC#, C, Python, Java, NodeJSMQTTPay according to the number of devices and messages per dayCloudant NoSQL DB
Google IoT Platform4PaaS, IaaSJSONGo, Java, NET, Node.js, php, Python, RubyMQTT, HTTPPriced per MByteGoogle’s services
Kaa IoT Platform4IaaSJSONJava, C, C++MQTT, CoAP, XMPP, TCP, HTTPFreeNoSQL, MangoDB, Real time analytics and visualizatoin with Kaa
ThingSpeak2PaaSJSON, XMLMatlabMQTT API and RESTFreeMatlab, dashboard and Matlab analytics, MySQL
Carriots3PaaSXML, JSONJavaMQTTPaid servicesNoSQL Big- Database
Temboo3PaaSExcel, CSV, XML, JSONC, Java, Python, iOS, Android, javascriptHTTP, MQTT, CoAPFree access for first 100 devices after that paid per deviceMicrosoft Power BI, Google BigQuery
Thinger.io2PaaSJSON HTTP, MQTT MongoDB
Sentilo3PaaSJSONC, JavaHTTPFreeRedis, Apache, PubSub, MongoDB, ElasticSearch
Table 2. Proposed indoor environmental quality (IEQ) schema.
MetricRegression ConstantsCalculation
ACK0 = 4.74 ϕ 0 = 1 ( 1 1 + e ( 9.54 0.134 · d B A ) )
IAQK1 = 4.88 ϕ 1 = 1 1 2   ( 1 1 + e ( 3.118 0.00215 · C O 2 ) 1 1 + e ( 3.23 0.00117 · C O 2 ) )
VCK2 = 3.70 ϕ 2 = 1 ( 1 1 + e ( 1.017 + 0.00558 · l x ) )
TCK3 = 6.09 ϕ 3 = 1 ( PPD 100 )
IEQKIEQ = −15.02 1 ( 1 1 + e ( K I E Q + i = 0 3 k i ϕ i ) )
Table 3. Possible metrics of environmental monitoring and their associated sensors.
MetricParameterUnitMeasurement MethodTool or Resource
TCOperant Temperature°CTemperature-humidity sensorDHT22
TCRelative Humidity%Temperature-humidity sensorDHT22
TCOccupant metabolic rateMetPulsometerMAX30102
TCMean Radiant temperature°CGlobe thermometerBlackglobe-L
TCAir temperature°CTemperature-humidity sensorDHT11
TCExterior air temperature°CTemperature-humidity sensorDHT22
TCExterior air humidity°CTemperature-humidity sensorDHT22
TCSurface of element (wall, radiators, windows)m2Thermographic camera moduleAdafruit AMG8833 8×8 Thermal Camera Sensor for Arduino
TCPerson Clothing resistancecloSurvey/infrared thermography cameraThermaCAM s45/FLIR TG165-X
IAQAir velocitym/sCFD simulationAnsys CFX 18.2/Visual-CFD/SolidWorks and AutodeskInventor CFD add-ons
IAQSpecific flow of air introducedm3/hCFD simulationAnsys CFX 18.2/Visual-CFD/SolidWorks and Autodesk Inventor CFD add-ons
IAQAir change per hourh-1CFD simulationAnsys CFX 18.2/Visual-CFD/SolidWorks and Autodesk Inventor CFD add-ons
-Room volumem3--
-Number of occupants-Camera/PIR motion sensorsSony IMX219 fish eye module for Raspberry/ElectroPeak HC-SR501 PIR sensor
IAQTVOCmg/m3TVOC and eCO2 gas sensorAdafruit SGP30
IAQCOppmCarbon monoxide sensorMQ-7
IAQCO2ppmAnalog CO2 gas sensorDFRobot/MG-811
IAQDustμg/m3Grove—Dust sensorPPD42NS
IAQmulti-Gas (NH3, NOx, alcohol, Benzene, smoke)ppmMulti-gas sensor detectorMQ-135
IAQOdorsouE/m2Electronic nosezNose 4300 or 7100 model
ACReverberation timesSound analyzerDual-channel Brüel & Kjaer BK 2260 real-time sound analyze
ACSpeech transmission index-Acoustic simulations Odeon 9.0 software
ACLevel difference indexdBAcoustic simulationsOdeon 9.0 software
ACImpact sound pressure leveldBAcoustic simulationsOdeon 9.0 software
ACClaritydBSound sensorSparkfun sound sensor
ACSound insulationdBDual-channel sound analyzer and an omnidirectional loudspeakerDual-channel Brüel & Kjaer BK 2260 real-time sound analyze
VCMaintained luminanceluxLux meterBH1750/PCE-170
VCDiscomfort glare-Image luminance measuring device/luminance meterOP75/TES 137
VCDaylightcd/m2CAD simulationsSimulink software
VCDry bulb temperature°CProduct specifications-
Table 4. Recommended visual comfort parameters for some of the educational spaces [84].
Space or AreaMaintained LuminanceDiscomfort GlareObservations
Classrooms for morning classes300 lx19Lighting should be controllable
Classrooms for evening classes and adults education500 lx19-
Lecture hall500 lx19Lighting should be controllable
Black board500 lx19Prevent specula reflections
Practical rooms and laboratories500 lx19-
Computer practice rooms500 lx19-
Student common rooms and assembly halls200 lx22-
Preparation rooms and workshops500 lx22-
Technical drawing rooms750 lx19-
Table 5. Recommended indoor air quality comfort parameters [80,86].
Indoor ContaminationAllowable Air Concentration Levels
Carbon monoxide (CO)<9 ppm
Carbon dioxide (CO2)<800 ppm
Airborne mold and mildew<20 μg/m3 above outside air
Total VOC<200 μg/m3 above outside air
Publisher’s Note: MDPI stays neutral with regard to jurisdictional claims in published maps and institutional affiliations.

