How Climate Variables Influence the Spread of SARS-CoV-19 in the United States


Abstract
:1. Introduction
2. Materials and Methods
2.1. Data Collection
2.2. Data Analysis
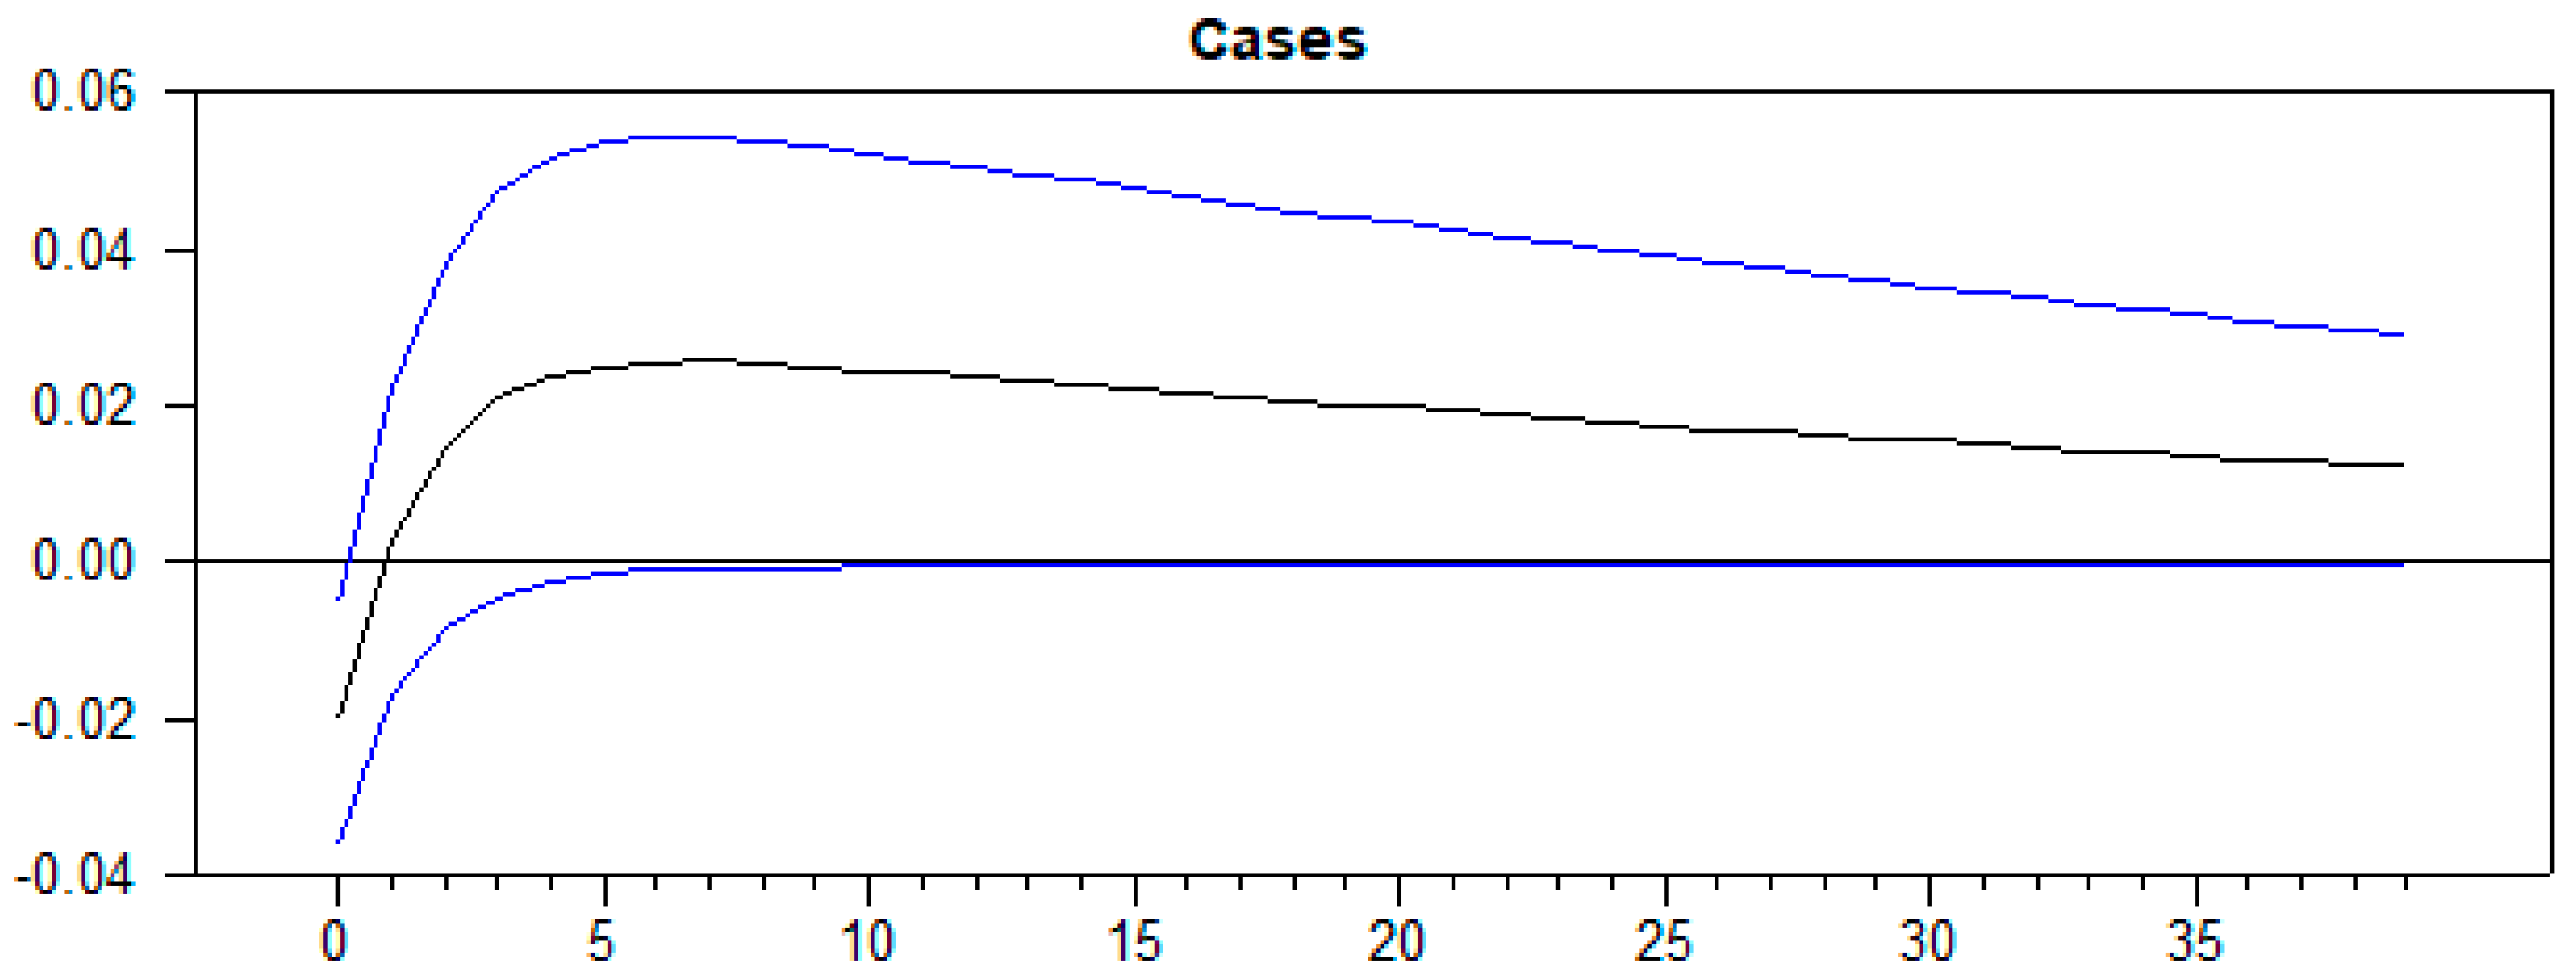
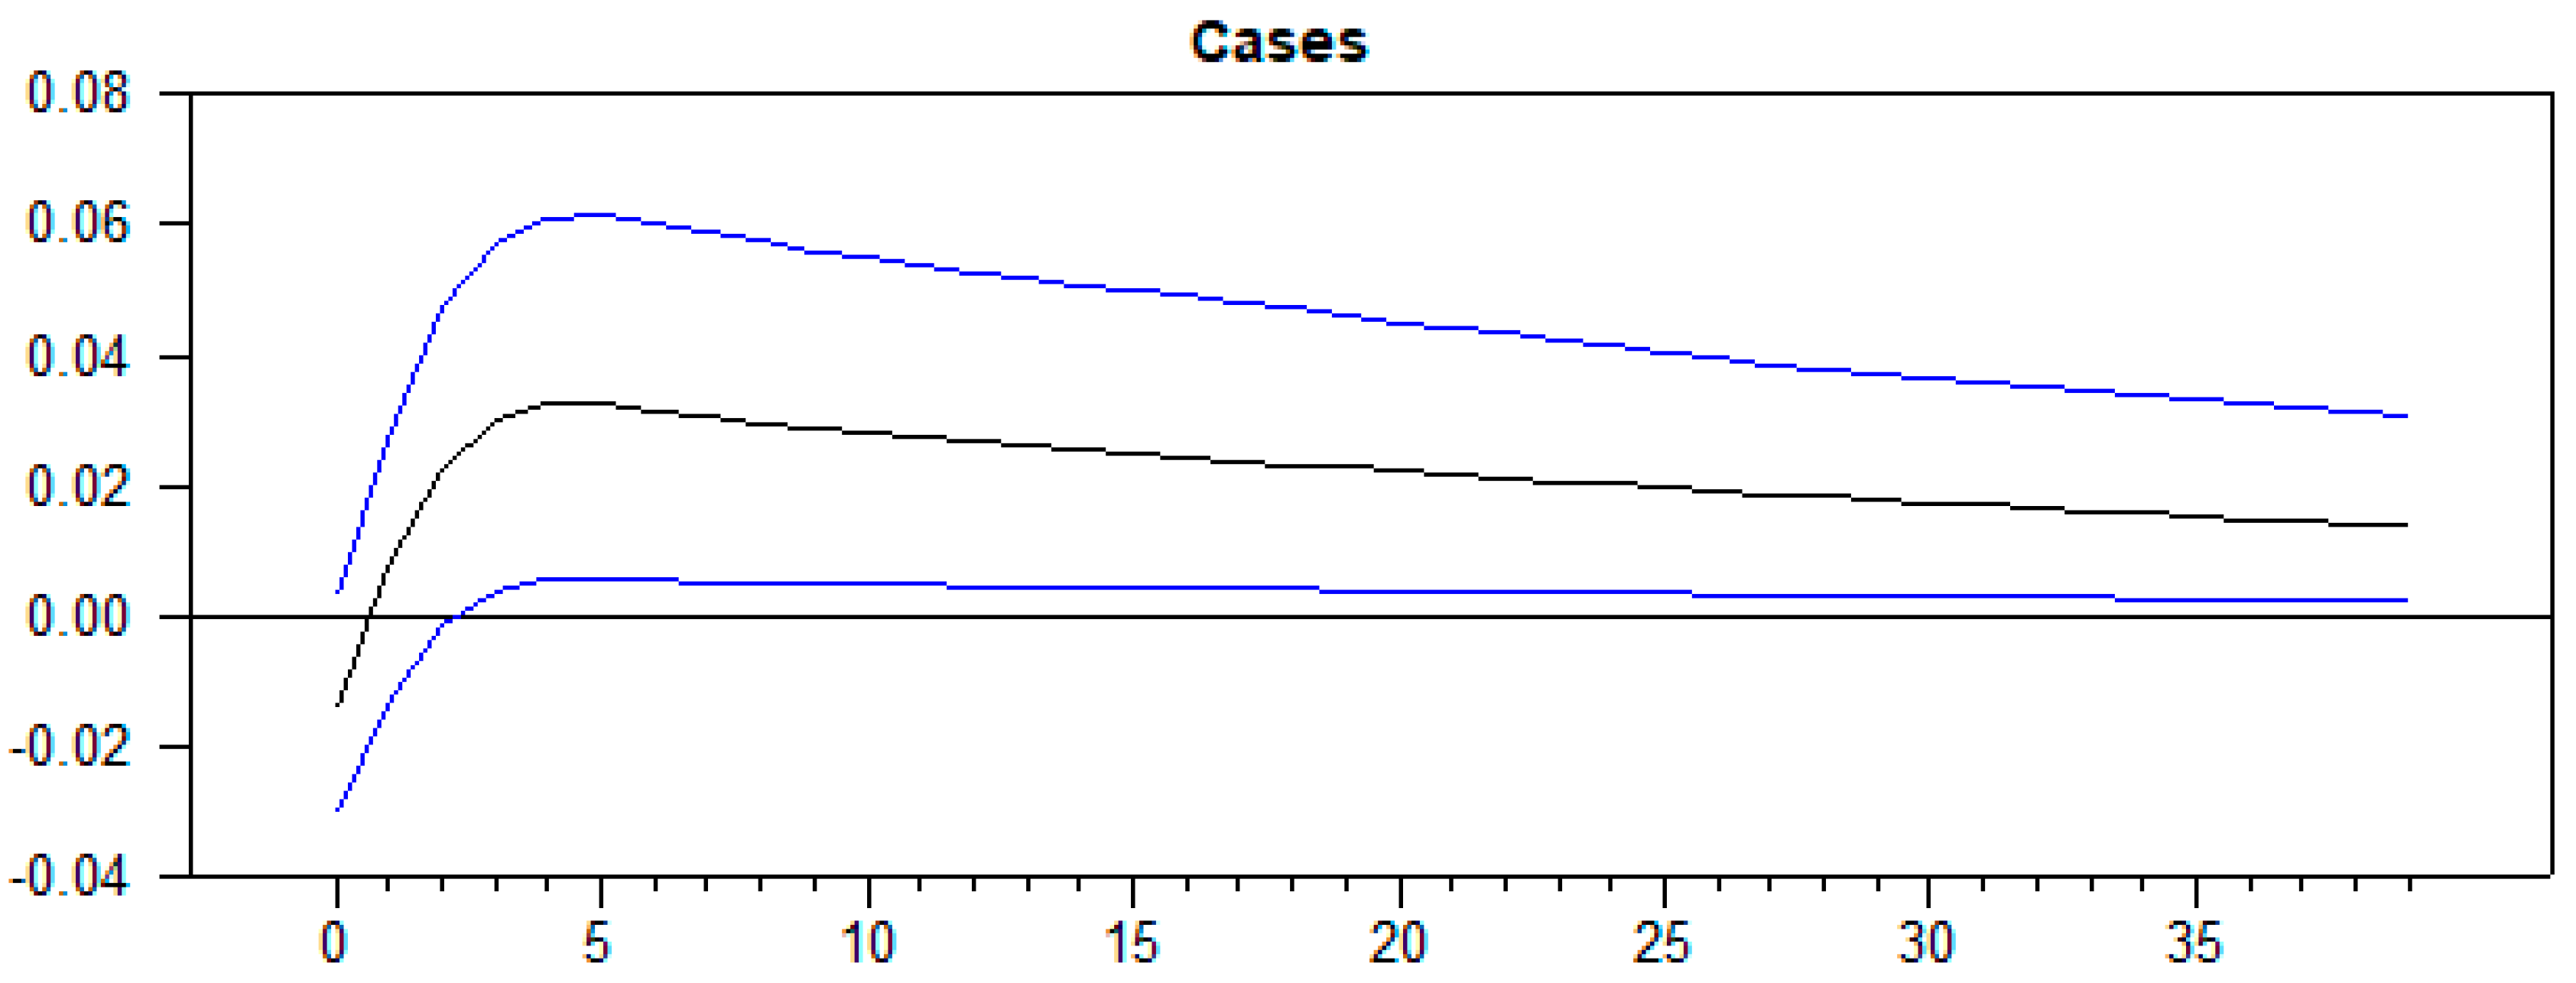
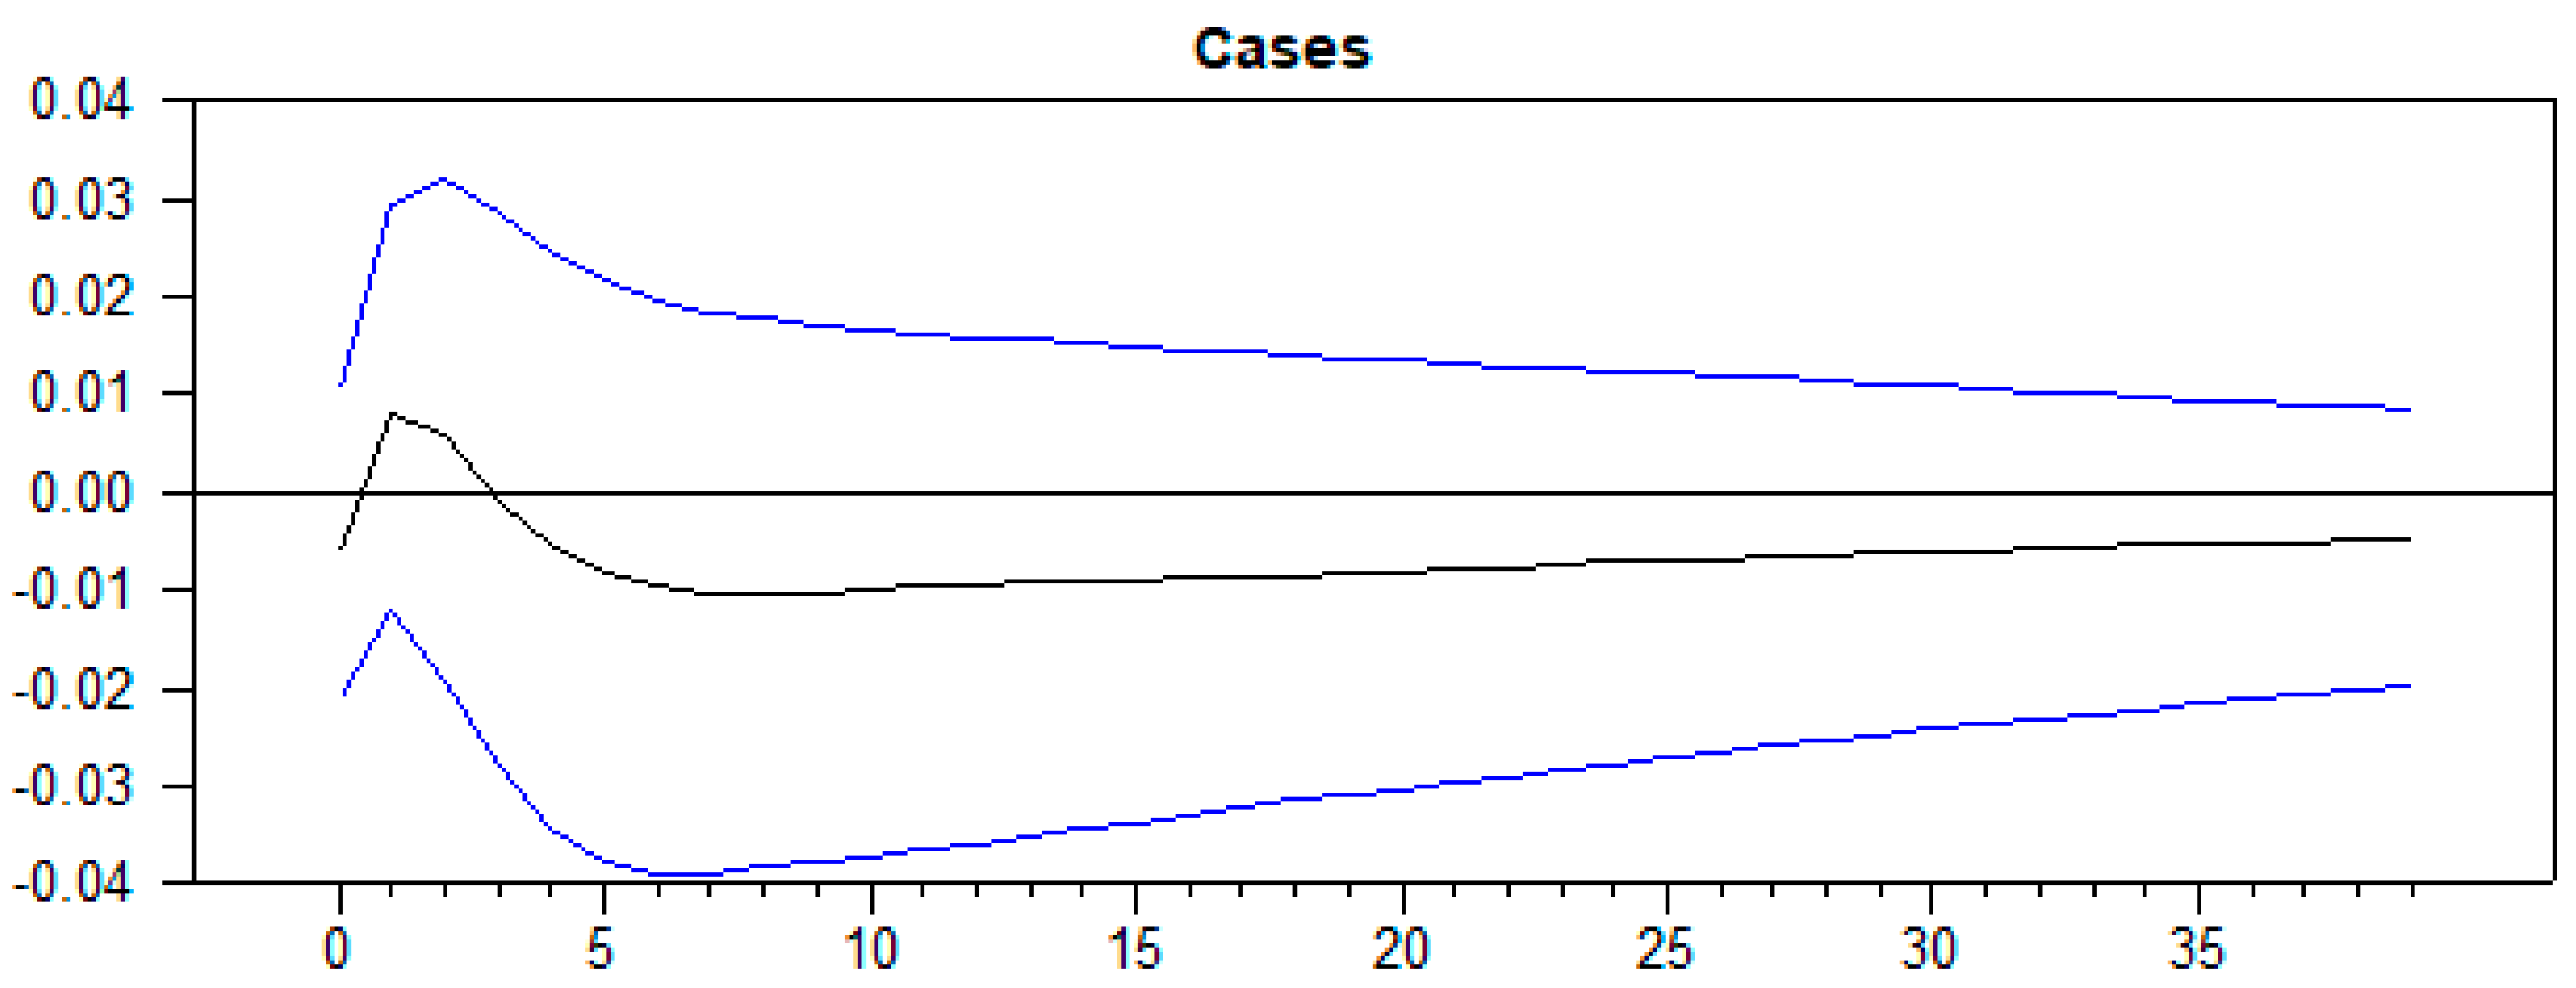
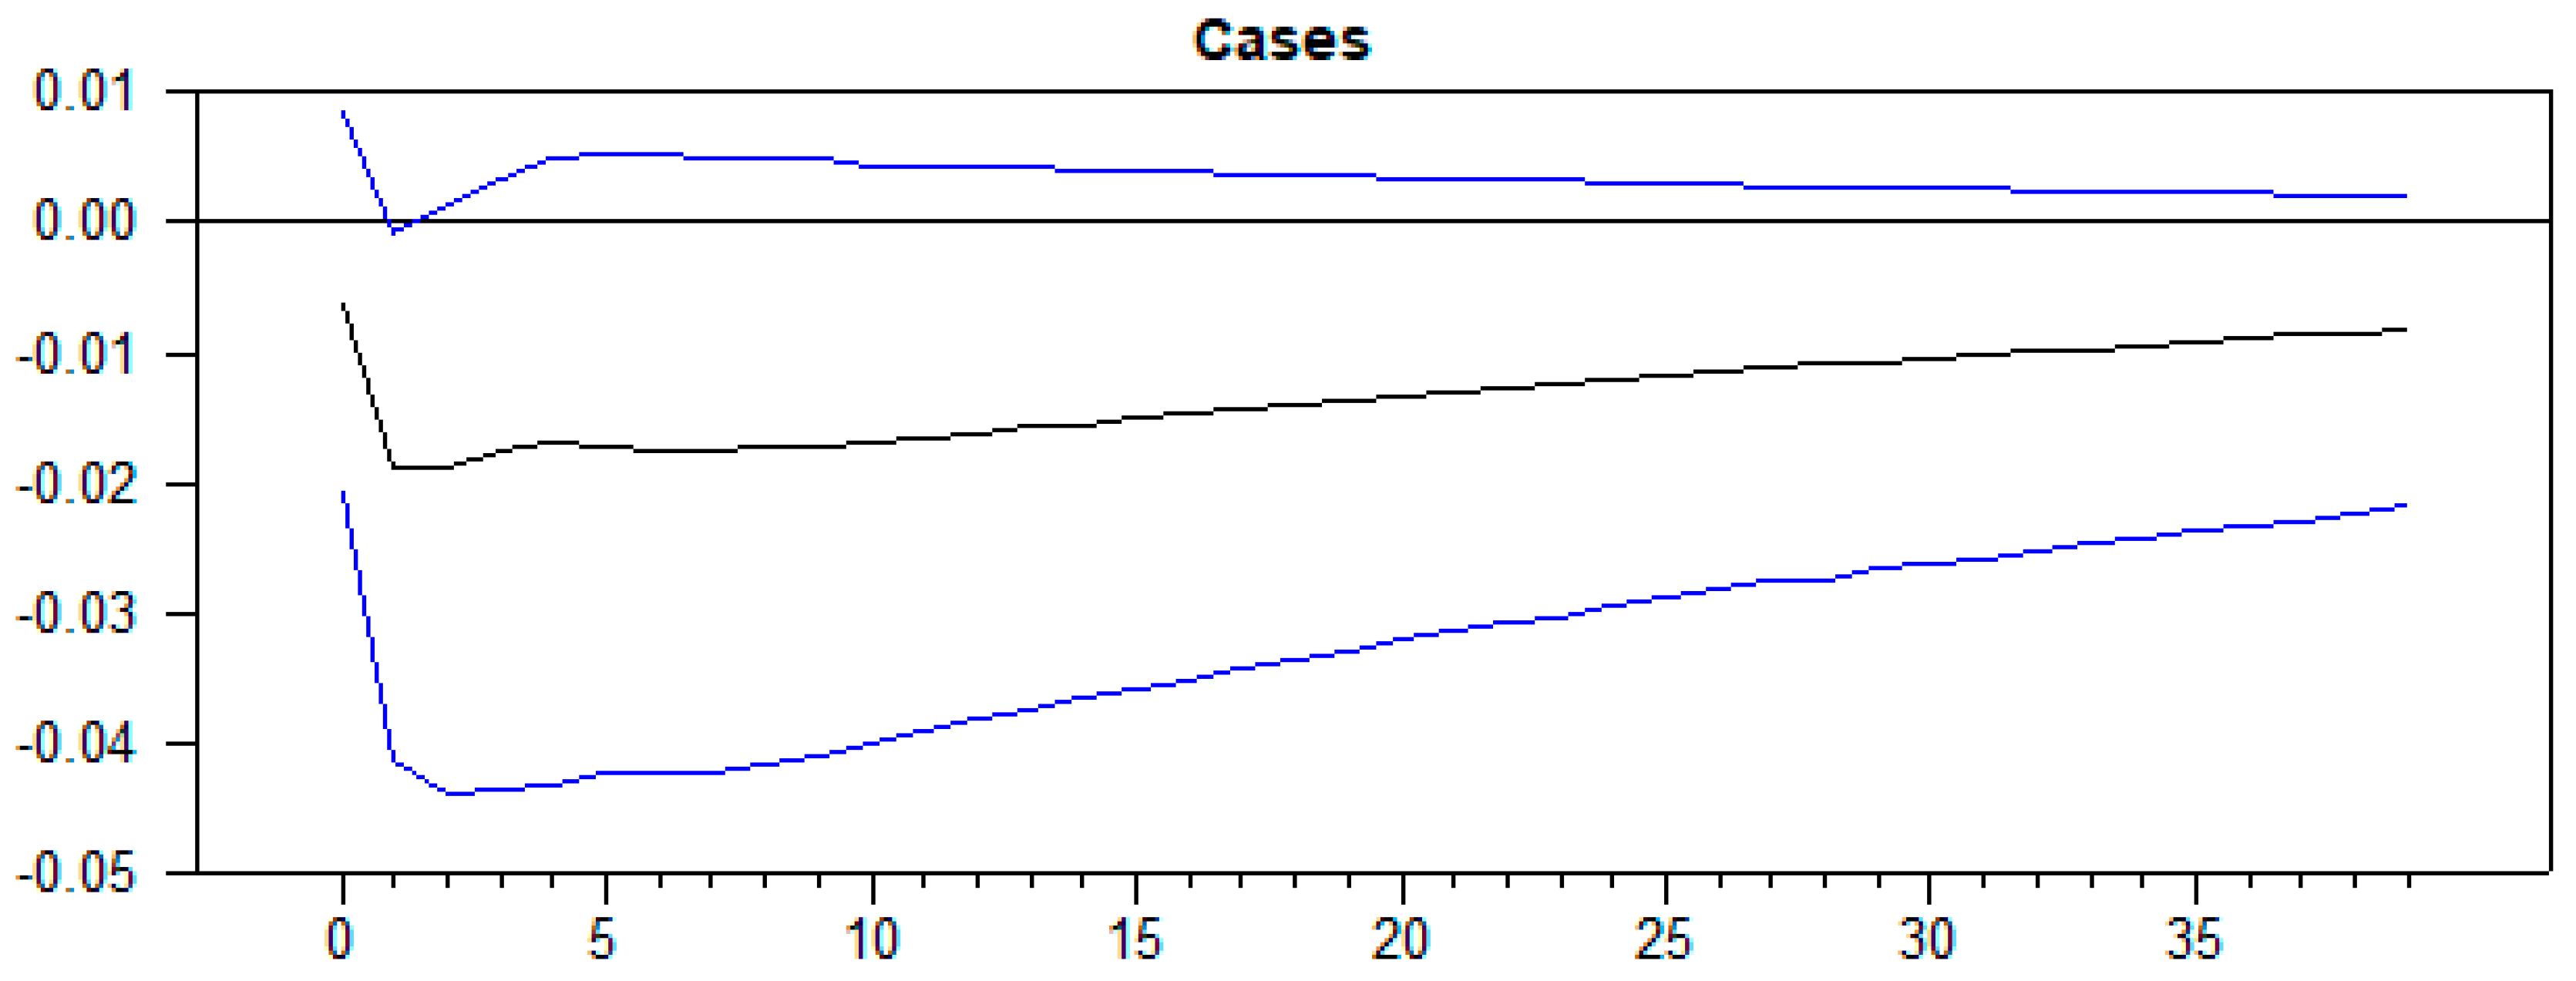
3. Results
4. Discussion
5. Conclusions
Author Contributions
Funding
Acknowledgments
Conflicts of Interest
References
- Murray, C.J. Forecasting COVID-19 impact on hospital bed-days, ICU-days, ventilator-days and deaths by US state in the next 4 months. MedRxiv 2020. [Google Scholar] [CrossRef] [Green Version]
- WHO. Statement on the Second Meeting of the International Health Regulations (2005) Emergency Committee Regarding the Outbreak of Novel Coronavirus (2019-nCoV), World Health Organization. 30 January 2020. Available online: https://www.who.int/news-room/detail/30-01-2020-statement-on-the-second-meeting-of-the-international-health-regulations-(2005)-emergency-committee-regarding-the-outbreak-of-novel-coronavirus-(2019-ncov) (accessed on 2 April 2020).
- Chen, L.; Liu, W.; Zhang, Q.; Xu, K.; Ye, G.; Wu, W.; Sun, Z.; Liu, F.; Wu, K.; Zhong, B.; et al. RNA based mNGS approach identifies a novel human coronavirus from two individual pneumonia cases in 2019 Wuhan outbreak. Emerg. Microbes Infect. 2020, 9, 313–319. [Google Scholar] [CrossRef] [PubMed]
- De Oliveira Neto, L.; Elsangedy, H.; Tavares, V.O.; Teixeira, C.; Da Silva-Grigoletto, M. Treinamento físico em casa durante a pandemia do COVID-19 (SARS-COV2): Abordagem fisiológica e comportamental. Rev. Bras. Fisiol. Exerc. 2020. [Google Scholar] [CrossRef]
- Park, S.E. Epidemiology, virology, and clinical features of severe acute respiratory syndrome-coronavirus-2 (SARS-CoV-2; Coronavirus Disease-19). Clin. Exp. Pediatr. 2020, 63, 119. [Google Scholar] [CrossRef] [PubMed] [Green Version]
- Chandrapalan, S.; Persaud, K.; Arasaradnam, R.P. Breath diagnostics in the era of SARS-CoV-2—Clinical and research arena. J. Breath Res. 2020, 14, 042002. [Google Scholar] [CrossRef] [PubMed]
- Fehr, A.R. Coronaviruses: An Overview of Their Replication and Pathogenesis; Humana Press: New York, NY, USA, 2015; Volume 1282. [Google Scholar]
- WHO. Coronavirus Disease 2019 (COVID-19) Situation Report—34. 23 February 2020. Available online: https://www.who.int/docs/default-source/coronaviruse/situation-reports/20200223-sitrep-34-covid-19.pdf?sfvrsn=44ff8fd3_2 (accessed on 2 May 2020).
- Kissler, S.M.; Tedijanto, C.; Goldstein, E.; Grad, Y.H.; Lipsitch, M. Projecting the transmission dynamics of SARS-CoV-2 through the postpandemic period. Science 2020, 368, 860–868. [Google Scholar] [CrossRef]
- Remuzzi, A.; Remuzzi, G. COVID-19 and Italy: What next? Lancet 2020, 395, 11–17. [Google Scholar] [CrossRef]
- Callaway, E. Time to use the p-word? Coronavirus enter dangerous new phase. Nature 2020, 579, 12. [Google Scholar] [CrossRef]
- Block, P.; Hoffman, M.; Raabe, I.J.; Dowd, J.B.; Rahal, C.; Kashyap, R.; Mills, M.C. Social network-based distancing strategies to flatten the COVID-19 curve in a post-lockdown world. Nat. Hum. Behav. 2020, 4, 588–596. [Google Scholar] [CrossRef]
- Schiavone, M.; Forleo, G.B.; Mitacchione, G.; Gasperetti, A.; Viecca, M.; Tondo, C. Quis custodiet ipsos custodes: Are we taking care of healthcare workers in the Italian Covid-19 outbreak? J. Hosp. Infect. 2020. [Google Scholar] [CrossRef]
- Ferguson, N.; Laydon, D.; Nedjati Gilani, G.; Imai, N.; Ainslie, K. Report 9: Impact of Non-Pharmaceutical Interventions (NPIs) to Reduce COVID-19 Mortality and Healthcare Demand. 16 March 2020. Available online: https://www.imperial.ac.uk/media/imperial-college/medicine/sph/ide/gida-fellowships/Imperial-College-COVID19-NPI-modelling-16-03-2020.pdf (accessed on 2 April 2020).
- Haynes, B.; Messonnier, N.E. Transcript for the CDC Telebriefing Update on COVID-19; For Immediate Release: Saturday, 29 February 2020; CDC: Atlanta, GA, USA, 2020. [Google Scholar]
- Lin, K.; Fong, D.Y.T.; Zhu, B.; Karlberg, J. Environmental factors on the SARS epidemic: Air temperature, passage of time and multiplicative effect of hospital infection. Epidemiol. Infect. 2006, 134, 223–230. [Google Scholar] [CrossRef] [PubMed] [Green Version]
- Sobral, M.F.F.; Duarte, G.B.; da Penha Sobral, A.I.G.; Marinho, M.L.M.; Souza Melo, A. Association between climate variables and global transmission of SARS-CoV-2. Sci. Total Environ. 2020, 729, 138997. [Google Scholar] [CrossRef]
- Ma, Y.; Zhao, Y.; Liu, J.; He, X.; Wang, B. Effects of temperature variation and humidity on the death of COVID-19 in Wuhan, China. Sci. Total Environ. 2020, 724, 138226. [Google Scholar] [CrossRef]
- OpenJS Foundation. 15 March 2020. Available online: https://nodejs.org/en/ (accessed on 6 April 2020).
- NOAA. Climate Data Online: Web Services Documentation. Available online: https://www.ncdc.noaa.gov/cdo-web/webservices/v2 (accessed on 6 April 2020).
- CDC. Cases in the U.S. Centers for Disease Control and Prevention. 6 April 2020. Available online: https://www.cdc.gov/coronavirus/2019-ncov/cases-updates/cases-in-us.html (accessed on 6 April 2020).
- NYT. Coronavirus in the U.S.: Latest Map and Case Count. The New York Times. 6 April 2020. Available online: https://www.nytimes.com/interactive/2020/us/coronavirus-us-cases.html (accessed on 6 April 2020).
- USDA. County FIPS Codes. Available online: https://www.nrcs.usda.gov/wps/portal/nrcs/detail/national/home/?cid=nrcs143_013697 (accessed on 6 April 2020).
- NYT. Nytimes/COVID-19-Data. The New York Times. 6 April 2020. Available online: https://github.com/nytimes/covid-19-data/blob/master/us-counties.csv (accessed on 6 April 2020).
- Sims, C.A. Macroeconomics and Reality. Econometrica 1980, 48, 1–48. [Google Scholar] [CrossRef] [Green Version]
- Enders, W. Applied Econometric Time Series; John Wiley & Sons, Inc.: New York, NY, USA, 2014. [Google Scholar]
- WHO. Coronavirus disease (COVID-19) Situation Report—103. Genebra 2020, 1–15. [Google Scholar]
- Ficetola, G.F.; Rubolini, D. Climate affects global patterns of COVID-19 early outbreak dynamics. MedRxiv 2020. [Google Scholar] [CrossRef] [Green Version]
- Chan, K.H.; Peiris, J.S.; Lam, S.Y.; Poon, L.L.M.; Yuen, K.Y.; Seto, W.H. The effects of temperature and relative humidity on the viability of the SARS coronavirus. Adv. Virol. 2011, 2011, 1–7. [Google Scholar] [CrossRef]
- Park, J.E.; Son, W.S.; Ryu, Y.; Choi, S.B.; Kwon, O.; Ahn, I. Effects of temperature, humidity, and diurnal temperature range on influenza incidence in a temperate region. Influenza Other Respir. Viruses 2020, 14, 11–18. [Google Scholar] [CrossRef] [Green Version]
- Tan, J.; Mu, L.; Huang, J.; Yu, S.; Chen, B.; Yin, J. An initial investigation of the association between the SARS outbreak and weather: With the view of the environmental temperature and its variation. J. Epidemiol. Community Health 2005, 59, 186–192. [Google Scholar] [CrossRef] [Green Version]
- Chong, K.C.; Lee, T.C.; Bialasiewicz, S.; Chen, J.; Smith, D.W.; Choy, W.S. Association between meteorological variations and activities of influenza A and B across different climate zones: A multi-region modelling analysis across the globe. J. Infect. 2020, 80, 84–98. [Google Scholar] [CrossRef] [Green Version]
- Baud, D.; Qi, X.; Nielsen-Saines, K.; Musso, D.; Pomar, L.; Favre, G. Real estimates of mortality following COVID-19 infection. Lancet Infect. Dis. 2020, 20, P773. [Google Scholar] [CrossRef] [Green Version]
- Altman, N.; Krzywinski, M. Association, correlation and causation. Nat. Methods 2015, 2, 900. [Google Scholar] [CrossRef] [PubMed]
- Hajat, S.; Kosatky, T. Heat-related mortality: A review and exploration of heterogeneity. J. Epidemiol. Community Health 2010, 64, 753–760. [Google Scholar] [CrossRef]
- Bao, J.; Wang, Z.; Yu, C.; Li, X. The influence of temperature on mortality and its Lag effect: A study in four Chinese cities with different latitudes. BMC Public Health 2016, 1, 375. [Google Scholar] [CrossRef] [Green Version]


| Step 1 | Step 2 | Step 3 | |
|---|---|---|---|
| Source | USDA Natural Resources Conservation Service (USDA, Washington, DC, USA, 2020) | National Centers for Environmental Information (NCEI, Asheville, NC, USA) (NOAA, Washington, DC, USA, 2020) | Consolidated USDA (Washington, DC, USA) and NCEI (Asheville, NC, USA) data |
| Application | Nodejs (OpenJS Foundation, San Francisco, California, 2020) | C# 2 | Excel, CSV |
| Data | Counties FIPS 1 | Daily Average Temperature by county | Daily Average Temperature by county FIPS 1 |
| Model 1 | Model 2 | |||
|---|---|---|---|---|
| F-Stat | Significance | F-Stat | Significance | |
| Average Temperature | 3.4155 | 0.0686391 | 3.4556 | 0.0671830 |
| Precipitation | - | - | 1.9191 | 0.1702955 |
| Snow | - | - | 1.0645 | 0.3056946 |
| Number of cases | 19,666.4837 | 0.0000000 | 19,660.8558 | 0.0000000 |
| Model 1 | Model 2 | |||||
|---|---|---|---|---|---|---|
| Step | Average Temperature | Cases | Average Temperature | Precipitation | Snow | Cases |
| 1 | 2.406 | 97.594 | 1.278 | 0.129 | 0.287 | 98.306 |
| 10 | 3.911 | 96.089 | 5.192 | 0.390 | 2.403 | 92.015 |
| 20 | 4.780 | 95.220 | 5.935 | 0.514 | 2.582 | 90.969 |
| 30 | 5.051 | 94.949 | 6.163 | 0.552 | 2.638 | 90.648 |
| 40 | 5.173 | 94.827 | 6.266 | 0.569 | 2.663 | 90.502 |
Publisher’s Note: MDPI stays neutral with regard to jurisdictional claims in published maps and institutional affiliations. |
© 2020 by the authors. Licensee MDPI, Basel, Switzerland. This article is an open access article distributed under the terms and conditions of the Creative Commons Attribution (CC BY) license (http://creativecommons.org/licenses/by/4.0/).
Share and Cite
Melo, A.d.S.; Sobral, A.I.G.d.P.; Marinho, M.L.M.; Duarte, G.B.; Gomes, T.H.F.; Sobral, M.F.F. How Climate Variables Influence the Spread of SARS-CoV-19 in the United States. Sustainability 2020, 12, 9192. https://doi.org/10.3390/su12219192
Melo AdS, Sobral AIGdP, Marinho MLM, Duarte GB, Gomes THF, Sobral MFF. How Climate Variables Influence the Spread of SARS-CoV-19 in the United States. Sustainability. 2020; 12(21):9192. https://doi.org/10.3390/su12219192
Chicago/Turabian StyleMelo, André de Souza, Ana Iza Gomes da Penha Sobral, Marcelo Luiz Monteiro Marinho, Gisleia Benini Duarte, Thiago Henrique Ferreira Gomes, and Marcos Felipe Falcão Sobral. 2020. "How Climate Variables Influence the Spread of SARS-CoV-19 in the United States" Sustainability 12, no. 21: 9192. https://doi.org/10.3390/su12219192