Atmospheric Emission Changes and Their Economic Impacts during the COVID-19 Pandemic Lockdown in Argentina

 ,
,  , ,
, ,
Abstract
:1. Introduction
2. Literature Review
2.1. Atmospheric Emissions and Financial Crisis
2.2. COVID-19 Pandemic Lockdown vs. Improvement in Air Quality
3. Materials and Methods
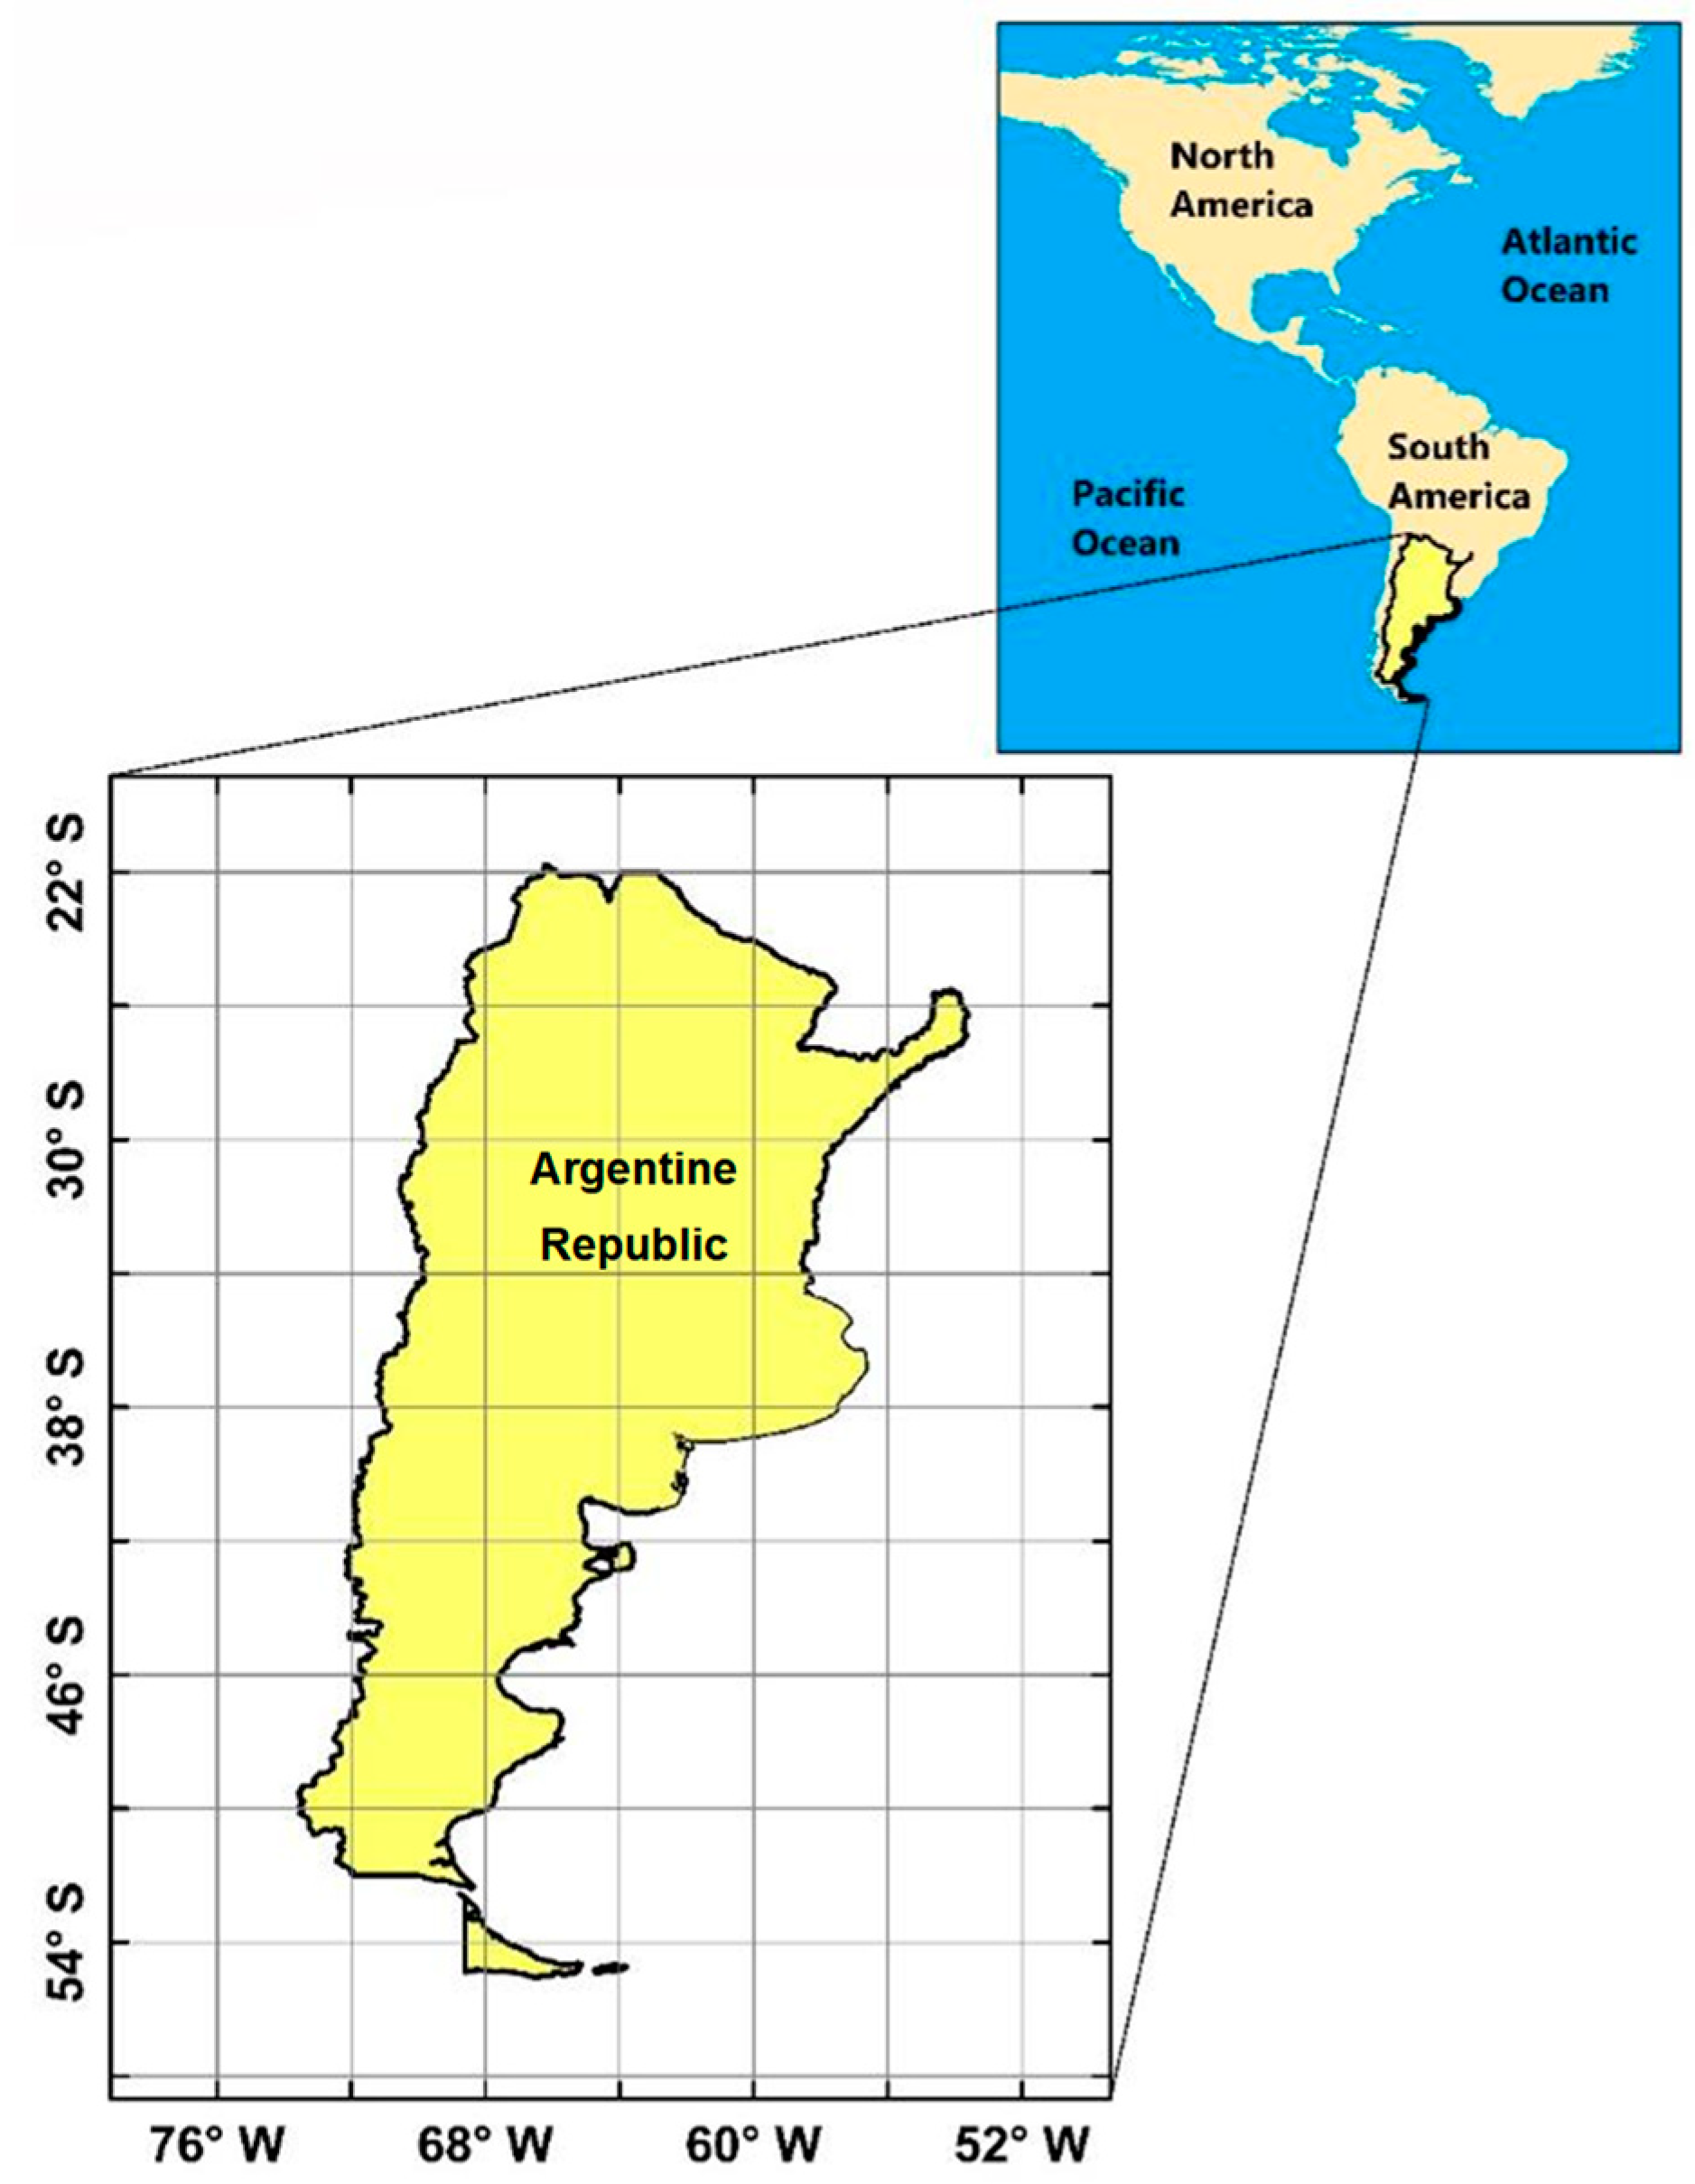
3.1. Study Area and Data Source
3.2. Emission Estimation
3.3. Economic Impact Analysis
4. Results and Discussion
4.1. COVID-19 Pandemic Lockdown in Argentina
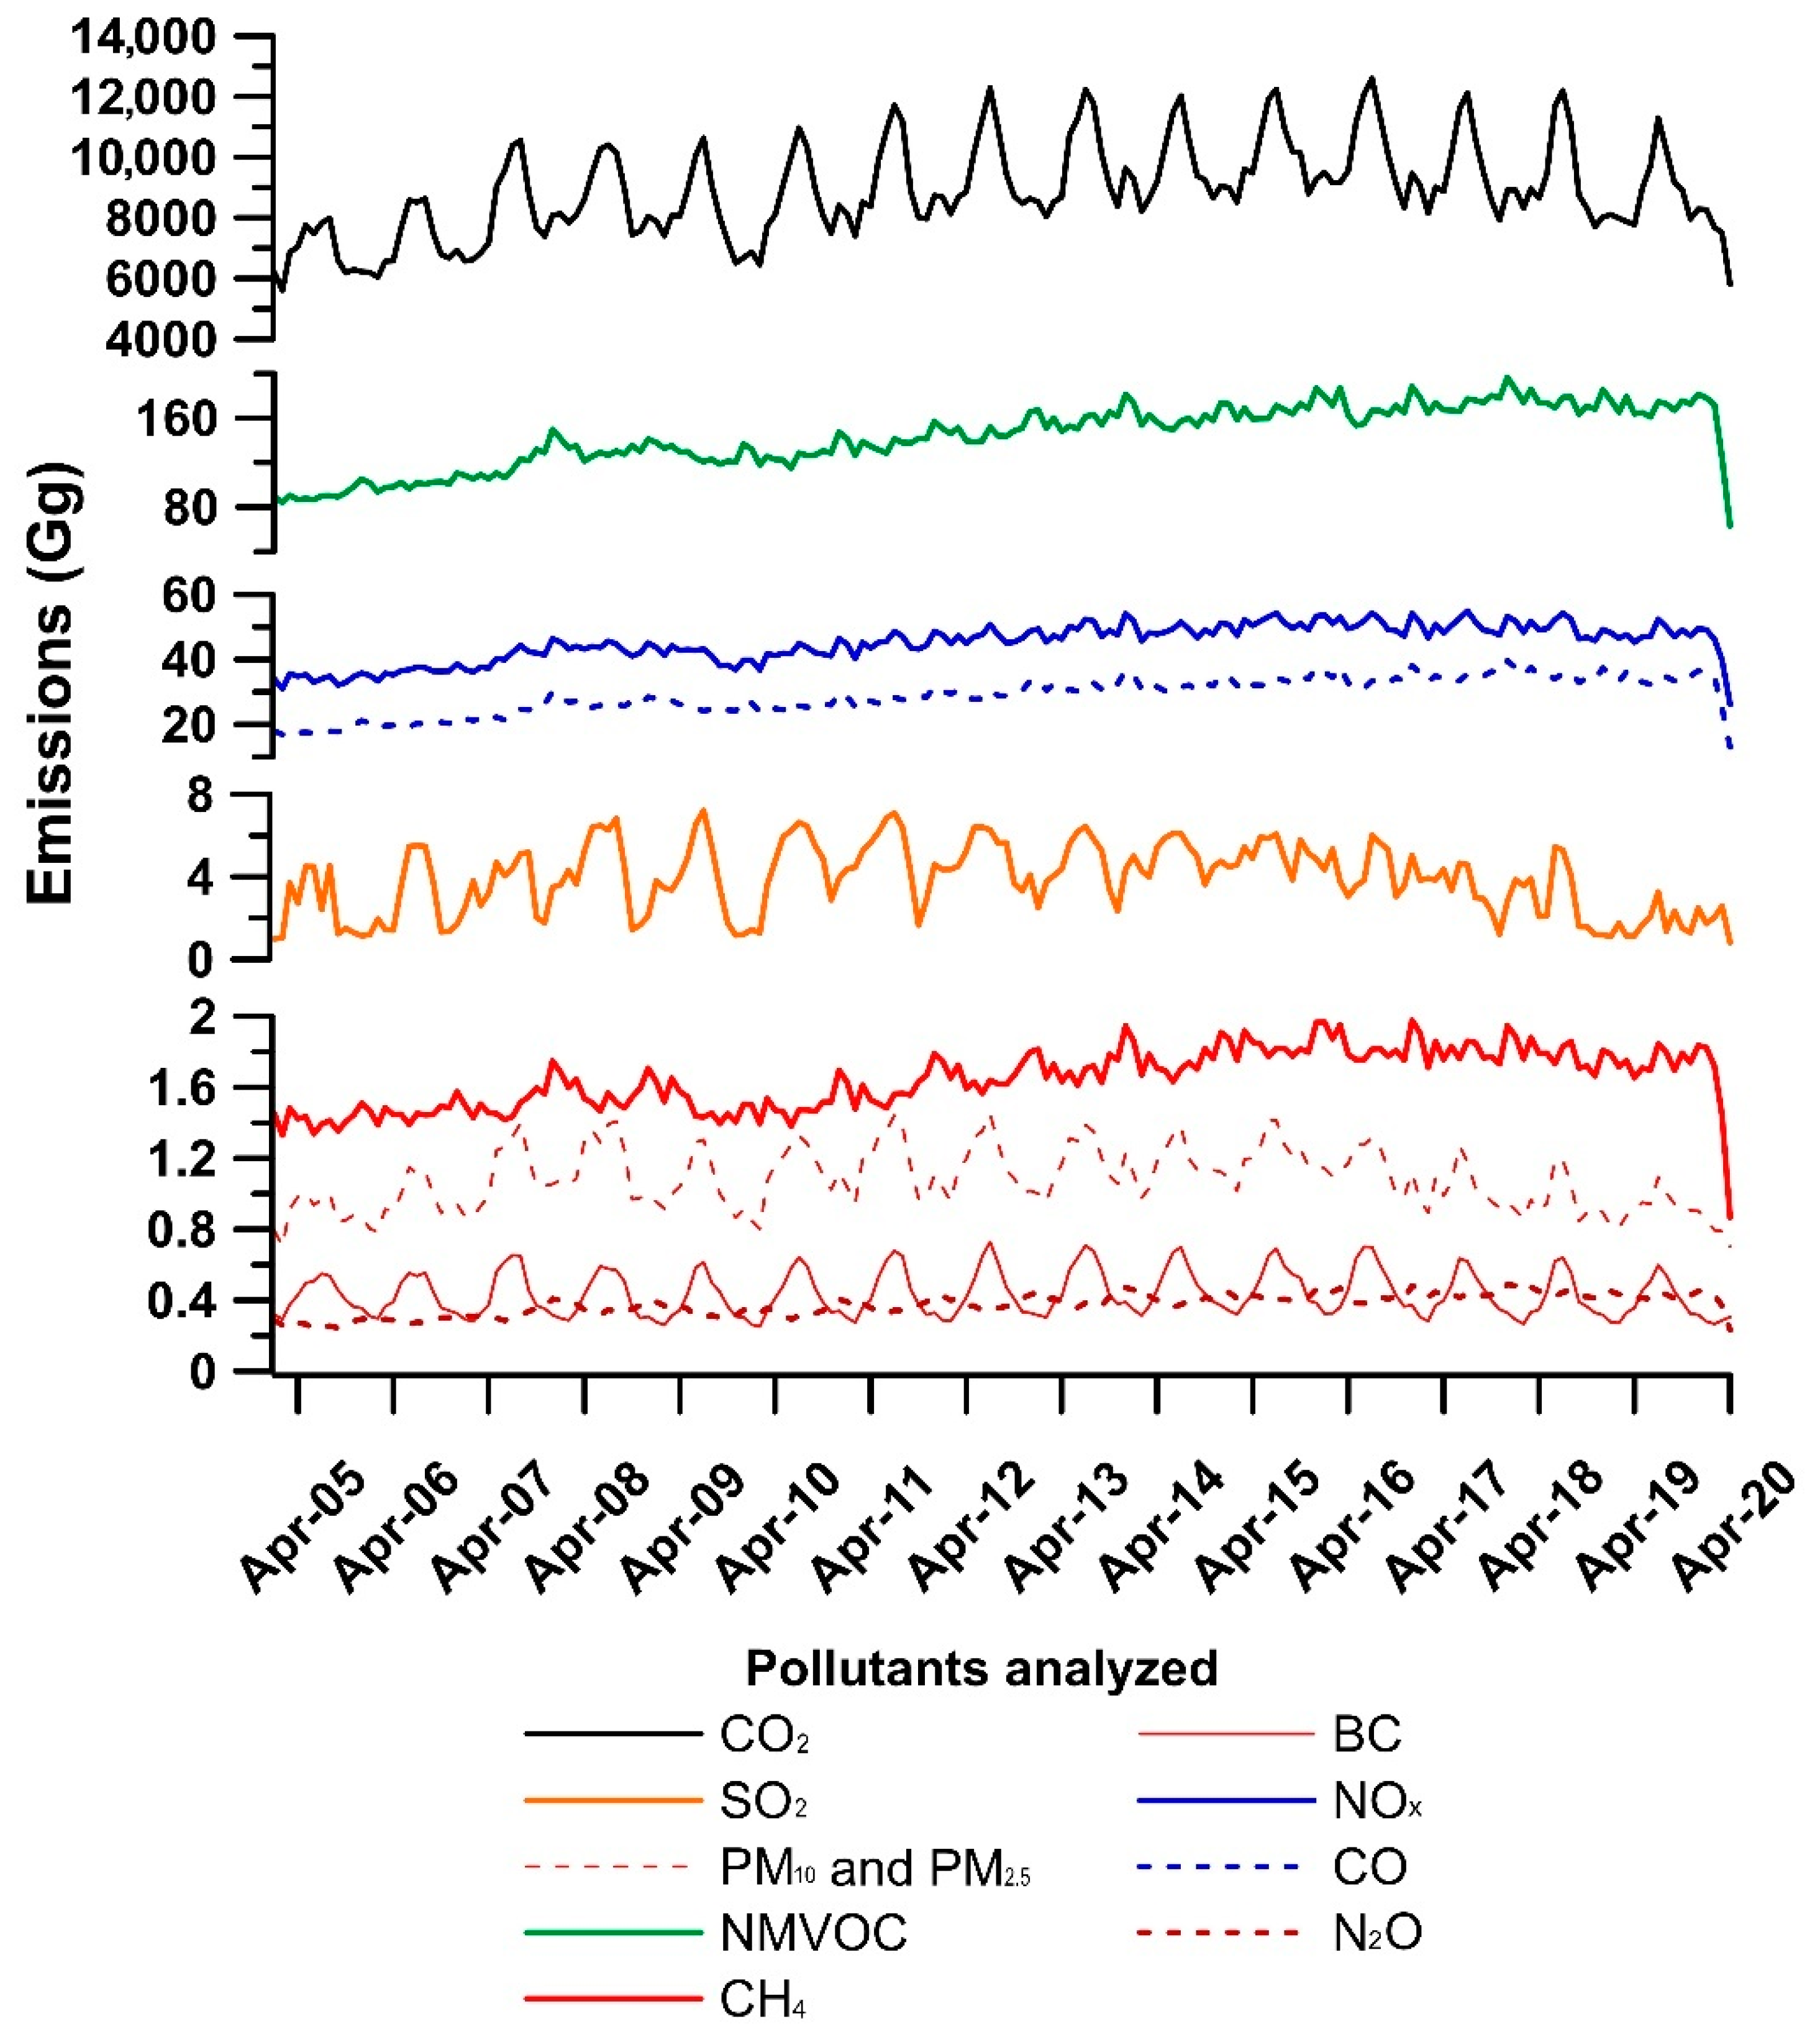
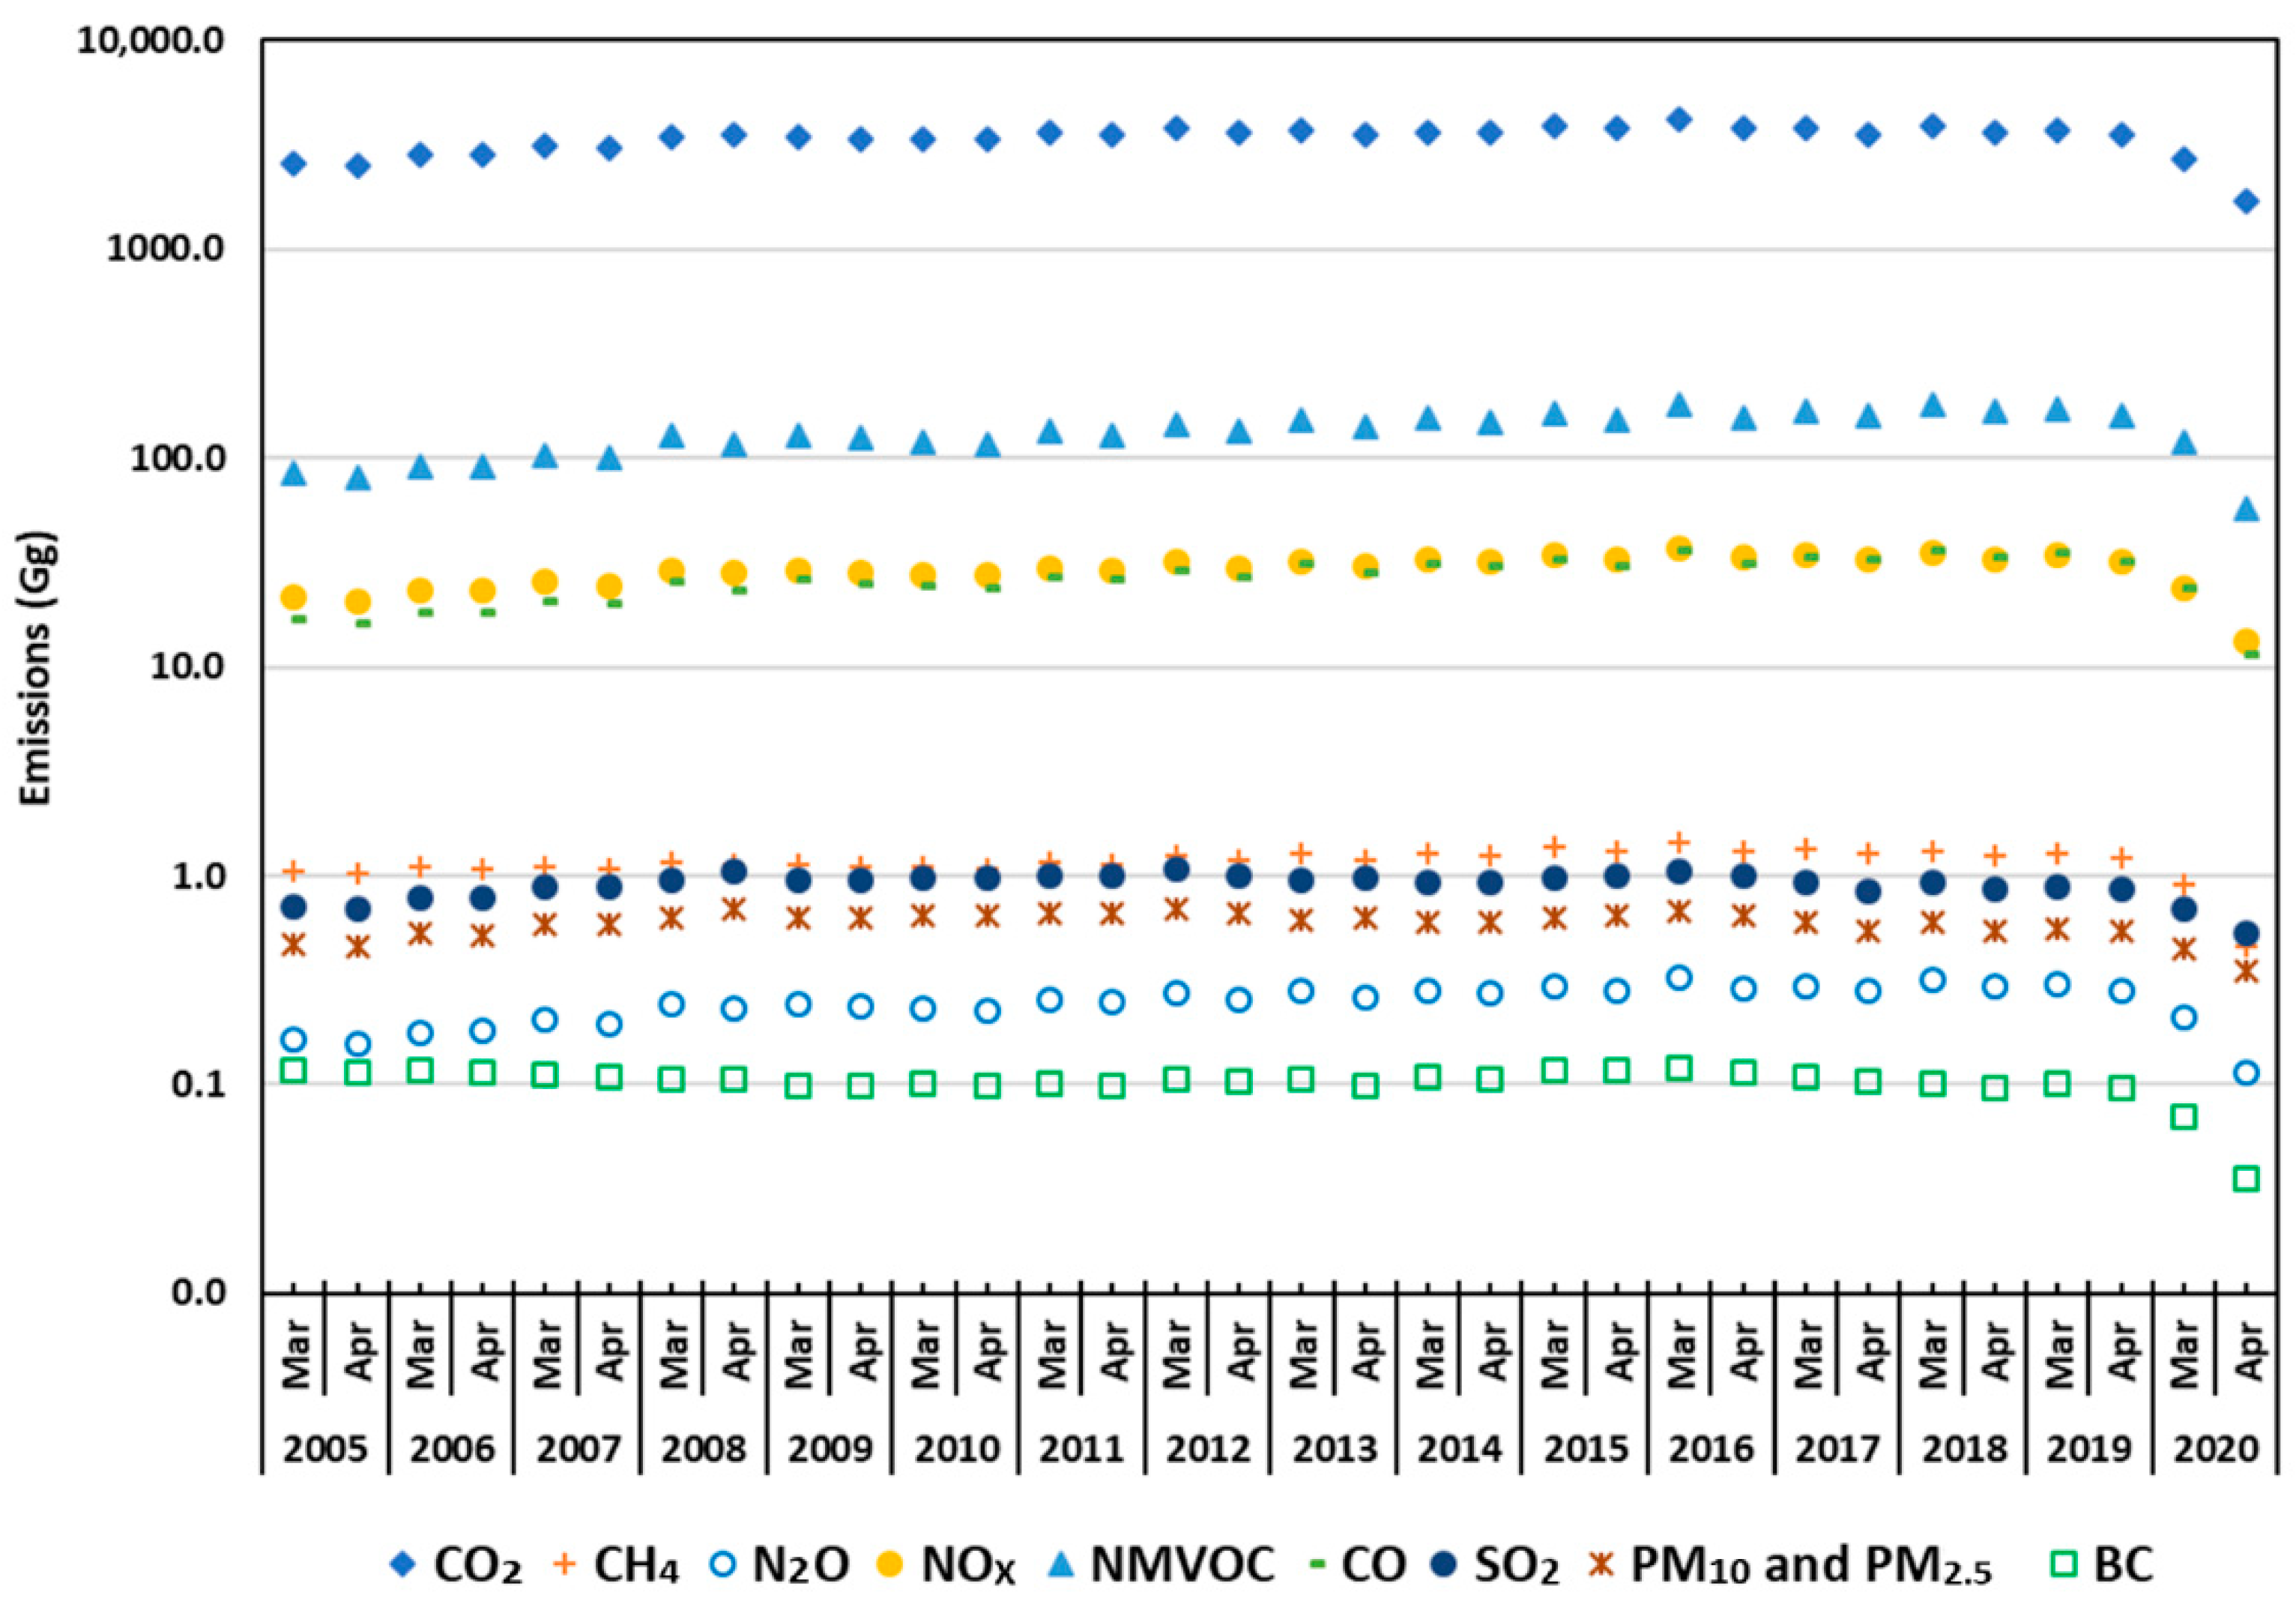
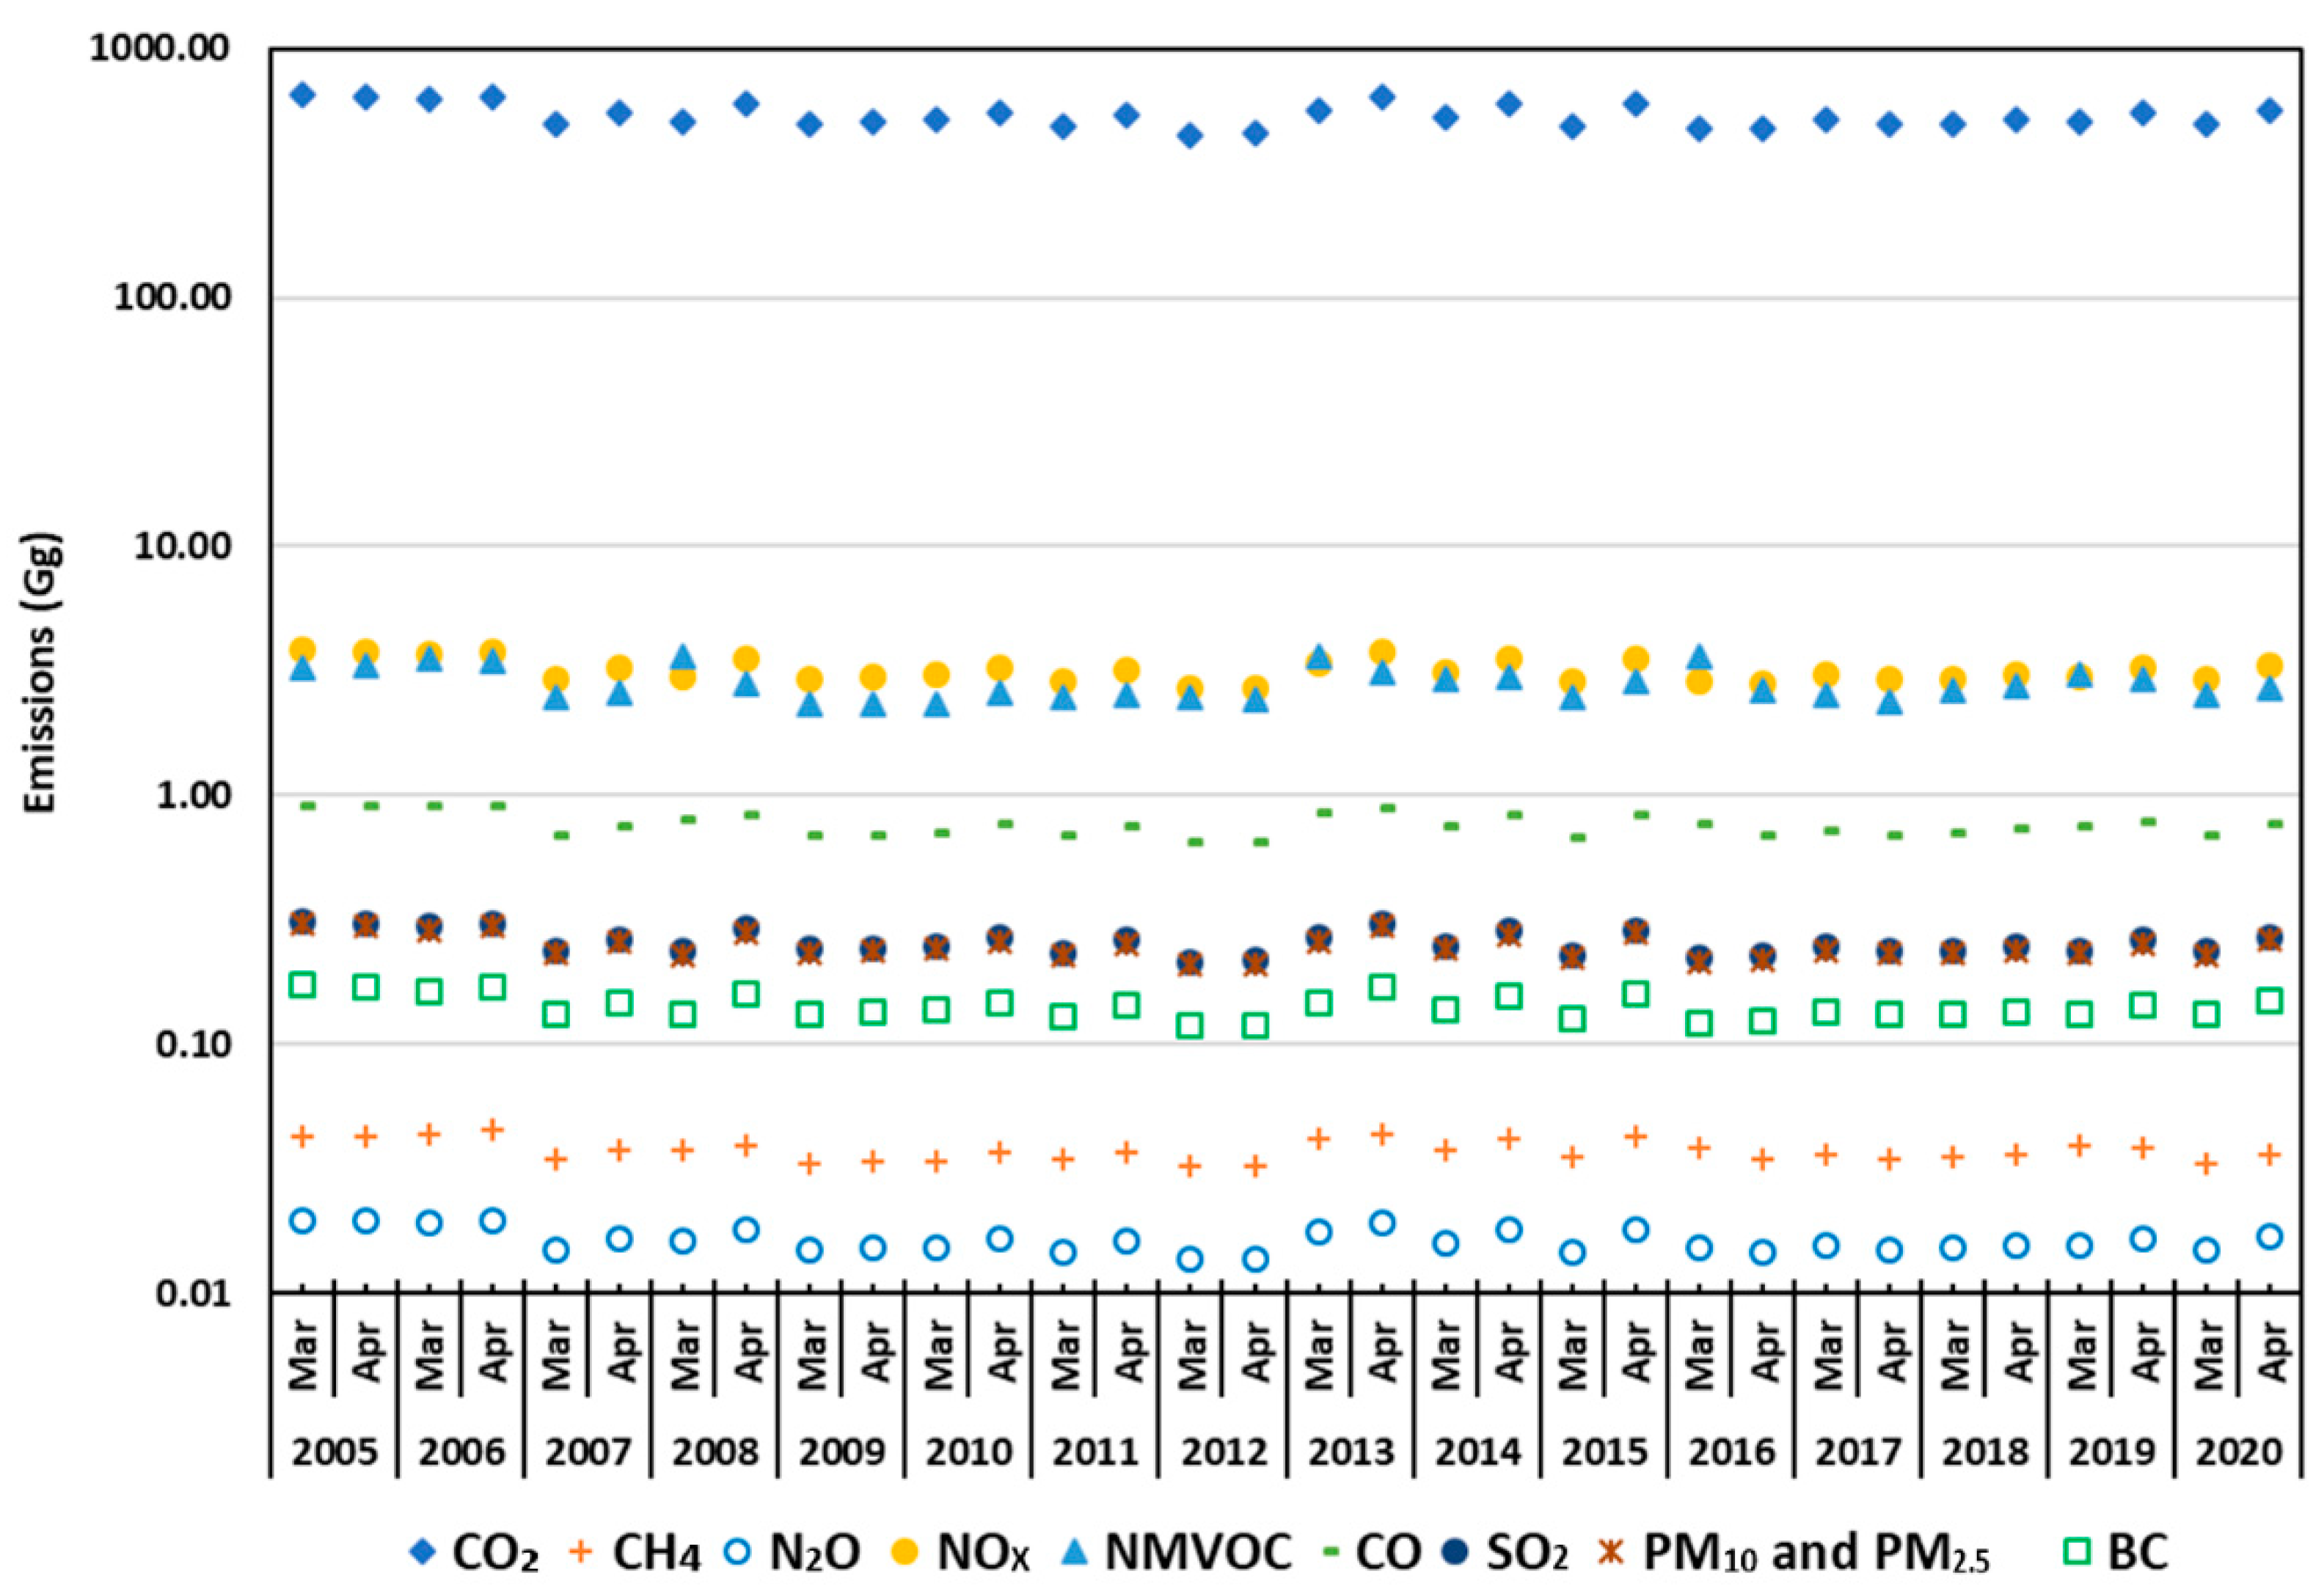
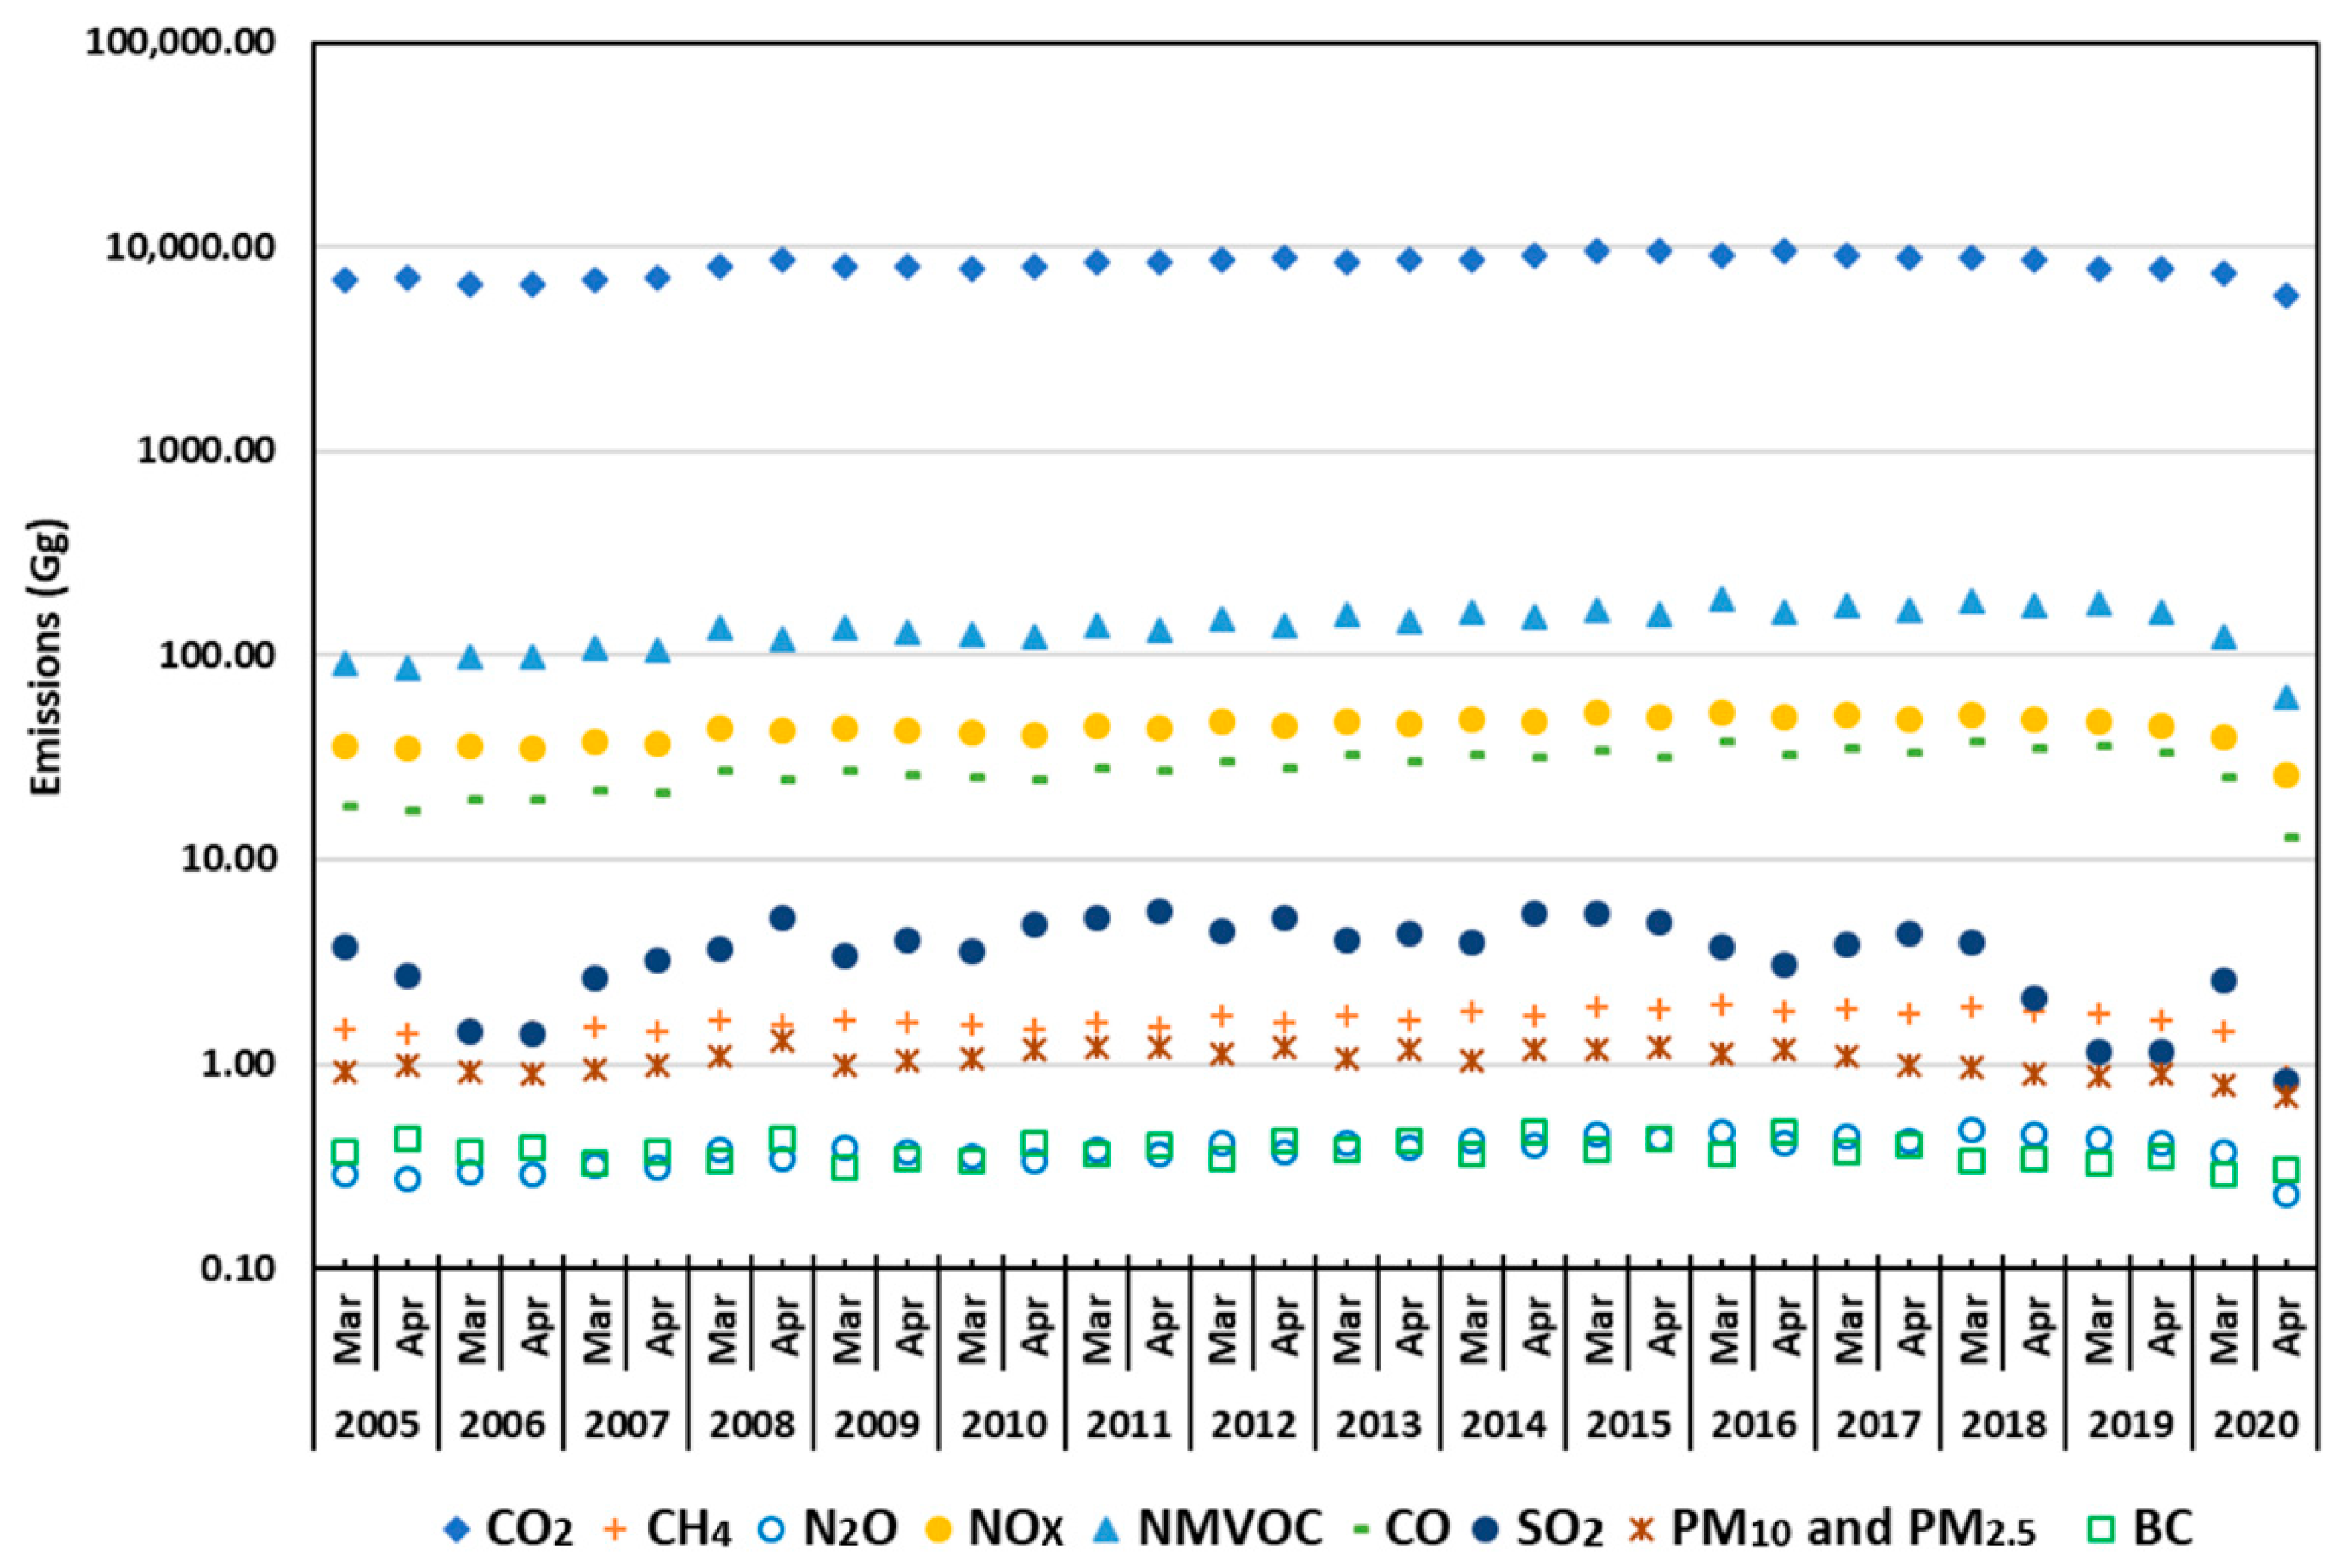
4.2. Monthly Variation of Emissions through COVID-19 Lockdown in Argentina
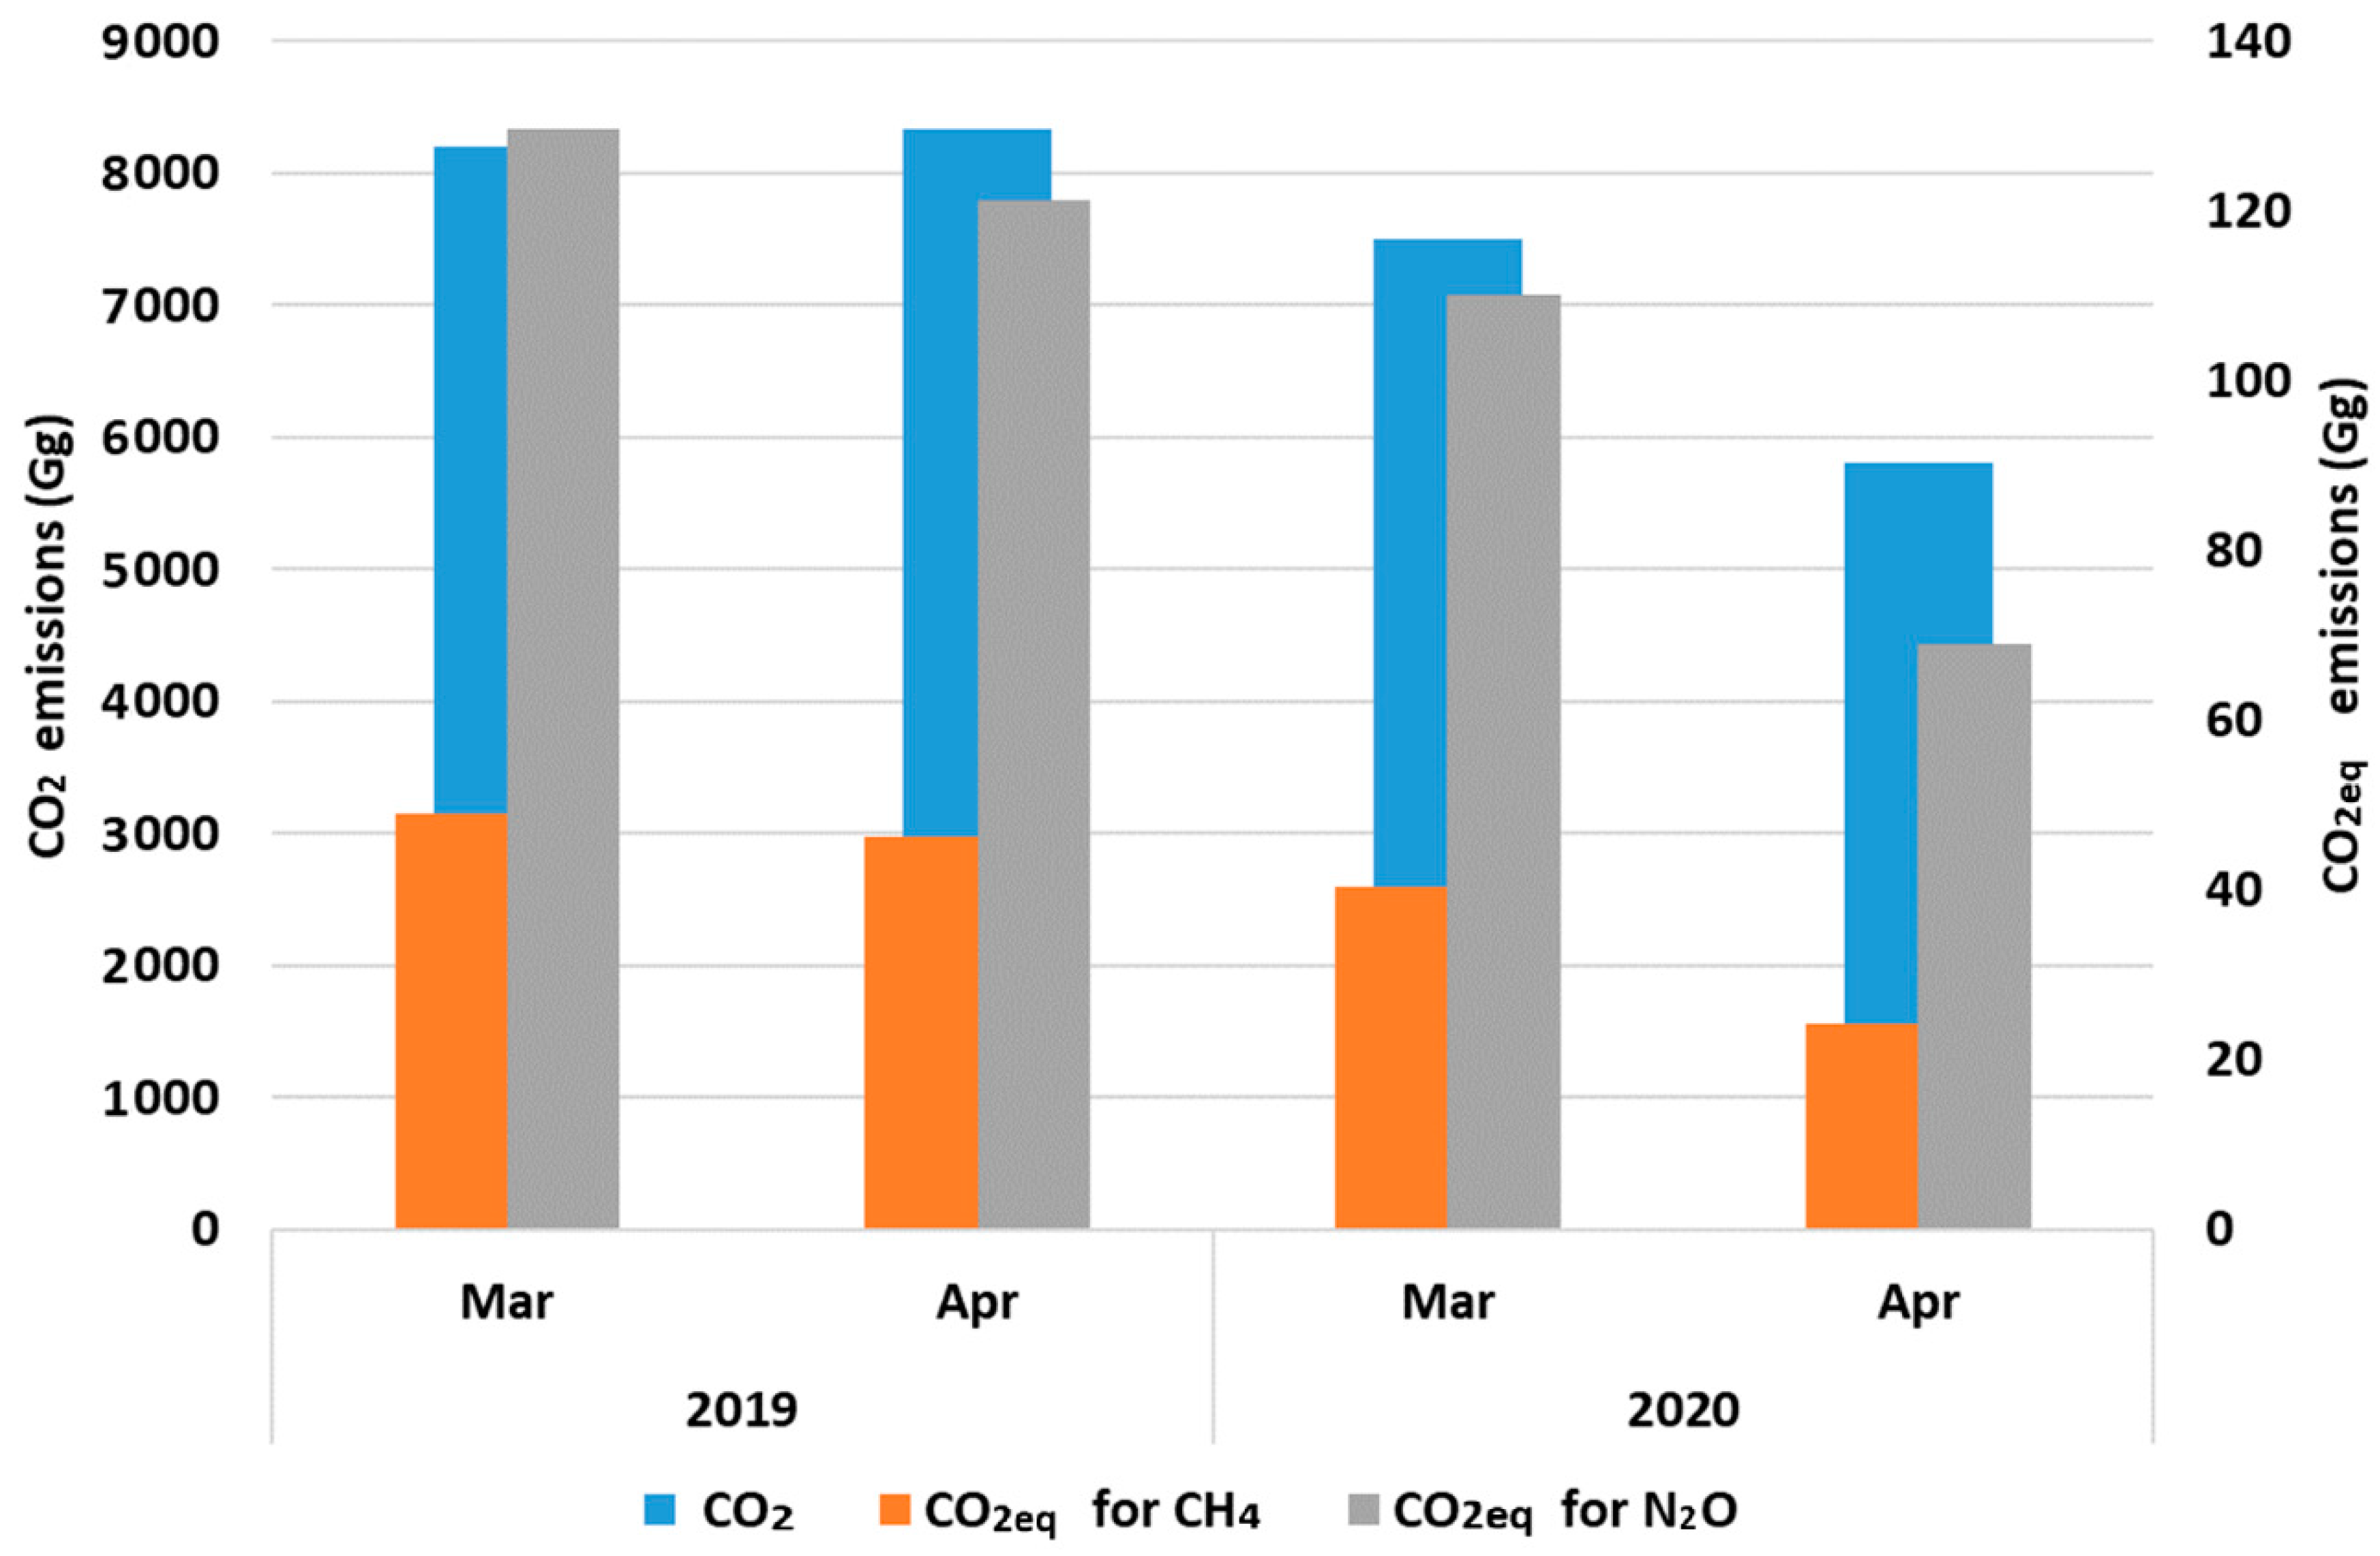
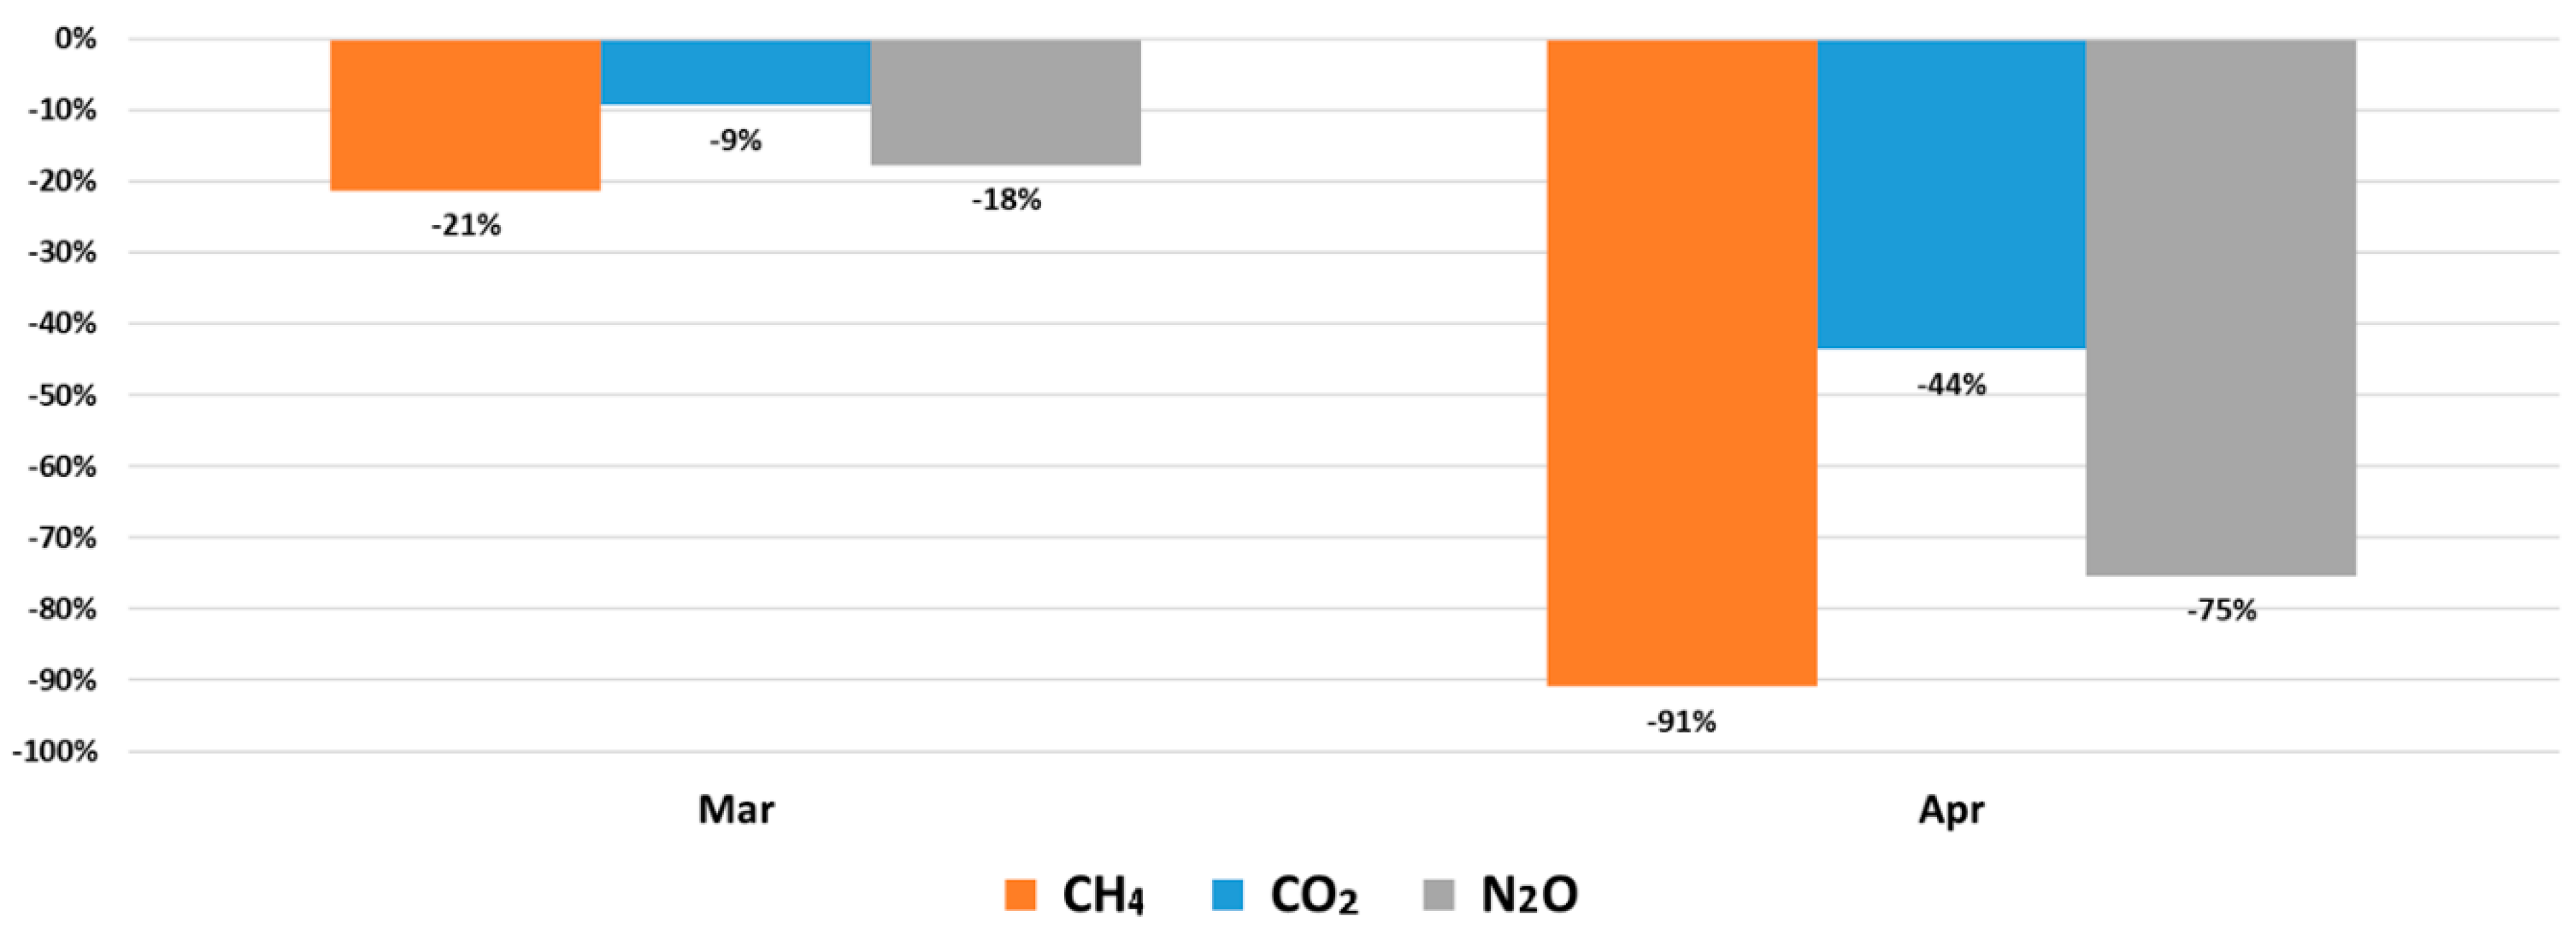
4.3. GHG Emission Reductions
4.4. Economic Impact of Emissions Changes in Argentina
4.5. Emissions Rate Variation and Air Quality Improvement on COVID-19 Pandemic Lockdown
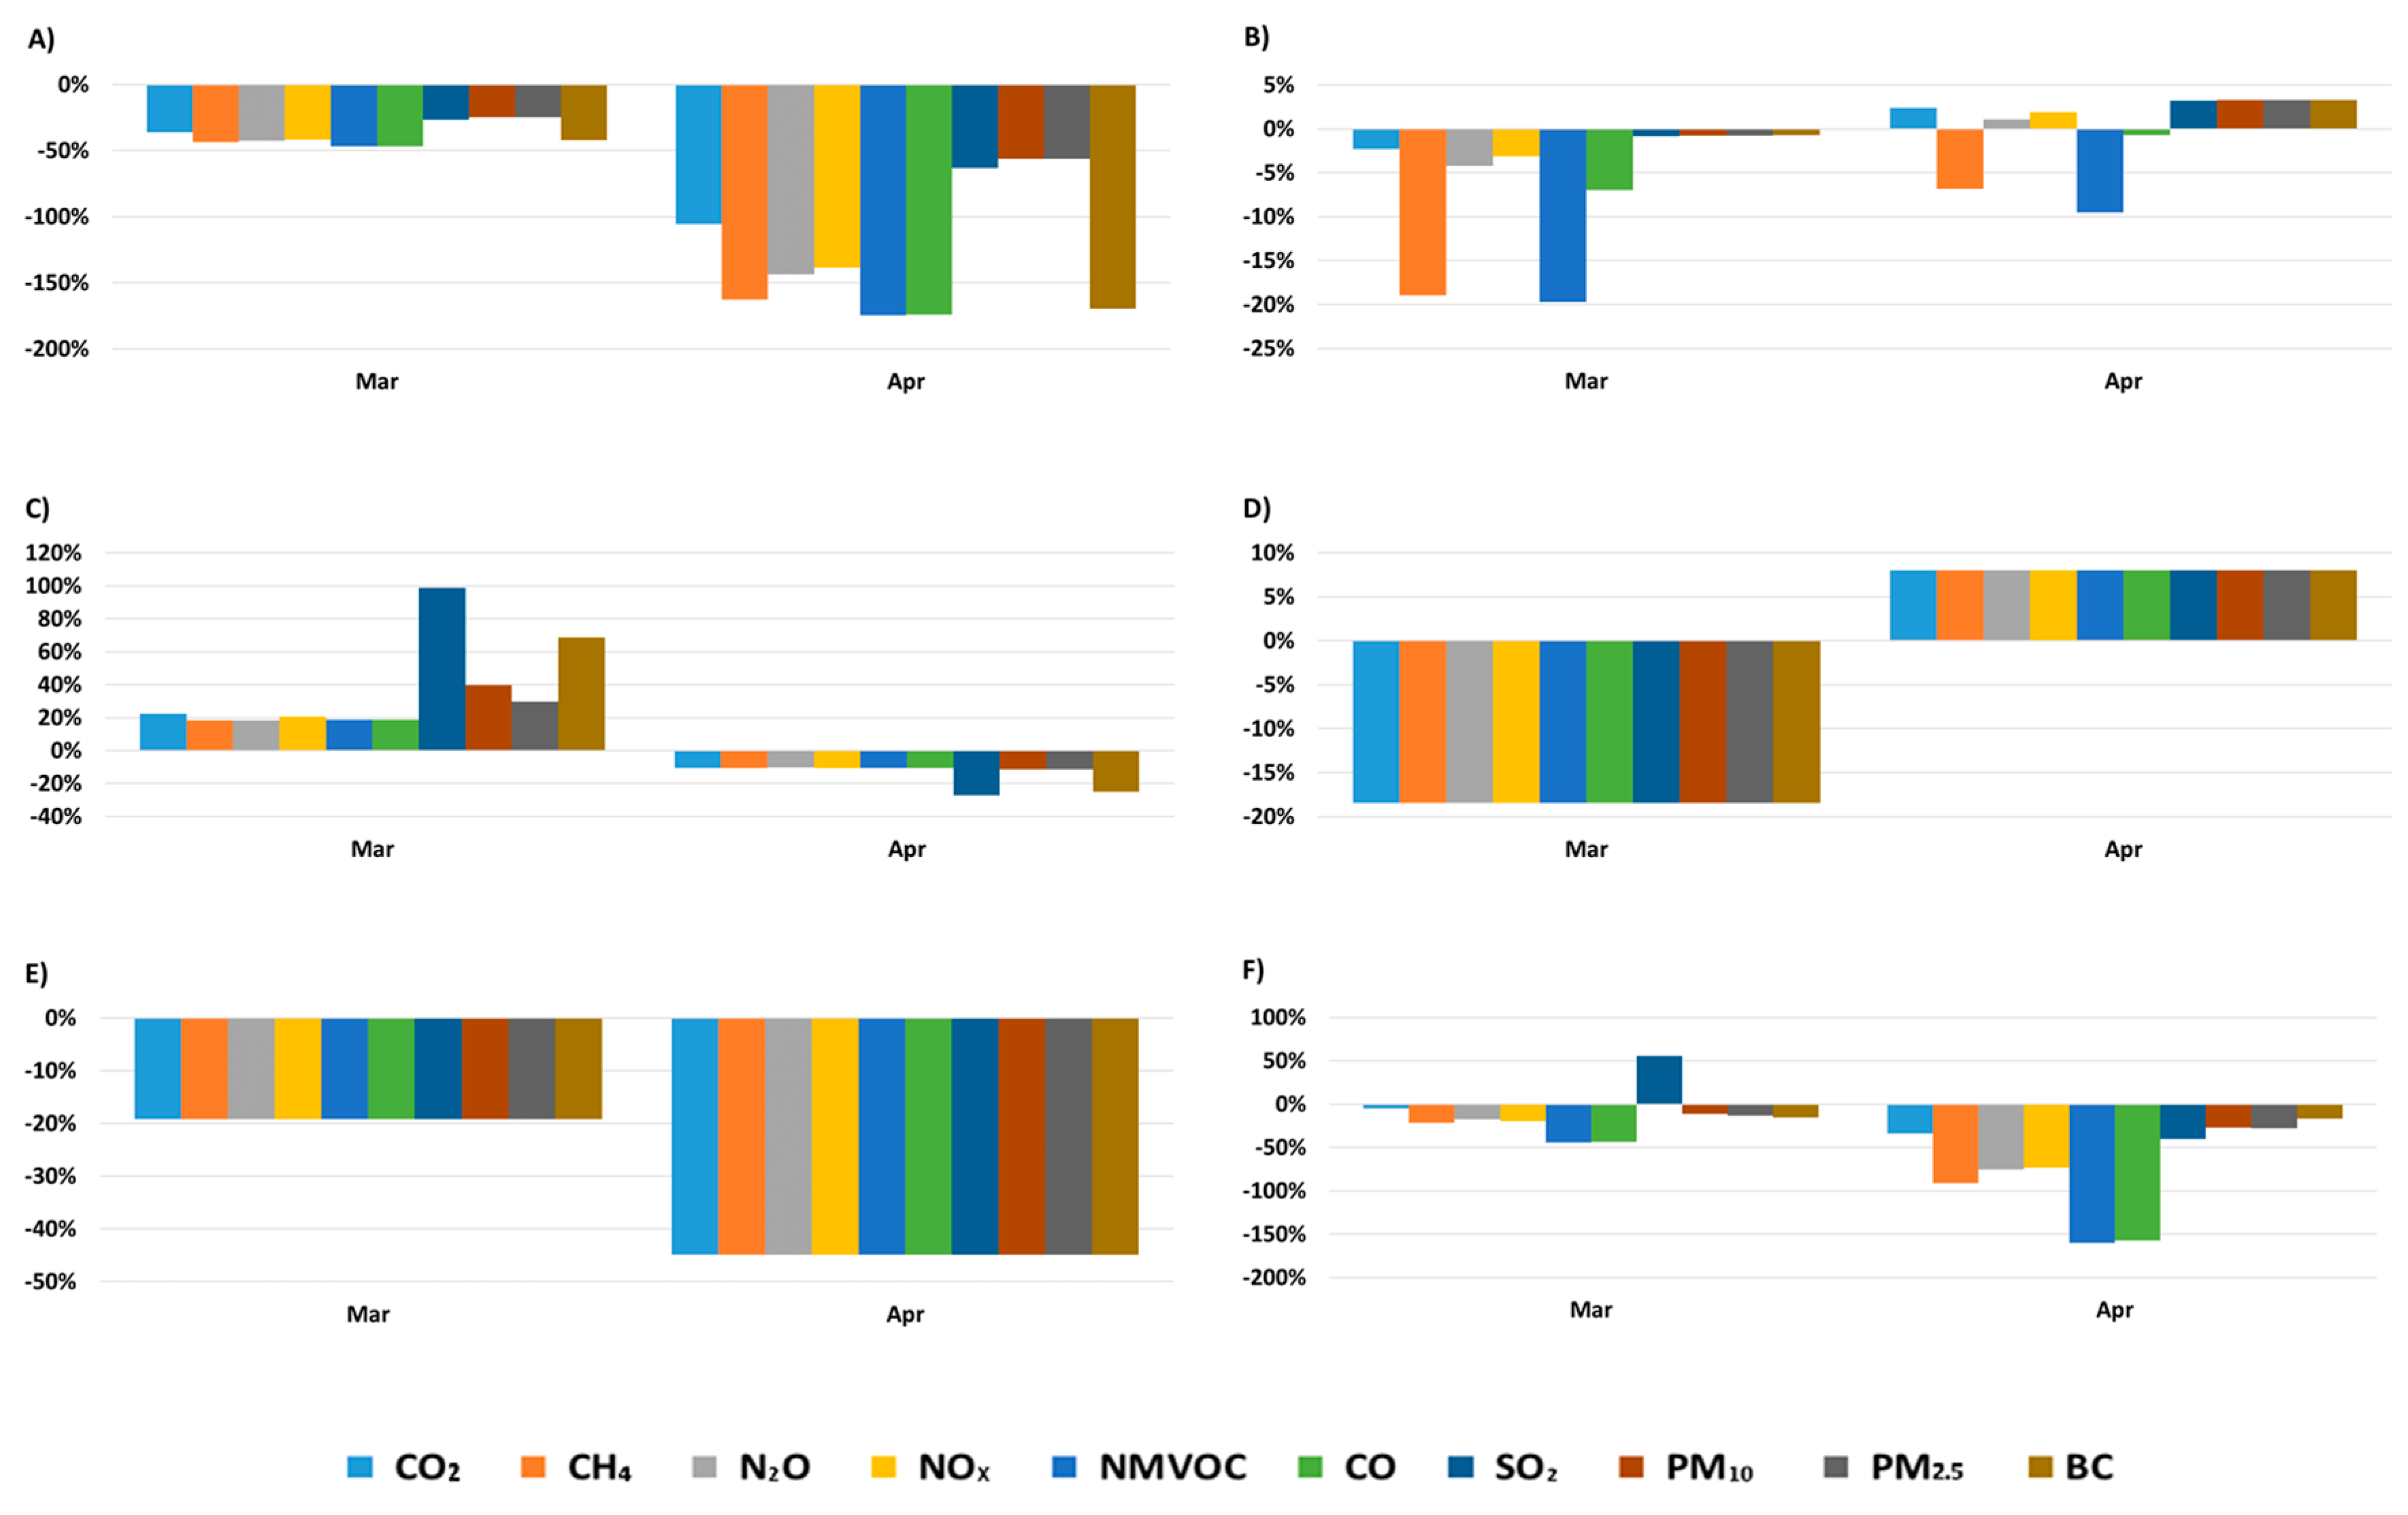
4.6. Emissions Changes
5. Conclusions and Outlook
Author Contributions
Funding
Acknowledgments
Conflicts of Interest
Appendix A

| Item | Description |
|---|---|
| Specific subject area | Estimation of atmospheric emissions from private road transport, freight, public transport, agriculture machines, thermal power plants, residential, commercial, and governmental sectors. |
| Type of data | Tables and figures |
| How data were acquired | Data collection of the monthly amount and type of production for each sector, and estimation through different methods. In addition, specific emission factors were applied for each sector for the calculation of the different polluting species [9,12,13,27,29]. |
| Data format | Raw and processed |
| Parameters for data collection | The data were estimated for the activity level recorded from January 2005 to April 2020 for each sector and polluting species (CO2, CH4, N2O, NOx, CO, NMVOC, SO2, PM10, PM2.5, and BC). |
| Data source location | Country: ArgentinaLatitude and longitude: 22° to 56°S latitude and from 52° to 75°W longitude |
| Data accessibility | With the article and a public repository:
|
| Sectors | Month | CO2 | CH4 | N2O | NOx | CO | NMVOC | SO2 | PM10 | PM2.5 | BC |
|---|---|---|---|---|---|---|---|---|---|---|---|
| Private road transport | March | –28% | –34% | –21% | –25% | –18% | –18% | –32% | –34% | –34% | –51% |
| April | –94% | –145% | –107% | –111% | –122% | –121% | –70% | –67% | –67% | –182% | |
| Freight, public transport, and agriculture machines | March | –5% | –12% | –6% | –5% | –13% | –7% | –4% | –4% | –4% | –4% |
| April | 0% | –7% | 0% | 0% | –4% | –1% | 1% | 1% | 1% | 1% | |
| Thermal power plants | March | 5% | 14% | 14% | 7% | 14% | 12% | –45% | –93% | –94% | –406% |
| April | –32% | –9% | –8% | –23% | –10% | –12% | –16097% | –304% | –250% | –2413% | |
| Residential sector | March | –7% | –7% | –7% | –7% | –7% | –7% | –7% | –7% | –7% | –7% |
| April | –2% | –2% | –2% | –2% | –2% | –2% | –2% | –2% | –2% | –2% | |
| Commercial sector | March | 9% | 9% | 9% | 9% | 9% | 9% | 9% | 9% | 9% | 9% |
| April | –4% | –4% | –4% | –4% | –4% | –4% | –4% | –4% | –4% | -4% | |
| Governmental sector | March | –26% | –26% | –26% | –26% | –26% | –26% | –26% | –26% | –26% | –26% |
| April | –65% | –65% | –65% | –65% | –65% | –65% | –65% | –65% | –65% | –65% | |
| Total emissions | March | –20% | –17% | –7% | –13% | –17% | –17% | –38% | –30% | –28% | –22% |
| April | –46.9% | –80.9% | –56.1% | –64.2% | –111.3% | –109.2% | –346.5% | –50.9% | –46.2% | –30.3% |


References
- Wu, J.T.; Leung, K.; Bushman, M.; Kishore, N.; Niehus, R.; de Salazar, P.M.; Cowling, B.J.; Lipsitch, M.; Leung, G.M. Estimating clinical severity of COVID-19 from the transmission dynamics in Wuhan, China. Nat. Med. 2020. [Google Scholar] [CrossRef] [PubMed] [Green Version]
- Dantas, G.; Siciliano, B.; França, B.B.; da Silva, C.M.; Arbilla, G. The impact of COVID-19 partial lockdown on the air quality of the city of Rio de Janeiro, Brazil. Sci. Total Environ. 2020. [Google Scholar] [CrossRef] [PubMed]
- WHO Coronavirus Disease (COVID-2019) Situation Reports. Available online: https://www.who.int/emergencies/diseases/novel-coronavirus-2019/situation-reports (accessed on 31 May 2020).
- MINSA CORONAVIRUS Daily Report. Available online: https://www.argentina.gob.ar/coronavirus/informe-diario/ (accessed on 3 June 2020).
- BOEAR Argentine Official Bulletin. Available online: https://www.boletinoficial.gob.ar/detalleAviso/primera/227042/20200320 (accessed on 28 April 2020).
- IMF World Economic Outlook Reports. Available online: https://www.imf.org/en/publications/weo (accessed on 29 July 2020).
- Muhammad, S.; Long, X.; Salman, M. COVID-19 pandemic and environmental pollution: A blessing in disguise? Sci. Total Environ. 2020, 728, 138820. [Google Scholar] [CrossRef] [PubMed]
- Mahato, S.; Pal, S.; Ghosh, K.G. Effect of lockdown amid COVID-19 pandemic on air quality of the megacity Delhi, India. Sci. Total Environ. 2020. [Google Scholar] [CrossRef] [PubMed]
- Puliafito, S.E.; Allende, D.; Pinto, S.; Castesana, P. High resolution inventory of GHG emissions of the road transport sector in Argentina. Atmos. Environ. 2015, 101. [Google Scholar] [CrossRef]
- Huneeus, N.; Denier van der Gon, H.; Castesana, P.; Menares, C.; Granier, C.; Granier, L.; Alonso, M.; de Fatima Andrade, M.; Dawidowski, L.; Gallardo, L.; et al. Evaluation of anthropogenic air pollutant emission inventories for South America at national and city scale. Atmos. Environ. 2020, 235, 117606. [Google Scholar] [CrossRef]
- Puliafito, S.E.; Allende, D.G.; Castesana, P.S.; Ruggeri, M.F. High-resolution atmospheric emission inventory of the argentine energy sector. Comparison with edgar global emission database. Heliyon 2017, 3. [Google Scholar] [CrossRef] [Green Version]
- Puliafito, S.E.; Bolaño-Ortiz, T.R.; Berná Peña, L.L.; Pascual-Flores, R.M. Dataset supporting the estimation and analysis of high spatial resolution inventories of atmospheric emissions from several sectors in Argentina. Data Br. 2020, 29, 105281. [Google Scholar] [CrossRef]
- Puliafito, S.E.; Bolaño-Ortiz, T.; Berná, L.; Pascual Flores, R. High resolution inventory of atmospheric emissions from livestock production, agriculture, and biomass burning sectors of Argentina. Atmos. Environ. 2020, 223, 117248. [Google Scholar] [CrossRef]
- Puliafito, S.E.; Puliafito, J.L.; Grand, M.C. Modeling population dynamics and economic growth as competing species: An application to CO2 global emissions. Ecol. Econ. 2008, 65. [Google Scholar] [CrossRef] [Green Version]
- Canadell, J.G.; Le Quéré, C.; Raupach, M.R.; Field, C.B.; Buitenhuis, E.T.; Ciais, P.; Conway, T.J.; Gillett, N.P.; Houghton, R.A.; Marland, G. Contributions to accelerating atmospheric CO2 growth from economic activity, carbon intensity, and efficiency of natural sinks. Proc. Natl. Acad. Sci. USA 2007, 104. [Google Scholar] [CrossRef] [Green Version]
- Raupach, M.R.; Canadell, J.G.; Le Quéré, C. Anthropogenic and biophysical contributions to increasing atmospheric CO2 growth rate and airborne fraction. Biogeosciences 2008, 5. [Google Scholar] [CrossRef] [Green Version]
- Karstensen, J.; Peters, G.P.; Andrew, R.M. Trends of the EU’s territorial and consumption-based emissions from 1990 to 2016. Clim. Change 2018, 151. [Google Scholar] [CrossRef]
- Peters, G.P.; Marland, G.; Le Quéré, C.; Boden, T.; Canadell, J.G.; Raupach, M.R. Rapid growth in CO2 emissions after the 2008–2009 global financial crisis. Nat. Clim. Chang. 2012, 2, 2–4. [Google Scholar] [CrossRef]
- Asefi-Najafabady, S.; Rayner, P.J.; Gurney, K.R.; McRobert, A.; Song, Y.; Coltin, K.; Huang, J.; Elvidge, C.; Baugh, K. A multiyear, global gridded fossil fuel CO2 emission data product: Evaluation and analysis of results. J. Geophys. Res. 2014, 119. [Google Scholar] [CrossRef] [Green Version]
- Liu, H.; Song, Y. Financial development and carbon emissions in China since the recent world financial crisis: Evidence from a spatial-temporal analysis and a spatial Durbin model. Sci. Total Environ. 2020, 715, 136771. [Google Scholar] [CrossRef]
- Sindosi, O.; Markozannes, G.; Rizos, E.; Ntzani, E. Effects of economic crisis on air quality in Ioannina, Greece. J. Environ. Sci. Health Part A Toxic Hazard. Subst. Environ. Eng. 2019, 54. [Google Scholar] [CrossRef]
- EMEP EMEP/EEA Air Pollutant Emission Inventory Guidebook 2016; EEA Reports; European Environment Agency: Copenhagen, Denmark. 2016. Available online: https://doi.org/10.2800/247535 (accessed on 29 July 2020).
- EEA Report No 13/2019; European Environment Agency: Copenhagen, Denmark, 2019; ISBN 978-92-9480-098-5.
- Klimont, Z.; Kupiainen, K.; Heyes, C.; Purohit, P.; Cofala, J.; Rafaj, P.; Borken-Kleefeld, J.; Schöpp, W. Global anthropogenic emissions of particulate matter including black carbon. Atmos. Chem. Phys. 2017, 17. [Google Scholar] [CrossRef] [Green Version]
- Rosário, N.E.; Longo, K.M.; Freitas, S.R.; Yamasoe, M.A.; Fonseca, R.M. Modeling the South American regional smoke plume: Aerosol optical depth variability and surface shortwave flux perturbation. Atmos. Chem. Phys. 2013, 13. [Google Scholar] [CrossRef] [Green Version]
- Longo, K.M.; Freitas, S.R.; Pirre, M.; Marécal, V.; Rodrigues, L.F.; Panetta, J.; Alonso, M.F.; Rosário, N.E.; Moreira, D.S.; Gácita, M.S.; et al. The Chemistry CATT-BRAMS model (CCATT-BRAMS 4.5): A regional atmospheric model system for integrated air quality and weather forecasting and research. Geosci. Model. Dev. 2013, 6. [Google Scholar] [CrossRef] [Green Version]
- Puliafito, S.E.; Castesana, P.S.; Allende, D.G.; Ruggeri, M.F.; Pinto, S.; Pascual Flores, R.M.; Bolaño-Ortiz, T.R.; Fernandez, R.P. High-Resolution Atmospheric Emission Inventory of the Argentine Enery Sector. In Proceedings of the 19th EGU General Assembly, Vienna, Austria, 23–28 April 2017; Volume 19, p. 5564. [Google Scholar]
- Castesana, P.S.; Dawidowski, L.E.; Finster, L.; Gómez, D.R.; Taboada, M.A. Ammonia emissions from the agriculture sector in Argentina; 2000–2012. Atmos. Environ. 2018, 178. [Google Scholar] [CrossRef] [Green Version]
- Puliafito, S.E.; Berná, L.; Lopez-Noreña, A.; Pascual, R.; Bolaño-Ortiz, T. Atmospheric Methane Emissions for Argentina. Comparison with TROPOMI Satellite Mesurements. In Proceedings of the 2020 IEEE Latin American GRSS & ISPRS Remote Sensing Conference (LAGIRS), Santiago, Chile, 22–26 March 2020; pp. 527–532. [Google Scholar] [CrossRef]
- Easterbrook, D.J. Chapter 9. In Greenhouse Gases, 2nd ed.; Easterbrook, D.J., Ed.; Elsevier: Amsterdam, The Netherlands, 2016; pp. 163–173. ISBN 978-0-12-804588-6. [Google Scholar]
- Lian, X.; Huang, J.; Huang, R.; Liu, C.; Wang, L.; Zhang, T. Impact of city lockdown on the air quality of COVID-19-hit of Wuhan city. Sci. Total Environ. 2020, 742, 140556. [Google Scholar] [CrossRef] [PubMed]
- Rodríguez-Urrego, D.; Rodríguez-Urrego, L. Air quality during the COVID-19: PM2.5 analysis in the 50 most polluted capital cities in the world. Environ. Pollut. 2020, 266, 115042. [Google Scholar] [CrossRef] [PubMed]
- Chen, F.; Wang, M.; Pu, Z. Effects of COVID-19 lockdown on global air quality and health. Sci. Total Environ. 2020, 142533. [Google Scholar] [CrossRef]
- Abu-Rayash, A.; Dincer, I. Analysis of the Electricity Demand Trends amidst the COVID-19 Coronavirus Pandemic. Energy Res. Soc. Sci. 2020, 101682. [Google Scholar] [CrossRef] [PubMed]
- Rugani, B.; Caro, D. Impact of COVID-19 outbreak measures of lockdown on the Italian Carbon Footprint. Sci. Total Environ. 2020, 737, 139806. [Google Scholar] [CrossRef]
- Menut, L.; Bessagnet, B.; Siour, G.; Mailler, S.; Pennel, R.; Cholakian, A. Impact of lockdown measures to combat Covid-19 on air quality over western Europe. Sci. Total Environ. 2020, 741, 140426. [Google Scholar] [CrossRef]
- Nakada, L.Y.K.; Urban, R.C. COVID-19 pandemic: Impacts on the air quality during the partial lockdown in São Paulo state, Brazil. Sci. Total Environ. 2020, 139087. [Google Scholar] [CrossRef]
- Sharma, S.; Zhang, M.; Anshika; Gao, J.; Zhang, H.; Kota, S.H. Effect of restricted emissions during COVID-19 on air quality in India. Sci. Total Environ. 2020. [Google Scholar] [CrossRef]
- Lau, H.; Khosrawipour, V.; Kocbach, P.; Mikolajczyk, A.; Schubert, J.; Bania, J.; Khosrawipour, T. The positive impact of lockdown in Wuhan on containing the COVID-19 outbreak in China. J. Travel Med. 2020. [Google Scholar] [CrossRef] [Green Version]
- WBG Argentina—The World Bank Group. Available online: https://data.worldbank.org/country/argentina (accessed on 29 July 2020).
- Ntziachristos, L.; Samaras, Z.; Kouridis, C.; Samaras, C.; Hassel, D.; Mellios, G.; McCrae, I.; Hickman, J.; Zierock, K.-H.; Keller, M.; et al. 1.A.3.b.i-iv Road Transport 2019; European Environment Agency: Copenhagen, Denmark, 2019. [Google Scholar]
- ENARGAS Ente Nacional Regulador del Gas—ENARGAS. Available online: https://www.enargas.gob.ar/secciones/publicaciones/informes-anuales-de-balance-y-gestion/informe-anual.php?ano=informe-anual-2018 (accessed on 28 July 2020).
- Myhre, G.; Shindell, D.; Bréon, F.-M.F.-M.; Collins, W.; Fuglestvedt, J.; Huang, J.; Koch, D.; Lamarque, J.-F.J.-F.; Lee, D.; Mendoza, B.; et al. Anthropogenic and Natural Radiative Forcing: Supplementary Material. Climate Change 2013—The Physical Science Basis; Cambridge University Press: Cambridge, UK, 2013. [Google Scholar] [CrossRef]
- MEA Ministry of Economy of Argentina. Available online: https://infra.datos.gob.ar/catalog/sspm/dataset/9/distribution/9.2/download/producto-interno-bruto-precios-corrientes-valores-trimestrales-base-2004.csv (accessed on 20 August 2020).
- DNRPA Automotive Property Records—Argentina. Available online: https://www.dnrpa.gov.ar/portal_dnrpa/ (accessed on 27 July 2020).
- MIMEM Datasets—Secretary of Energy, Argentina. Available online: http://datos.minem.gob.ar/dataset?groups=comercializacion-de-los-hidrocarburos (accessed on 27 July 2020).
- Zhu, C.; Tian, H.; Hao, J. Global anthropogenic atmospheric emission inventory of twelve typical hazardous trace elements, 1995–2012. Atmos. Environ. 2020, 220, 117061. [Google Scholar] [CrossRef]
- Mi, Z.; Meng, J.; Guan, D.; Shan, Y.; Song, M.; Wei, Y.M.; Liu, Z.; Hubacek, K. Chinese CO2 emission flows have reversed since the global financial crisis. Nat. Commun. 2017, 8. [Google Scholar] [CrossRef]
- Pacca, L.; Antonarakis, A.; Schröder, P.; Antoniades, A. The effect of financial crises on air pollutant emissions: An assessment of the short vs. medium-term effects. Sci. Total Environ. 2020, 698, 133614. [Google Scholar] [CrossRef] [PubMed]
- Muntean, M.; Guizzardi, D.; Schaaf, E.; Crippa, M.; Solazzo, E.; Olivier, J.G.J.; Vignati, E. Fossil CO2 Emissions of All World Countries: 2018 Report; European Commission: Brussels, Belgium, 2018. [Google Scholar]
- Liu, S.; Wilkes, A.; Li, Y.; Gao, Q.; Wan, Y.; Ma, X.; Qin, X. Contribution of different sectors to developed countries’ fulfillment of GHG emission reduction targets under the first commitment period of the Kyoto Protocol. Environ. Sci. Policy 2016, 61, 143–153. [Google Scholar] [CrossRef]
- Sobrino, N.; Monzon, A. The impact of the economic crisis and policy actions on GHG emissions from road transport in Spain. Energy Policy 2014, 74, 486–498. [Google Scholar] [CrossRef] [Green Version]
- Cvetinović, D.; Stefanović, P.; Marković, Z.; Bakić, V.; Turanjanin, V.; Jovanović, M.; Vučićević, B. GHG (Greenhouse Gases) emission inventory and mitigation measures for public district heating plants in the Republic of Serbia. Energy 2013, 57, 788–795. [Google Scholar] [CrossRef]
- Chanda, C.K.; Bose, D. Challenges of Employing Renewable Energy for Reducing Greenhouse Gases (GHGs) and Carbon Footprint. In Encyclopedia of Renewable and Sustainable Materials; Hashmi, S., Choudhury, I.A., Eds.; Elsevier: Oxford, UK, 2020; pp. 346–365. ISBN 978-0-12-813196-1. [Google Scholar]
- Vrekoussis, M.; Richter, A.; Hilboll, A.; Burrows, J.P.; Gerasopoulos, E.; Lelieveld, J.; Barrie, L.; Zerefos, C.; Mihalopoulos, N. Economic crisis detected from space: Air quality observations over Athens/Greece. Geophys. Res. Lett. 2013, 40. [Google Scholar] [CrossRef]
- Wang, Q.; Wang, S. Preventing carbon emission retaliatory rebound post-COVID-19 requires expanding free trade and improving energy efficiency. Sci. Total Environ. 2020, 746, 141158. [Google Scholar] [CrossRef]
- IPCC Climate Change 2007: Impacts, Adaptation and Vulnerability: Contribution of Working Group II to the Fourth Assessment Report of the Intergovernmental Panel; Cambridge University Press: Cambridge, UK, 2007.
- Norouzi, N.; Zarazua de Rubens, G.; Choupanpiesheh, S.; Enevoldsen, P. When pandemics impact economies and climate change: Exploring the impacts of COVID-19 on oil and electricity demand in China. Energy Res. Soc. Sci. 2020, 68, 101654. [Google Scholar] [CrossRef]
- Gharehgozli, O.; Nayebvali, P.; Gharehgozli, A.; Zamanian, Z. Impact of COVID-19 on the Economic Output of the US Outbreak’s Epicenter. Econ. Disasters Clim. Chang. 2020, 4, 561–573. [Google Scholar] [CrossRef]
- Stubbs, T.; Kring, W.; Laskaridis, C.; Kentikelenis, A.; Gallagher, K. Whatever it takes? The global financial safety net, Covid-19, and developing countries. World Dev. 2021, 137, 105171. [Google Scholar] [CrossRef] [PubMed]
- Zhang, D.; Hu, M.; Ji, Q. Financial markets under the global pandemic of COVID-19. Financ. Res. Lett. 2020, 36, 101528. [Google Scholar] [CrossRef] [PubMed]
- Han, P.; Cai, Q.; Oda, T.; Zeng, N.; Shan, Y.; Lin, X.; Liu, D. Assessing the recent impact of COVID-19 on carbon emissions from China using domestic economic data. Sci. Total Environ. 2021, 750, 141688. [Google Scholar] [CrossRef] [PubMed]
- Huang, W.M.; Lee, G.W.M.; Wu, C.C. GHG emissions, GDP growth and the Kyoto Protocol: A revisit of Environmental Kuznets Curve hypothesis. Energy Policy 2008, 36, 239–247. [Google Scholar] [CrossRef]
- Ibn-Mohammed, T.; Mustapha, K.B.; Godsell, J.; Adamu, Z.; Babatunde, K.A.; Akintade, D.D.; Acquaye, A.; Fujii, H.; Ndiaye, M.M.; Yamoah, F.A.; et al. A critical analysis of the impacts of COVID-19 on the global economy and ecosystems and opportunities for circular economy strategies. Resour. Conserv. Recycl. 2021, 164, 105169. [Google Scholar] [CrossRef]
- Horowitz, C.A. Paris Agreement. Int. Leg. Mater. 2016, 55. [Google Scholar] [CrossRef]
- Wang, Q.; Li, R.; Liao, H. Toward Decoupling: Growing GDP without Growing Carbon Emissions. Environ. Sci. Technol. 2016, 50, 11435–11436. [Google Scholar] [CrossRef] [Green Version]
- ESA. TROPOMI Level 2 Nitrogen Dioxide Total Column Products: Copernicus Sentinel-5P Data Products; European Commission: Brussels, Belgium, 2018. [Google Scholar]
- Bolaño-Ortiz, T.R.; Camargo-Caicedo, Y.; Puliafito, S.E.; Ruggeri, M.F.; Bolaño-Diaz, S.; Pascual-Flores, R.; Saturno, J.; Ibarra-Espinosa, S.; Mayol-Bracero, O.L.; Torres-Delgado, E.; et al. Spread of SARS-CoV-2 through Latin America and the Caribbean region: A look from its economic conditions, climate and air pollution indicators. Environ. Res. 2020, 109938. [Google Scholar] [CrossRef]
- Bolaño-Ortiz, T.R.; Pascual-Flores, R.M.; Puliafito, S.E.; Camargo-Caicedo, Y.; Berná-Peña, L.L.; Ruggeri, M.F.; Lopez-Noreña, A.I.; Tames, M.F.; Cereceda-Balic, F. Spread of COVID-19, Meteorological Conditions and Air Quality in the City of Buenos Aires, Argentina: Two Facets Observed during Its Pandemic Lockdown. Atmosphere 2020, 11, 1045. [Google Scholar] [CrossRef]
- CONAE—Argentina National Space Activities Commission. Improves air Quality in Large Cities in Argentina. Available online: https://www.argentina.gob.ar/noticias/baja-la-contaminacion-atmosferica-en-grandes-ciudades-de-la-argentina (accessed on 20 July 2020).
- CONAE—Argentina National Space Activities Commission. Satellites Detect a Reduction in Air Pollution Due to COVID-19 Pandemic Lockdown. Available online: https://www.argentina.gob.ar/noticias/satelites-detectan-una-reduccion-de-la-contaminacion-atmosferica-por-la-cuarentena (accessed on 20 July 2020).
- Venegas, L.E.; Mazzeo, N.A. Modelling of urban background pollution in Buenos Aires City (Argentina). In Proceedings of the Environmental Modelling and Software, Burlington, VT, USA, 9–13 July 2006; Volume 21. [Google Scholar]
- Arkouli, M.; Ulke, A.G.; Endlicher, W.; Baumbach, G.; Schultz, E.; Vogt, U.; Müller, M.; Dawidowski, L.; Faggi, A.; Wolf-Benning, U.; et al. Distribution and temporal behavior of particulate matter over the urban area of Buenos Aires. Atmos. Pollut. Res. 2010, 1. [Google Scholar] [CrossRef] [Green Version]
- Pineda Rojas, A.L.; Borge, R.; Mazzeo, N.A.; Saurral, R.I.; Matarazzo, B.N.; Cordero, J.M.; Kropff, E. High PM10 concentrations in the city of Buenos Aires and their relationship with meteorological conditions. Atmos. Environ. 2020, 241, 117773. [Google Scholar] [CrossRef]
- Baldasano, J.M. COVID-19 lockdown effects on air quality by NO2 in the cities of Barcelona and Madrid (Spain). Sci. Total Environ. 2020, 741, 140353. [Google Scholar] [CrossRef] [PubMed]
- Kanniah, K.D.; Kamarul Zaman, N.A.F.; Kaskaoutis, D.G.; Latif, M.T. COVID-19′s impact on the atmospheric environment in the Southeast Asia region. Sci. Total Environ. 2020, 736, 139658. [Google Scholar] [CrossRef] [PubMed]
- Kerimray, A.; Baimatova, N.; Ibragimova, O.P.; Bukenov, B.; Kenessov, B.; Plotitsyn, P.; Karaca, F. Assessing air quality changes in large cities during COVID-19 lockdowns: The impacts of traffic-free urban conditions in Almaty, Kazakhstan. Sci. Total Environ. 2020, 730, 139179. [Google Scholar] [CrossRef]
- Hudda, N.; Simon, M.C.; Patton, A.P.; Durant, J.L. Reductions in traffic-related black carbon and ultrafine particle number concentrations in an urban neighborhood during the COVID-19 pandemic. Sci. Total Environ. 2020, 140931. [Google Scholar] [CrossRef]
- Zambrano-Monserrate, M.A.; Ruano, M.A.; Sanchez-Alcalde, L. Indirect effects of COVID-19 on the environment. Sci. Total Environ. 2020, 728, 138813. [Google Scholar] [CrossRef]
- Filippini, T.; Rothman, K.J.; Goffi, A.; Ferrari, F.; Maffeis, G.; Orsini, N.; Vinceti, M. Satellite-detected tropospheric nitrogen dioxide and spread of SARS-CoV-2 infection in Northern Italy. Sci. Total Environ. 2020, 739, 140278. [Google Scholar] [CrossRef]
- OECD. OECD Policy Responses to Coronavirus (COVID-19). Available online: https://www.oecd.org/coronavirus/policy-responses/evaluating-the-initial-impact-of-covid-19-containment-measures-on-economic-activity-b1f6b68b/ (accessed on 29 July 2020).
- UNDP. UNDP in Latin America and the Caribbean. Available online: https://www.latinamerica.undp.org/content/rblac/en/home/library/crisis_prevention_and_recovery/social-and-economic-impact-of-covid-19-and-policy-options-in-arg.html (accessed on 29 July 2020).
- Huang, X.; Ding, A.; Gao, J.; Zheng, B.; Zhou, D.; Qi, X.; Tang, R.; Wang, J.; Ren, C.; Nie, W.; et al. Enhanced secondary pollution offset reduction of primary emissions during COVID-19 lockdown in China. Natl. Sci. Rev. 2020. [Google Scholar] [CrossRef]
- Pan, S.; Jung, J.; Li, Z.; Hou, X.; Roy, A.; Choi, Y.; Gao, H.O. Air Quality Implications of COVID-19 in California. Sustainability 2020, 12, 7067. [Google Scholar] [CrossRef]
- Copernicus Earth Earth (CAMS/Copernicus/European Commission + ECMWF). Available online: https://earth.nullschool.net/ (accessed on 28 July 2020).
- CABA Air Quality Network of City of Buenos Aires. Available online: https://www.buenosaires.gob.ar/areas/med_ambiente/apra/calidad_amb/red_monitoreo/index.php?contaminante=2&estacion=1&fecha_dia=01&fecha_mes=04&fecha_anio=2020&menu_id=34234&buscar=Buscar (accessed on 3 June 2020).


| COVID-19 Pandemic State of Affairs | Start Date | Measure Established |
|---|---|---|
| The first case of COVID-19 is confirmed in Argentina | 7 March 2020 | The health ministry confirms the first case of COVID-19 in Argentina. Then, the inhabitants were encouraged to avoid social contact. In addition, the population was encouraged to make an immediate medical consultation due to the presence of fever and respiratory symptoms such as cough, sore throat, difficulty breathing, and having traveled in areas with circulation of the SARS-CoV-2 virus or having been in contact with any COVID-19 confirmed case. |
| Restrictions of mass gatherings and school closures | 15 March 2020 | The national government closed schools across the country. In additions, they closed maritime, land, and air borders for all non-resident foreigners. They stablished specific work licenses and hours of care for person all over 60, and all non-essential activities and crowding were cancelled. |
| Nationwide lockdown | 20 March 2020 | Nationwide lockdown until 31 March was established. Only essential activities were allowed (health care, food production and distribution, etc.) |
| Nationwide lockdown was extended with a few exceptions | 13 April 2020 | Each province and the Autonomous City of Buenos Aires, supervised by the national government, were empowered to get out of compulsory isolation, but establishing protocols that guarantee social distancing. |
| Nationwide lockdown was extended and relaxed some restrictions | 27 April 2020 | The quarantine was extended, only for cities with more than 500,000 inhabitants. The measure was also relaxed to allow recreational outings of one hour per day and within a radius of 500 m from their residences. |
| City/Country/Region | Pollutants | Reference | ||||||
|---|---|---|---|---|---|---|---|---|
| NO2 | NO | CO | SO2 | PM10 | PM2.5 | BC | ||
| China | 20–30 | - | - | - | - | - | - | [7] |
| Italy | - | - | - | - | - | - | ||
| Spain | - | - | - | - | - | - | ||
| France | - | - | - | - | - | - | ||
| USA | 30 | - | - | - | - | - | - | |
| New Daly, India | 53 | - | 30 | - | 60 | 39 | - | [8] |
| Madrid, Spain | 62 | - | - | - | - | - | - | [75] |
| Barcelona, Spain | 50 | - | - | - | - | - | - | |
| Western Europe | 30–50 | - | - | - | 5–15 | 5–15 | - | [36] |
| Southeast Asia | 63–64 | - | 25–31 | 9–20 | 26–1 | 23–32 | - | [76] |
| São Paulo state, Brazil | 54 | 77 | 65 | - | - | - | - | [37] |
| City of Rio de Janeiro, Brazil | 24–33 | - | 37–44 | - | - | - | - | [2] |
| Almaty, Kazakhstan | 35 | - | 49 | - | - | 6–34 | - | [77] |
| Somerville, MA, USA | - | - | - | - | - | - | 22–56 | [78] |
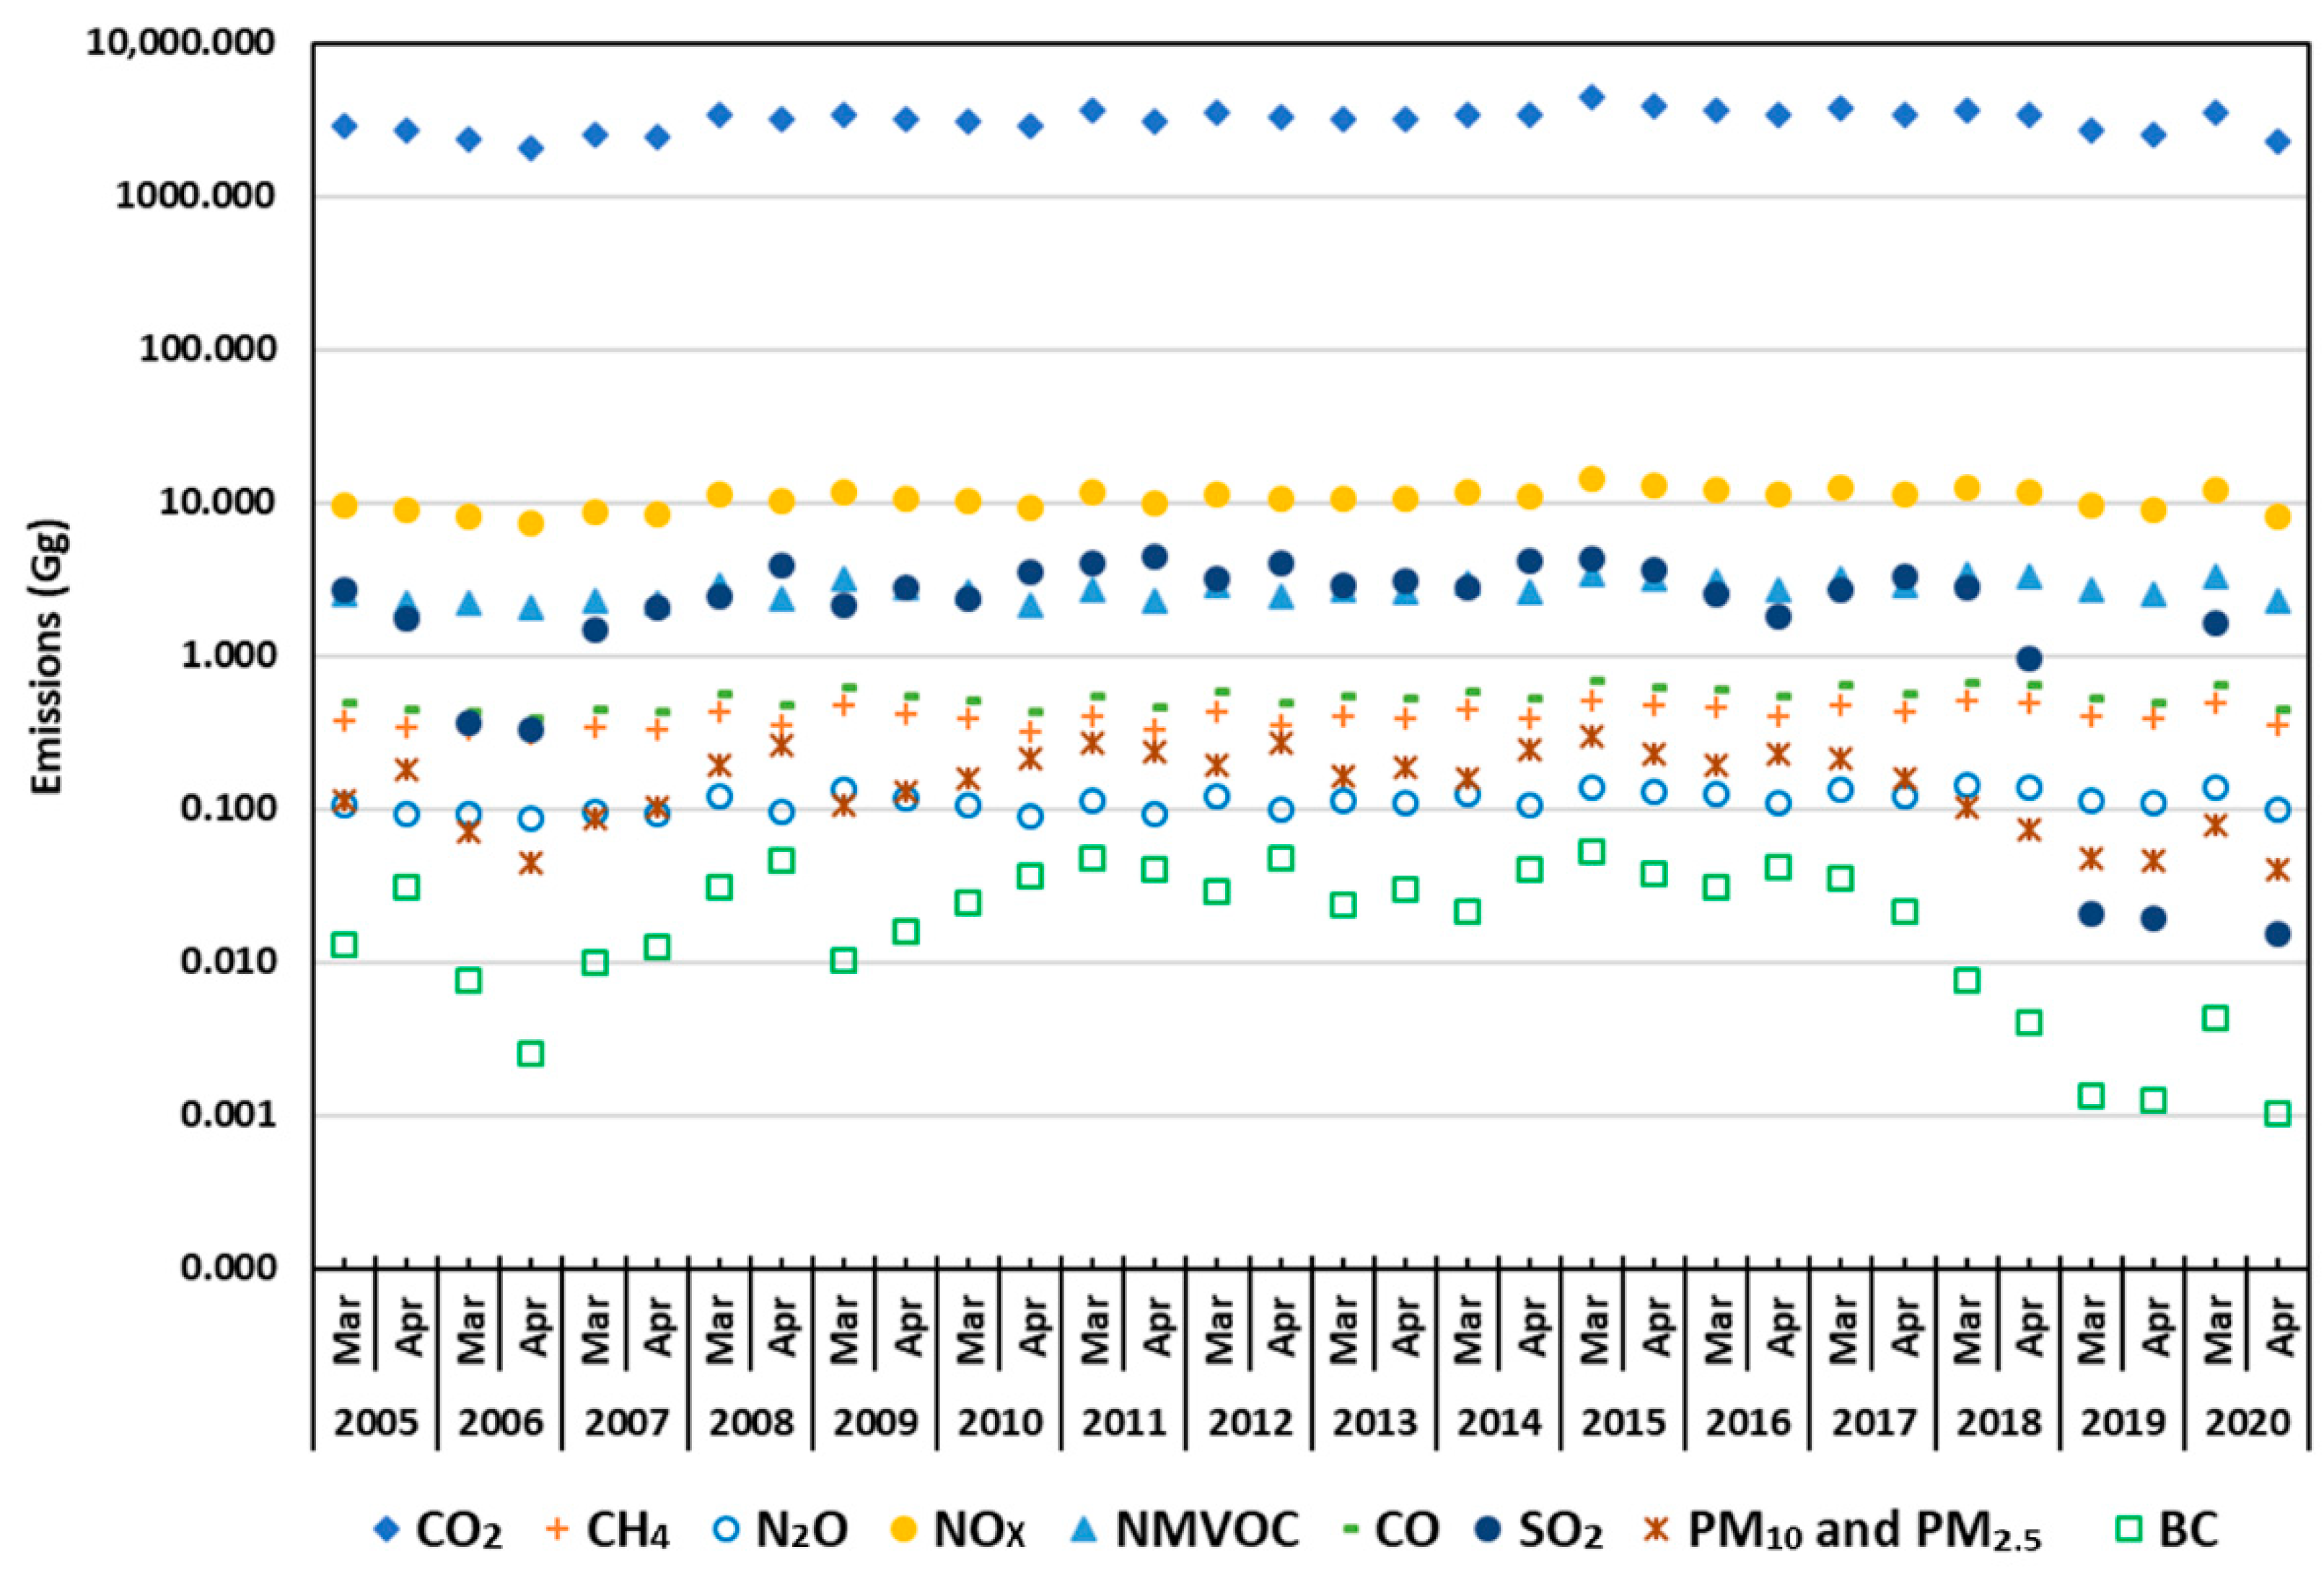
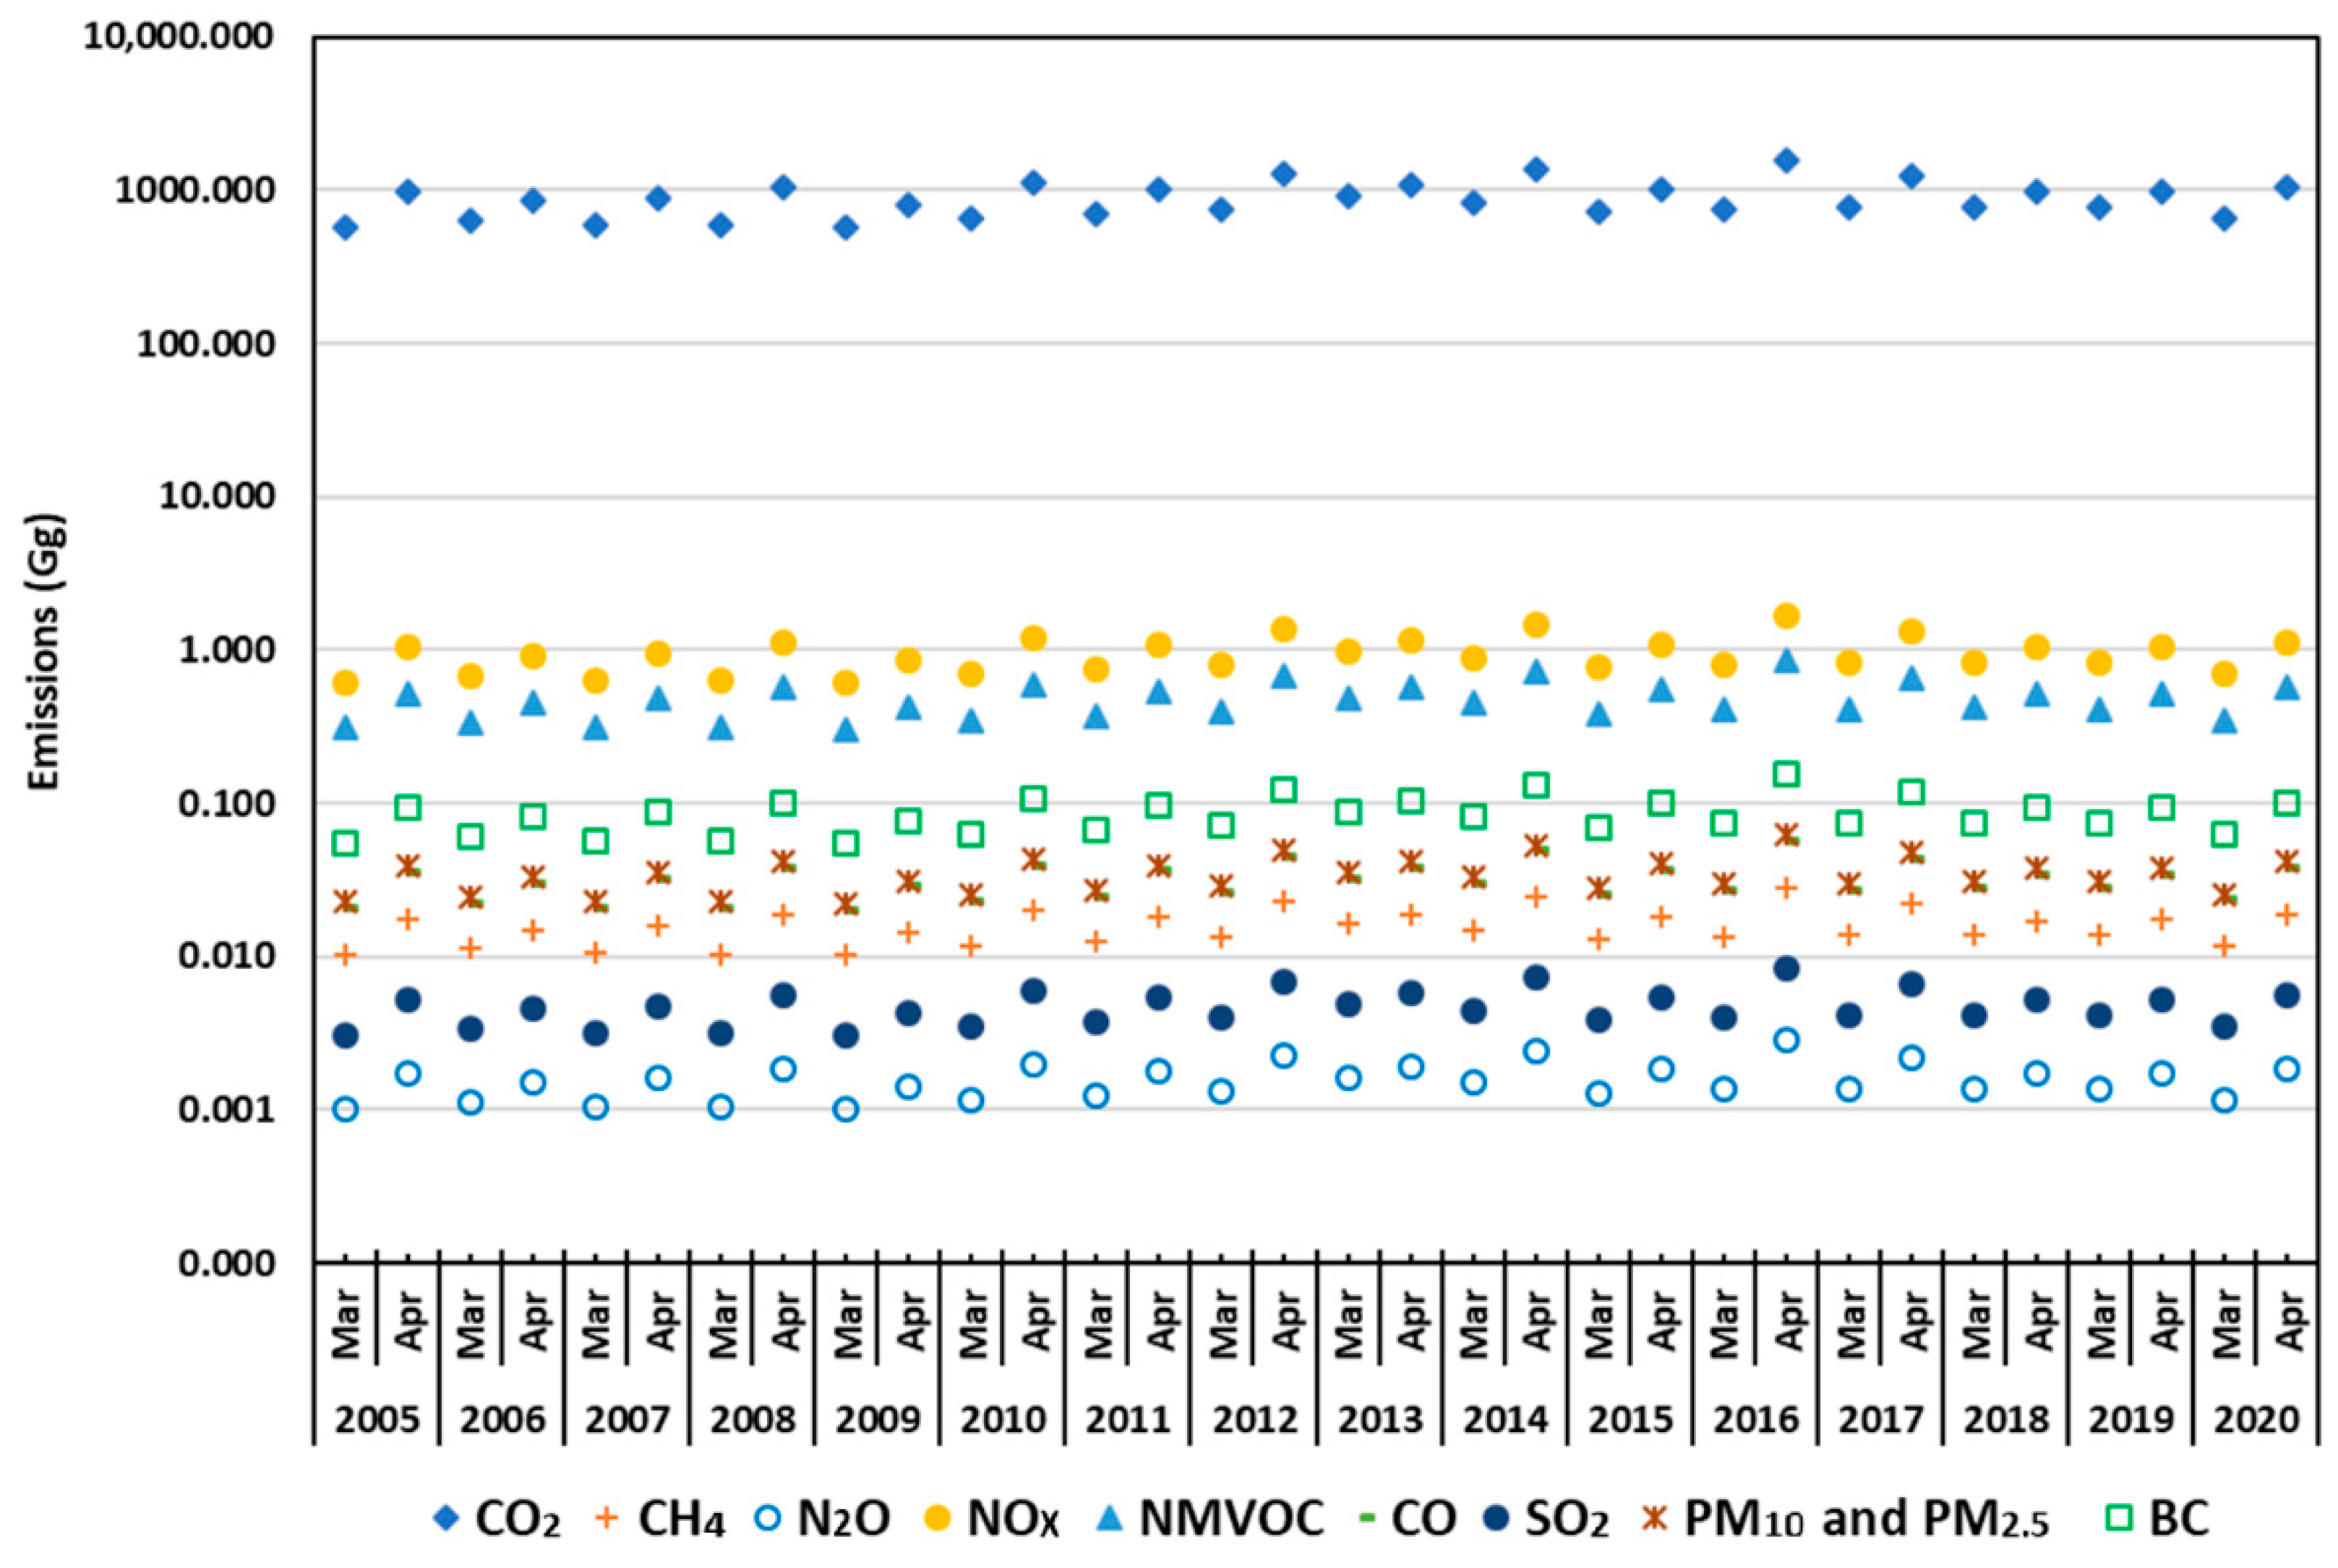
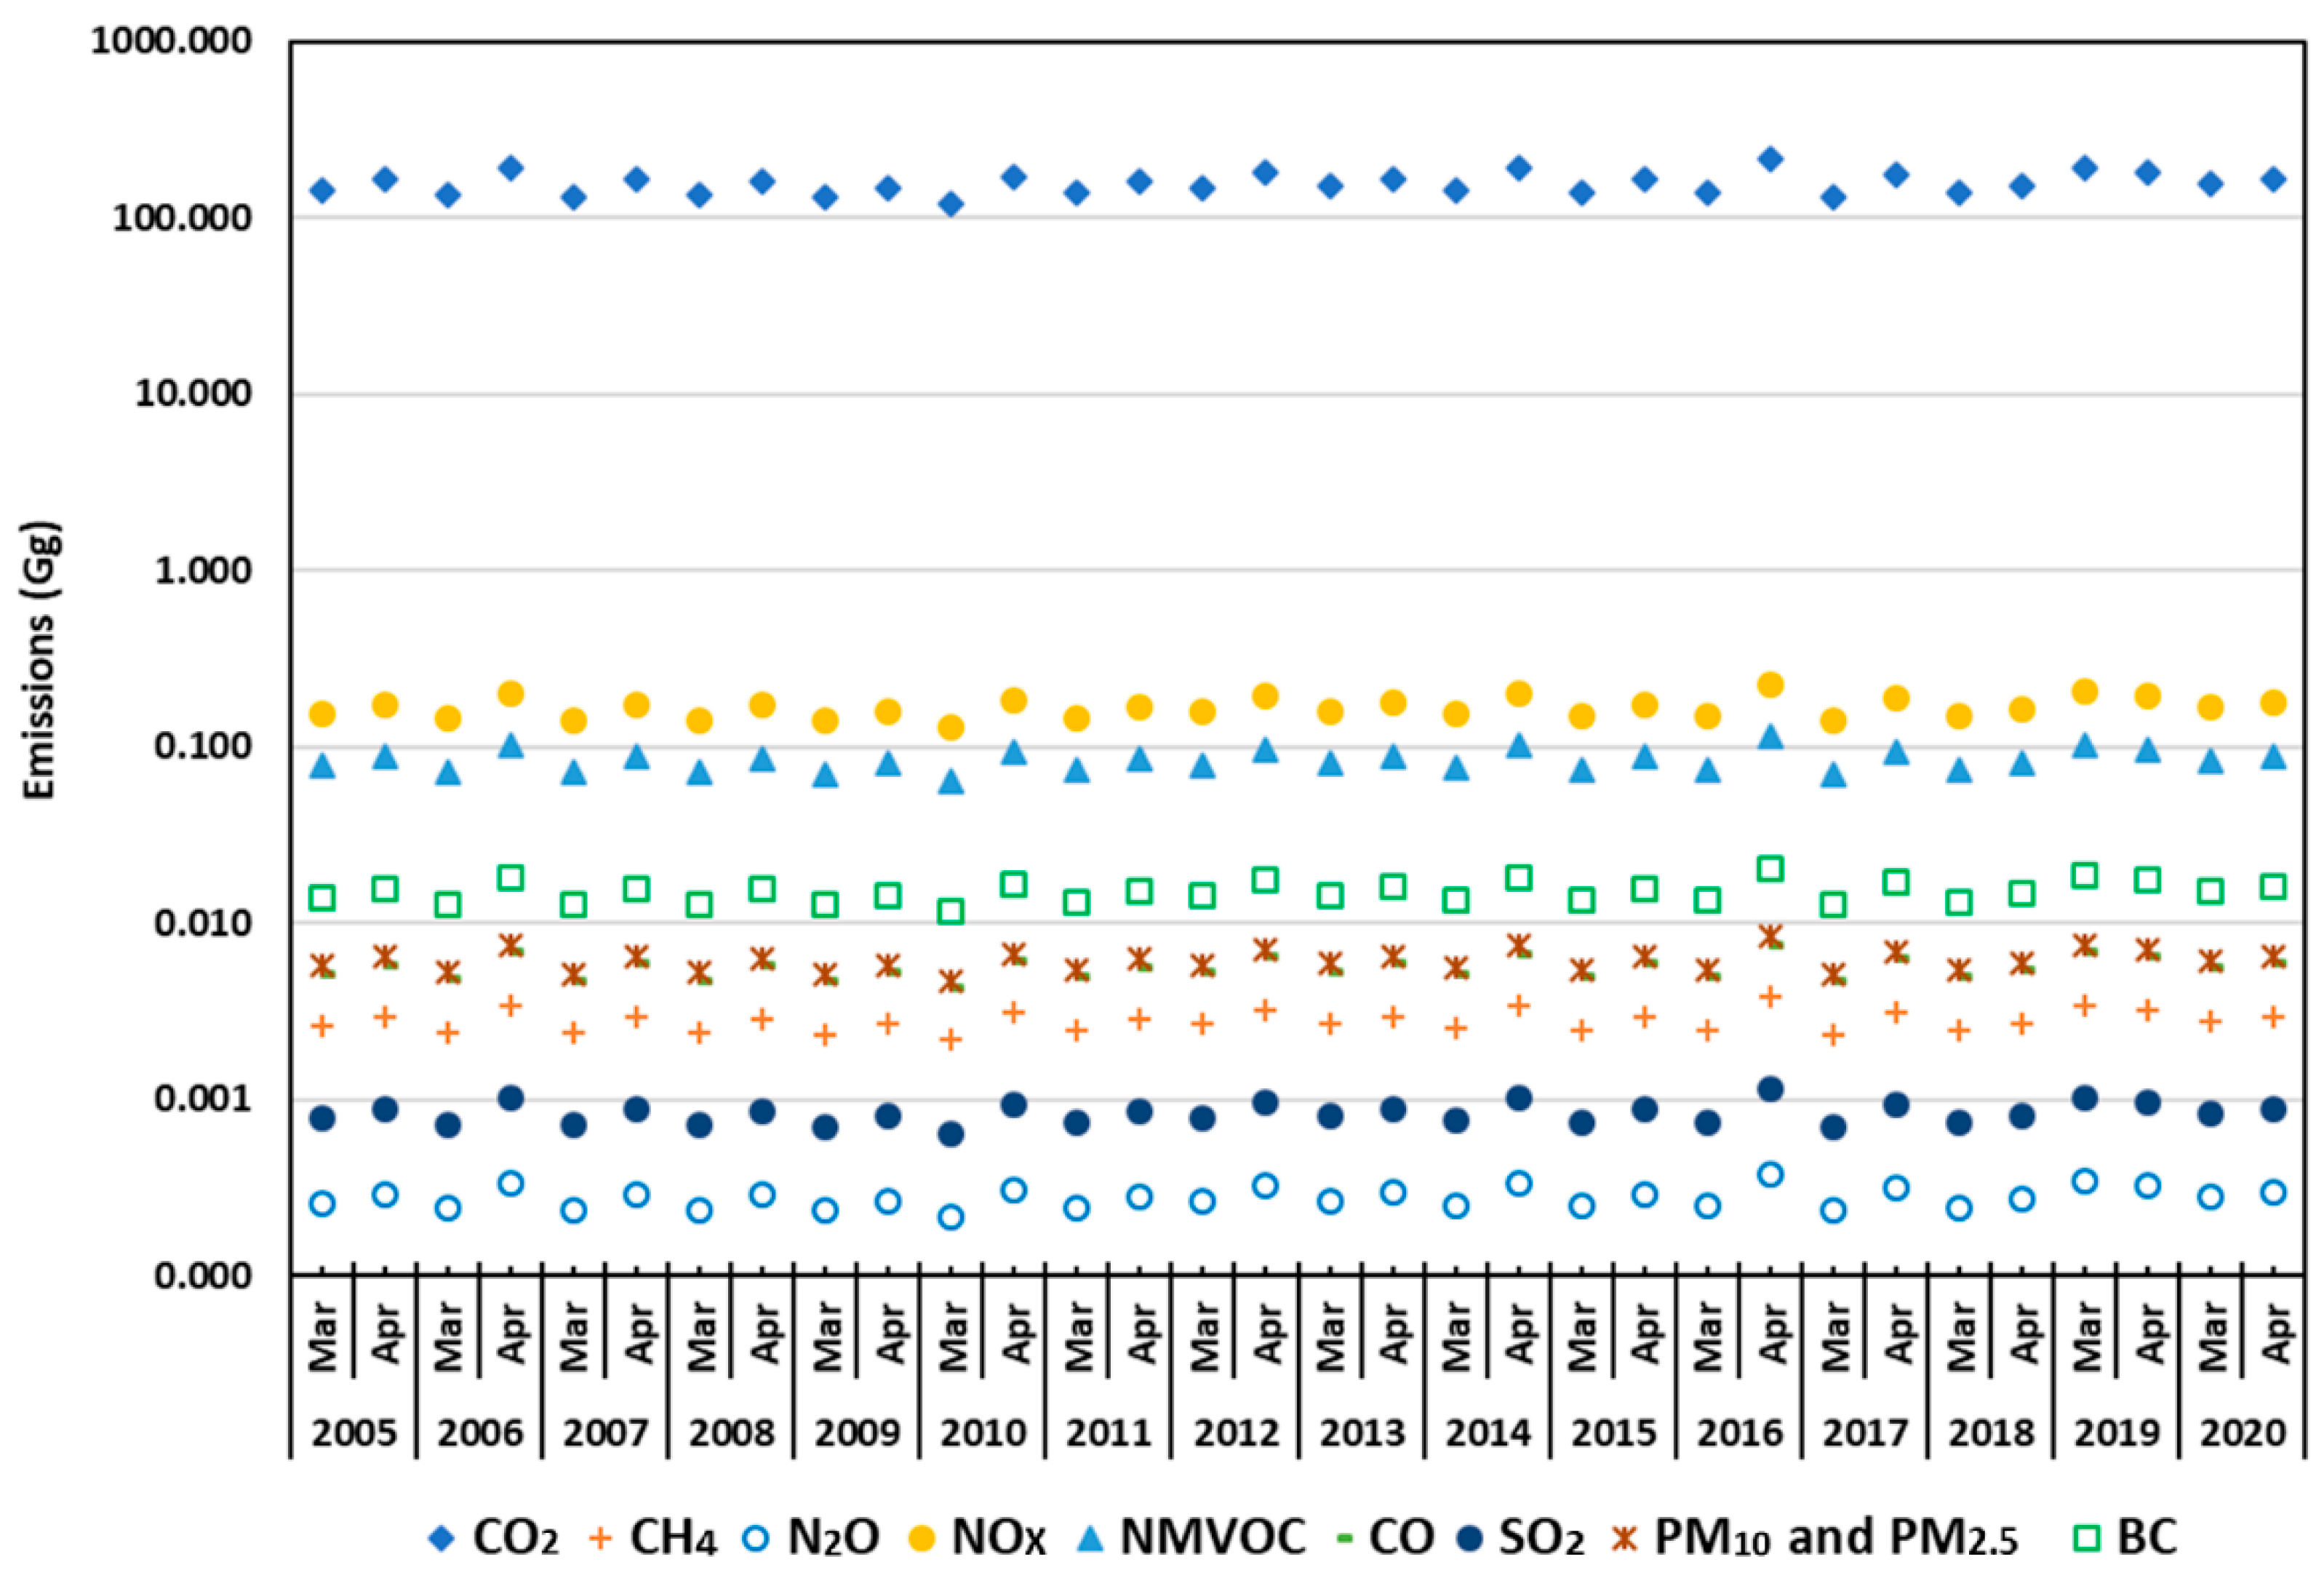
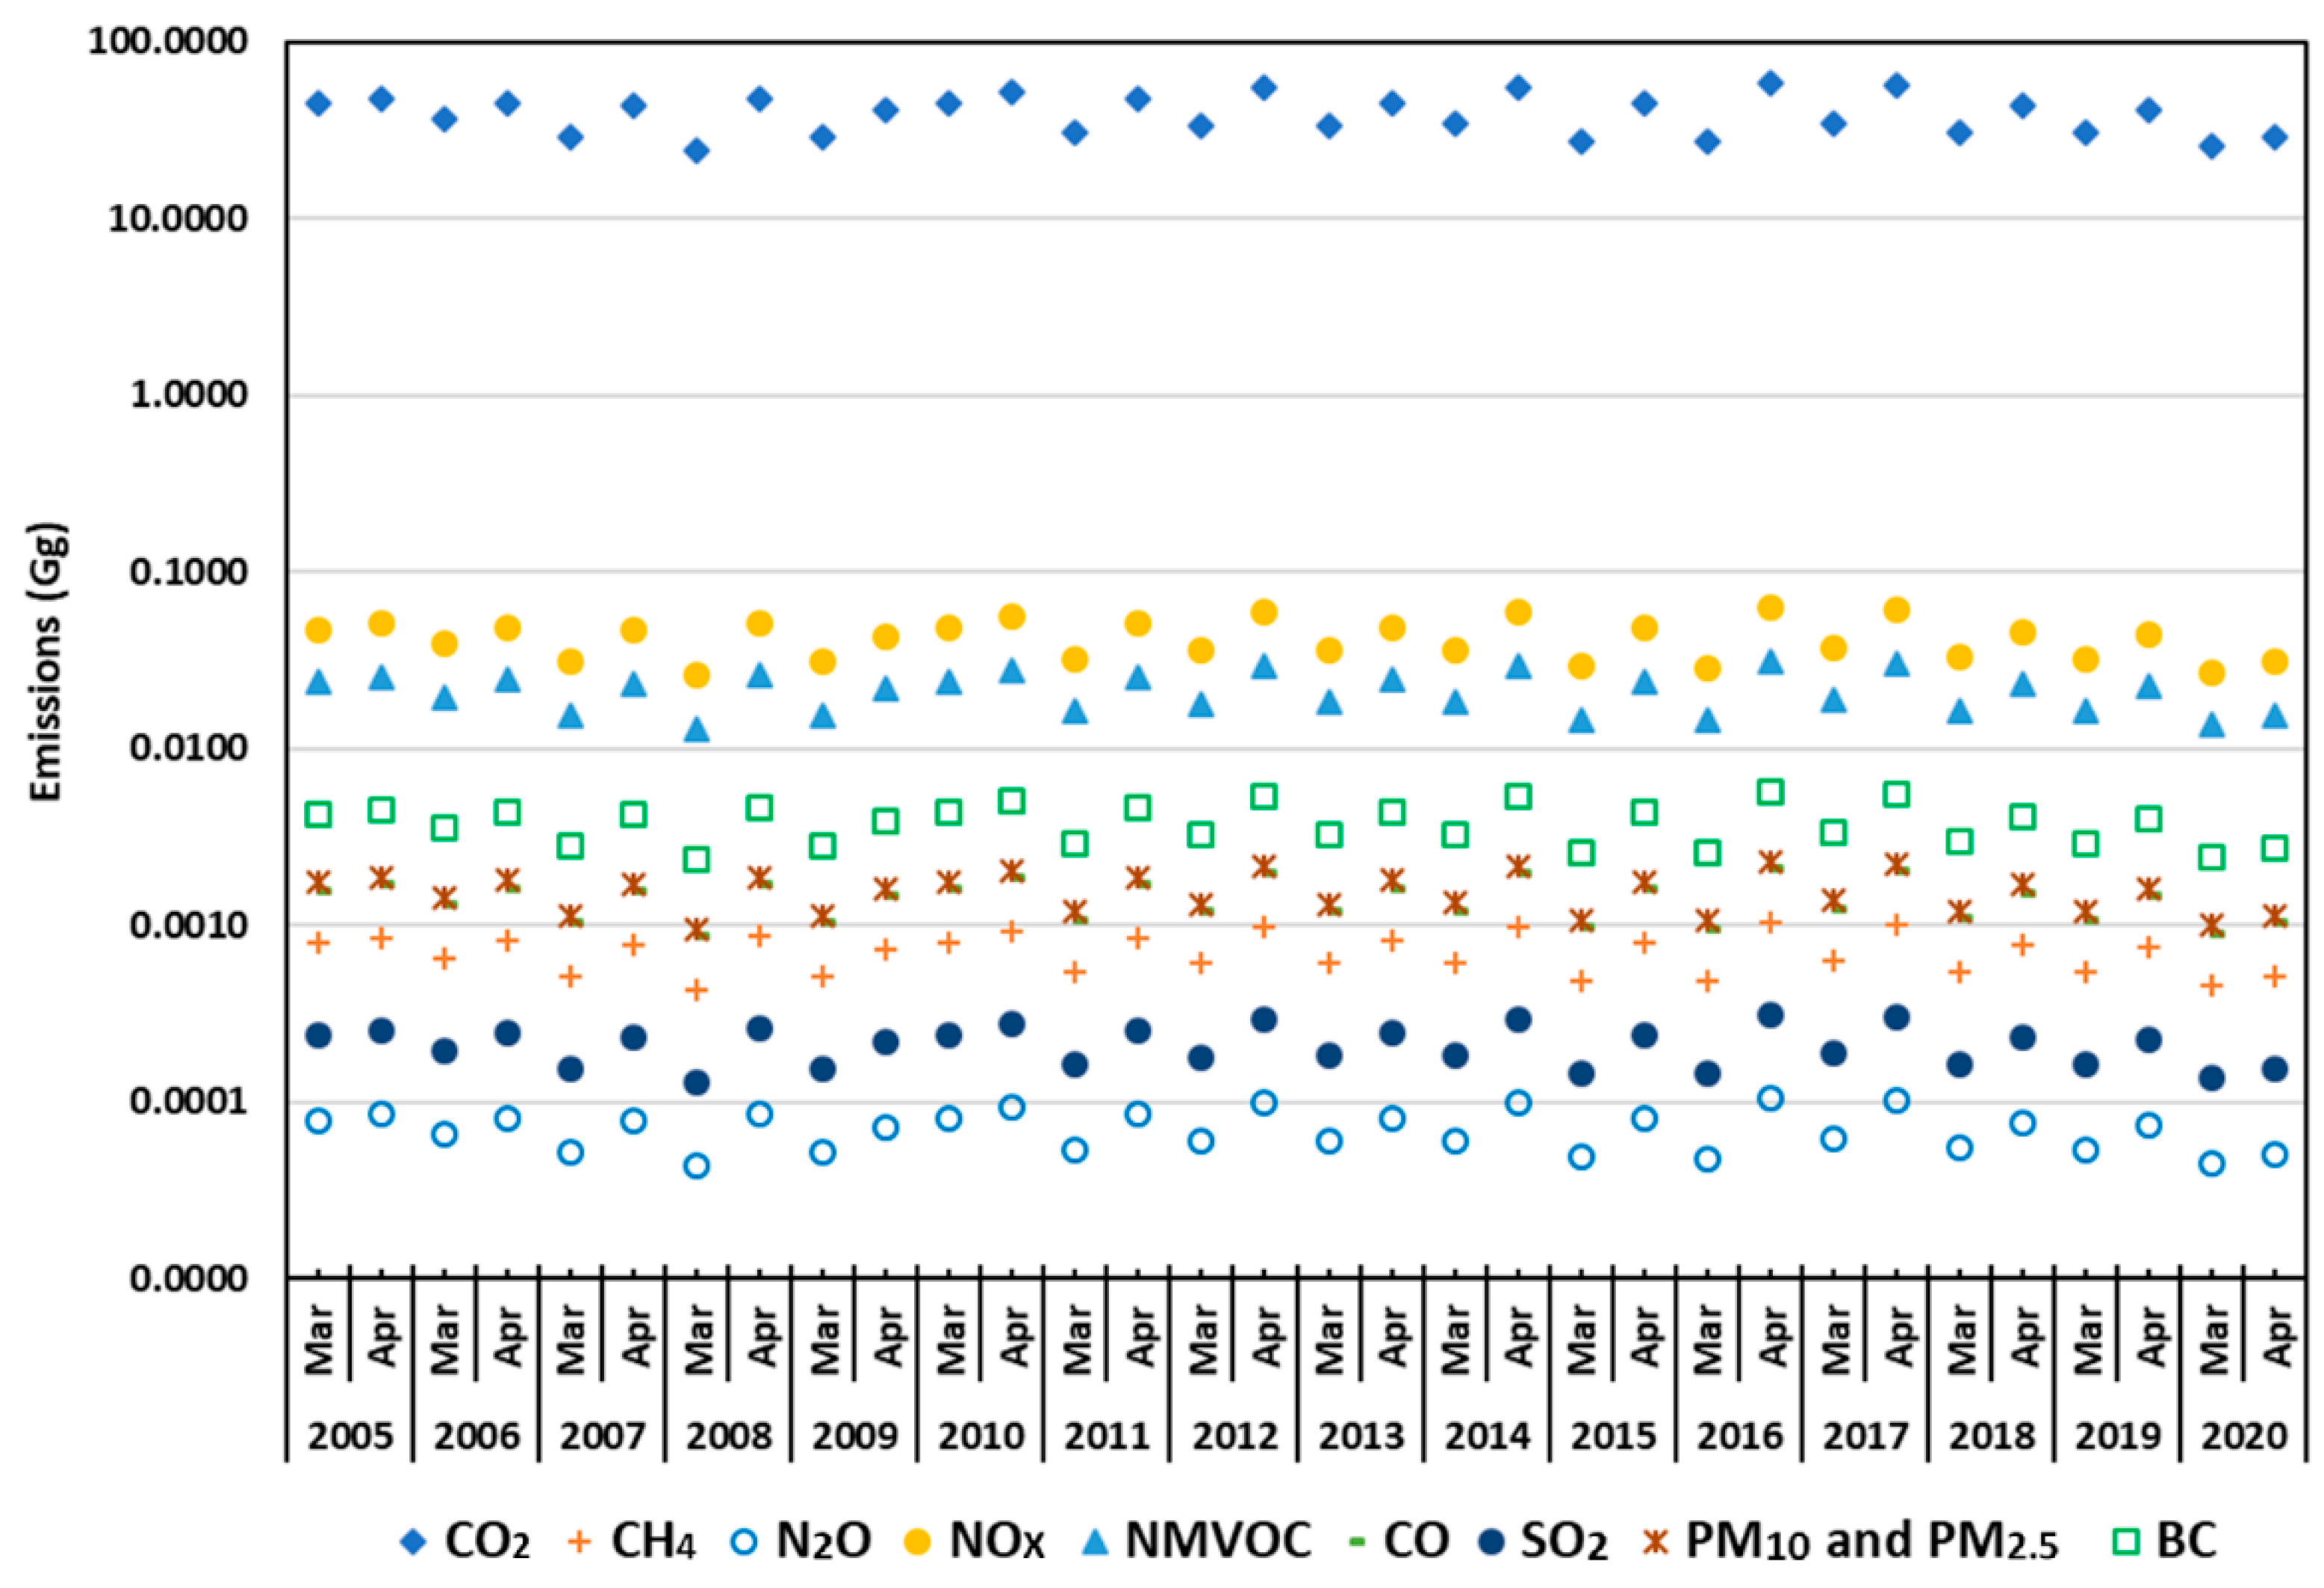
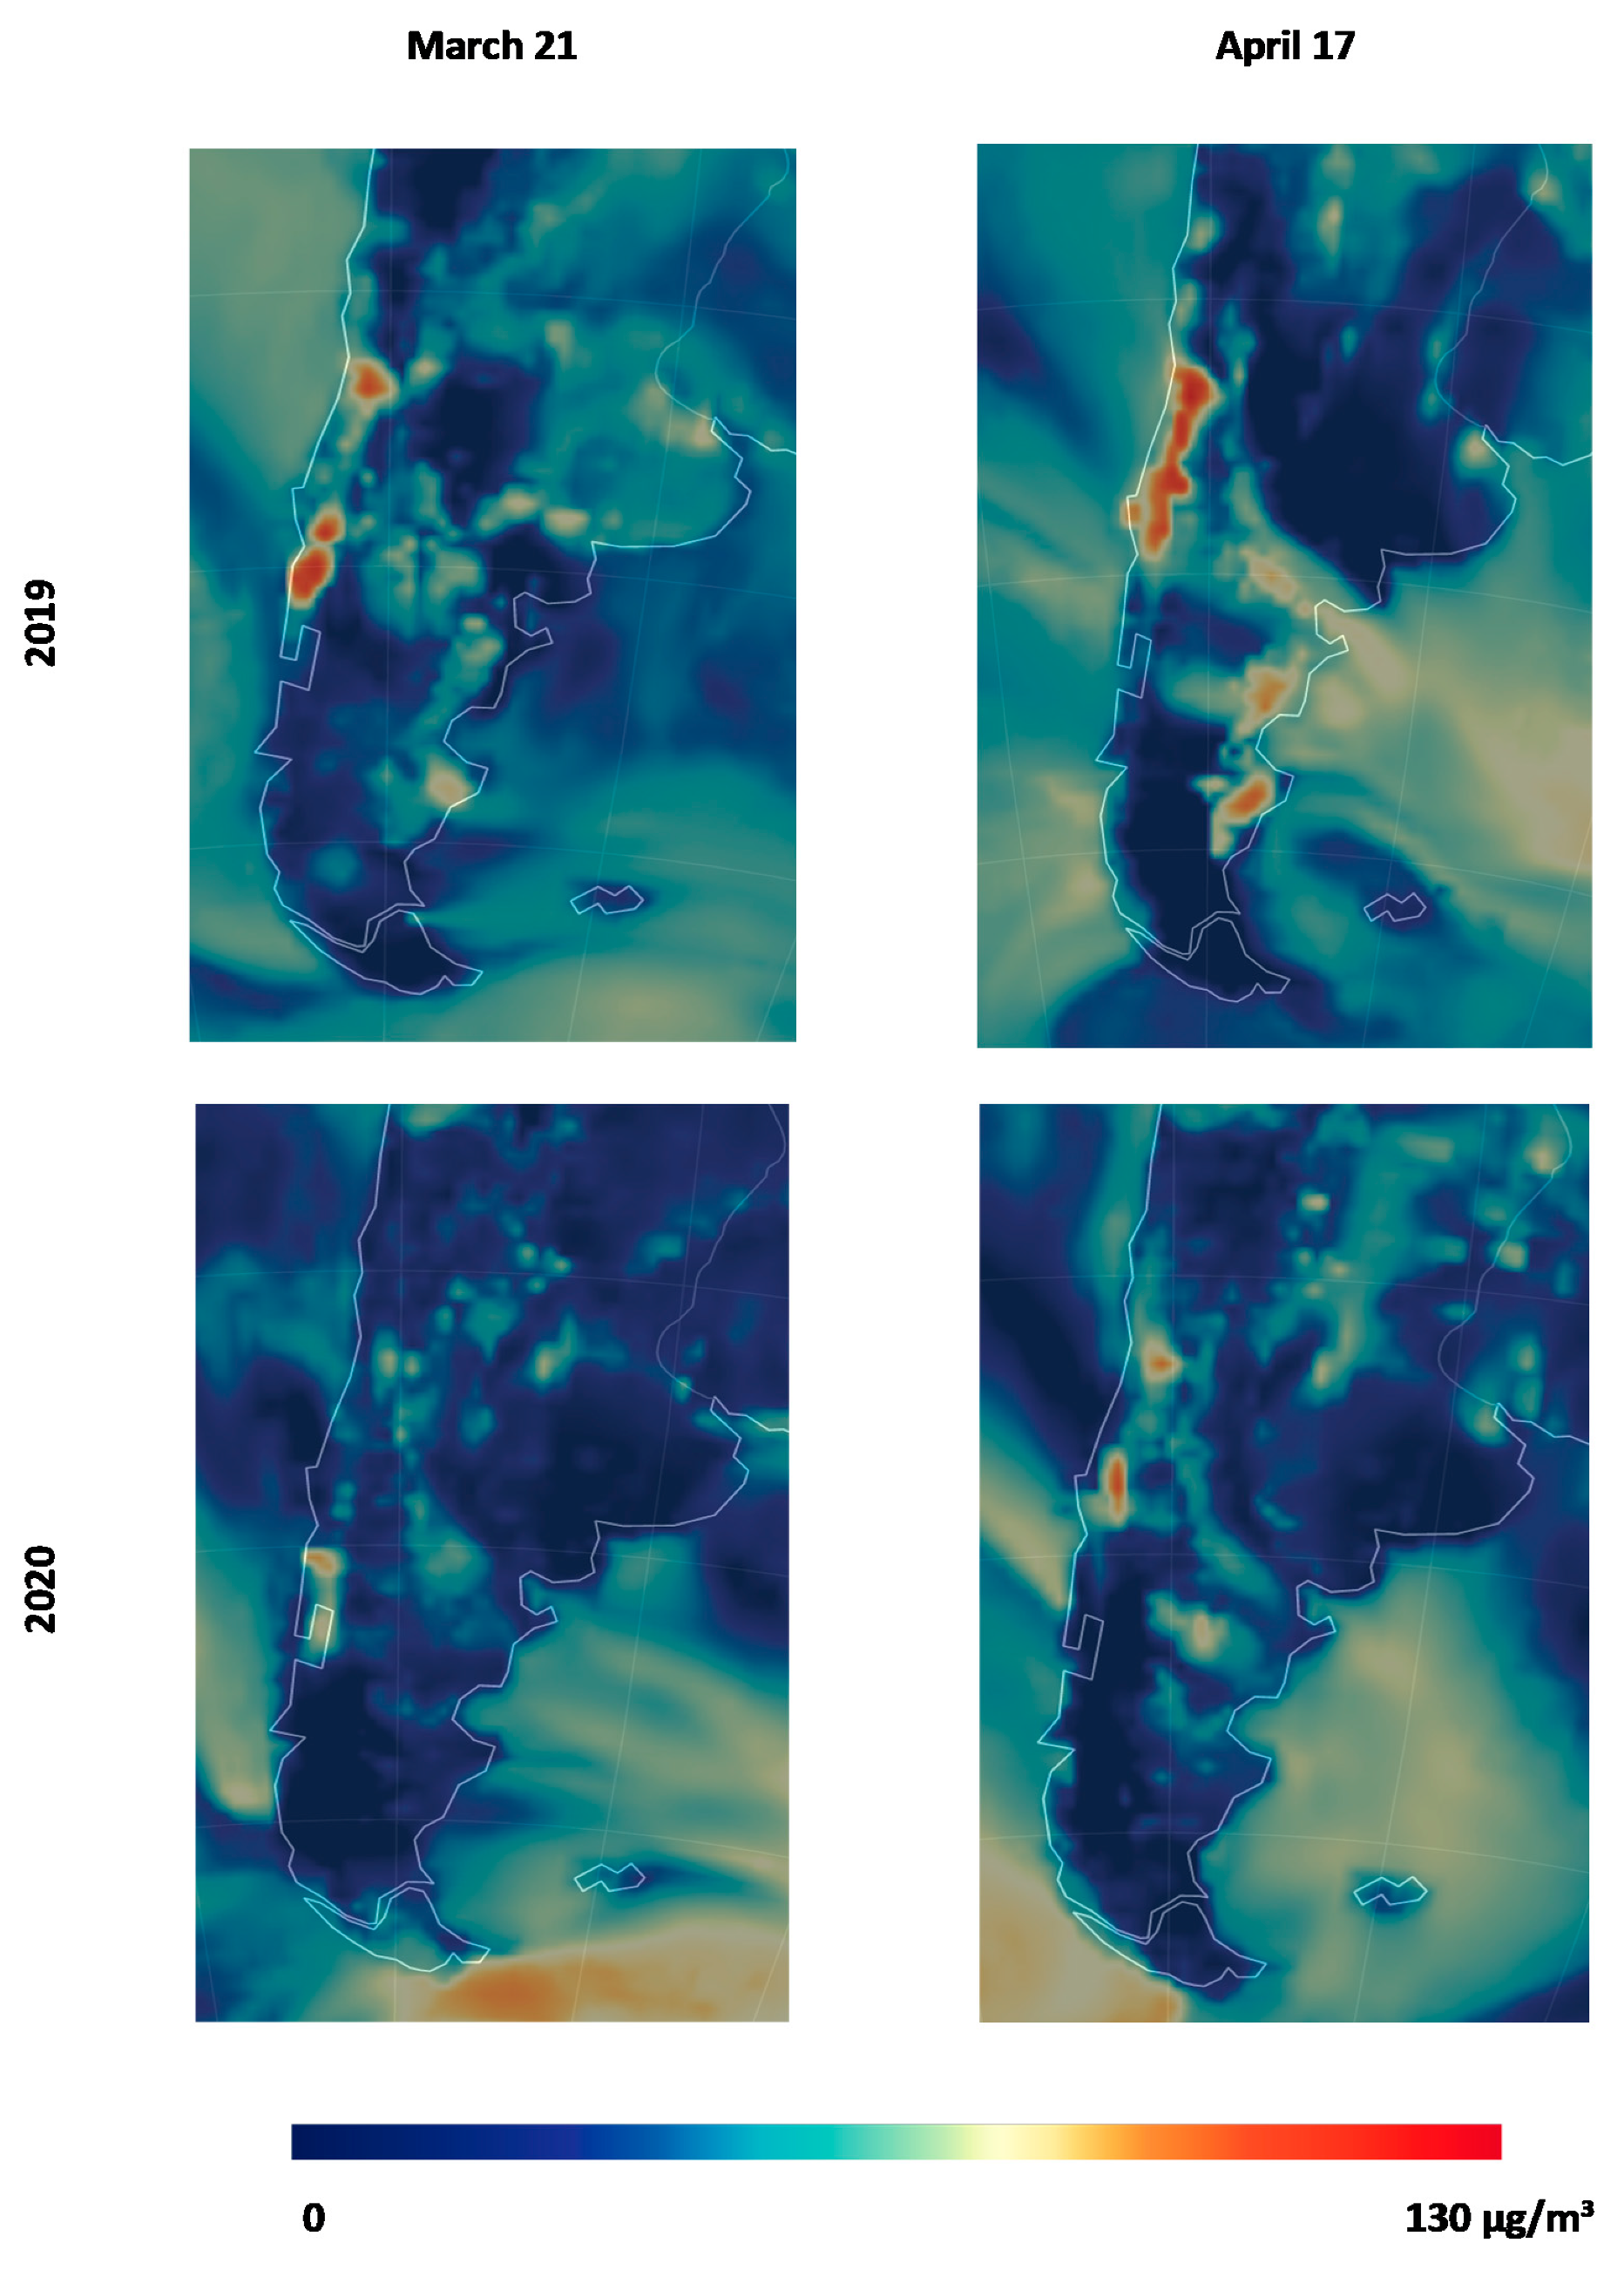
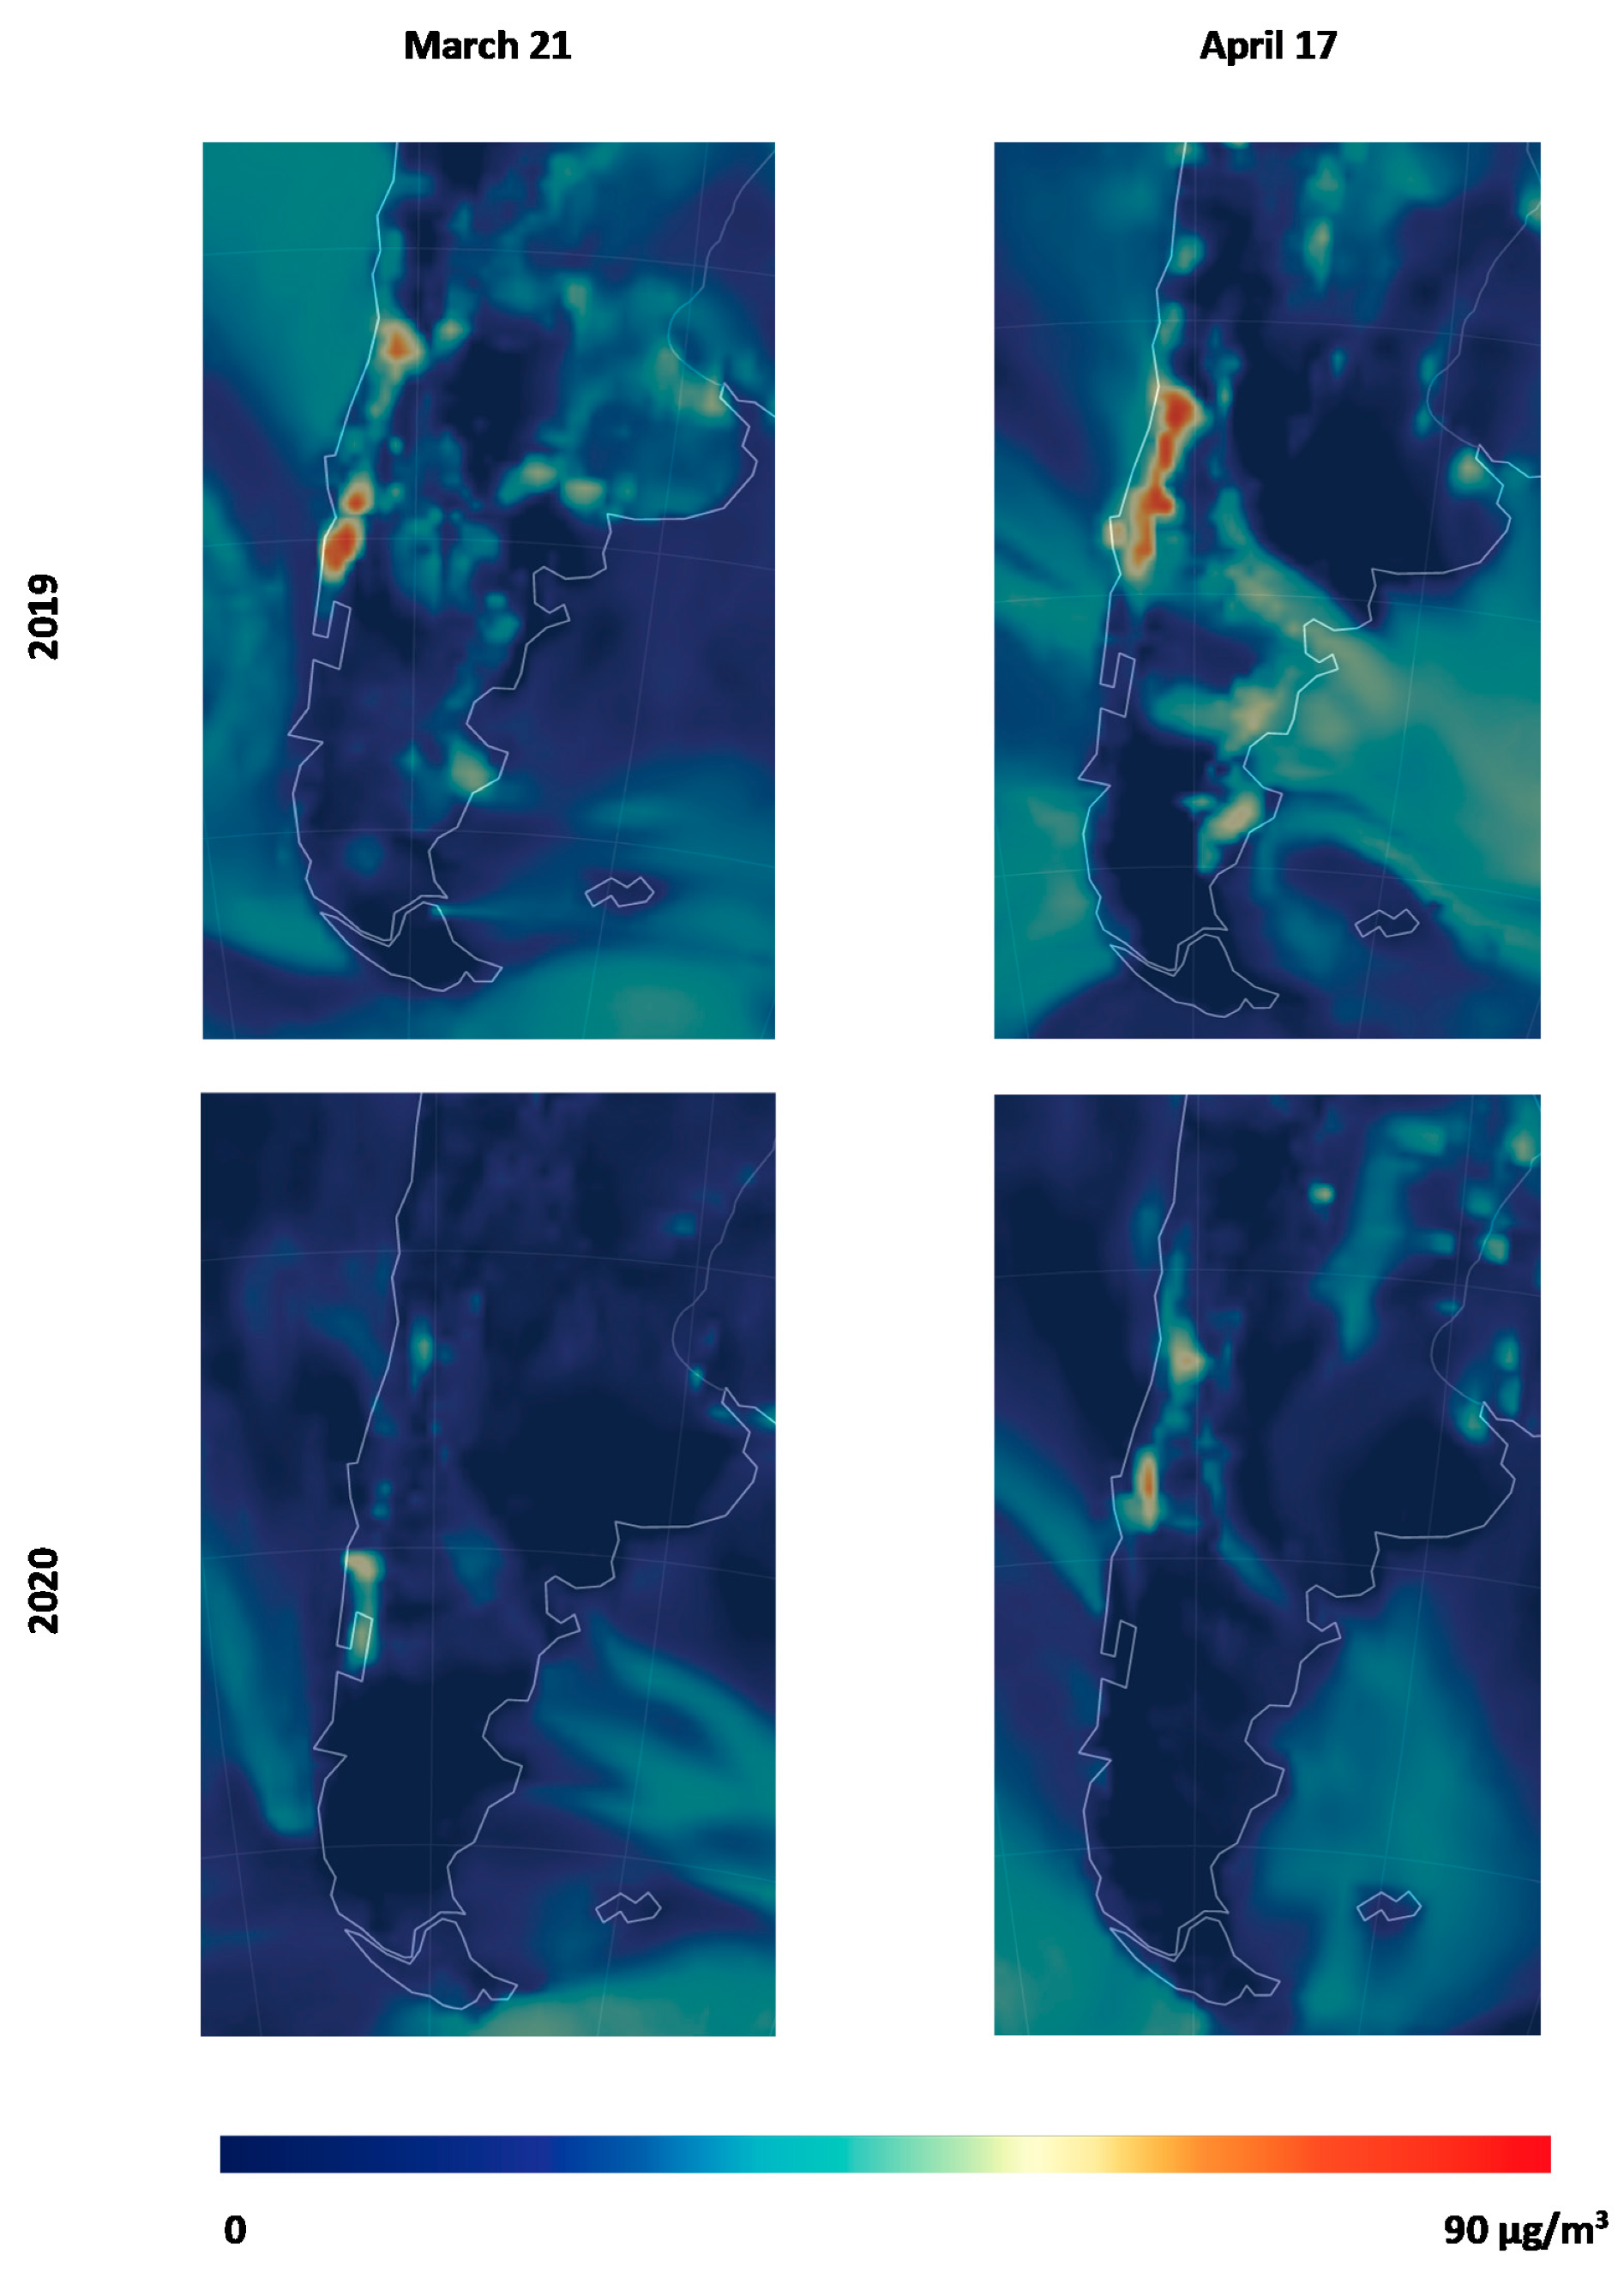
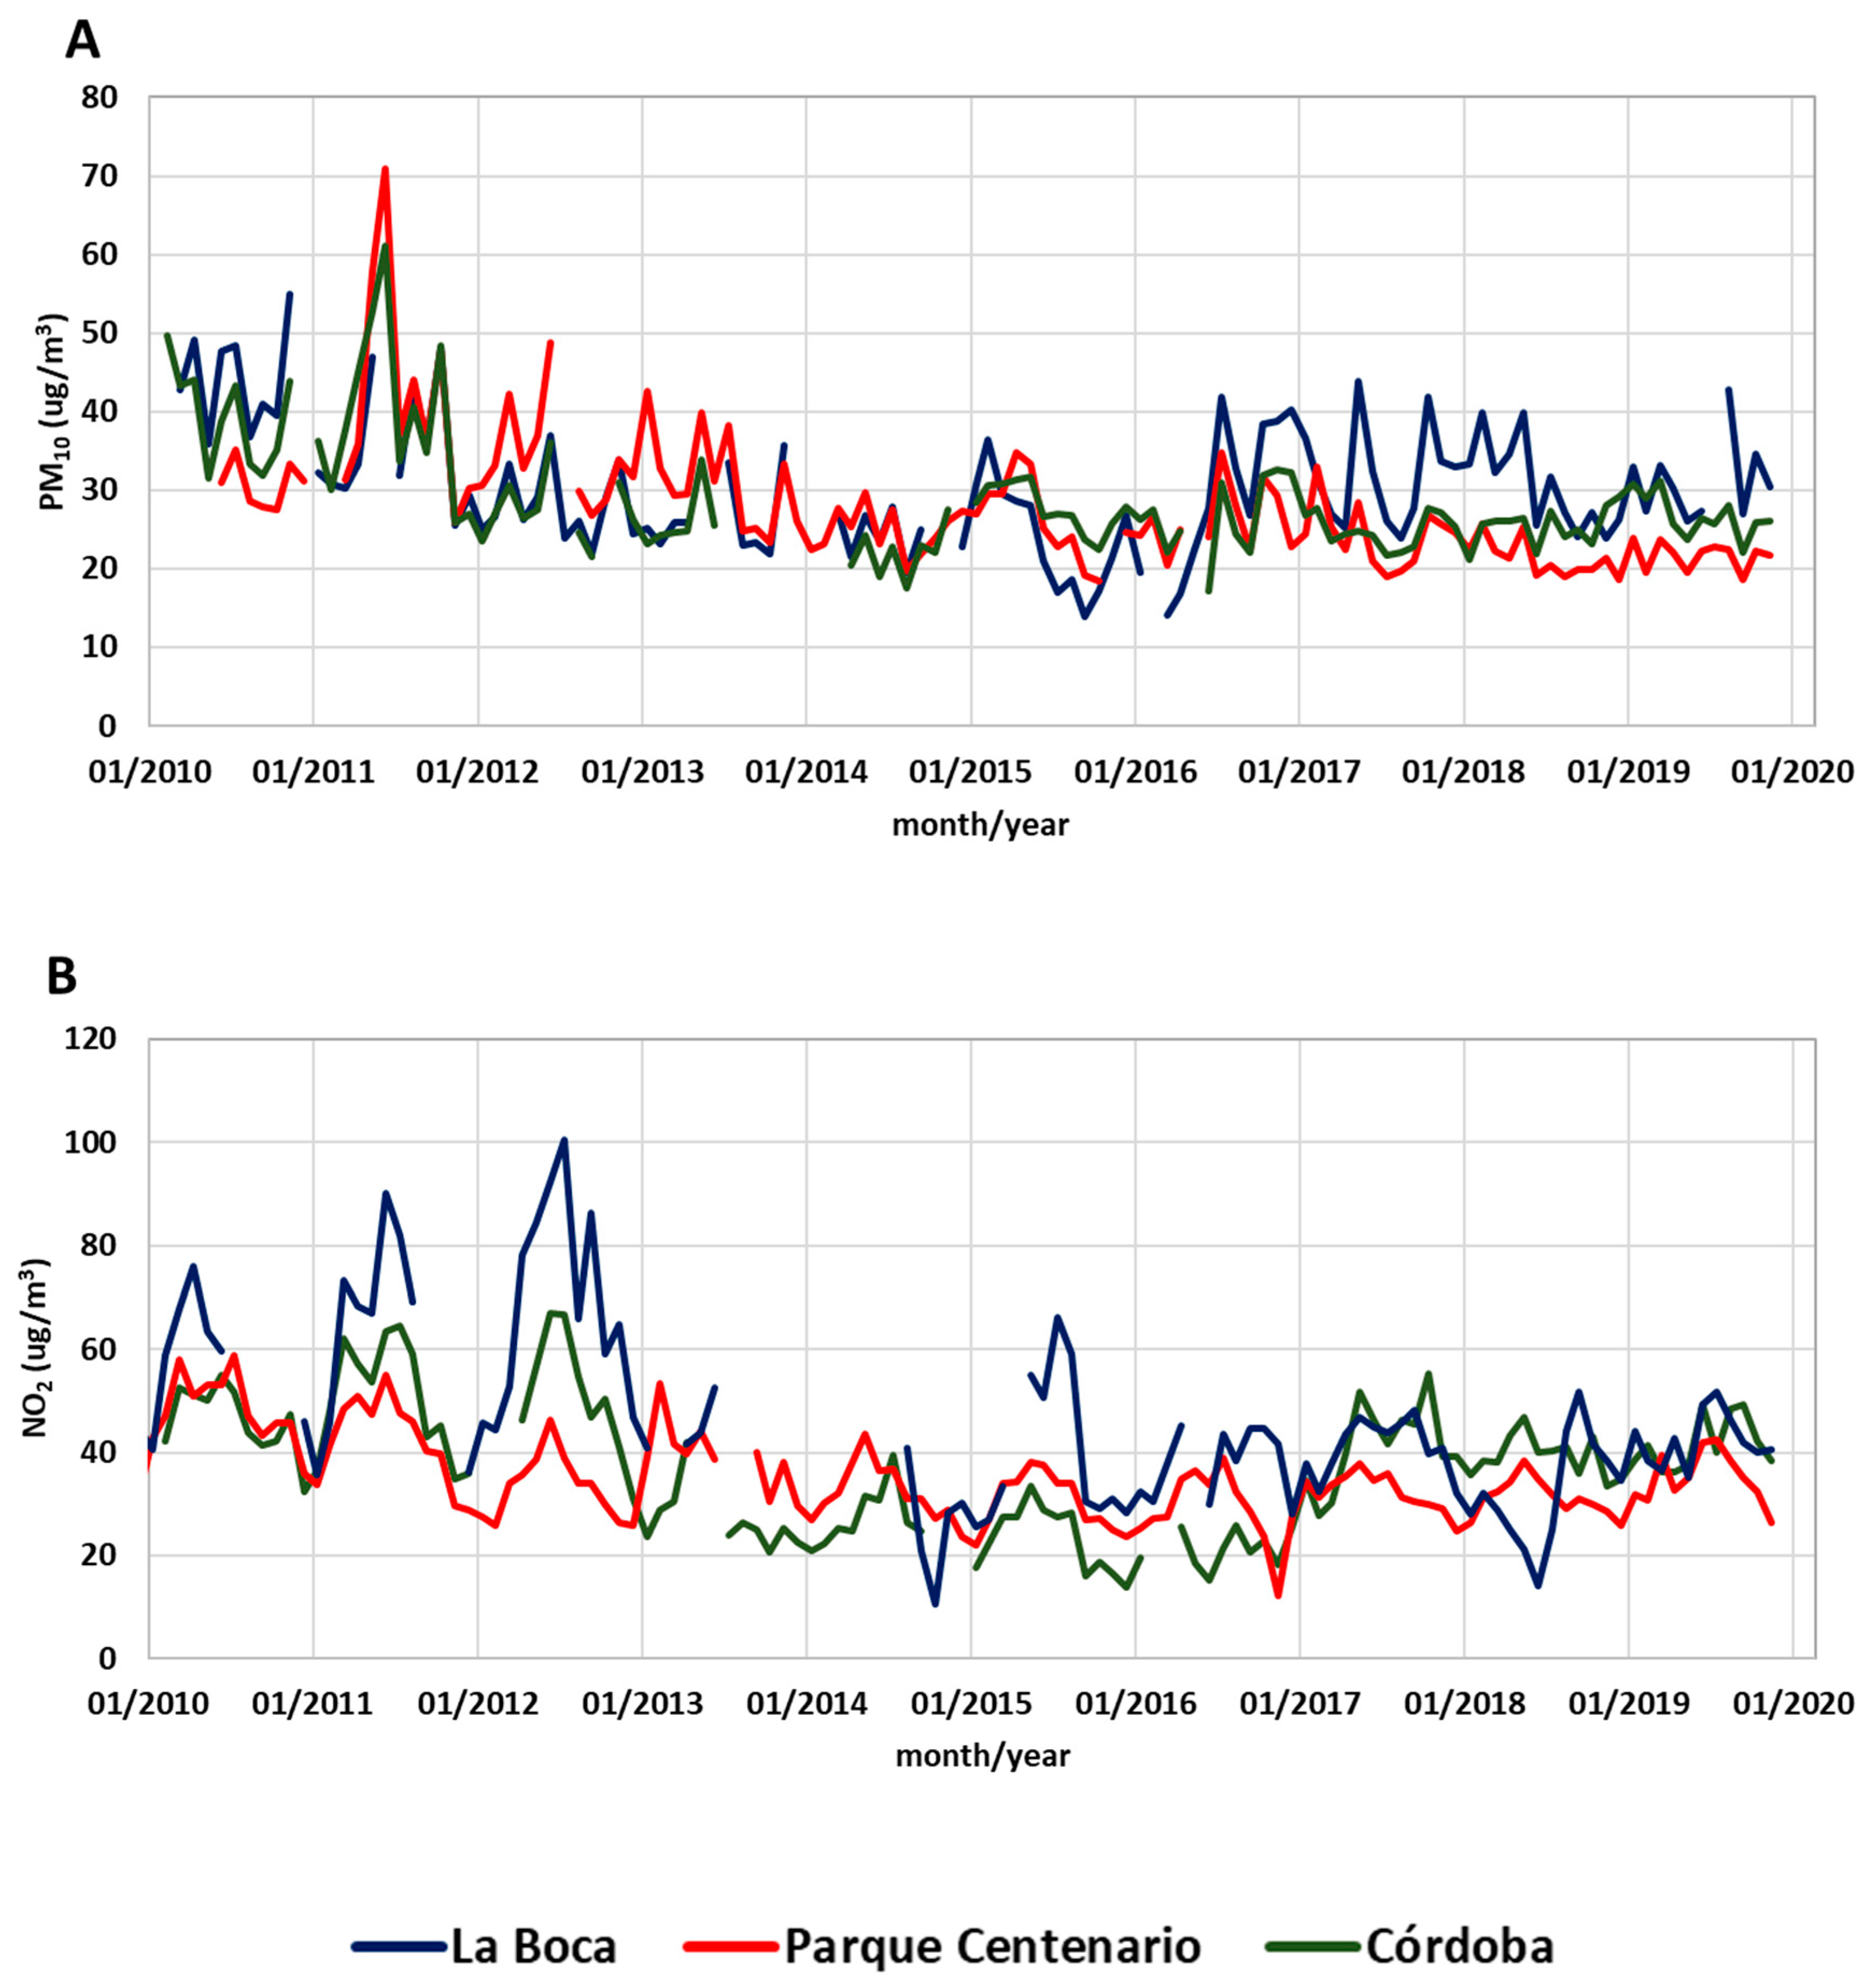
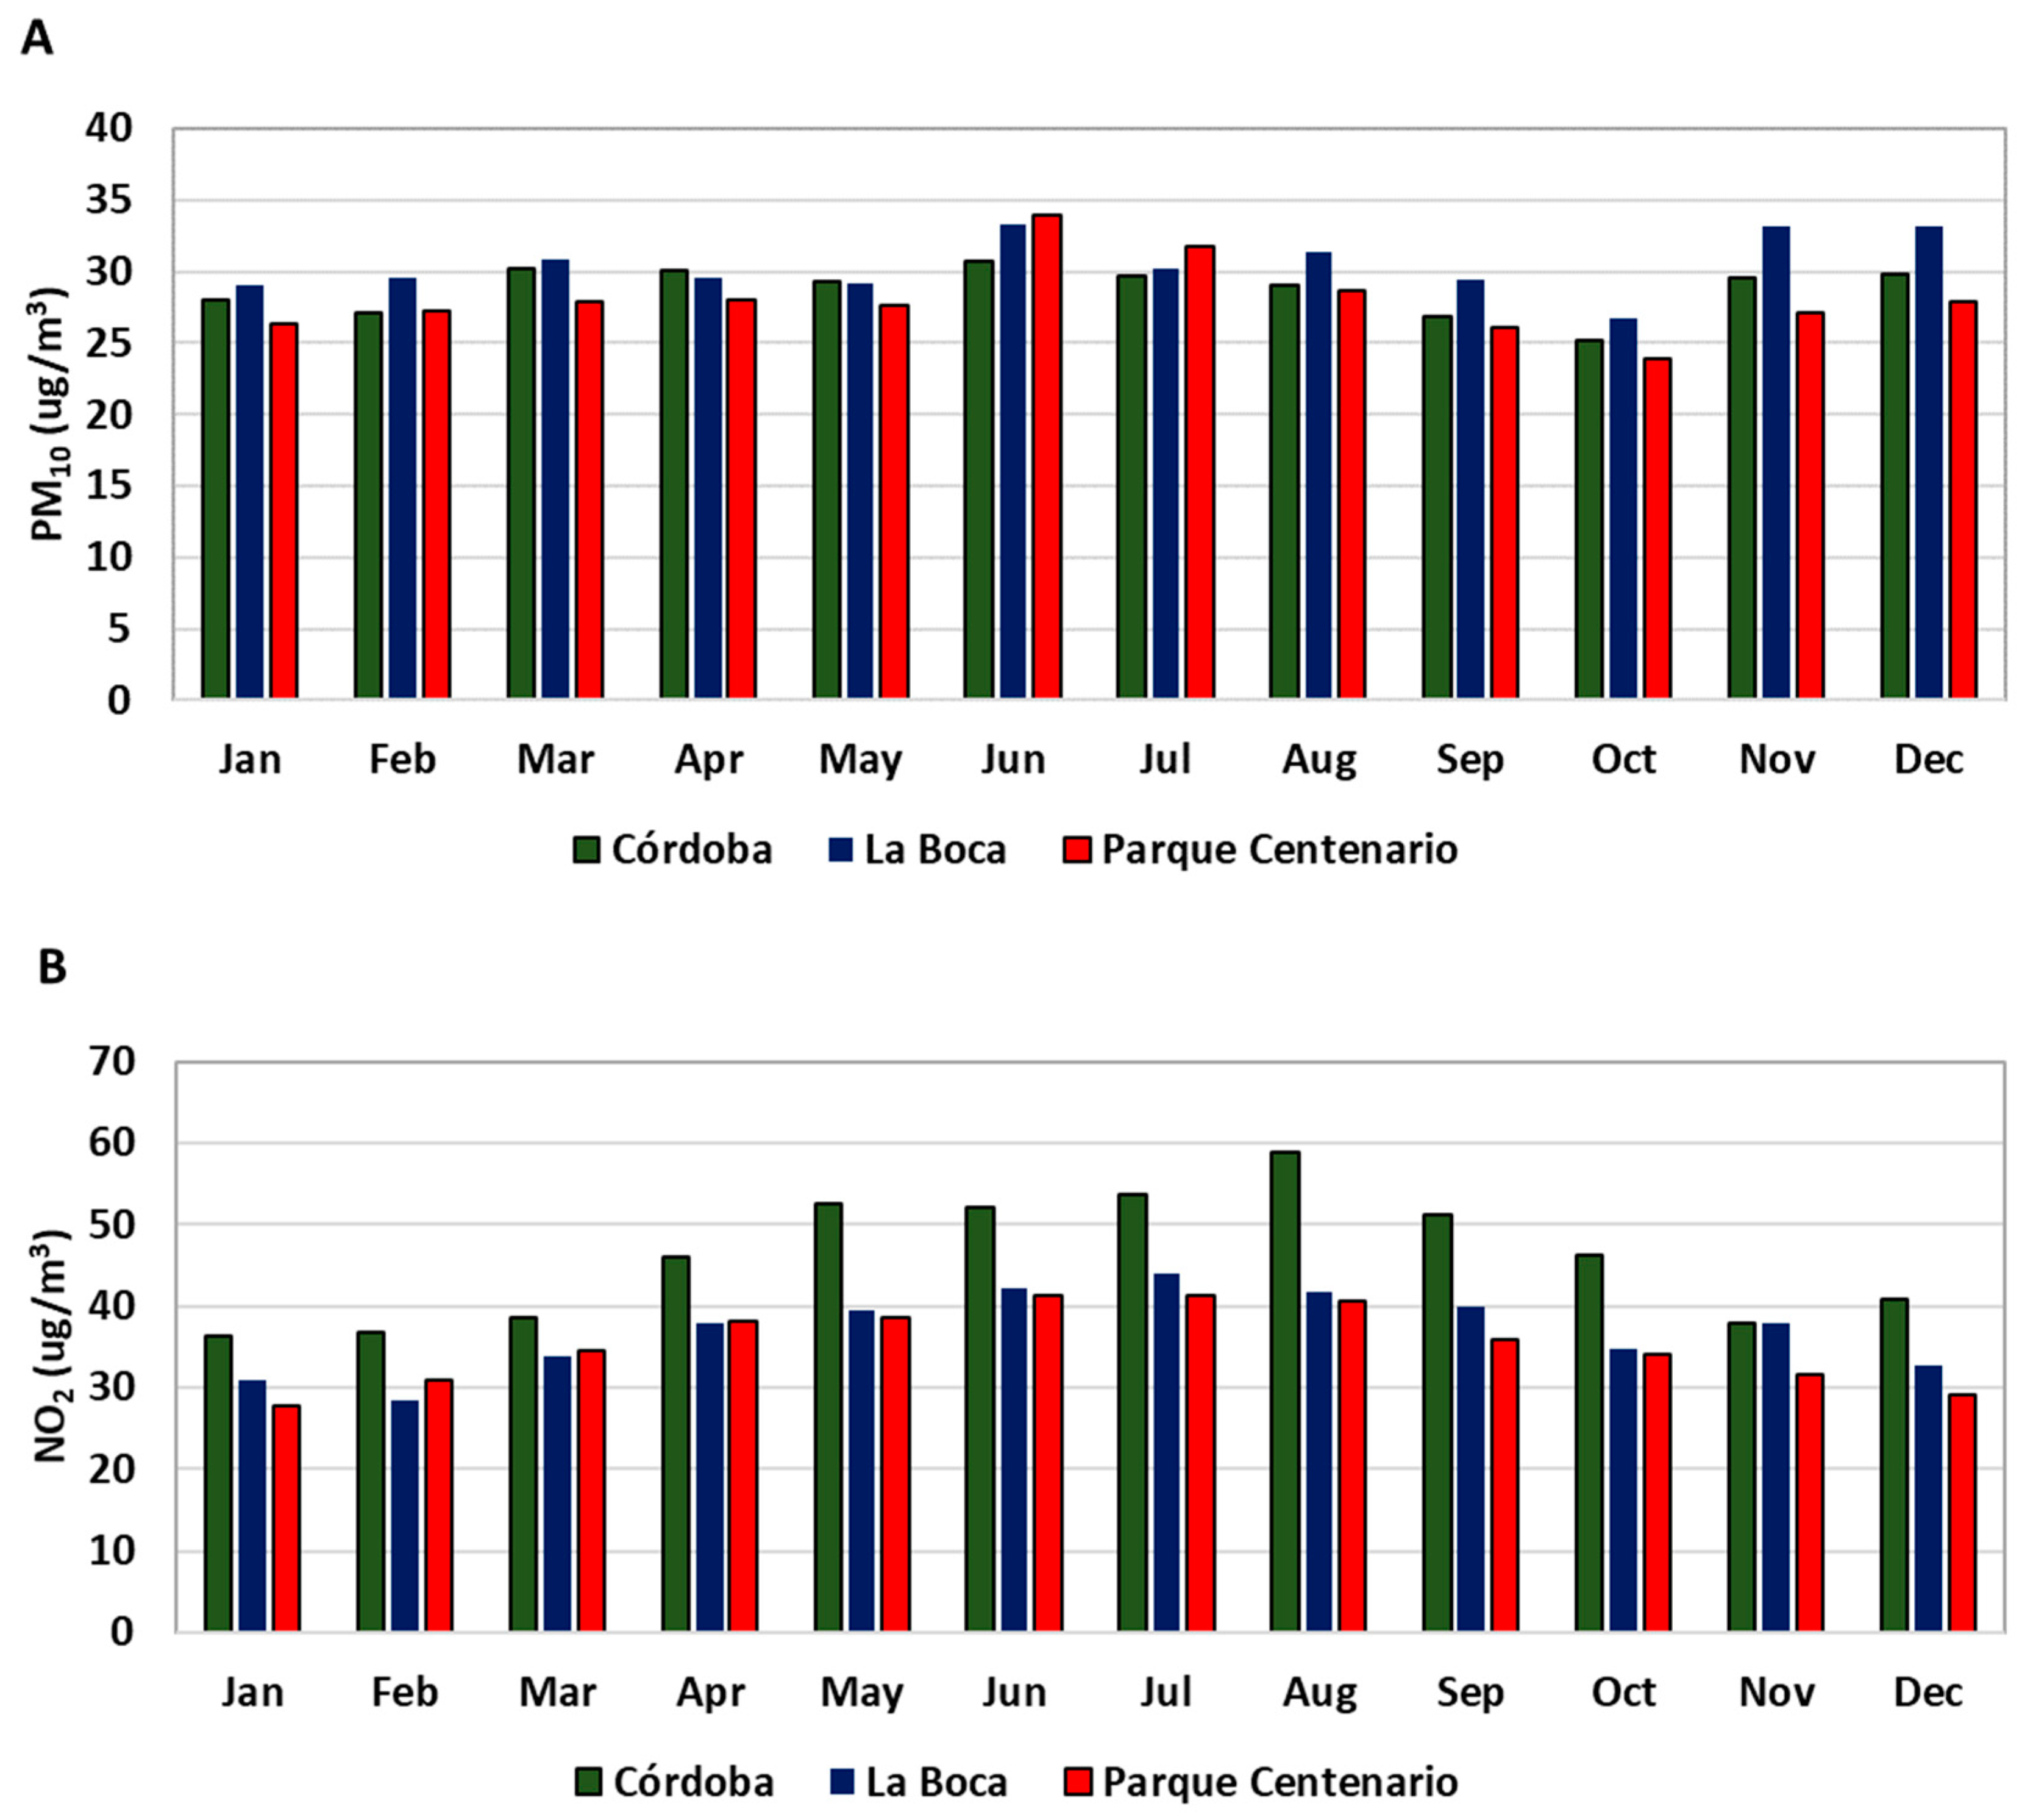
| Argentina | - | - | - | - | 38–73 | 41–75 | - | This study (see Figure A1 and Figure A2) |
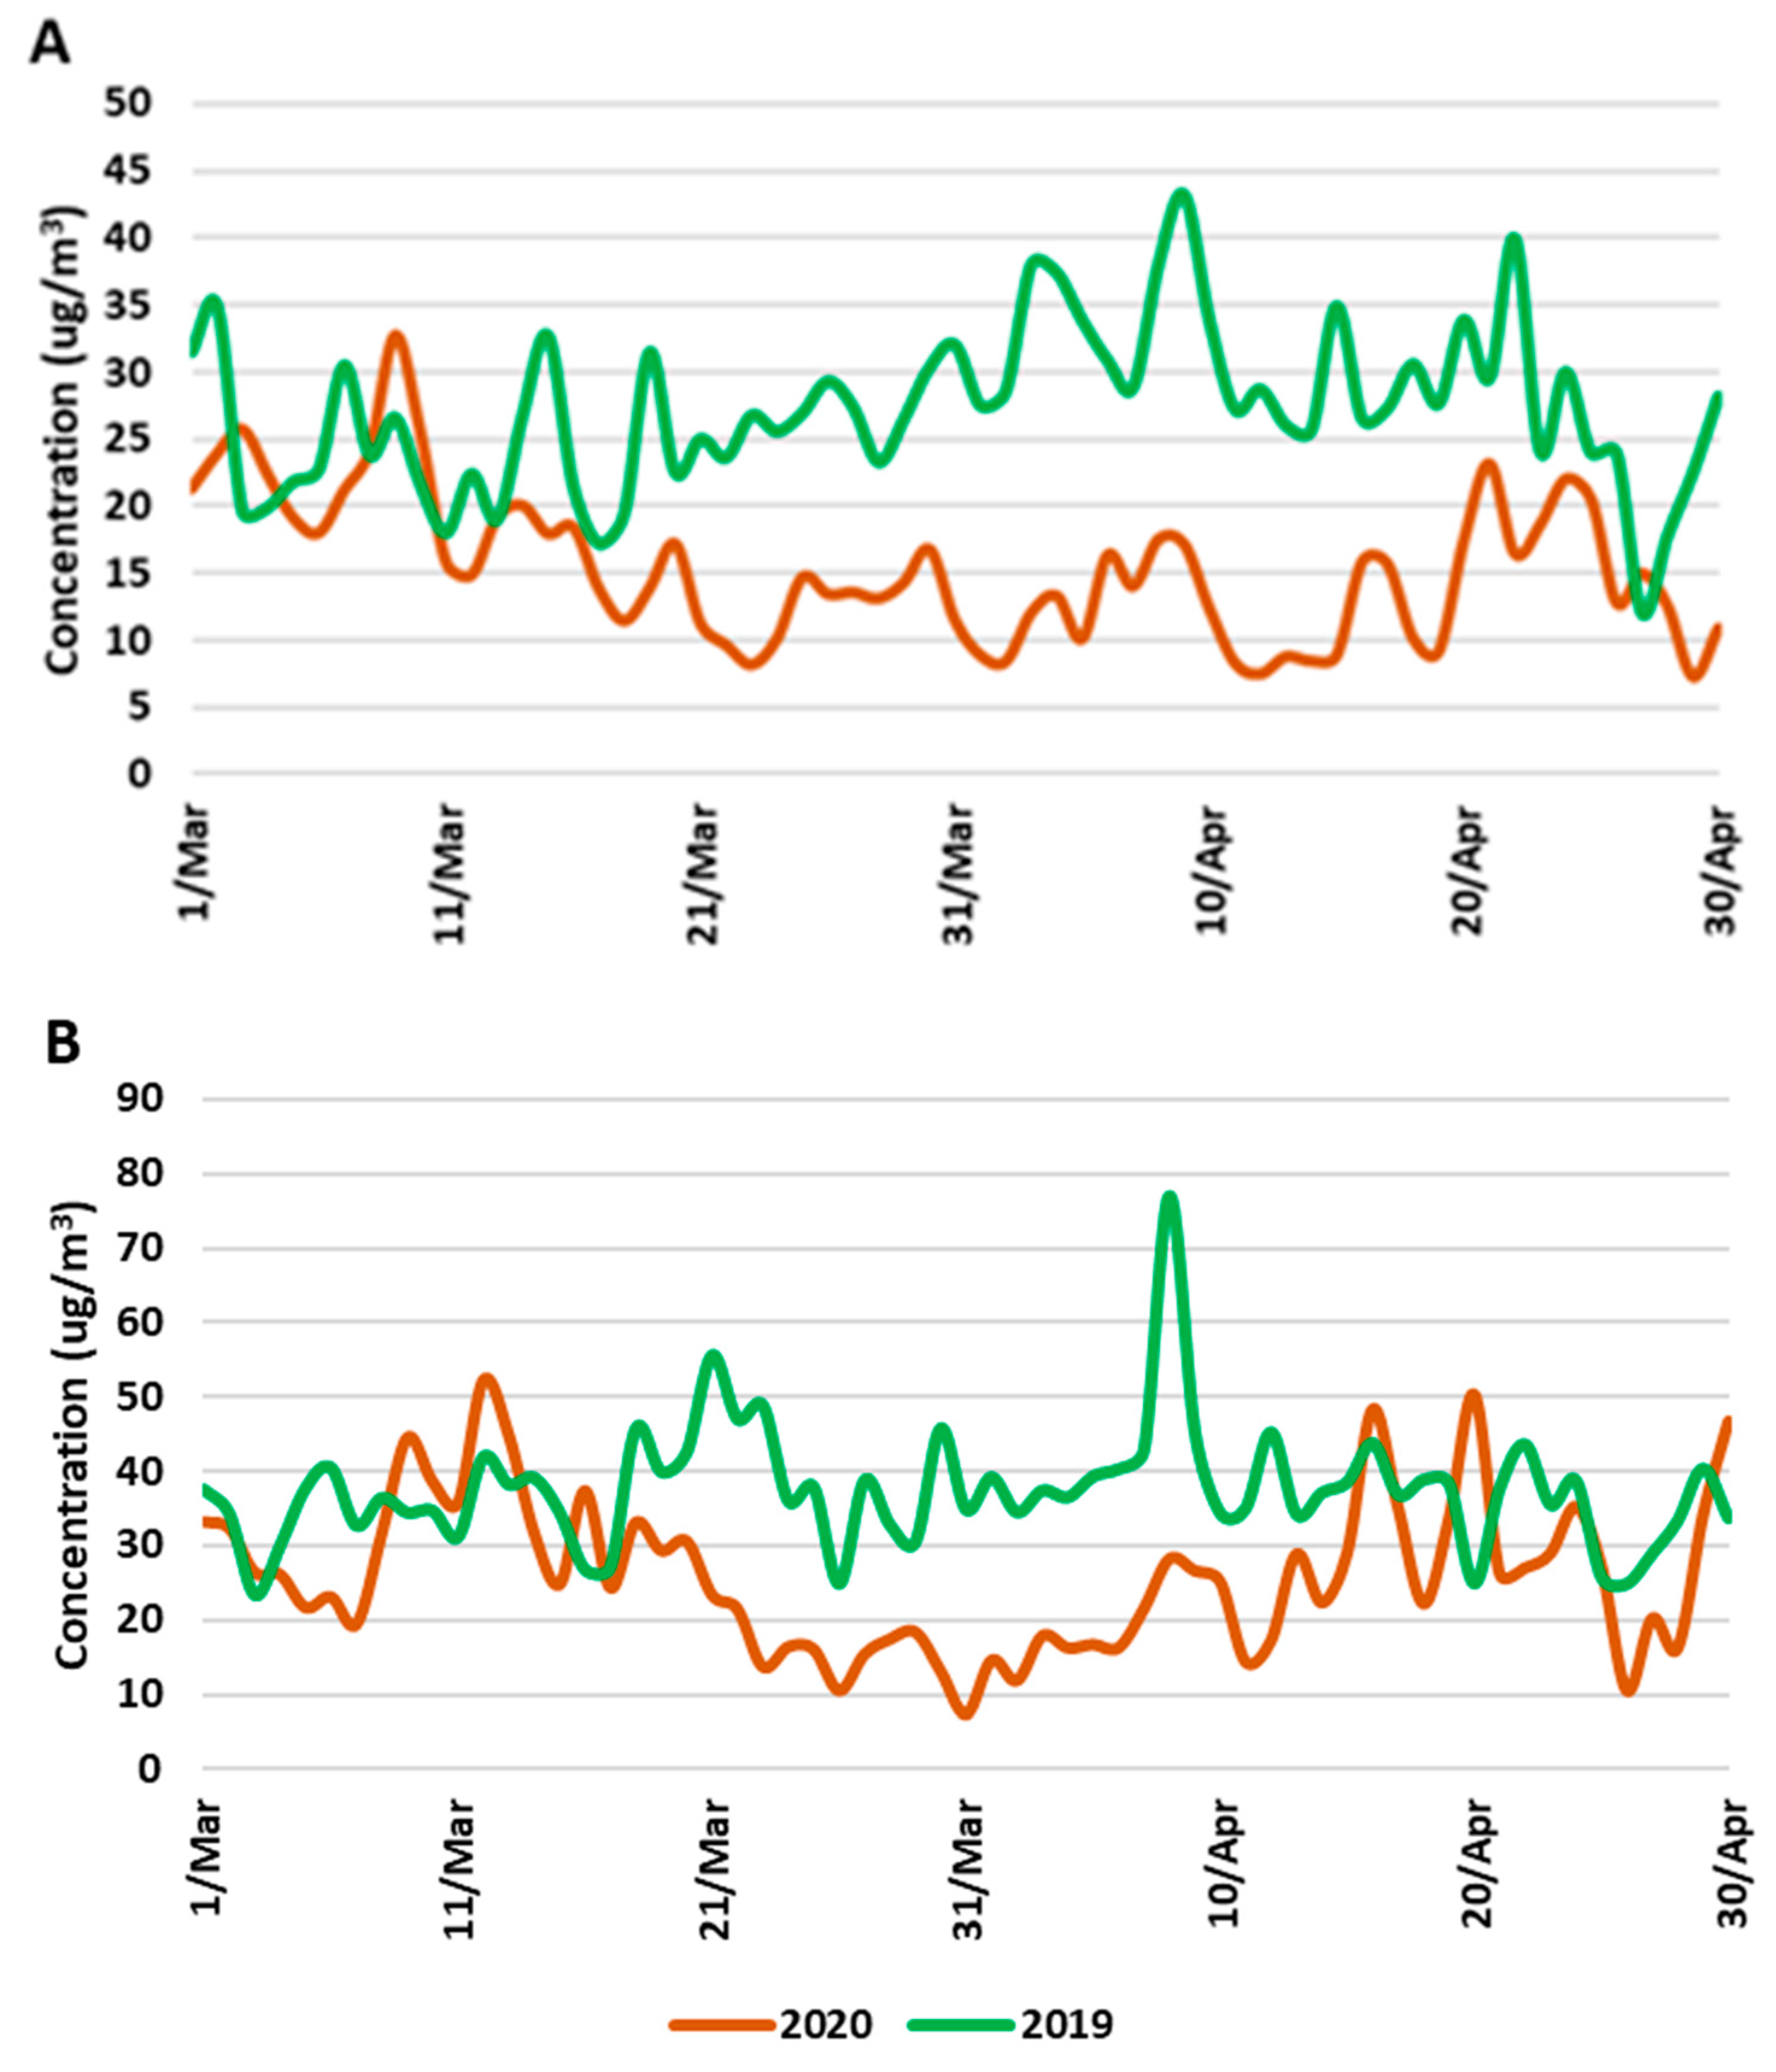
| Buenos Aires City, Argentina | 44 | - | - | - | 82 | - | - | This study (see Figure A3) |
Publisher’s Note: MDPI stays neutral with regard to jurisdictional claims in published maps and institutional affiliations. |
© 2020 by the authors. Licensee MDPI, Basel, Switzerland. This article is an open access article distributed under the terms and conditions of the Creative Commons Attribution (CC BY) license (http://creativecommons.org/licenses/by/4.0/).
Share and Cite
Bolaño-Ortiz, T.R.; Puliafito, S.E.; Berná-Peña, L.L.; Pascual-Flores, R.M.; Urquiza, J.; Camargo-Caicedo, Y. Atmospheric Emission Changes and Their Economic Impacts during the COVID-19 Pandemic Lockdown in Argentina. Sustainability 2020, 12, 8661. https://doi.org/10.3390/su12208661
Bolaño-Ortiz TR, Puliafito SE, Berná-Peña LL, Pascual-Flores RM, Urquiza J, Camargo-Caicedo Y. Atmospheric Emission Changes and Their Economic Impacts during the COVID-19 Pandemic Lockdown in Argentina. Sustainability. 2020; 12(20):8661. https://doi.org/10.3390/su12208661
Chicago/Turabian StyleBolaño-Ortiz, Tomás R., S. Enrique Puliafito, Lucas L. Berná-Peña, Romina M. Pascual-Flores, Josefina Urquiza, and Yiniva Camargo-Caicedo. 2020. "Atmospheric Emission Changes and Their Economic Impacts during the COVID-19 Pandemic Lockdown in Argentina" Sustainability 12, no. 20: 8661. https://doi.org/10.3390/su12208661