1. Introduction
Among agricultural machines, the self-propelled ones require higher amounts of oils for operating the hydraulic system and for the lubrication of the transmissions [
1]. In many cases, mostly in tractors, both functions are performed by a single oil, commonly called UTTO (Universal Tractor Transmission Oil). When the hydraulic function of the machine is predominant (e.g., harvesters), different specific products are employed.
The oils used in agricultural machines are commonly mineral or synthetic and specific fluids, defined according to SAE (Society of Automotive Engineers) international standards; they are generally recommended by the manufacturers on the basis of functional tests, performed internally or entrusted to specialized test centres [
2], aimed at optimizing their machines’ performances during an interval of time of the longest possible duration.
More generally, the tribological characteristics of lubricants and hydraulic fluids are evaluated in a laboratory under specific test conditions aimed at verifying resistance to aging (TOST, turbine oxidation stability test [
3], for hydraulic fluids; RPVOT, rotary pressure vessel oxidation test for hydraulic and gear fluids [
4]), their anti-wear and anti-corrosion properties (copper corrosion [
5], rust prevention characteristics [
6]), their toxicity and biodegradability, recently established in the Ecolabel’s “User manual” for lubricants [
7] and through the measurement, according to standard methods, of typical parameters such as density [
8], kinematic viscosity [
9], Total Acid Number, TAN [
10], water content [
11] and the presence of wear metals [
12]. Under normal operating conditions, the values of each parameter must vary within a standard range that ensures the maintenance of optimal oil performance. Depending on the severity of the working conditions, the wideness of the variations can exceed this interval, accelerating the deterioration of oil properties. Shear stress due to high temperatures and pressures in hydraulic plants [
13], mechanical-thermal stress caused by power transmission inside gearboxes [
14] and the presence of contaminants [
15] are some of the main factors that, individually or combined, can affect oil properties and accelerate its degradation.
The use of oils characterized by low biodegradability and high toxicity can affect the environment [
16]. In 2011 the consumption of lubricants in Europe was about 5.2 million tons, with an assessed dispersion in the environment of 23% (ground, aquifer, air) [
17]. The execution of agricultural operations, e.g., connecting and disconnecting hydraulic devices to the tractor hydraulic system, often causes oil to be dispersed in the environment, including fields containing food crops for humans and animals. Such oil leaks could be quantified by monitoring the periodical refills carried out on tractors: according to an informal poll on a series of contractors in North-Western Italy, the oil leaks from the hydraulic couplers may reach 2 L year
−1 per tractor without oil collectors.
For this reason, the attention of oil manufacturers has been increasingly focused on the introduction of products with higher biodegradability, such as synthetic esters from modified petroleum components, with satisfactory technical performances and durability [
18,
19,
20] and ultimate biodegradability up to 70% [
21]. More recently, there was an improvement in the attempts to introduce bio-based fluid, i.e., obtained from vegetable oils suitably modified in order to achieve performances comparable to traditional oils, with the purpose of reducing their impact on the environment and dependence on petroleum. In comparative laboratory tests, they proved to have good tribological properties [
22,
23], good fatigue life and anti-wear characteristics [
24,
25] and low toxicity [
26], with ultimate biodegradability, always higher than mineral lubricants, ranging from 70% to 100% [
27]. Before the introduction of bio-based fluids in real-world conditions, these encouraging results have to be confirmed in tests representative of real working conditions, where their performance must be at least equivalent to those of the conventional fluids they have to replace. In this respect, a first series of tests on a tractor in service showed good performance of a bio-based UTTO fluid compared to a conventional one [
28]. However, in spite of its relative short duration, the test also evidenced the initial process of fluid degradation. Such results, beyond the need to improve the quality of the fluid formulation to avoid the risk of serious tractor damage, also suggested a different approach based on the use of a test rig capable of applying work cycles representative of real operativity to the fluids (lubricants and hydraulic). Such an approach was developed within the research project BIT
3G (Industrial Bio-refinery of 3rd Generation) coordinated by Novamont S.p.A., Novara, an Italian company engaged in the sector of green chemistry. The possibility of introducing bio-based oils in agricultural machines was one of the subjects of the project. In particular, the “Realization Objective 4 g” (O.R. 4 g—Test validation of biolubricants) directly involves the CREA Research Centre for Engineering and Agro-food Processing of Monterotondo (Rome, Italy) in the study and realization of a test system whose aim was to compare the performances of traditional vs. bio-based oils as a preliminary evaluation step, before starting tests on tractors [
29].
The system consists of a fluid test rig (FTR) designed to perform short-duration, high-intensity work cycles representative of the utilization of the fluid on a tractor, according to a purpose-developed test methodology (TM).
This paper describes the FTR and the TM and reports the results of the tests on FTR’s functionality, carried out with two UTTO fluids: a conventional one widespread on the market and an experimental vegetable oil-based formulation provided by Novamont S.p.A.
2. Materials and Methods
The subject of this research was a test system for assessing the suitability of bio-based fluids (such as hydraulic fluids, transmission lubricants and UTTO fluids) for use in agricultural machinery. For this purpose, work cycles representative of the workloads sustained during the normal use of the tractor (in terms of mechanical, thermal and hydraulic stresses) during its lifetime should be able to be applied to the fluid being tested. With regard to the longevity of the fluids, depending on the applications, it can be some thousand hours or a tractor’s “life-time” for hydraulic fluids, while the average duration of the UTTO fluids, commonly used in agricultural tractors, is 800–1000 h corresponding to the time interval between two oil changes and to about 1 year of work in the case of intense tractor use, as in the case for contractors. These would represent excessive time intervals for the testing of a fluid, given the frequent need to provide answers as rapidly as possible. Alternatively, it is possible to reduce the duration of the tests by applying severe workloads to small volumes of fluid, in controlled conditions, in order to accelerate their aging by means of a proper test rig specially designed to apply well-defined work cycles.
The correspondence between a simulated work cycle and a real work cycle could be established on the basis of the global energy (kWh) meanly “conveyed” by the fluid volume unit (dm3) during the operations performed by the hydraulic system and/or the transmission, in given time intervals, thus representing the “specific energy” (kWh dm−3) applied. According to such an approach, the variables to consider in the evaluation of a fluid’s performance are those typical of the power transmission systems (efficiency, gearbox torque and speed, fluid operating temperature, thermal leap) and of the hydraulic systems (fluid pressure and flowrate, fluid operating temperature, thermal leap): it must be possible to control and adjust them with accuracy during the work cycle so that the same conditions can be repeated comparing different fluids. For example, referring to the annual operativity of a tractor, considering the duration of the different operations, the average workloads and thermal conditions they determine and the volume of fluid in the reservoir, it is possible to assess a value of the “specific energy”. Such a value, in a simulated work cycle, can be applied to a fluid volume smaller than the 80–180 dm3 commonly present in tractor reservoirs.
2.1. Fluid Test Rig (FTR)
The FTR was developed starting from a first version that was limited to performing tests on hydraulic fluids under maximum temperature conditions of 80 °C [
30]. In the present study it has been adapted in order to allow tests on lubricants for transmissions and to increase the thermal stress on the fluid, with the aim of accelerating its aging. At present, in its final configuration, the FTR consists of a “
main circuit” designed to supply two operating circuits: a “
hydraulic section” and a “
transmission section”. Such sections can be operated in combination (for tests on UTTO) or separately (in specific tests on hydraulic fluids or lubricants for transmissions) by the opening/closing of suitable valves.
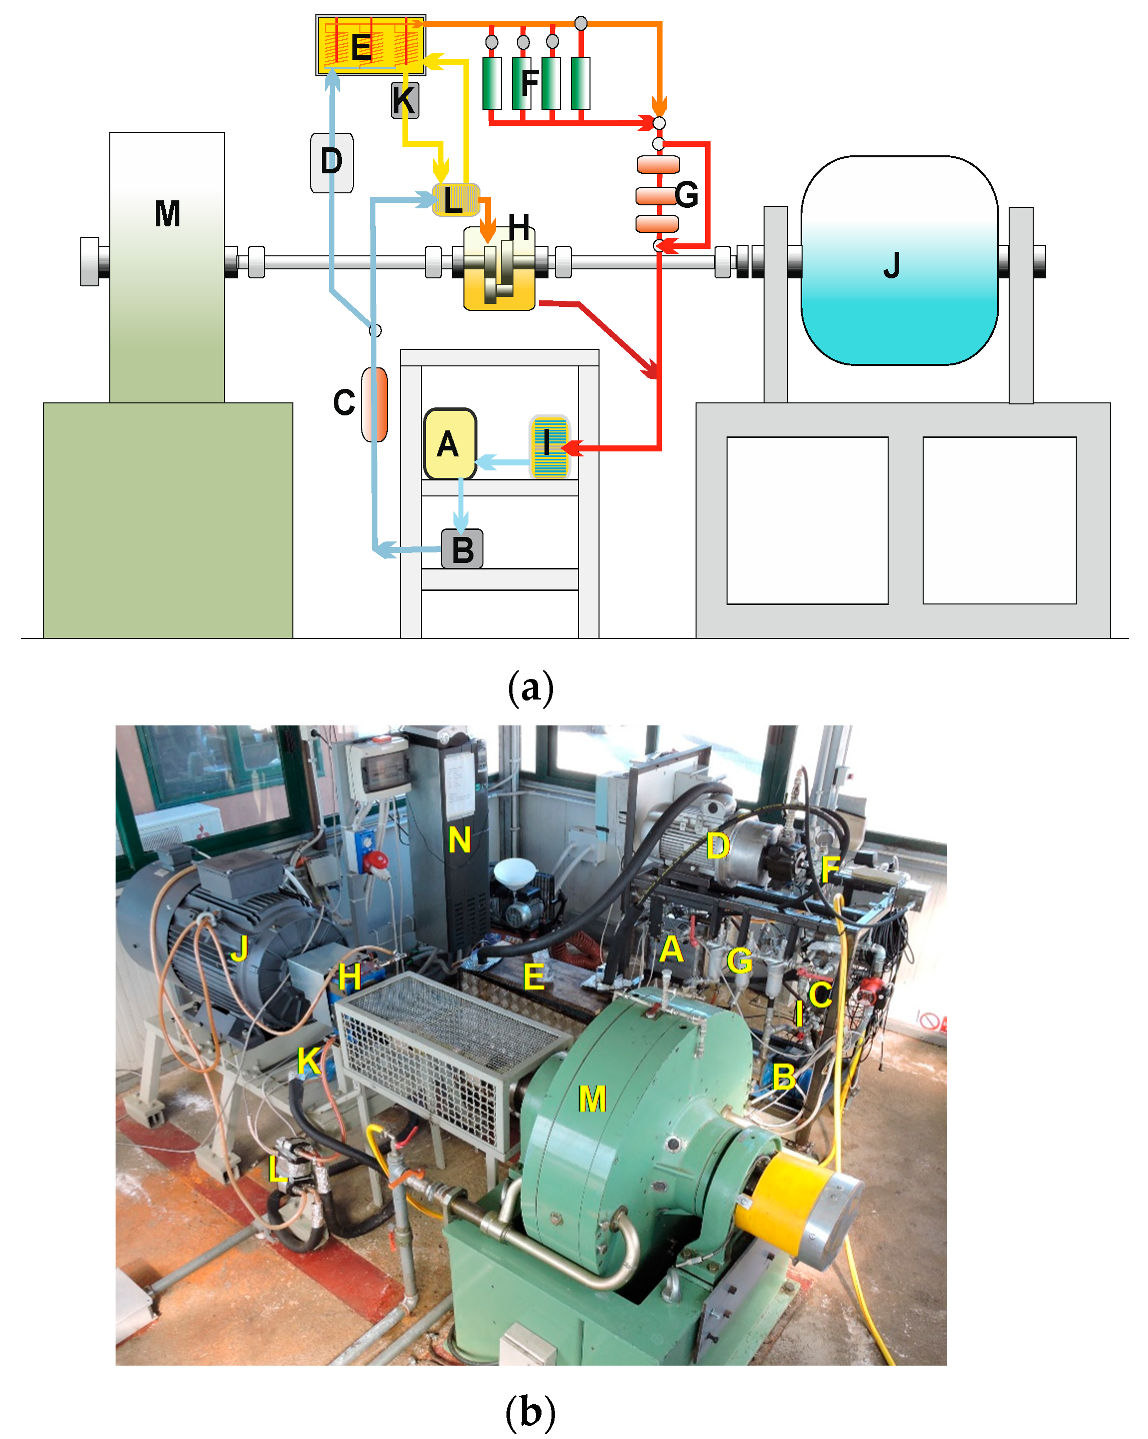
Figure 1 reports a schematic representation of the FTR and shows how it has been integrated within the testing room formerly devoted to tractors tests, through the connection to a dynamometric brake and an electric engine.
The “main circuit” of the FTR consists of the following parts: reservoir for the test oil, with 30 dm3 capacity; centrifugal pump (Ebara, mod. Matrix-TE3, Vicenza, Italy; 80 dm3 min−1 max flowrate; 0.5 MPa max pressure; 0.75 kW power) for the circulation of oil in the low-pressure section of the circuit; digital pressure gauge (Kobold, mod SEN-319701-B035, Hofheim am Taunus, Germany) and maximum pressure valve (keeping it below 0.15 MPa); main filter, with a cellulose cartridge of 25 μm filtration mesh to protect the radial piston pump in operation; three-stage filter system (Bosch Rexroth 50LEN040, Lohr am Main, Germany), with fiberglass cartridges of 3, 6, 10 μm filtration mesh respectively, for fractional filtration of the suspended material (the filter cartridges are intended for analysis) and filters by-pass (opened when the fractional filtration is not required); oval gears flow-meter (Kobold, mod. DON-215HR31HOMO, Hofheim am Taunus, Germany), monitoring the fluid flowrate; braze-welded plates oil-to-water heat exchanger (Pacetti s.r.l., mod. BV 50–40 plate, Ferrara, Italy), restoring oil temperature within the operative interval before returning to the tank.
The “hydraulic section” has the function of applying a hydraulic workload to the fluid. It consists of the following elements: high-pressure radial piston pump (Atos, mod. PFR203, Sesto Calende, Italy; 50 MPa max. pressure; 5 kW max. power; 1800 min−1 max. speed; 3.5 cm3 displacement; 6.3 dm3 min−1 max. flow); digital inverter (Toshiba, mod. VF-ASI 4055 PL-WP, Tokyo, Japan) controlling the pump; distributor block with solenoid valves directing the fluid to one of four pressure valves (Bosch Rexroth, mod DBDS 6G 1X, preloaded for overpressure at 10, 20, 30, 40 MPa, Lohr am Main, Germany) or in free flow, according to the pre-set pressure values indicated by the work cycle; digital pressure gauge (Kobold, mod SEN-319701-A165, Hofheim am Taunus, Germany); a fluid heating unit designed to create additional controlled thermal stress conditions on the fluid, avoiding at the same time that the high temperature reaches the most delicate components of the plant. The fluid heating unit was one of the upgrades on the original FTR design, aimed at inducing significant variations in the lubricating properties and technical performance of the fluid being tested, accelerating its aging. It was installed after the exit of the high-pressure pump and before the overpressure valves: the fluid’s line was divided into 5 parallel, spiral-shaped steel pipes (each 6 m long, and with a 6 mm inner diameter), immersed in a compact insulated tank (60 dm3 capacity), containing a water/ethylene glycol solution heated by three electric resistors (maximum power required: 5.4 kW). The temperature of the solution can be adjusted up to a maximum of 110 °C, still compatible with normal fluid operativity, avoiding the risk of thermal “cracking”. A manifold collects the oil outflow from the 5 spirals, sending it to the high-pressure valves where, in addition to the thermal stress, it undergoes further mechanical stress due to fluid lamination. The fluid heating unit allows the surface and the time of contact between fluid and heating solution to be increased, thereby ensuring that the fluid does not come into contact with excessively hot surfaces, such as those of the electric resistors.
The “
transmission section” aims at reproducing the work conditions the lubricant would find in a transmission gearbox (e.g., of a tractor), where it dissipates the thermal energy generated in the contact between gears and, at the same time, its molecules undergo direct mechanical stress. In the FTR a simplified transmission was employed represented by a parallel shafts gear reducer (Rossi mod. RI80UP2A, transmission ratio: 1/2.54,
η: 0.94, Modena, Italy), with a single pair of helical gear wheels in an oil bath. The device was originally provided with the “for life” synthetic oil Shell OMALA S4 W E220 (main characteristics from the technical data sheet: kinematic viscosity at 40 °C: 222 mm
2 s
−1; kinematic viscosity at 100 °C: 34.4 mm
2 s
−1; viscosity index: 203; density: 1.074 g cm
−3; pour point: −39 °C; flammable point: 298 °C). The lubrication system was modified, exploiting the pre-arranged inlet (bottom) and outlet (top) holes, to allow the continuous circulation of lubricant, from the FTR’s reservoir to the speed multiplier and back, through the main heat exchanger. This mode required the top cover of the multiplier to be sealed. Thus, the fluid’s volume in the gear box was 2.6 dm
3 instead of 1.9 dm
3 capacity, related to the “for life” lubrication reported in the technical datasheet [
31]. The gear reducer has been installed opposingly, so as to work as a speed multiplier: its slow shaft is operated by a 6-pole three-phase asynchronous electric motor (maximum power: 37 kW at a speed of 980 min
−1), while the fast shaft is connected to an electromagnetic brake (Borghi & Saveri, mod. FE 600, Bologna, Italy) used to apply a resistant torque opposing the rotation of the gear wheels of the multiplier. The speed of the electric engine is controlled and adjusted by means of an inverter (Siemens, mod. Micromaster 440, Munich, Germany), while the control module of the dynamometric brake allows the resistant torque to be adjusted in order to obtain the desired value of power. In this case too, a heating system was installed in the fluid line entering the multiplier with the aim of increasing the thermal stress. It consists of a small oil-to-water heat exchanger in which the oil from the reservoir is heated in counter-current by the above-mentioned water-ethylene glycol solution circulated by a pump from and to the 60 dm
3 tank.
The FTR is completed by a series of thermocouples and pressure gauges monitoring oil conditions at reservoir output, at circulation pump, at overpressure valves and at speed multiplier. Several oil withdrawal points have been installed to take samples for laboratory analyses on chemical-physical characteristics. Finally, an electronic control and command module has been created to set the FTR functions and the test parameters and store the data. The “
hydraulic” and “
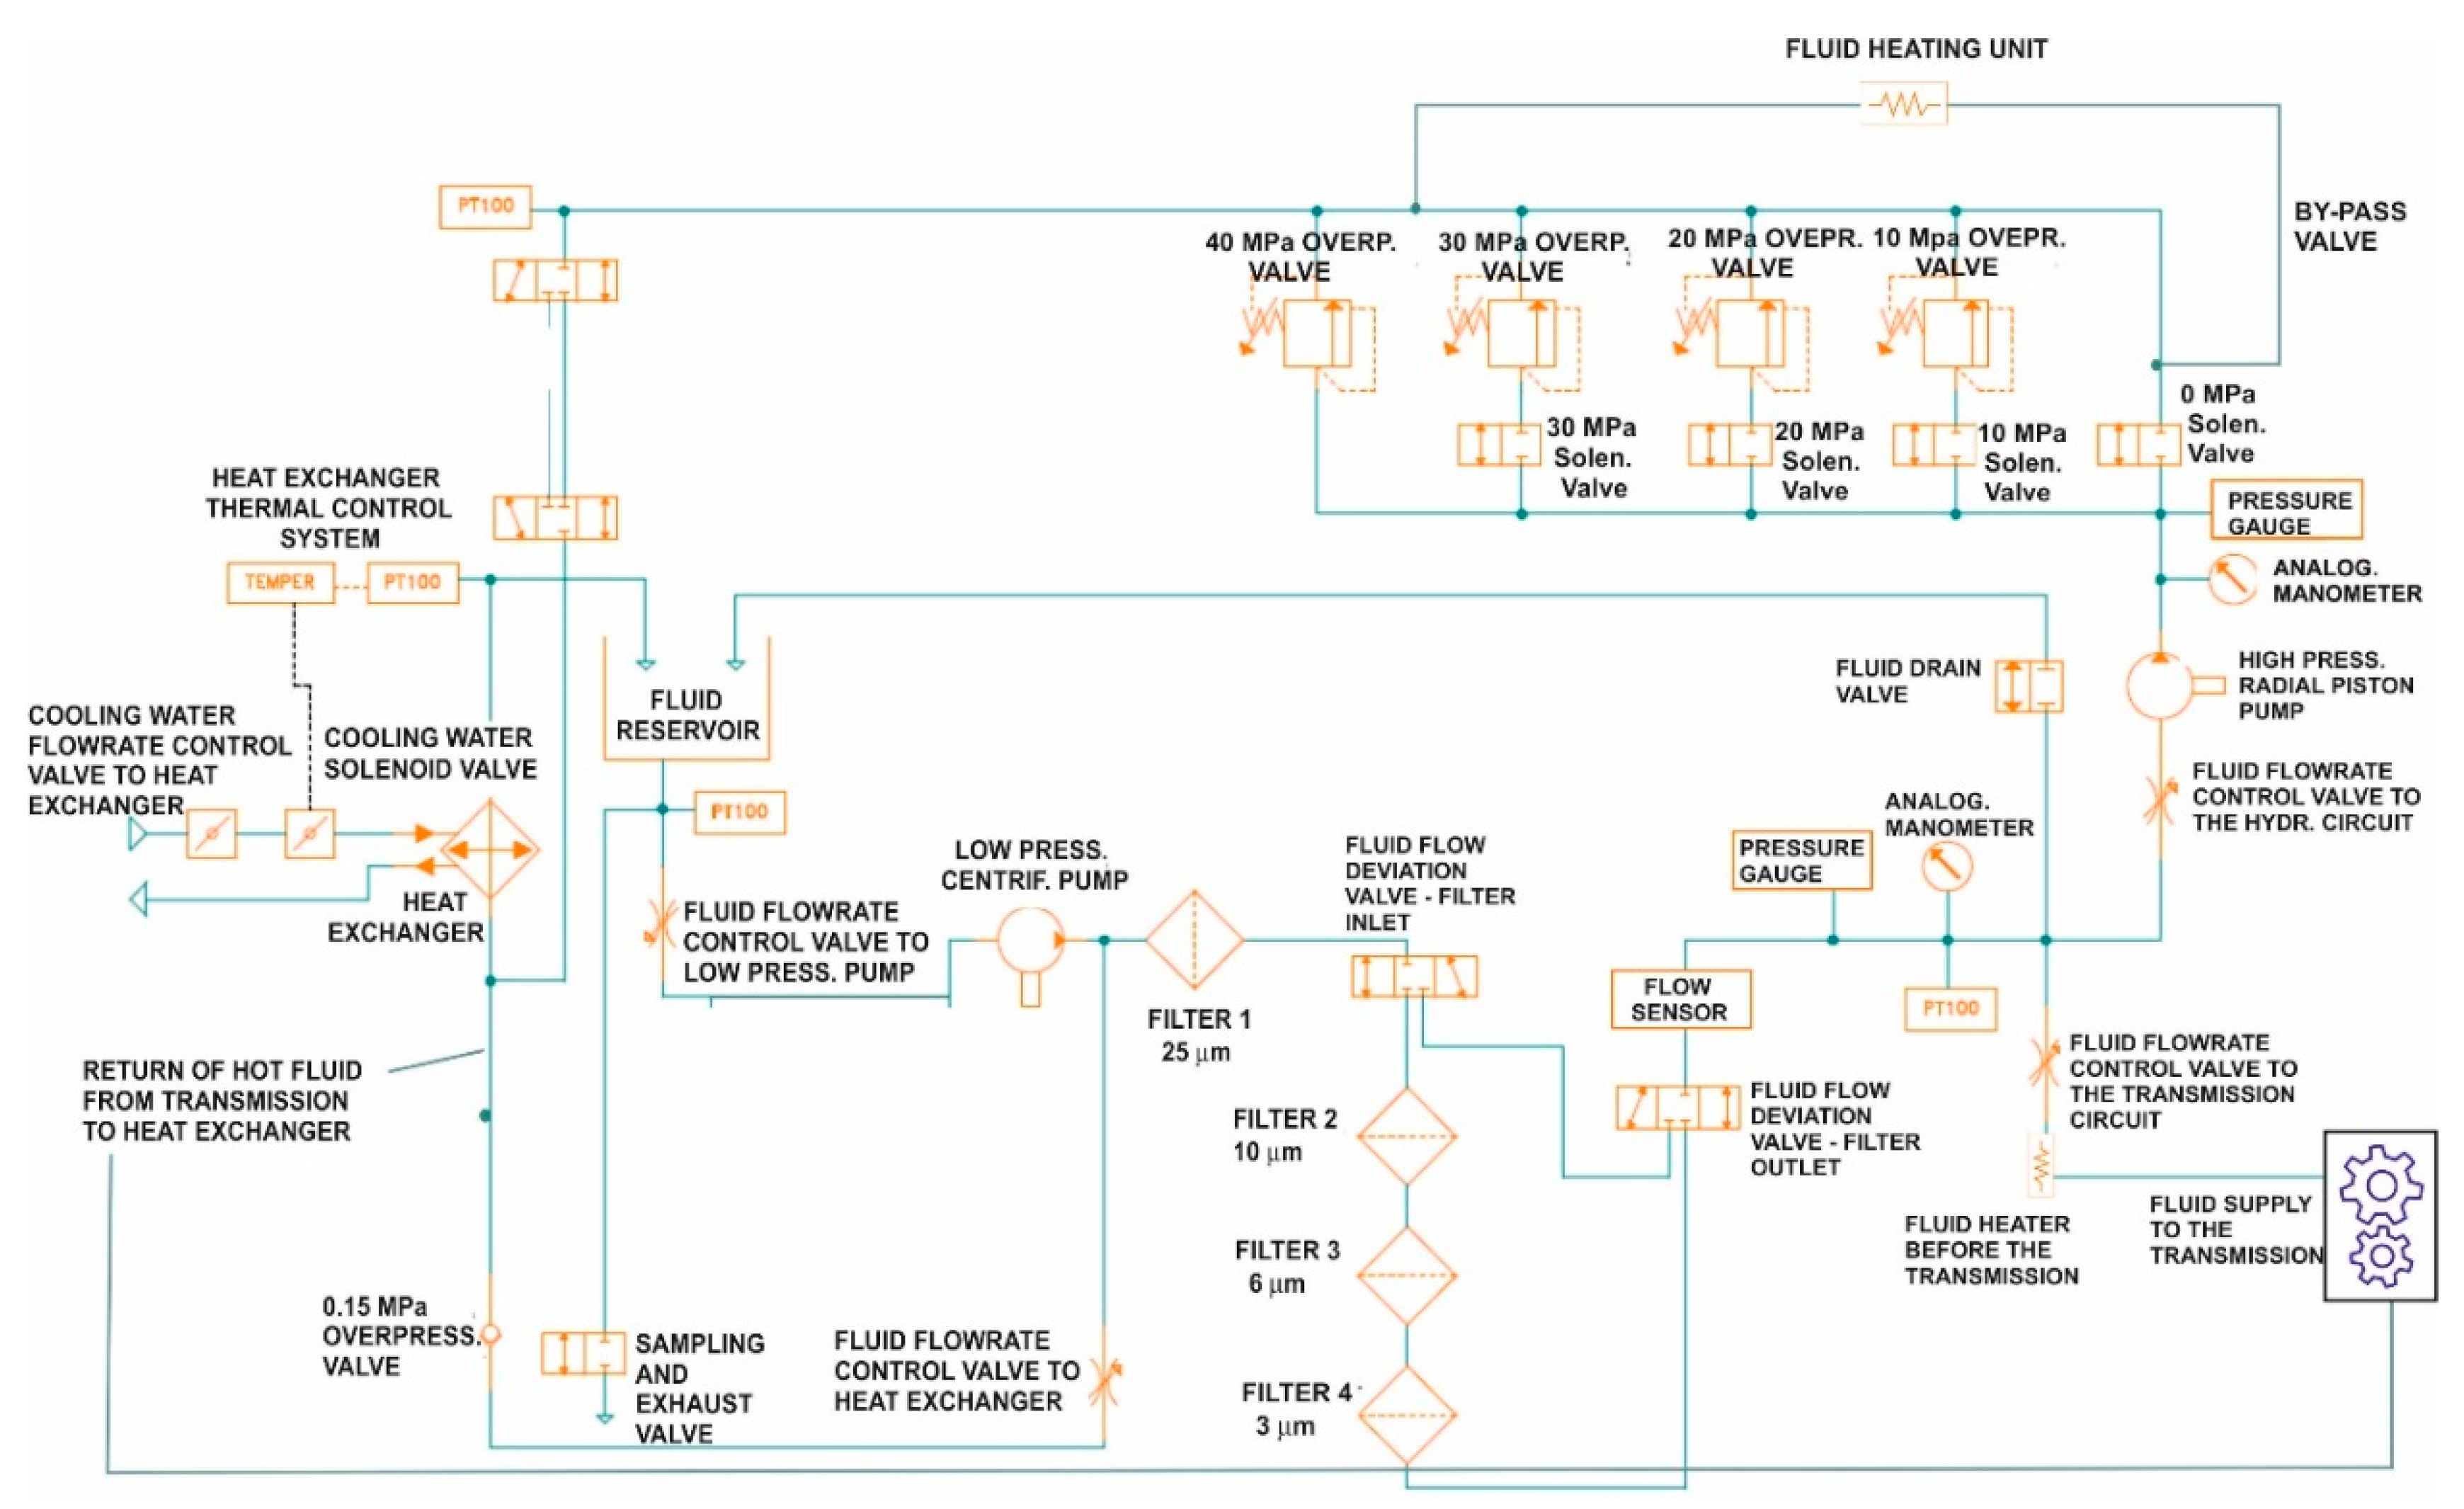
transmission” sections, used singularly or in combination, allow a specific workload to be applied in a given time period, which can be repeated on different fluids for comparative tests. The scheme of the FTR is shown in
Figure 2.
2.2. Fluid’s Path in the FTR
According to the recommendations of the manufacturers of the main FTR components, the fluid’s temperature in the reservoir and in the low-pressure section is set to never exceed 60 °C. From here, the low-pressure centrifugal pump sucks the fluid and conveys it first to the main filter (25 μm) and then to a series of three filters with decreasing filtration meshes of 10, 6 and 3 μm respectively, for the fractional filtration of the suspended fine materials.
Those filters can be bypassed via a specific deviation, conveying the oil directly to a flowmeter for continuous measurement of the flowrate during the test. After the flowmeter, in the case of an UTTO, the fluid is sent to the hydraulic section first and then to the transmission section, while in the case of a hydraulic fluid, it only enters the hydraulic circuit, bypassing the transmission. If the fluid is a lubricant for transmissions, the hydraulic circuit will be bypassed.
In the hydraulic circuit, the fluid reaches the high-pressure radial piston pump. This pushes the fluid through to the fluid heating unit, where its temperature increases from 60 °C to about 80 °C. Finally, a series of solenoid valves convey the fluid to the overpressure valves. These accomplish the lamination of the output oil, determining the fluid’s final, instantaneous thermal leap. The opening sequence of the solenoid valves is carried out according to the desired working pressure. As an example, with the water-ethylene glycol heated at 100 °C and pressure at 40 MPa, the average thermal leap caused by the lamination is 20 °C. Consequently, immediately after the overpressure valve the fluid’s temperature can reach the desired test temperature (i.e., 100 °C).
Regarding the transmission circuit, part of the fluid (UTTO or lubricant) coming from the low-pressure pump is sent to the small fluid heater, where its temperature increases. Then the fluid enters the multiplier gearbox where it exerts the lubrication and the thermal dissipation. With the water-ethylene glycol solution heated at 100 °C and a transmission power of 20 kW applied at the multiplier, the final fluid’s temperature at the multiplier’s output is 87 °C, while if the water-oil heat exchanger is disconnected, the fluid temperature at the output reaches 70 °C.
In both the hydraulic and transmission section the fluid temperature can be adjusted (also exceeding the above values), by properly setting the temperature of the water-ethylene glycol solution (up to a maximum of 115 °C).
The fluid outputs from the hydraulic circuit and from the transmission circuit converge into the main circuit again. Here the fluid is conveyed to the main heat exchanger. In order to increase its efficiency and maintain the system’s thermal balance, the cooling water inlet line was implemented with a flowrate regulator and with a solenoid valve connected to a highly sensitive thermostat: the latter, comparing the pre-set temperature (60 °C) and the actual fluid temperature, controls the frequency of opening/closing of the solenoid valve until their difference is 0. From the heat exchanger the oil is sent directly to the reservoir to start a new cycle.
All sensors and instruments are connected to a data acquisition and control system. This manages both the alarm system (mostly on the basis of the current values of temperature and pressure) and the operating conditions (speed, torque, flow, pressure, temperature) applied to the fluid, determining the workload.
2.3. Fluids Used in the Acceptance Tests
The functionality of the FTR was tested in a trial session (described in Methods) that involved both hydraulic and transmission sections of the FTR to compare the behaviors of two UTTO fluids (
Table 1): (i) a widespread conventional multifunction oil for tractor transmissions and hydraulic systems and (ii) an experimental vegetable-based formulation developed by NOVAMONT S.p.A. From this point on they will be called, respectively, “CF” (i.e., conventional fluid) and “BF” (i.e., biofluid). These tests allow the reliability of the FTR and its suitability to this application to be evaluated, at the same time providing information on the performance of the new bio-based formulation compared to the conventional fluid.
2.4. Test Conditions
The maximum values of torque, speed, flowrate, pressure, power and fluid temperatures applicable to the fluids with the FTR are reported in
Table 2. Based on them, different work cycles can be defined to make the fluid undergo a process of accelerated aging.
Based on the normal usage of a medium-power tractor and considering the wide range of operations it carries out, which can involve both the transmission and hydraulic system, or only one of the latter, a 150 h work cycle was defined in which the working conditions reported in
Table 2 (right column) were applied. The hypothesis of tractor usage is based on the assessments and related comments reported by Renius [
32] and Osinenko [
33]. According to these authors, tractor usage depends on the percentages of engine power required, on average, by the various tractor functions and on the mean time required by each operation, meant as a percentage of the tractor’s total working time. They assessed that approximately 55% of the engine power is required by the drive train, 35% by the PTO (power take-off) and 10% by the auxiliary equipment, mostly represented by the hydraulic system. Moreover, the usage time distribution among different agricultural operations is also influenced by the tractor power: increasing the power, tractors are increasingly employed in heavy operations such as primary soil tillage [
34]. Finally, different functions can be involved at the same time in the execution of each agricultural operation (e.g., tillage with active implements involves both drive train and PTO, while passive implements only require traction power) [
35]. Taking these factors into account, a hypothesis has been formulated (
Table 3), relating to the average usage of a 105 kW power tractor with 100 dm
3 of UTTO fluid in the reservoir, in an actual working time of 700 h (approximately corresponding to a year) during which the three functions could have been carried out individually or in combination.
As shown, the weighted average power is 16.3 kW for the drive train, 8.2 kW for the PTO and 8.1 kW for the hydraulic system. The overall work carried out by the transmission is 13,743 kWh (considering the sum of 11,053 kWh for the drive train and 2690 kW for the PTO), while the thermal energy dissipated through the lubrication is 1019 kWh resulting from the sum of 884 kWh and 135 kWh respectively assessed for the drive train (
η = 0.92) and the PTO (
η = 0.95). The work done by the hydraulic system is 2822 kWh, with dissipated thermal energy of about 423 kWh (
η = 0.85) [
36]. Dividing such values by the fluid’s volume (100 dm
3) will provide a
specific work (work per fluid unit in 700 h) of 137.4 kWh dm
−3 and 28.2 kWh dm
−3 for the transmission and the hydraulic system, respectively. Similarly, the
specific thermal energy dissipated by means of the lubricant, will be 10.2 kWh dm
−3 and 4.2 kWh dm
−3 respectively for the transmission and for the hydraulic system.
2.5. Cleaning of the FTR
Before starting a test, the FTR undergoes a deep cleaning process aimed at removing the fluid’s residues of the previous test. The operation starts by emptying all the components of the FTR from the fluid, at first by gravity, then with compressed air. The main filter exhausted cartridge is removed. Then, 8–10 dm3 of the same fluid to be tested is circulated for 4 h in the system, to dilute the previous fluid’s residues. After emptying FTR, the operation is repeated and finally, the FTR’s reservoir is supplied with the new fluid and a new main-filter cartridge is installed.
2.6. Test and Data Acquisition
The test conditions described in
Table 2 are maintained for the entire duration of the work cycle (150 h). This means that in each day of test, the computation of the test time started after an interval of about 30 min in which the FTR worked without any hydraulic and mechanical load, to increase the fluid temperature up to 40–45 °C. Then, the workloads were applied in both sections and the test time started. The operative parameters are continuously measured (1 Hz record frequency) and monitored in real time, while the data storing is based on the average values of 1 min acquisitions.
2.7. Withdrawals of Fluid Samples and Analysis
During the work cycle, 8 samples of 200 mL of fluid are taken and analyzed in order to monitor the evolution of the main parameters typical of hydraulic and lubricant fluids. Since the beginning of the test, the sample withdrawals have been carried out according to the following schedule: new oil (from the container); 1 h; 10 h; 30 h; 60 h; 90 h; 120; 150 h. The aim of the analyses is to monitor the evolution of chemical-physical properties of the fluids under the effects of the working conditions, the presence of contaminants and wear metal particles, and also provide information on the operative status of the test rig and on the compatibility between constituent materials and fluid, in order to prevent damages. The analyses of the samples were carried out by MECOIL srl (Florence, Italy). The parameters determined on the samples are reported in
Table 4 with the standard methods adopted.
2.8. Statistical Analysis
Descriptive statistics have been used to summarize the features of the data set. Then, an ANOVA was carried out to establish whether the work cycle has been significantly stable in the two tests, with “BF” and “CF”, by comparing the relative data sets. The test was applied both on the adjustable, directly measured parameters (torque, hydraulic pressure, speed at the dynamometric brake, total flowrate, fluid temperature in the reservoir, after the 40 MPa valve and after the transmission) and on the parameters calculated from them (hydraulic and mechanic power), that best summarize the conditions of work and the performance of the fluids and which most influence the characteristics of the latter.
The ANOVA could not involve the entire dataset because, as described above, the test on “CF” was 120 h in duration, as opposed to the 150 h test on “BF”; the duration of the daily sessions varied from 4.5 h to about 10 h, depending on the organization of the work. Therefore, the analysis of the variance was carried out considering the daily sessions of both tests that were homogeneous from the point of view of duration.
4. Discussion
The test results indicate the FTR is able to apply constant working conditions to the fluids and additional modulable thermal stress along the entire work cycle, allowing the comparison of their behavior concerning both the technical performance and the modification of chemical and physical characteristics. From the point of view of the energy involved in a 150 h work cycle at the FTR in comparison to the approximately 700 h real work in a tractor hypothesized in ”Methods”, the following considerations can be made.
The hydraulic work exerted by the axial piston pump (at 40 MPa) is 600 kWh. Dividing these values by the volume of fluid (20 dm
3) will provide a
specific work of 30 kWh dm
−3 and a
specific thermal energy of 5.3 kWh dm
−3, comparable to the 28.2 kWh dm
−3 and 4.2 kWh dm
−3 assessed for the tractor in the hypothesis reported in
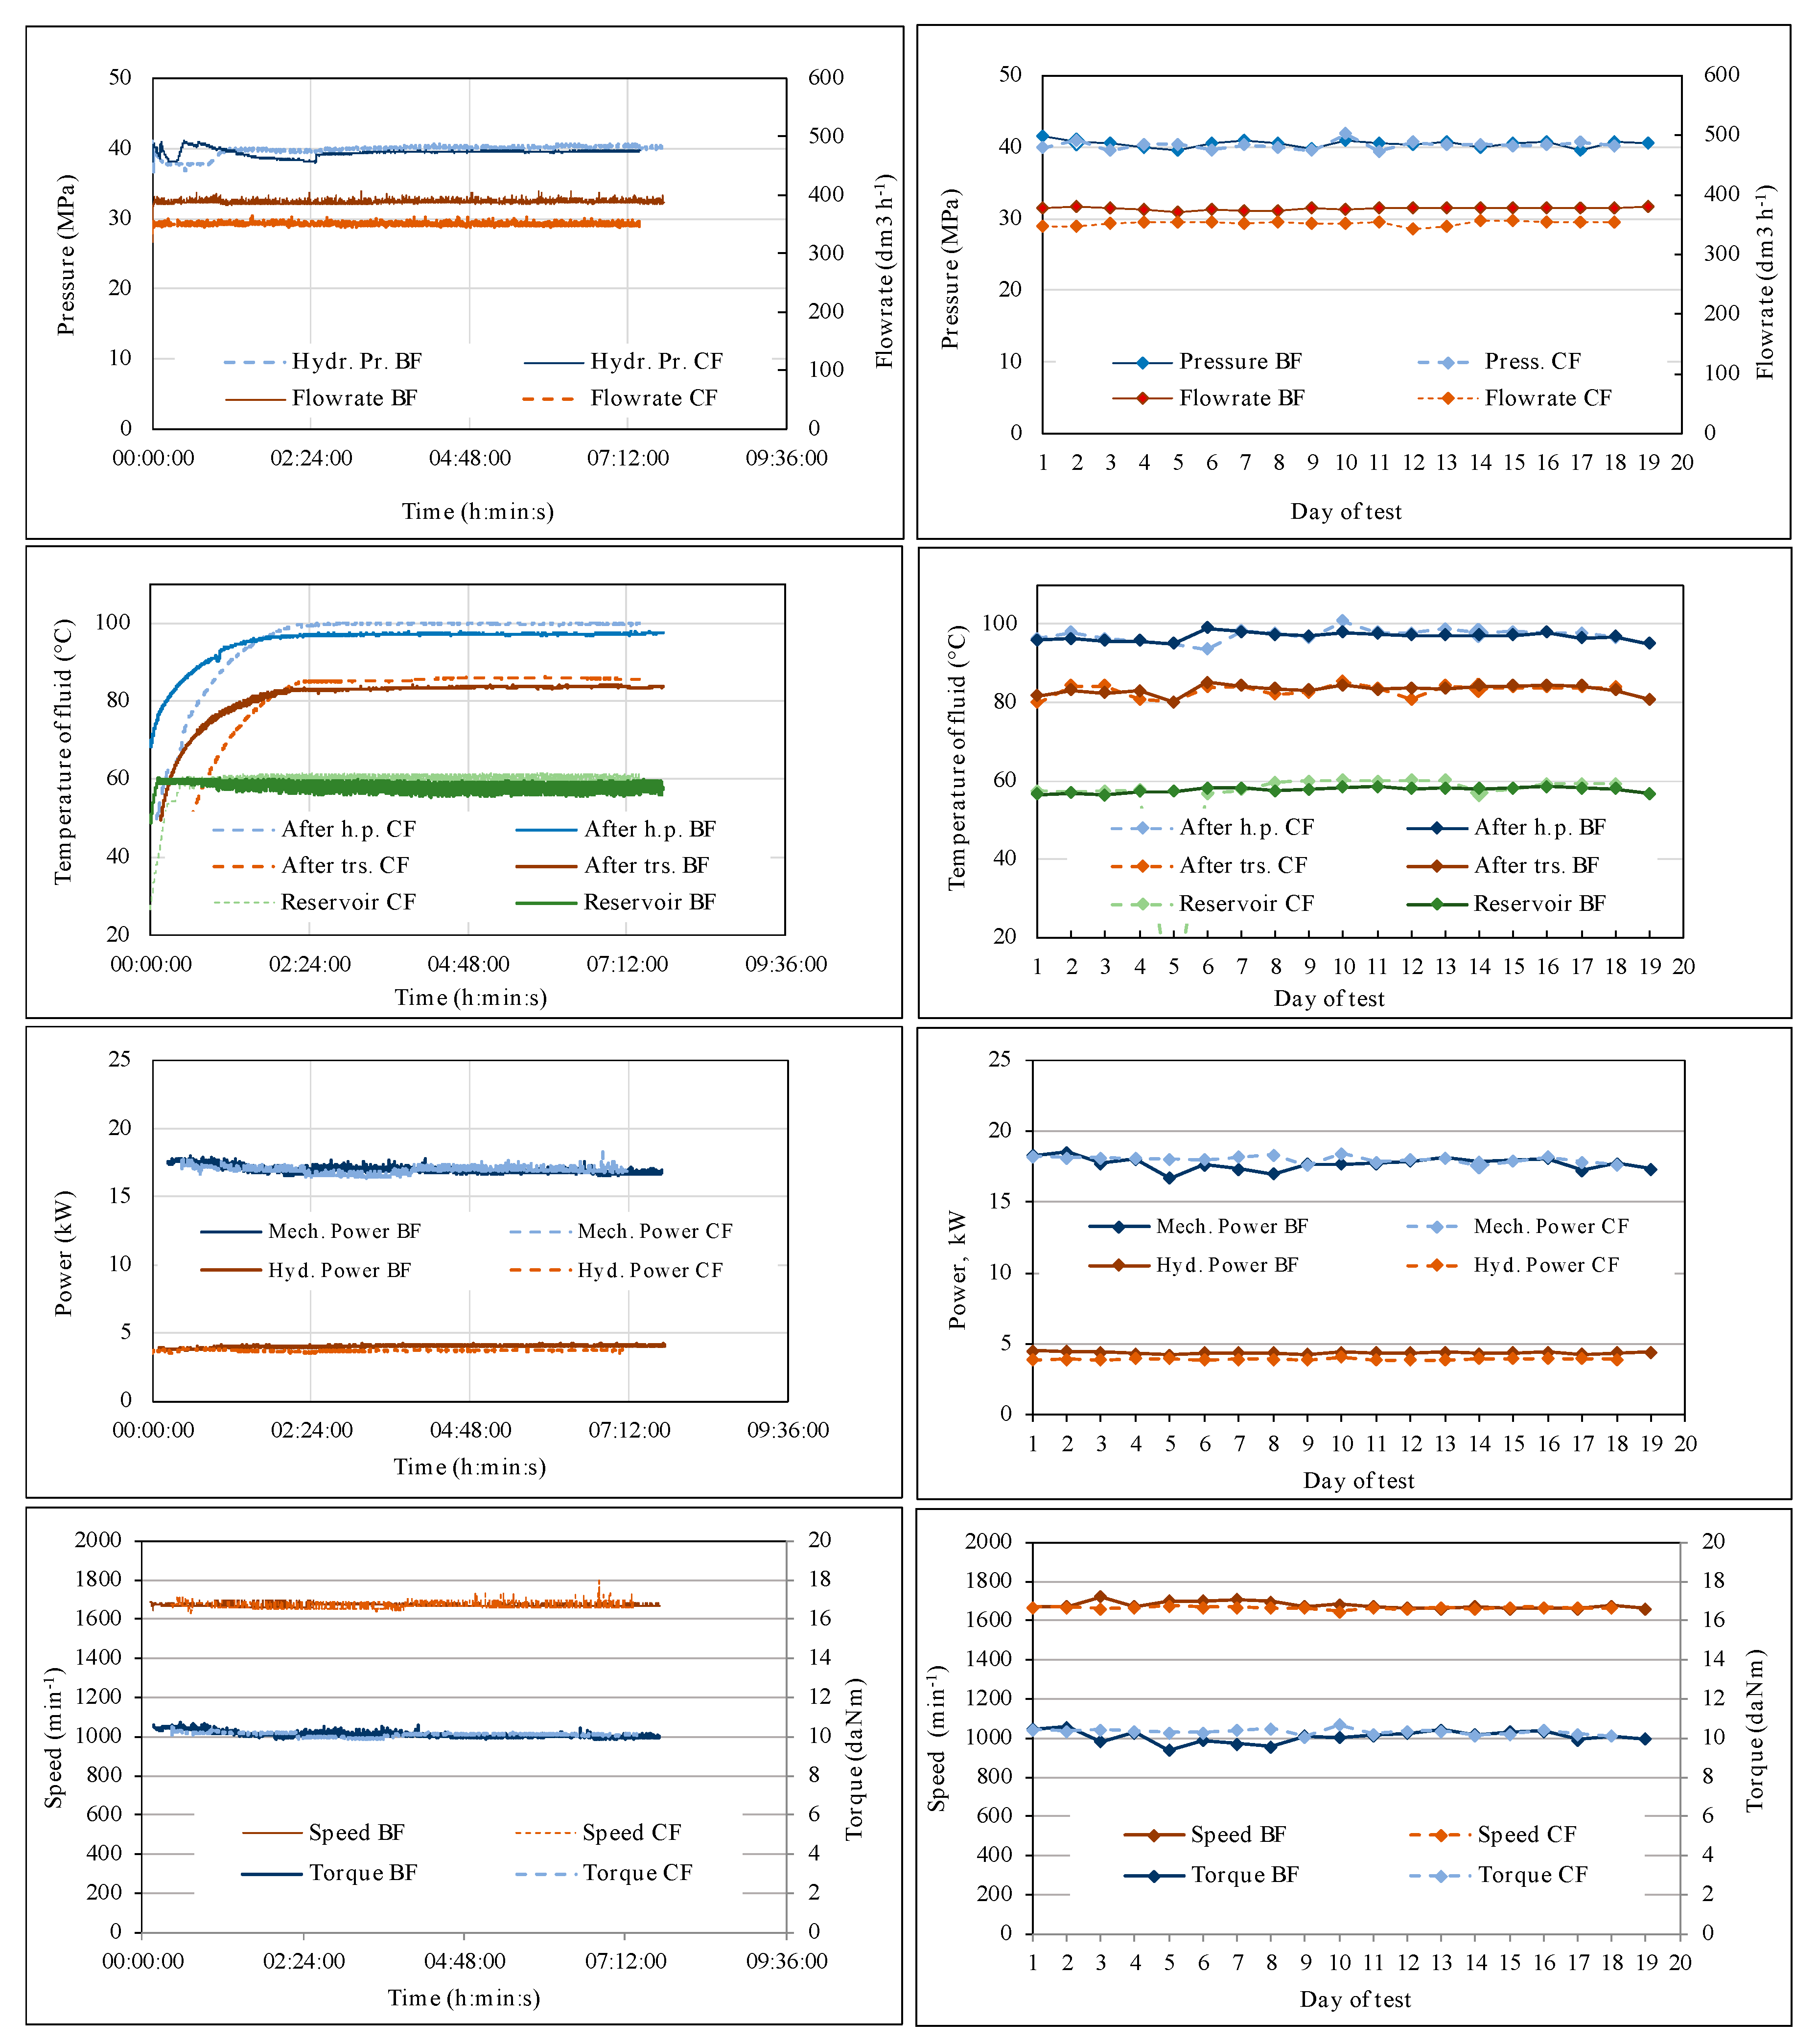
Table 3. The thermal stress on the fluid within the hydraulic section of FTR seems to be more intense than in tractors: in addition to the natural 20 °C thermal leap caused by the instantaneous pressure increase, a further fluid thermal leap of about 20 °C is produced by the fluid heating system. The resulting fluid’s temperature after the lamination is near 100 °C (
Figure 3). Considering the fluid’s volume and flowrate (
Table 2), this 40 °C thermal leap theoretically occurs 17 times per hour while, in the tractor, the hydraulic system often mostly performs short or impulsive interventions alternating with intervals of time without load (e.g., lifting operations, control of the position of tillage implements, etc.). However, the fluids for exclusively hydraulic use are normally very long lasting, with a lifetime of several thousand hours, often “for life”. Also, in various laboratory tests they were able to maintain their properties for several thousand hours [
40]. Moreover, in the FTR they are protected from the effect of contaminants (dust, earth, other mixed fluids, etc.), potential catalysts of oxidative reactions [
41,
42]. For these reasons, and based on the results of previous tests on hydraulic fluids with the first version of the FTR [
30], the effects of 150 h hydraulic work on the aging of the two UTTO fluids were expected to be limited and barely visible, despite a work cycle that was heavier than real operating conditions. Therefore, in the event that the test bench is used in testing new formulations of specifically hydraulic biofluids, the relative work cycle will still be useful if a reference sample is adopted (i.e., the standard production) or in identifying “weaker” ones, i.e., those that will quickly show signs of aging, which will be discarded or re-engineered. In any case, by appropriately remodeling the duration of the work cycle and associating it with specific laboratory tests on the samples, it would be possible to obtain information on the non-visible effects of the aging of the fluid. For example, by detecting the amount of antioxidant in the samples, it would be possible to trace its variation curve over time and, therefore, predict the residual lifetime of the fluid, always in the context of the comparison between biofluids and conventional fluids.
In the transmission section, a mechanical work of 2700 kWh is exerted in a 150 h cycle (the product of 150 h by 18 kW assumed as average mechanical power in the data of
Table 5) corresponding to a
specific mechanic work of 135.0 kWh dm
−3, near to the value of 137.4 kWh dm
−3 calculated for the tractor (
Table 3). Considering the efficiency of the speed multiplier (
η = 0.94), the
thermal energy “transported” by the fluid is 172.3 kWh, resulting from: 2700/0.94*(1–0.94), with a
specific thermal energy is 8.6 kWh dm
−3, lower than the 10.2 kWh dm
−3 hypothesized for the tractor transmission. The difference between these two values was partially balanced by the fluid heating caused by the small water/oil heat exchanger installed at the entrance of the speed multiplier. The assessment of this
thermal energy “transported” by the fluid into the speed multiplier was based on: (1) the fluid’s specific heat capacity: the values considered were 2.89 J g
−1 °C
−1 reported for new synthetic lubricants at 80 °C [
43]; (2) the mass of fluid into the speed multiplier, 2275 g resulting from its volume, 2.6 dm
−3 multiplied by its density, 0.875 g cm
−3 (
Table 1); (3) the thermal leap determined by the small heat exchanger before the speed multiplier, 15 °C, i.e., the difference between the fluid’s temperature at the exit of the multiplier, with the heat exchanger (85 °C) and without the heat exchanger (70 °C). (4) the flowrate of the fluid in the multiplier, 0.2 dm
3 min
−1 (
Table 2). According to these data, the fluid volume (20 dm
3) passed through the small heat exchanger 90 times in 150 h, “transporting” a
specific thermal energy of 1.8 kWh dm
−3, value to be added to the 8.6 kWh dm
−3 reported above, for a total of 10.4 kWh dm
−3, close to the value of 10.2 kWh dm
−3 assessed for the tractor (
Table 3). However, as in the hydraulic section, also in this case the 15 °C thermal leap produced by the fluid heater installed before the speed multiplier contributes to rendering the molecular structures of both the base stock and additives more susceptible to the mechanical stress of the gears. In this regard,
Table 10 shows the time intervals indicated by the manufacturer of the speed multiplier for oil replacement as a function of the operative temperature and of the type of oil [
31].
Especially in the case of synthetic oils, the reported time intervals are very long and can often cover the entire lifetime of the device they are used in. However, they always progressively shorten if the fluid’s temperature increase. According to this trend, if the synthetic oil prescribed by the manufacturer (Shell Omala S4 WE 220) is used in the speed multiplier, the 15 °C thermal leap (from 70 °C without heat exchanger to 85 °C with heat exchanger) would cause a reduction of the change interval from 18,000 h to 12,500 h. The temperature is supposed to similarly affect also the fluids used in our tests, despite their significantly lower values of viscosity and density, also considering the different use of the speed multiplier in the FTR, where the default lubrication was replaced by a circulation system with periodical change of the lubricant, determining a thermal stress heavier than in tractors. In fact, with a fluid’s volume of 2.6 dm
3 within the multiplier and a flowrate of 0.2 dm
3 min
−1, each of the 90 times the fluid enters the multiplier, it will be exposed to the 85 °C inside temperature for 13 min. On the other hand, in the tractor, the lubrication of the gear box mainly occurs by flapping: the fluid in contact with the gears mixes rapidly with the fluid mass where the average temperature is normally below 70 °C. The more-than-20% reduction in kinematic viscosity observed in both fluids (
Table 8 and
Table 9) in the interval 0–40 h, without any oxidative process, was probably caused by the gears’ shear-stress whose effects were emphasized by the thermal stress. Such conditions damaged the molecular structure of the thickeners added to the fluids to increase and preserve their viscosity. In the prosecution of the test the decrease of the viscosity and of the V.I. slowed down and stopped on still acceptable values. Considering that, according to the standard ASTM D445, the viscosity variations should not exceed 20% and that the criterion adopted for the replacement of industrial lubricants is based on viscosity variations exceeding ±10% [
44], the result is in any case significant because it is evidence of a significant variation of the most important parameter for a lubricant, attesting to the effectiveness of the FTR.
As for the comparison between the two fluids, beyond the different duration of the respective work cycles and considering the slight differences in hydraulic power connected to their different viscosity, they showed similar behaviors in the trend of both technical and physical-chemical parameters. The above described reductions in viscosity and V.I. have been the only significant variations. From this point of view, the biofluid seemed to behave better, with minor decreases compared to the widespread conventional fluid, maybe for effect of the higher viscosity index, effective against the thermal stress. According to such results, the biofluid seems to be promising for a next test stage on tractors to confirm—or not—its performance.
5. Conclusions
A test system has been developed, aimed at performing comparative tests between conventional and bio-based fluids, in order to evaluate the suitability of the latter to be introduced in agricultural machinery. The test system consists of a fluid test rig (FTR) and a purpose-developed test methodology and allows both specific tests on hydraulic fluids or lubricant for transmissions, and tests in which the two functions are combined as in the case of multifunction fluids like the UTTO [
45] to be carried out. The functional test of FTR was performed with two UTTO fluids, one conventional and one bio-based, and highlighted the capability of the FTR to reliably apply and repeat work cycles that correspond to extended and realistic tractor operating times.
The significant reduction of the test time will allow the process of evaluation and screening of new formulations of bio-based fluids to be accelerated. From this point of view, since the tests described have been executed by adopting a principle of caution, the 150 h duration of the test could be further reduced by making the work cycle heavier through the adjustment of various parameters: the thermal stress can be increased by raising the temperature of the water-glycol solution in the fluid heater, which will increase the temperature of the fluid entering both the hydraulic and the transmission section; the mechanic power developed in the transmission section can be theoretically increased to equal the power of the electric motor (40 kW) by raising the resistant torque at the dynamometric brake; in the hydraulic section, the power developed by the high-pressure pump can be increased by raising the pressure up to the maximum admitted value of 50 MPa by installing a suitable overpressure valve.
As to the comparison between “CF” and “BF”, both presented a decrease in viscosity, indicative of the severity of the work cycle. The reduction in viscosity has been slightly lower for the biofluid that seems deserving of entering a further stage which should include testing on a tractor in real working conditions. This represented an example of application of the test system proposed. Through the comparative tests it is possible to select the biofluids formulations which perform in at least a similar manner to the reference conventional fluids in use, and to discard those showing early signals of aging. The comparison will not have to be necessarily based on a double test. In fact, after having definitively set the work cycle, the test results will progressively constitute a data set of the data of all tested fluids. Consequently, any new formulation to be tested could possibly find in the data set the results of the test on the reference conventional fluid in use and be directly compared to it. Similarly, any modifications aimed at improving an already tested formulation will be directly evaluated in comparison to the data present in the data set.
The test system just described must be supported by adequate analytical activity to monitor the physical-chemical status of the fluid under test in order to promptly detect any significant variations, thus contributing to preserving the test rig from possible damages caused by the loss of the lubricity characteristics. To this purpose, viscosity, TAN, peroxide value and water content are the most important parameters describing the quality of bio-based fluids. Therefore, their quite simple determination must be prioritized and made on site, while the other parameters can be measured later in specialized laboratories.
In order to simplify the monitoring of the fluid status during the test at the FTR, in the near future the possibility of equipping the test rig with in-line sensors capable of measuring specific parameters of the fluid will be investigated; some of these provide direct information on temperature, viscosity, relative humidity, while others, such as permittivity and electric conductivity, indicate changes to the fluid electric characteristics which can be related to possible oxidation processes. Different types and models of such sensors are used to monitor conventional hydraulic fluids and lubricants in industrial and automotive applications. The study will aim at verifying their suitability to carry out correct measurements on the bio-based fluids, thus allowing their continuous control, avoiding the need for sample withdrawals and analysis.

 ,
, 


