Article

Performance Analyses of Temperature Controls by a Network-Based Learning Controller for an Indoor Space in a Cold Area

School of Architecture and Design Convergence, Hankyong National University, Anseong, Gyeonggi-do 17579, Korea
Sustainability 2020, 12(20), 8515; https://doi.org/10.3390/su12208515
Submission received: 27 September 2020 / Revised: 6 October 2020 / Accepted: 12 October 2020 / Published: 15 October 2020
(This article belongs to the Section Energy Sustainability)

Abstract

:
For the sustainable use of building spaces, various methods have been studied to satisfy specific conditions required by the characteristics of space types and the energy use in operation. However, several effective control approaches adopting the latest statistical tools may have problems such as higher control precision increases energy consumption, or lower energy consumption decreases their control precision. This study proposes an optimized model to reach the indoor set-point temperature by controlling the amount of heating supply air and its temperature and investigates the efficiency of an adaptive controller to maintain indoor thermal comfort within setting ranges. In the consistency of the comfort level, the fuzzy logic controller was found to be 1.76% and the artificial neural network controller to be 17.83%, respectively, more efficient than the conventional thermostat. In addition, for energy use efficiency, both of the controllers were confirmed to be over 3.0% more efficient. Consequently, the network-based controller with the adaptive controller checking comfort levels effectively works to improve both energy efficiency and thermal comfort. This improvement can be significant in places such as commercial high-rises, large hospitals, and data centers where many spaces are intensively woven with appropriate thermal environments to maintain users’ workability.

1. Introduction

1.1. Building Thermal Controls

For sustainable buildings, many studies on the reduction of fossil energy use have been continuously conducted including expanded levels of plants, distribution networks, air handling systems, and diffusers. Related studies have diagnosed the efficiency of the systems and identified the possibility of energy savings and indoor environment quality and have been in-depth on how to control them in various areas. However, energy savings themselves can cause a deterioration in the quality of the indoor thermal comfort by lowering the indoor set-point temperature and the number of air ventilation. Thus, the studies for sustainable buildings will have to balance energy savings, which are directly related to economic feasibility, and indoor thermal comfort, which can be associated with users’ workability and productivity.
By improvement of plants, distribution networks, and sub-generation systems, several studies have diagnosed the efficiency of the systems and identified the possibility of energy savings and indoor environment quality. Unlike past systems operated with limited resources such as steam and coal, the current thermal systems have pursued a higher level of optimized energy use by utilizing various control strategies. By use of advanced statistical models, precise metering energy consumption was performed, and the variations of heating load patterns as components in building models were compared. The Proportional Integral Derivative (PID) model was commonly developed with computing applications to improve the performance of plants, turbines, and their operations. Several control strategies in Heating, Ventilation, and Air Conditioning (HVAC) systems were tested to improve the control performance by using parameter adjustments, tuning rules, and adopting genetic algorithms [1,2,3].
With the help of the development of computing software and hardware, the control model performance was rapidly improved by adopting more advanced algorithms such as the Fuzzy Inference System (FIS) and Artificial Neural Network (ANN). The linguistic approaches of the FIS model assisted to solve various mathematical parametric controls and traditional tuning rules that revealed some limitations of the conventional reasoning. By comparing control errors and their derivatives by PID and FIS models, some variations of node topology were tested to define control rules for fuel use in boiler systems and distribution networks in district models. Through the strategy of combining FIS and node networks, several variations of control rules were tested to maximize control efficiencies of the system operations and the distribution networks in building models [4,5]. As compared to conventional control algorithms, the FIS has provided optimized controls for the various situations where simple mathematics cannot determine appropriate signals, and it has been used to create more reasonable rules for controls. Its linguistic logics reflecting ambiguous expressions complemented a wide range of mathematical and parametric methods reflecting many traditional tuning algorithms based on actual experiments [6,7]. By use of genetic algorithms reflecting regression analyses derived from existing data and experiments, the signal adjustment or compensation by the FIS model has concluded quite effective results at the several case studies of HVAC systems [8,9]. The ANN system has been able to solve several problems that had been difficult to understand in the past. When there were not effective computing devices, many researchers have not dealt with a few combined functions. That is because the calculation processes exponentially increased so that they cannot handle them. Specifically, it has provided very efficient solutions in the areas of analyzing day-lighting impacts, indoor air ventilation and infiltration, and surface heat radiance requiring finding hidden correlations and interactions from huge data. The effective control methods from the comprehensive comparisons were used to define more realistic energy use or assess energy consumption patterns near the future by use of several iterations of the ANN structure [10,11]. The ANN algorithm has been able to solve complexity problems in distribution network models dealing with combustion and circulation in plant levels, valves or dampers in distribution levels. In specific cases, they were tested by combining experimental models to respond various demands derived from different indoor and outdoor conditions [12,13,14]. In some algorithms, mixing methods of dampers and resistance coils were tested through the experimental data and data-driven regression to rapidly react thermal demands connecting some different building geometries and climate conditions. Specific models tested the control efficiency of combining the FIS and ANN models for operating dampers and diffusers in a single duct work and distribution networks [15,16,17].
In addition to these operational aspects of building thermal systems, for the improvement of thermal comfort levels in buildings, some questionnaire-based researches were studied by means of various qualitative indicators based on user’s and building’s characteristics [18,19,20]. Unlike the subjective analyses for thermal comfort, mathematical Predicted Mean Vote (PMV) and Predicted Percentage of Dissatisfied (PPD) methods were used through the refined FIS membership matrix to effectively control thermal comfort system. The ANN model was also used to assess and predict more precise thermal sensation votes to improve the conventional rule based PMV index. According to some models and genetic algorithms to adjust conventional control rules, occupant responses can be used to improve control strategies and indoor thermal situations associated with the reduction of energy consumption [21,22]. Amongst, several traditional approaches reflecting the conditions of building envelopes for heating and cooling loads were developed in extreme weather areas, and meanwhile, traditional indices were adopted into the models to define the validity of built environments in respond to modified guidelines and regulations [23,24]. In order to modify several elements and factors in the thermal sensation votes, some design strategies were selected to assess the non-deterministic linguistic values such as quite hot or a bit cool. Unlike the other deterministic models, the fuzzy approaches were frequently used to define human factors in mathematical sensation votes. Various design scenarios for indoor thermal conditions derived from architectural components, thermal conditions, and users’ characteristics were considered to define much more reliable calculation for the PMV levels. By use of modified genetic algorithms derived from experimental data, several functions for the ambiguous situations were developed to maintain the level of buildings’ energy performance [25,26,27]. In developing the models precisely and practically, comprehensive co-simulation applications dealing with the communication between the thermal calculation and the computing language applications were utilized for their real-time correction in controlling indoor environments responding to the outdoor climate condition. In addition to the mathematical controls, several energy conservation measures, such as walls, partitions, windows, doors, lighting, and heating and cooling systems, were adopted to define physical limitations of architectural elements [28,29]. Recent studies for the data-driven deterministic methods were mainly aimed at defining hidden factors or correlations between the energy conservation measures and the mechanical systems using a multi-layered matrix from several experimental regression models [30,31].

1.2. Problem Statement

Despite of useful results, a number of studies have focused on energy efficiency, either by setting accuracy too high and causing an increase in energy consumption, or by arbitrarily excluding thermal factors related to users’ indoor comfort. Moreover, several thermal control models associated with advanced statistical tools were mostly used to optimize their fuel efficiency and operational effectiveness in plant and building scales. There are some disadvantages, for example, it was difficult to optimize supply air conditions for a space scale in a very cold area. In this study, an integrated method dealing with controlling supply air mass and its temperature is proposed with the analyses of the predicted mean vote and the heat transfer. In discussion, the performance of the proposed model is compared with a conventional thermostat on-off controller. In conclusion, the effectiveness of the proposed model is described in the viewpoint of thermal comfort and energy use.

2. Methodology

2.1. Design Strategy

The main purpose of this study is to control the condition of supply air in responding to the change of thermal demands while the amount of heat transfer is determined in a very cold area. In order to find optimized control patterns, it is important to analyze the hidden interactions between the thermal energy transfer and the human comfort sensation. A design strategy for controlling indoor thermal conditions in this study is described as below:
(1)
Based on the envelope conditions, a thermal transfer model for a space calculate the heating (or cooling) energy transfer responding to the outdoor temperature;
(2)
When the thermal energy transfer is calculated, an energy supply model optimizes supply air conditions by means of the amount of air and its temperature;
(3)
After the process, a thermal comfort model calculates the space’s PMV (and PPD) level.
(4)
If the PMV level is out of the range of a designated level (−0.5 < x < 0.5), an adaptive controller adjusts the setpoint temperature within the set value range;
(5)
If the PMV level is still out of the range of a designated level (−0.5 < x < 0.5), the adaptive controller additionally adds weighted values for the setpoint temperature;
(6)
If the PMV value is still outside the set value despite of performing these two processes, the adaptive controller repeats the previous two processes;
(7)
In any point of the previous three processes, if the PMV value is within the designated level, the optimization process of the supply air is carried out without any additional setpoint temperature adjustment.
The amount of supply air is controlled by the angle of the damper, but unlike liquids, the flow rate of air is relatively linearly proportional, so the model assumes that the opening angle is the same as the amount of air mass. Since the heat loss is assumed only as the conduction of the exterior wall, the roof and the penetration, and the heat gain did not include sensible or latent heat from people and equipment, the energy use may be quite different to actual building spaces. A follow-up study will complement this weakness by using more refined models. In addition, in order increase the efficiency of the simulation process, some thermodynamics are simplified or neglected such as pressure variations of indoor air speed, air leakage between envelopes and duct systems, and airflow in the duct and the space. Table 1 describes building geometries used in the OpenStudio and design parameters derived from the ASHRAE standards and related specifications [32,33]. The outdoor temperature of Central Park in New York City in January 23rd, which was retrieved from the weather data from the US Department of Energy (US DOE).
The building thermal system is driven by a heater and a cooler with a single duct work. A reference model as a comparison group operates by a conventional thermostat on-off switch, and intelligent models tested in are controlled by the FIS and the ANN model which consist of linguistics algorithm and network-based learning systems. In the case of the ANN model, as indicated in the previous paragraph, one adaptive controller controlled by the PMV results is added to adjust the setpoint temperature of the thermal system.

2.2. HVAC Model

From the thermodynamic first law, the thermal energy transfer in a room of Figure 1 is given by [34]:
Q l o s s + Q g a i n = d u d t
where Qloss is heat transfer from room to outside and Qgain is heat transfer from heater to room. u is internal energy, and t is time.
From the conduction through the walls and windows, thermal energy loss of room, Qloss is given by:
Q l o s s = ( T r o o m T o u t ) / { 1 ( h o u t × A ) + D ( k × A ) + 1 ( h i n × A ) }
where h o u t and h i n are heat transfer coefficients, k is transmission coefficient, A is area, D is depth of envelope.
From the mass flow rate and enthalpy, assuming that there is no work in the system, thermal energy gain of room, Q g a i n is given by:
Q g a i n = m ˙ h t × C p × ( T h t T r o o m )
The rate of internal energy is given by [32]:
d u d t = m r o o m a i r × C v × d T r o o m d t
From the above equations, time derivative of Troom for simulation model is obtained:
d T r o o m d t = 1 m r o o m a i r × C v × ( ( T r o o m T o u t 1 / h o u t × A + D / k × A + h i n / A ) + ( m ˙ h t × C p × ( T h e a t e r T r o o m ) ) )

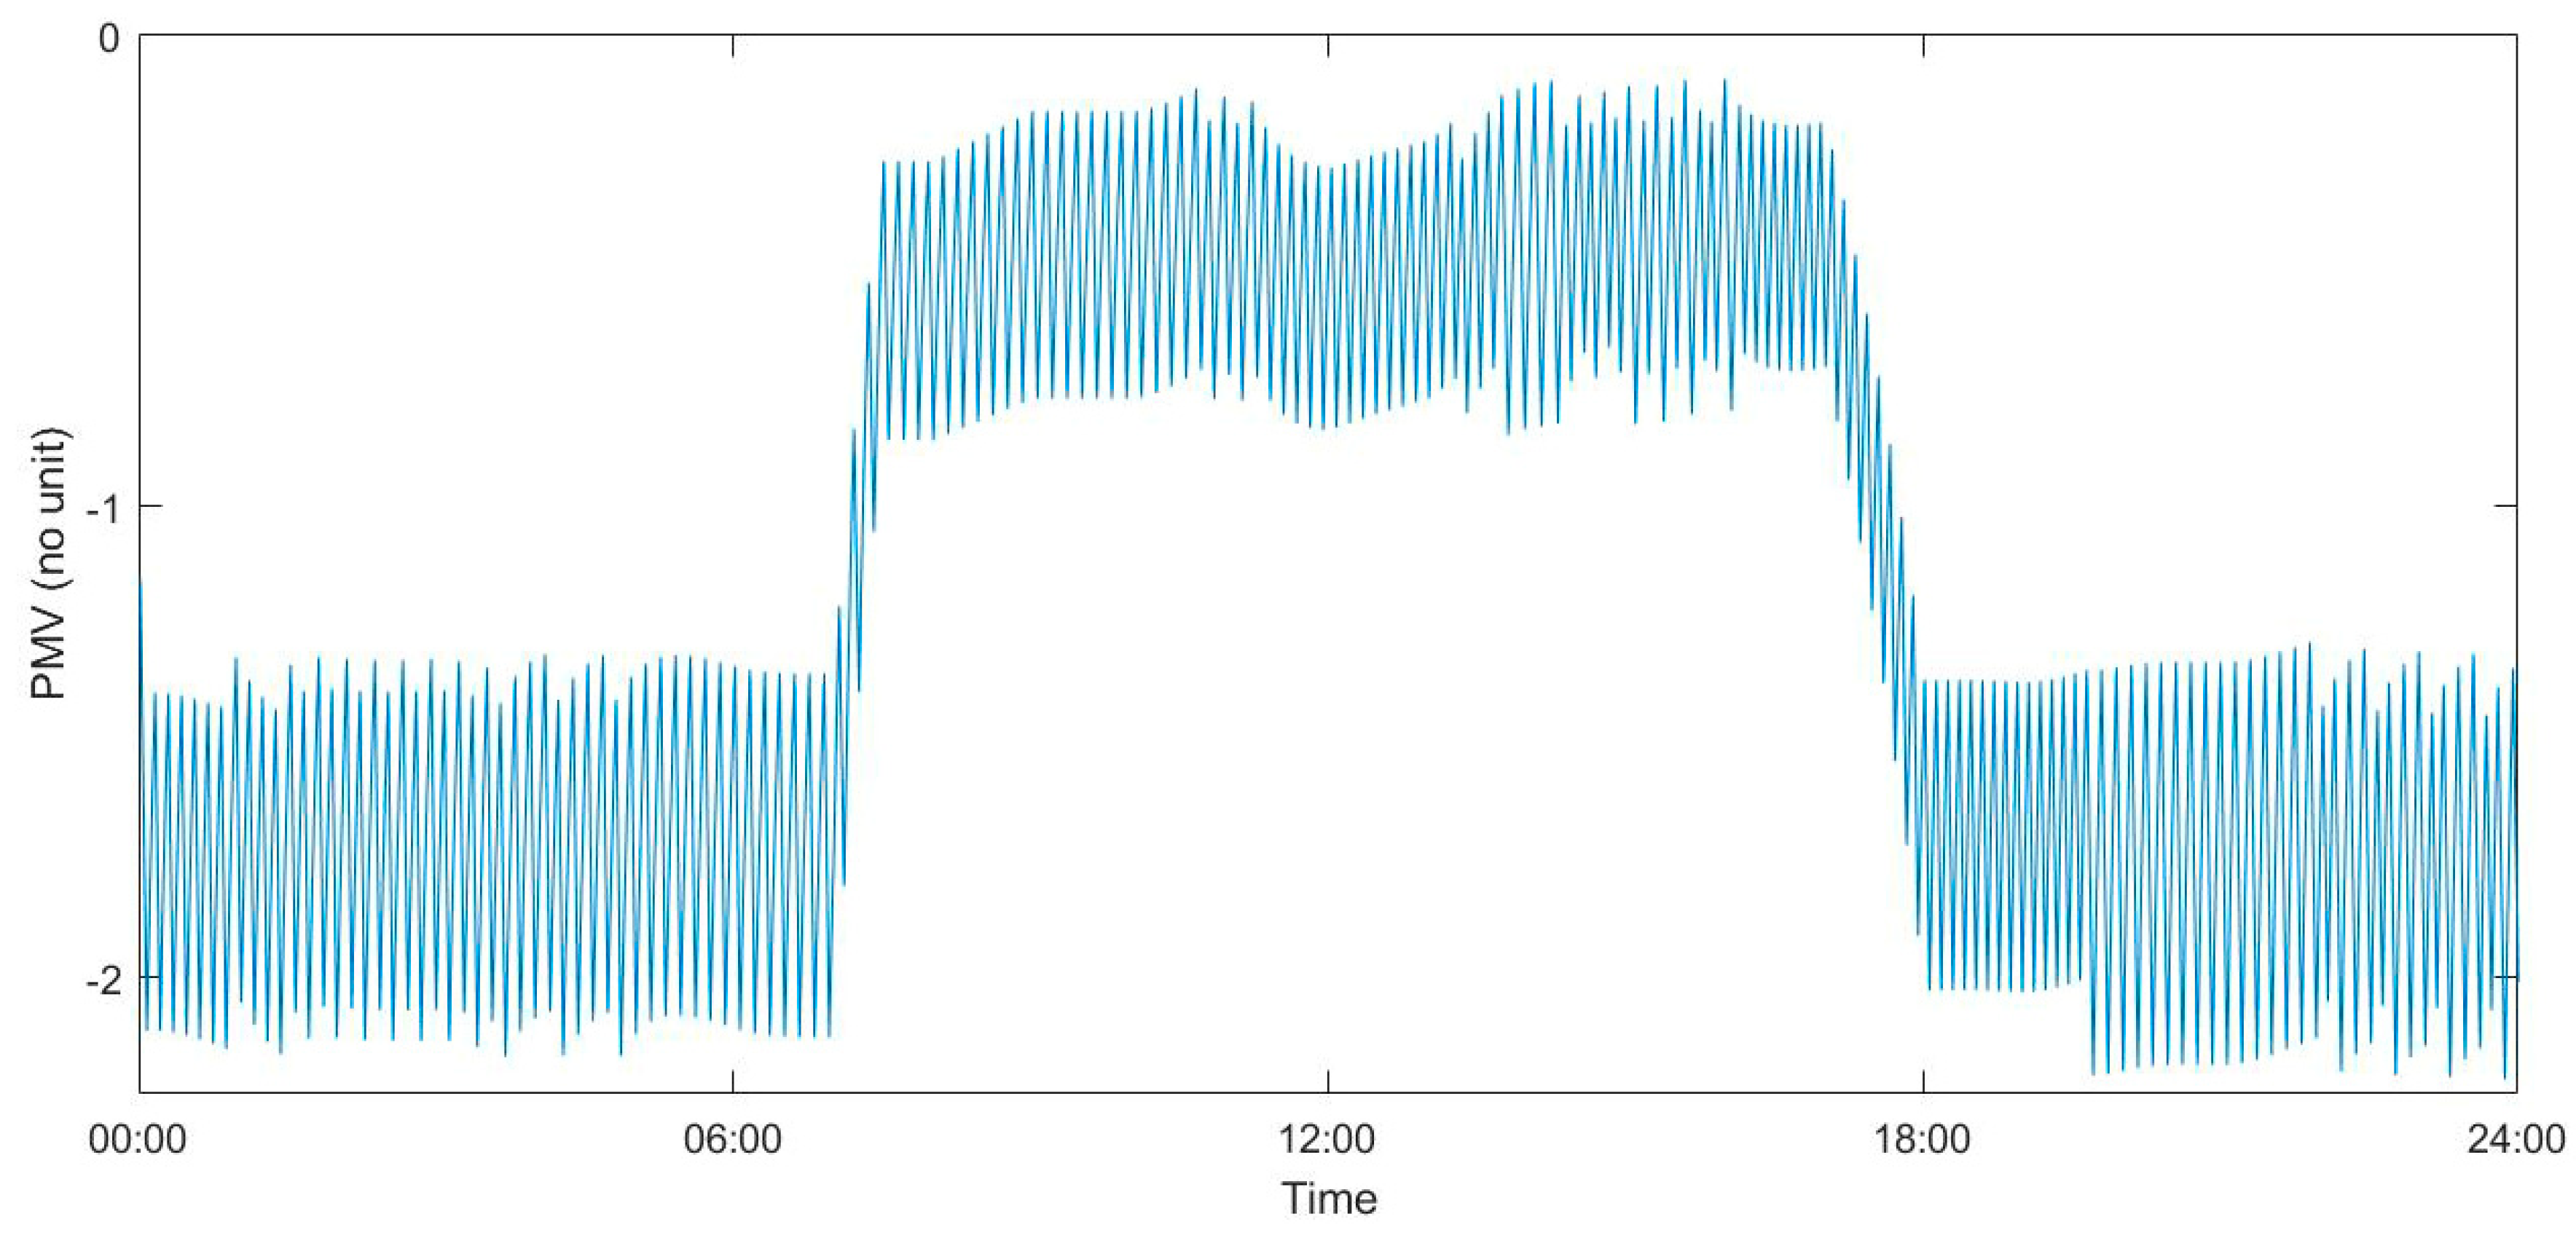
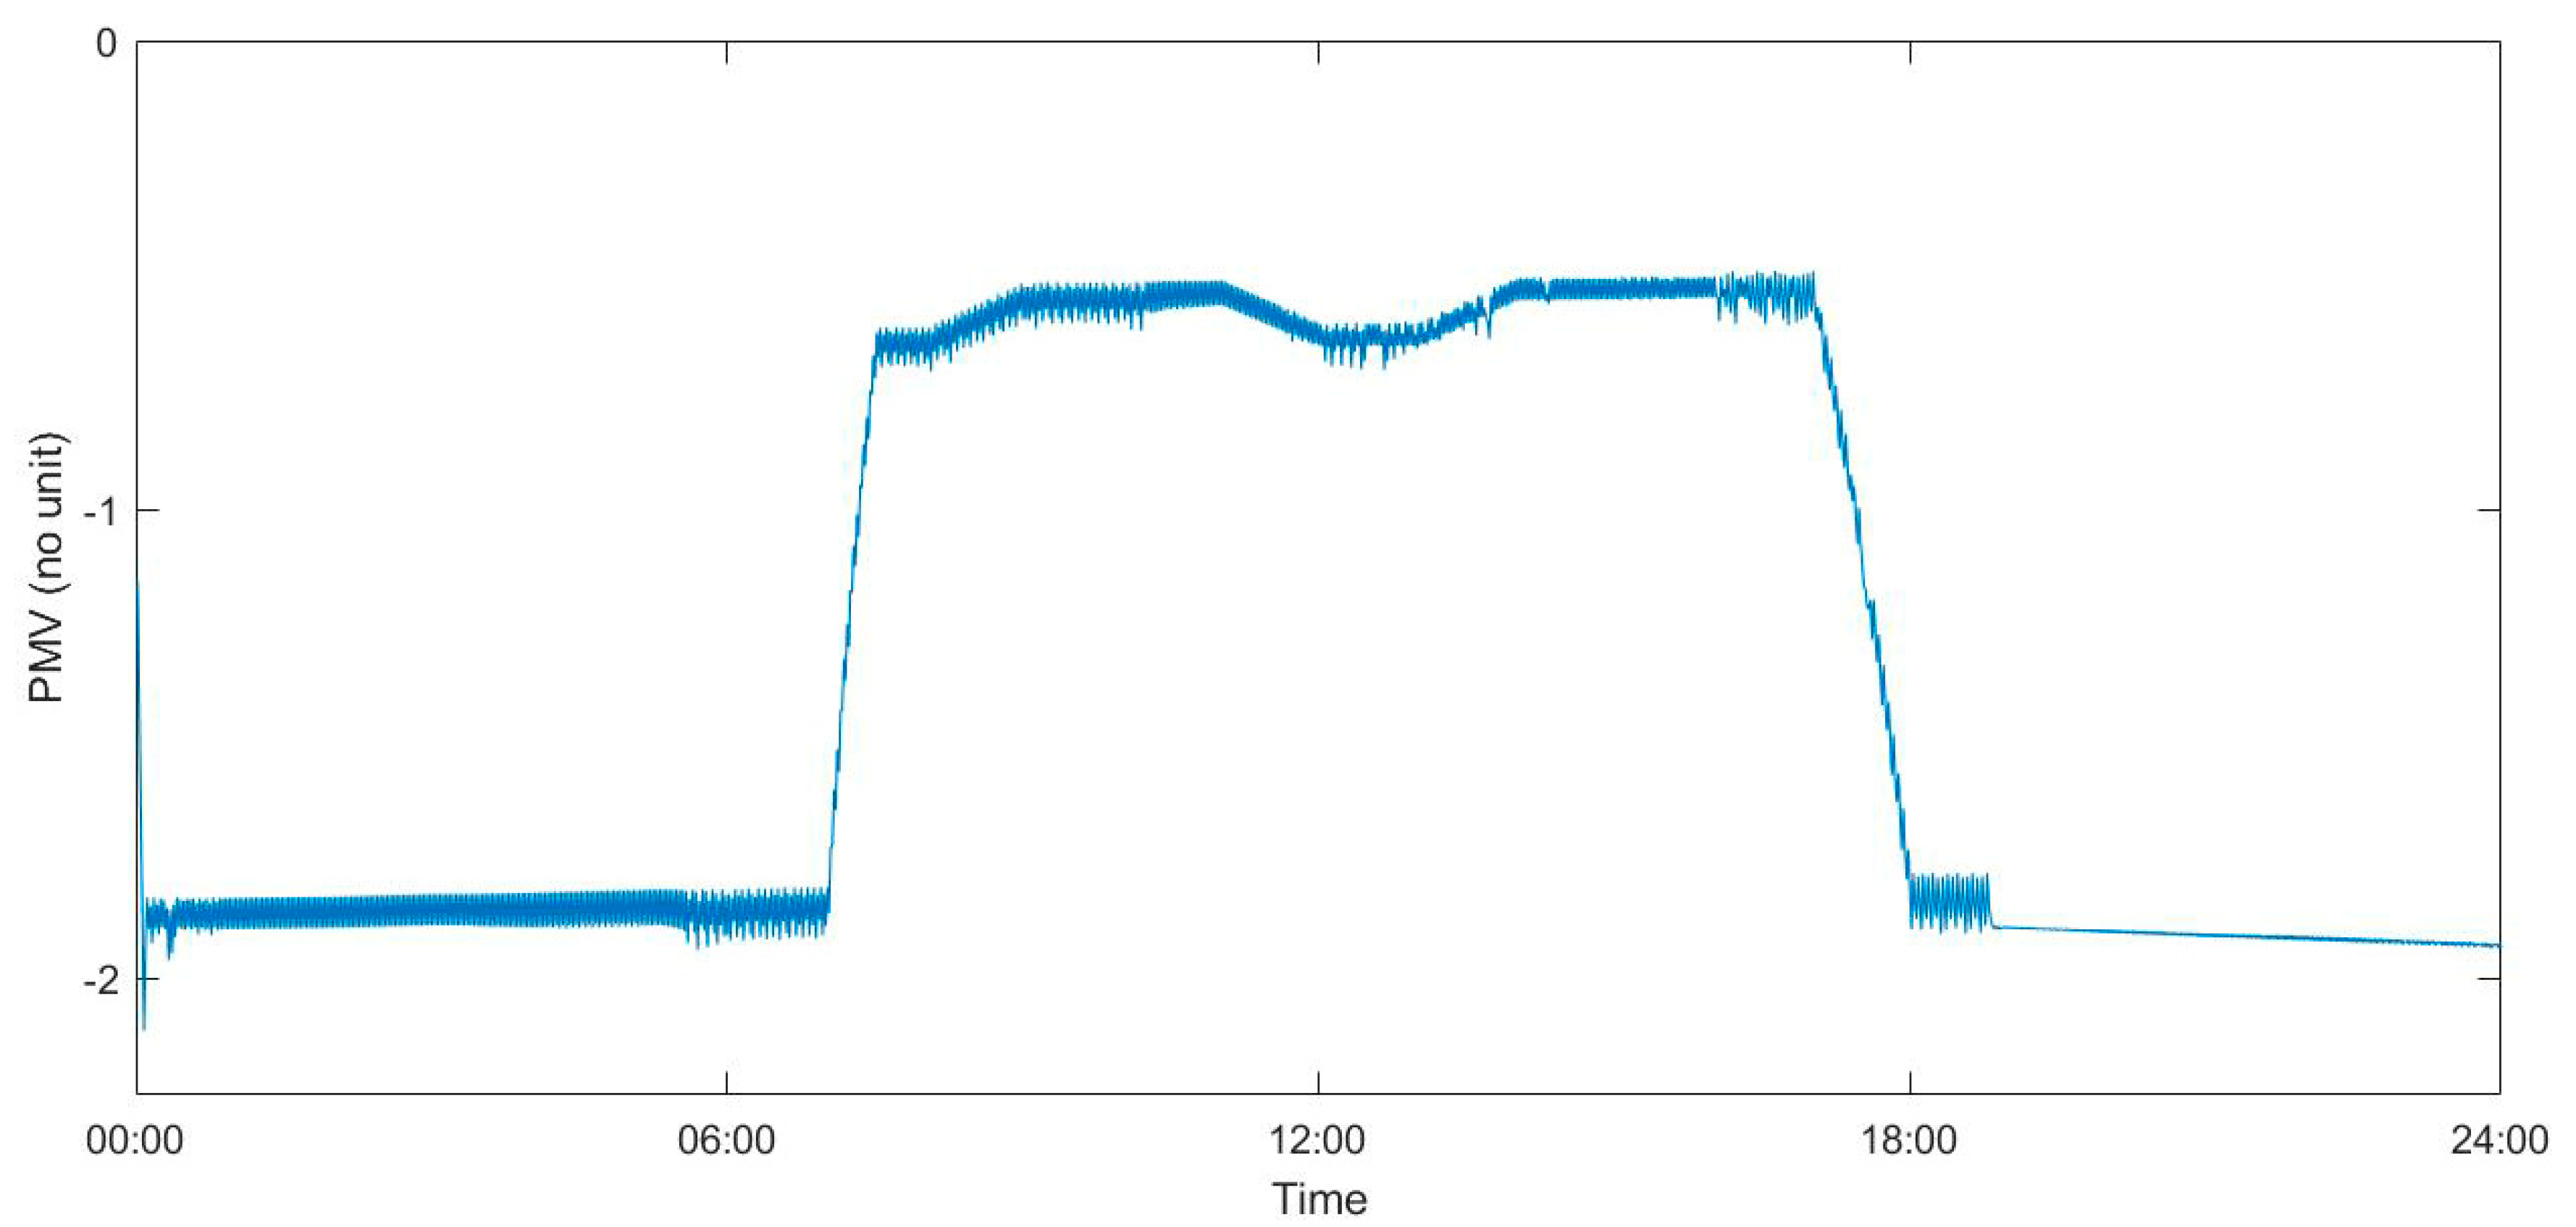
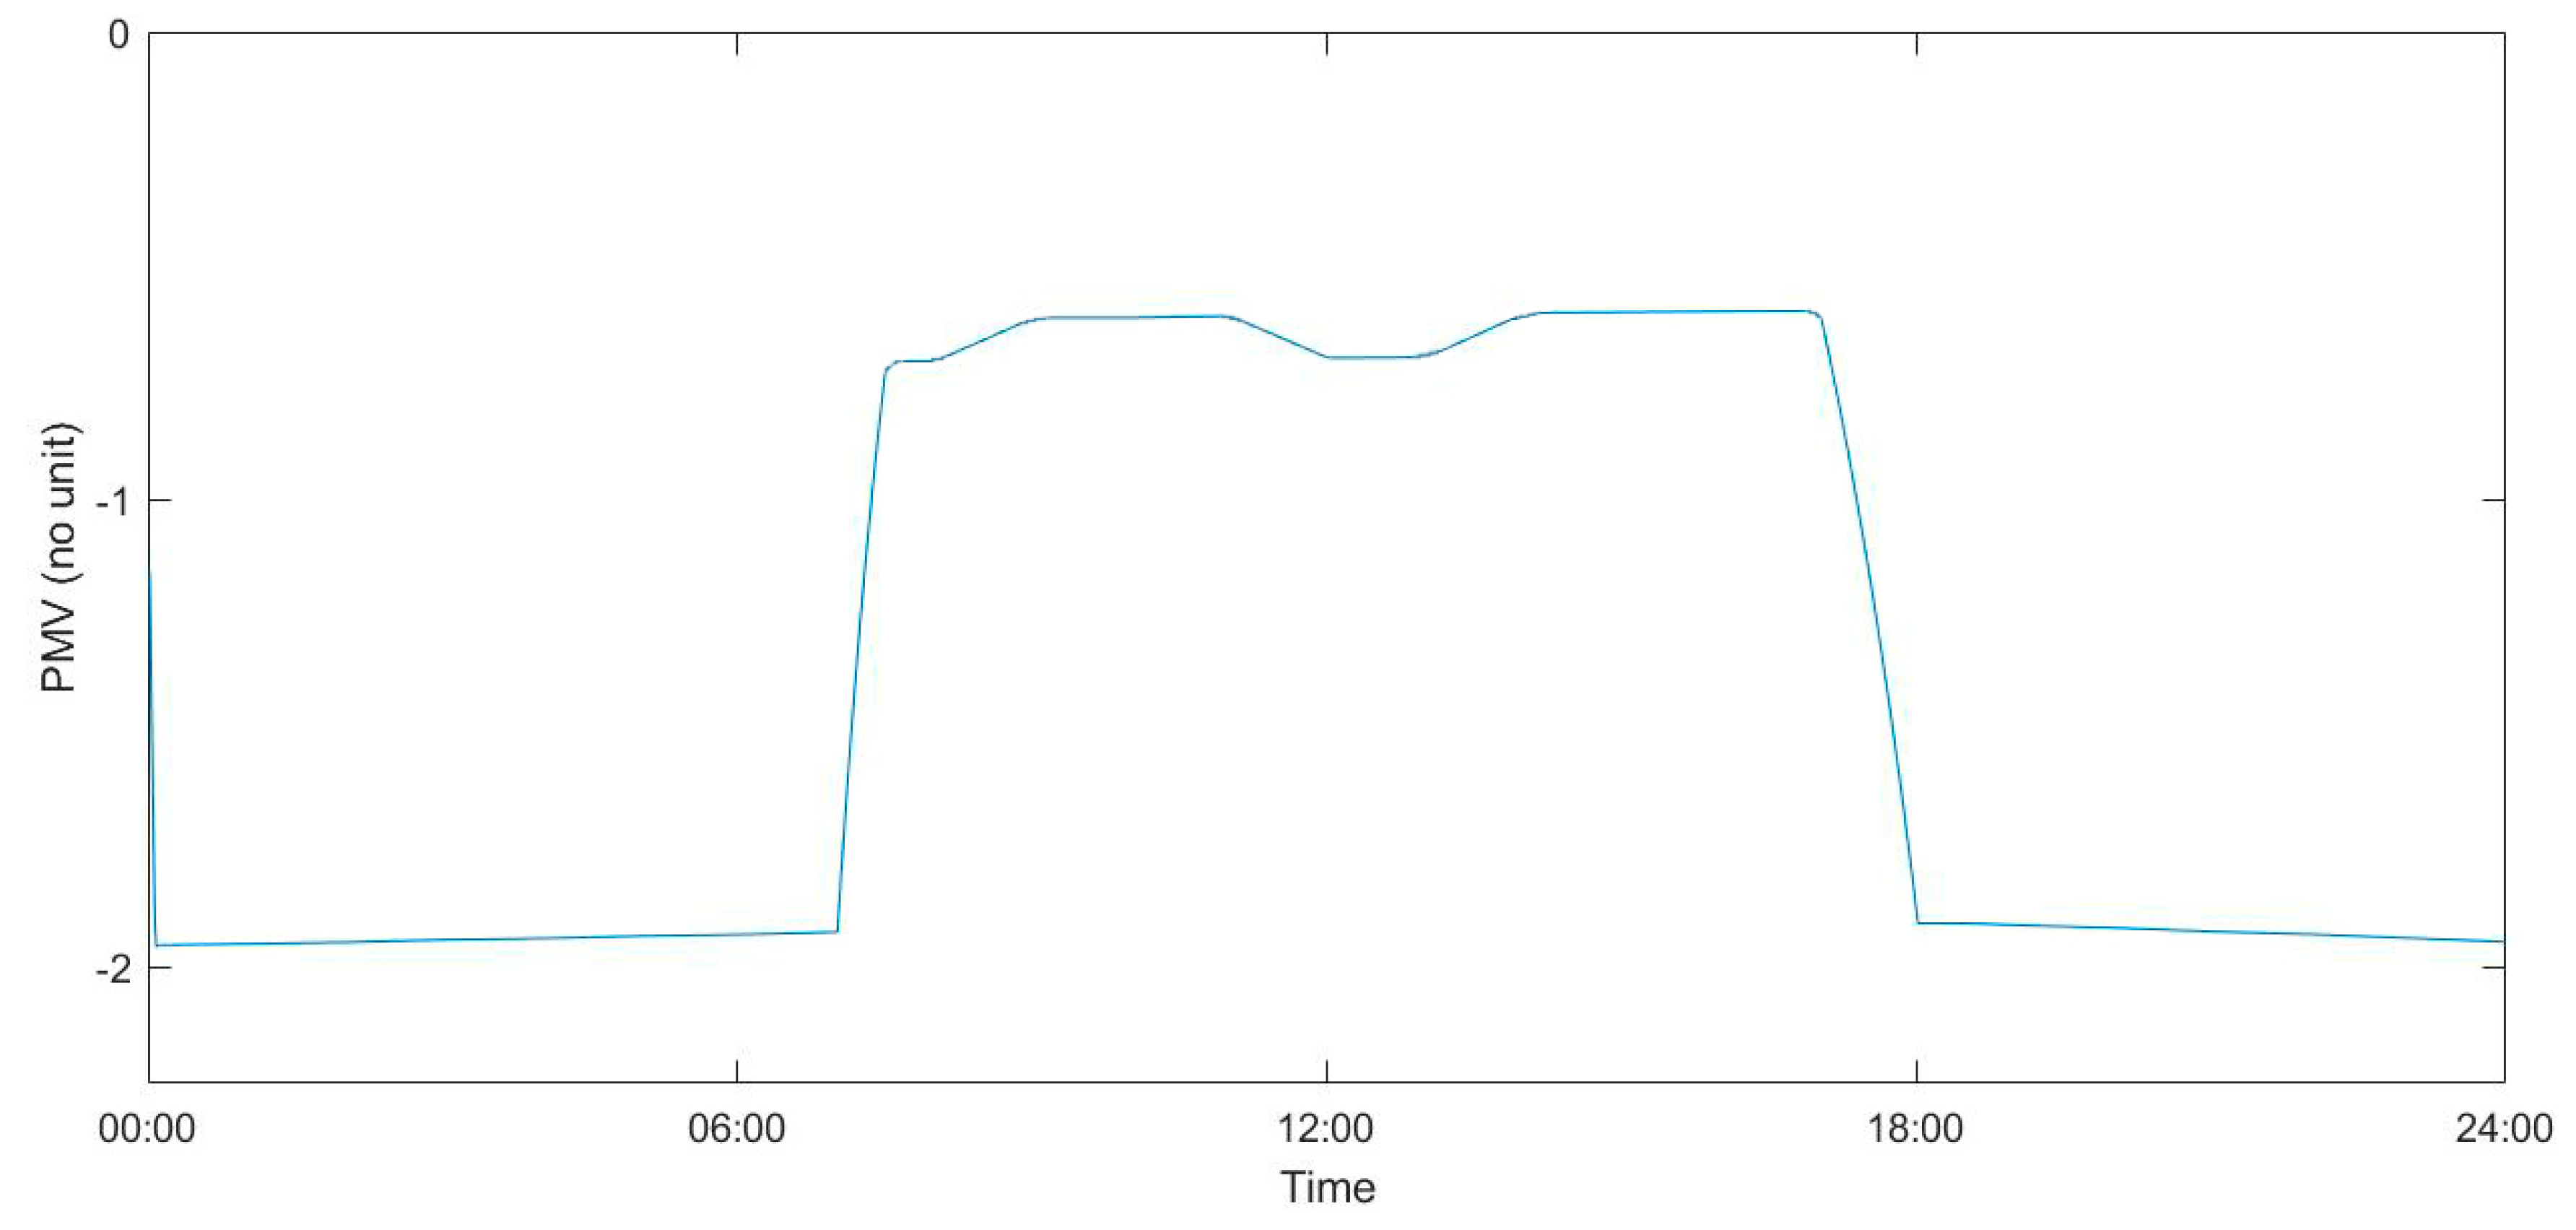
2.3. Thermal Comfort Model

Thermal comfort is commonly measured by the Predicted Mean Vote (PMV) developed by P.O. Fanger. From the PMV model, the Predicted Percentage of Dissatisfied (PPD) below is developed by the exponential of metabolic rate and thermal loads [33,34].
P M V = 3.155 ( 0.303 e 0.114 M + 0.028 ) L
where M is metabolic rate. As well, L which is thermal load is given:
L = q m e t , h e a t f c l h c ( T c l T a ) f c l h r ( T c l T r ) 156 ( W s k , r e q W a ) 0.42 ( q m e t , h e a t 18.43 ) 0.00077 M ( 93.2 T a ) 2.78 M ( 0.0365 W a )
where qmet,heat is metabolic heat loss, Tcl is average surface temperature of clothed body, fcl is ratio of clothed surface area to DuBois surface area, Ta is air temperature, hc is convection heat transfer coefficient, Tr is mean radiant temperature, hr is radiative heat transfer coefficient, Wa is air humidity ratio, and Wsk is saturated humidity ratio at the skin temperature.
These two equations are used to detect thermal comfort level for buildings. Also, the PPD levels are defined by an exponential function of the PMV like below:
P P D = 100 95 e ( 0.03353 P M V 4 0.2179 P M V 2 )

2.4. Thermostat On-Off Controller

The thermostat on-off model in this study operates within Tset = ±1 °C, which is commonly used as a default configuration for most thermostats equipped in residential and commercial buildings. If the difference between Tset and Troom is larger than the values of ±1 °C, thermostats send an on-signal or an off signal to a thermal system. For instance, if Tset is 20 °C and Troom is 18 °C, the thermostat used in this study sends on-signal to the heater.

2.5. Fuzzy Inference System (FIS) Controller

As indicated, there are two different models to process signals for efficient controls of the thermal energy and indoor comfort as compared with the thermostat. The purpose of the FIS controller is to determine the optimal values of the mass flow rate and the temperature of the supply air, which depends on the difference between Tset and Troom. Equations below describe a membership function for two input variables in the FIS model: wherein the temperature differences between the set-point and room (E) are derivative of the temperature difference (ΔE) [35]:
E = T s e t T r o o m
Δ E = ( E n E n 1 ) Δ t
For using these two variables (E) and (ΔE), the controller in this simulation work utilizes the first-order Sugeno model with two inputs and fuzzy IF-THEN rules [35].
i f   x   i s   A   a n d   y   i s   C   t h e n   f 1 = p 1 x + q 1 y + r 1
The two inputs x and y are utilized for the membership function, which reflects an adaptive node consists of a triangular function for A and C. For deterministic phase in the FIS, triangle membership function μ ( x ) is given [35].
μ ( x ) = t r i a n g l e ( x ; a i ,   b i ,   c i ) =   { x a i 0 a i x b i   ( x a i ) ( b i a i ) b i x c i   ( c i x ) ( c i b i ) c i x 0
where, (ai, bi, ci) is the set of parameters set that in the layer are referred to as premise parameters, which reflects a triangular membership function.
In the triangular membership functions, two output variables for mass flow rate and its temperature uses the range of maximum equal to 1 and minimum equal to 0, which means that universal of discourse 0 (0%) to 1 (100%) for amount of air mass. Likewise, a value of 0 represents 0 and 1 does 10 for heating (or −10 for cooling) for controlling supply air temperature [35].

2.6. Artificial Neural Network (ANN) Controller

The Artificial Neural Network (ANN) algorithm consists of a large class of several structures, and the appropriate selections of a nonlinear mapping function x with a network are required [36,37]. The ANN model in function approximation is the Multilayer Layer Perception (MLP) which consists of two input layers, 10 hidden layers, and an output layer used in this study. The inputs x1, …, xk to the neuron are multiplied by weights wki and summed up with the constant bias term θi, and the resulting ni is the input to the activation function g [36,37]. The ANN model used in this study consisted of the two inputs of E and ΔE from the thermostat controller, an output layer for control signal for amount of supply air and its temperature. The ANN model was trained to define optimized control patterns that can maintain the room temperature most consistently to meet the PMV setting range. In this process, a scale conjugate gradient algorithm was used, and the number of iterations was limited to 1000 or less. The ANN algorithm was trained to find a better regression model in association with energy use responding to the outside temperature by the same simulation configuration of this phase. With under 10 times of the statistical validation repetition, the R2 values were confirmed as 0.99541 for amount of mass control and 0.99750 for its temperature control, respectively, which was enough to confirm as high statistical validation values.

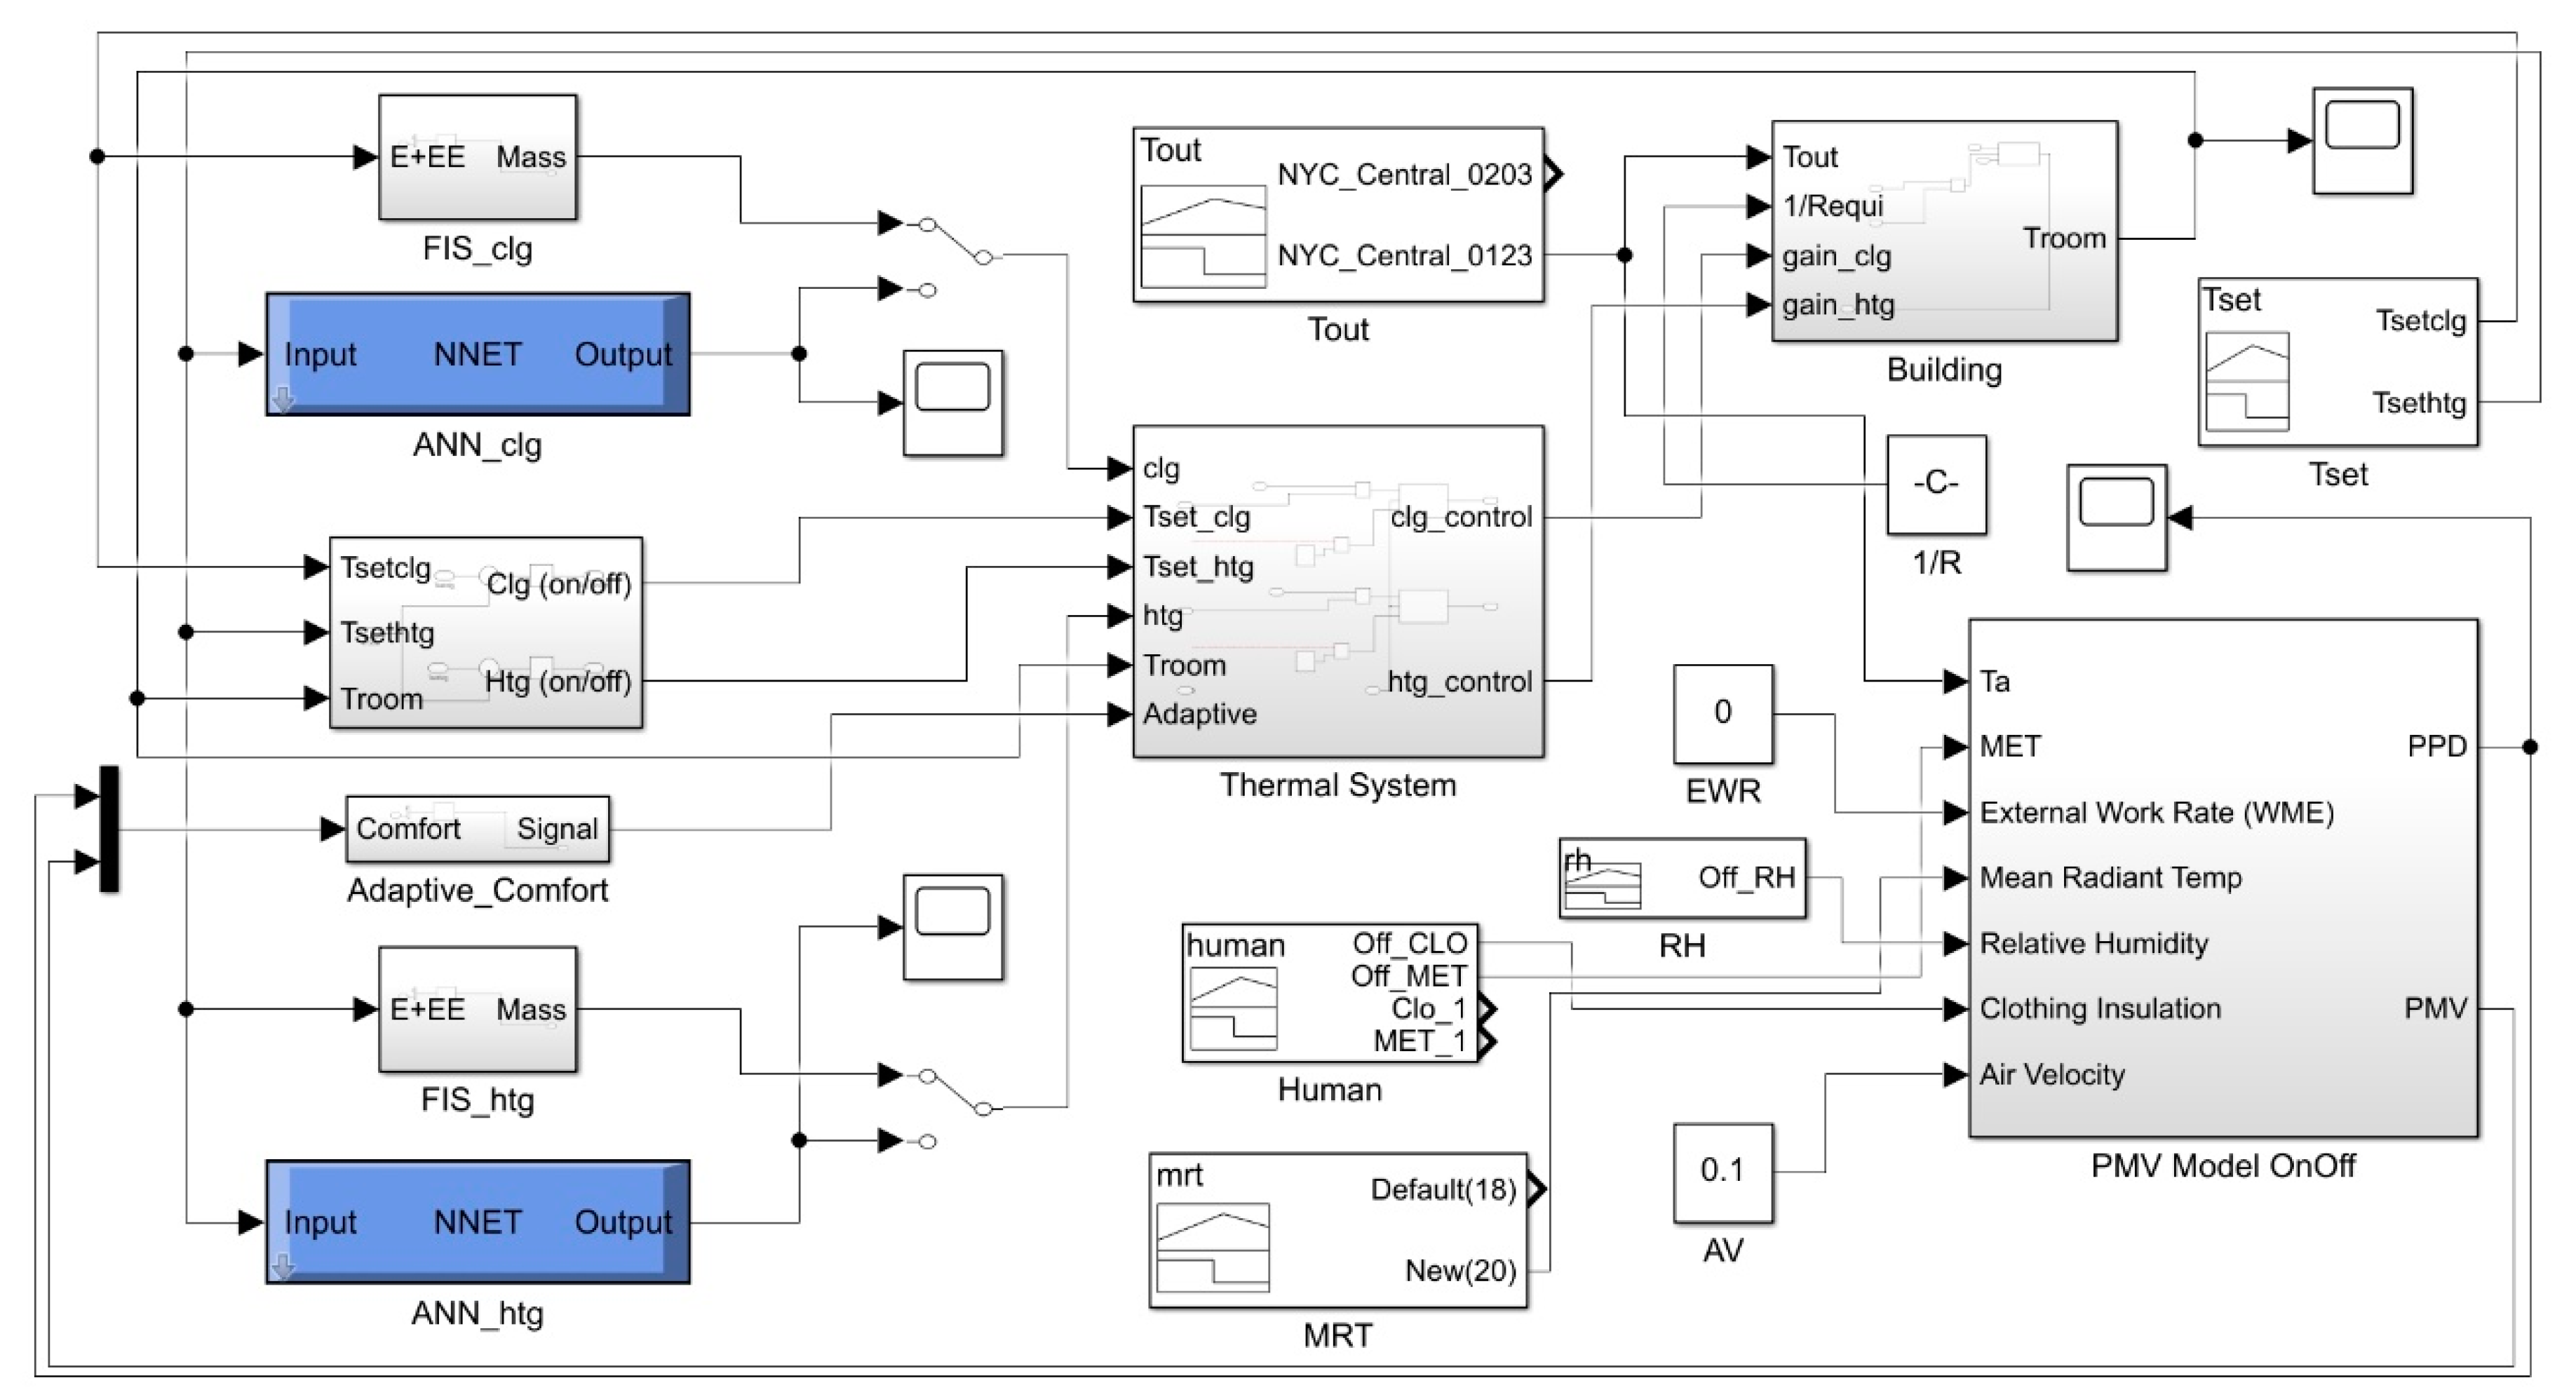
2.7. Simulation Model

Figure 1 describes a simulation block diagram. Overall, the simulation model consists of six different modules: HVAC model (Thermal System in Figure 1); control model (Tset, FIS, and ANN in Figure 1); space Model (Building in Figure 1); PMV model; adaptive controller (Adaptive_Comfort in Figure 1); signal generators for thermal factors. In order to maintain Troom for Tset, the HVAC model calculates appropriate signals for amounts of supply air and its temperature and sends them to the space model. From the results, the PMV model calculates the real-time comfort levels, and then, the adaptive controller determines whether Tset needs to be adjusted or not. With this determination, the ANN modules calculate and send optimized signals to the HVAC model. Each phase is repeated in this order for 24 h. For the calculation for the PMV values, some variables were assumed: mean radiant temperature was 18 °C; relative humidity was 50%; external work rate was 0; air velocity was 0.1m/s; metabolic rate was 1.0 W/m2; clothing insulation was 1.0 m2·K/W. Additional design parameters for the simulation template were adopted from the ASHRAE standards 55, and 90.1, and the Engineering Toolbox guidelines.
In this simulation, if the PMV value at certain time is higher than 0.5 or lower than −0.5, the adaptive comfort module sends adjusted signals for cooling or heating supply air. If this situation still occurs in the next time step, the adaptive comfort module continues to send adjusted signals to the thermal system till the PMV value is within the setting range. Through this adaptive rule, system’s control occurs in a way that minimizes indoor thermal dissatisfaction, and the energy used in these controls is compared with the amount of heat gain and loss.

3. Results

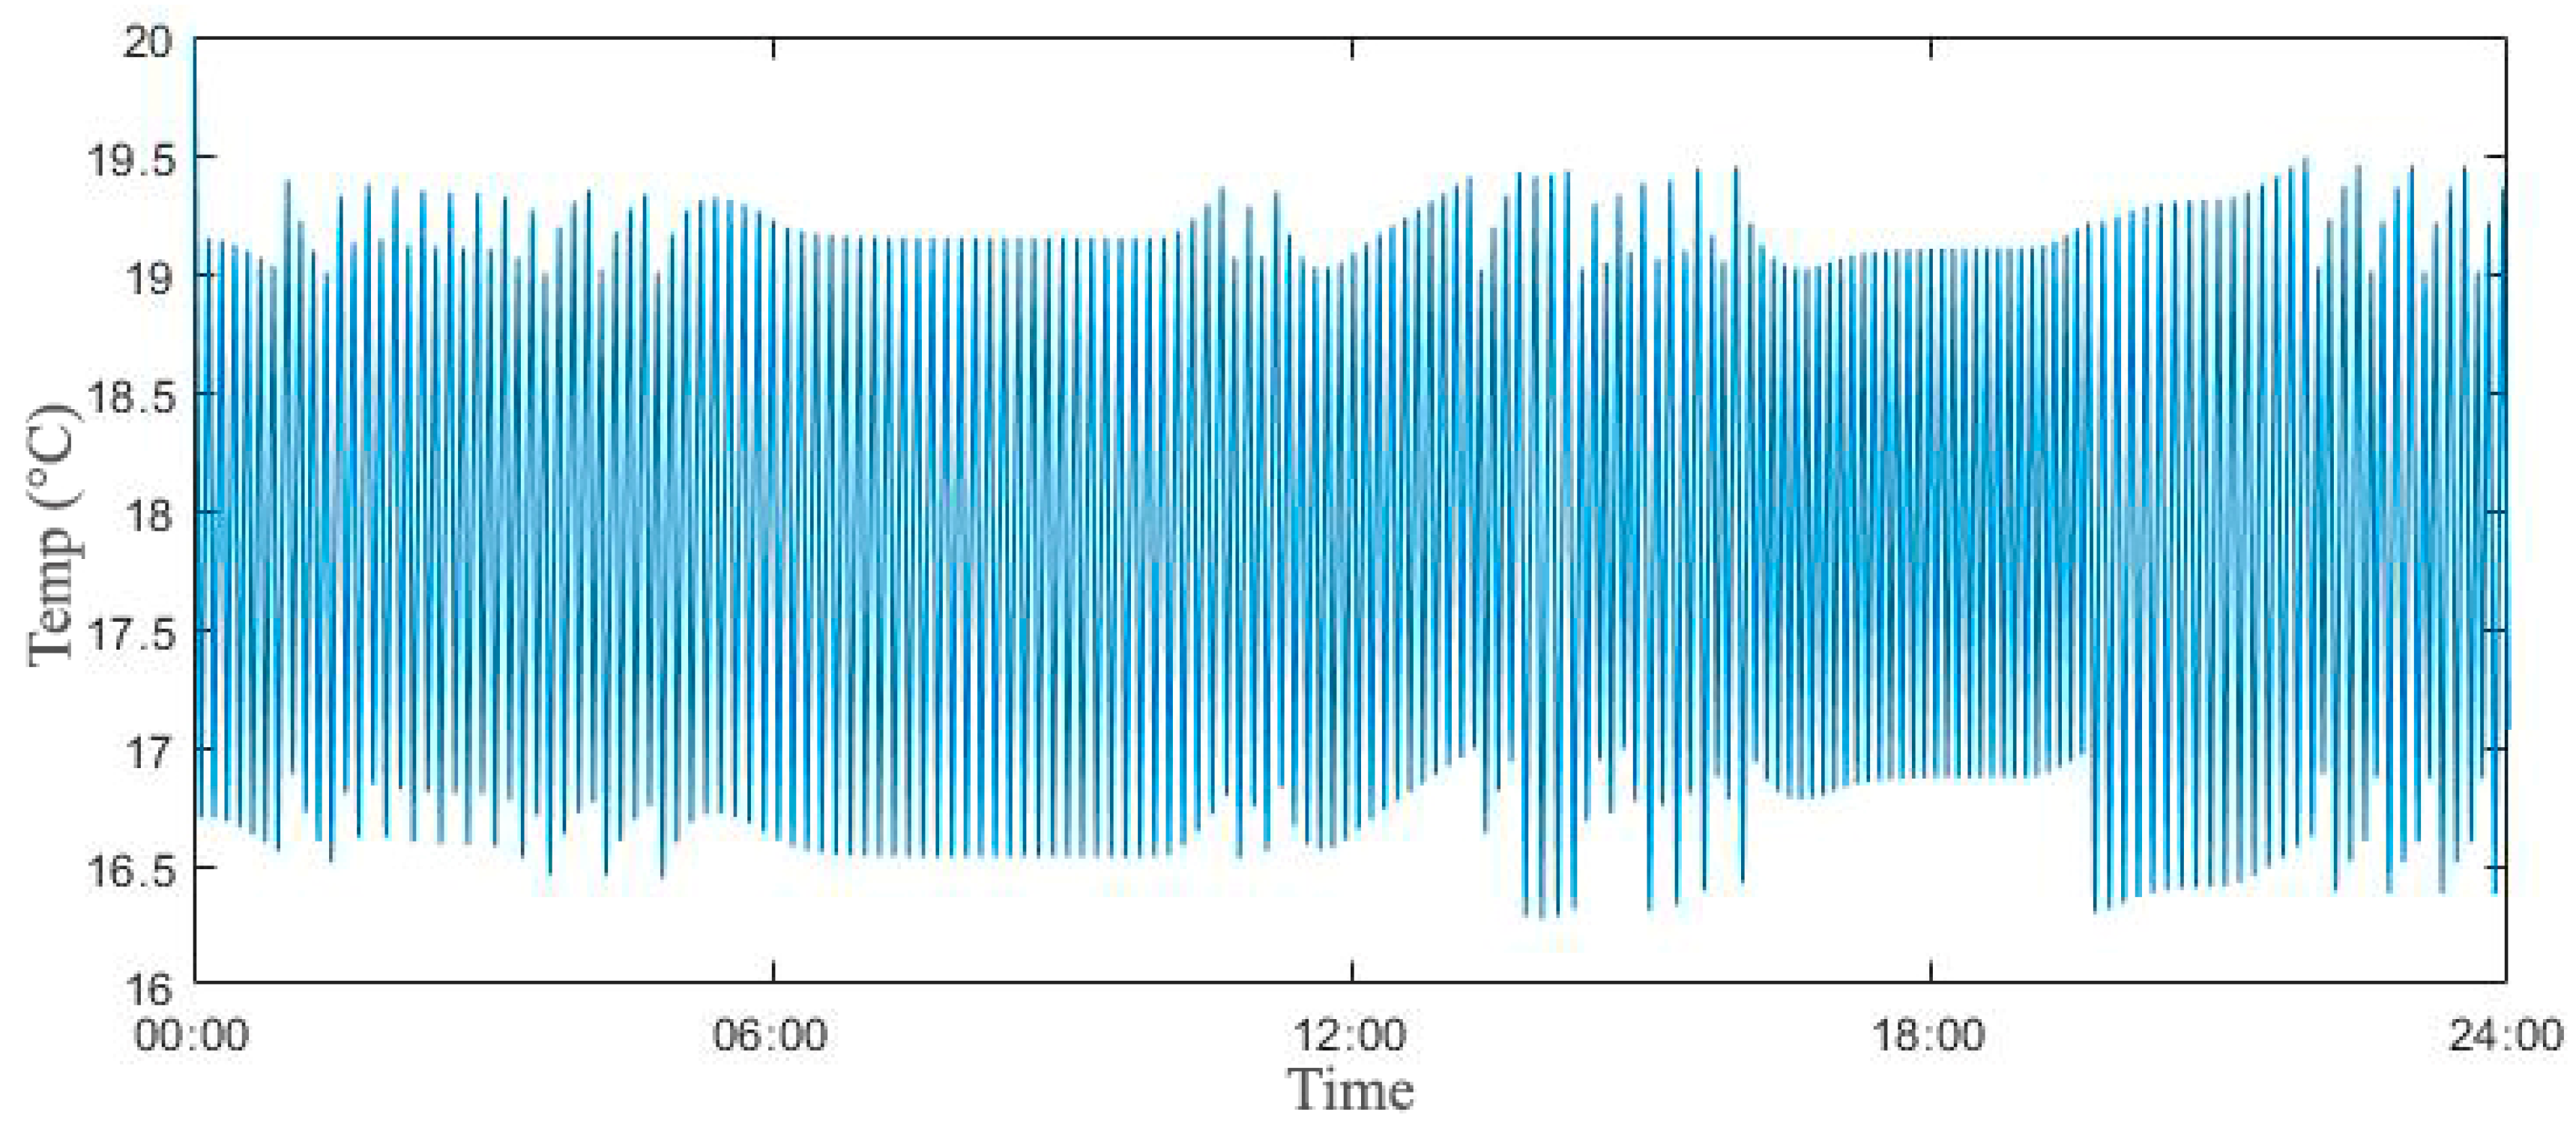
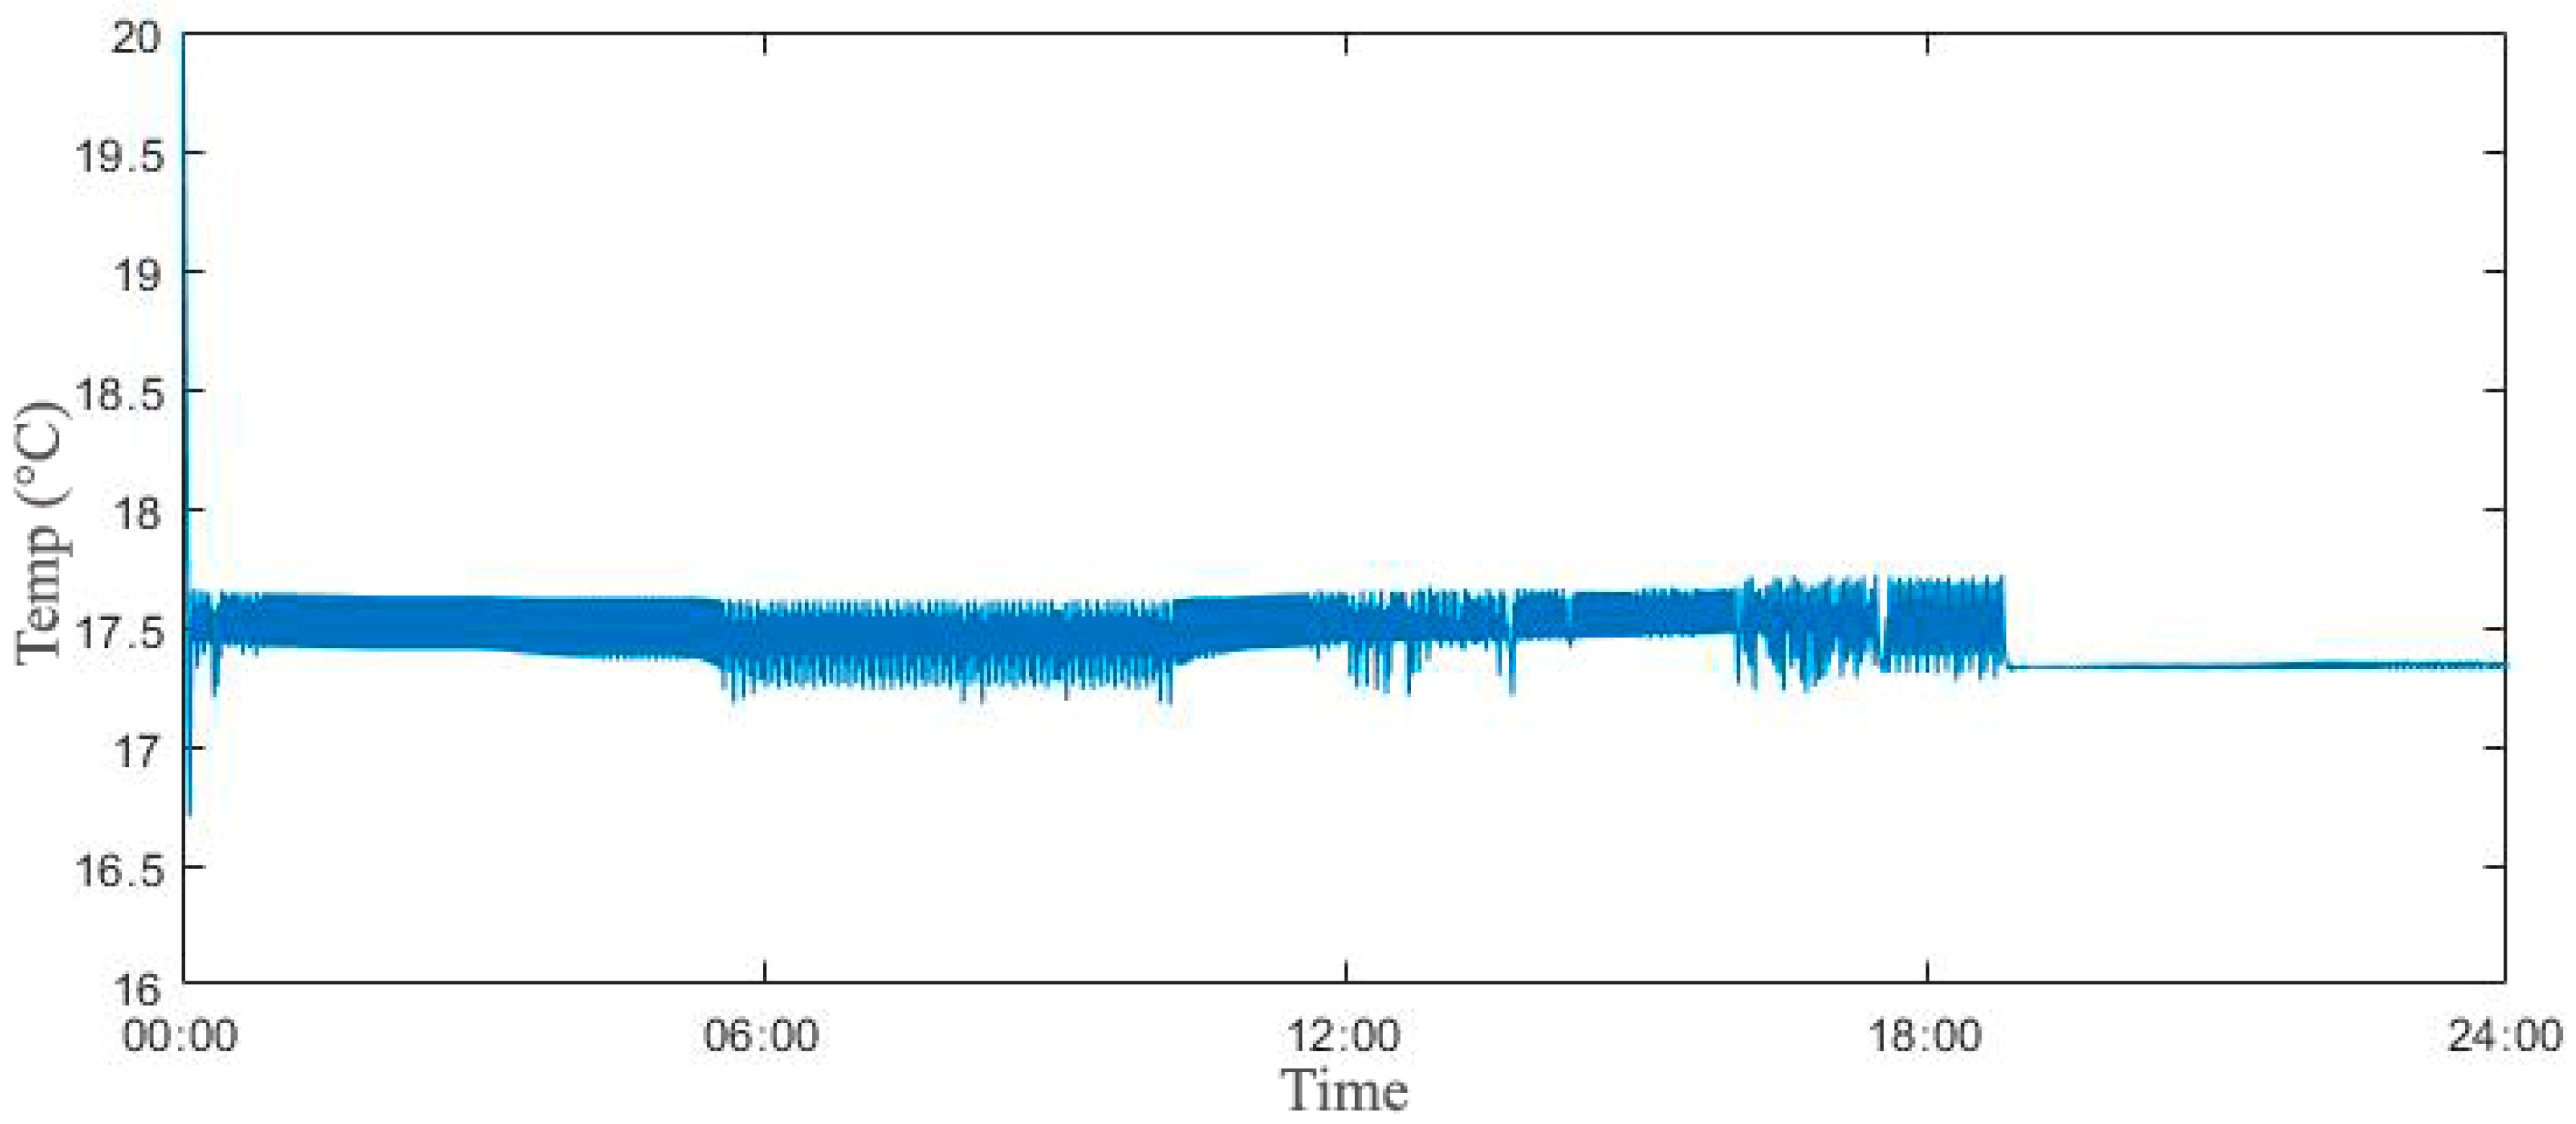
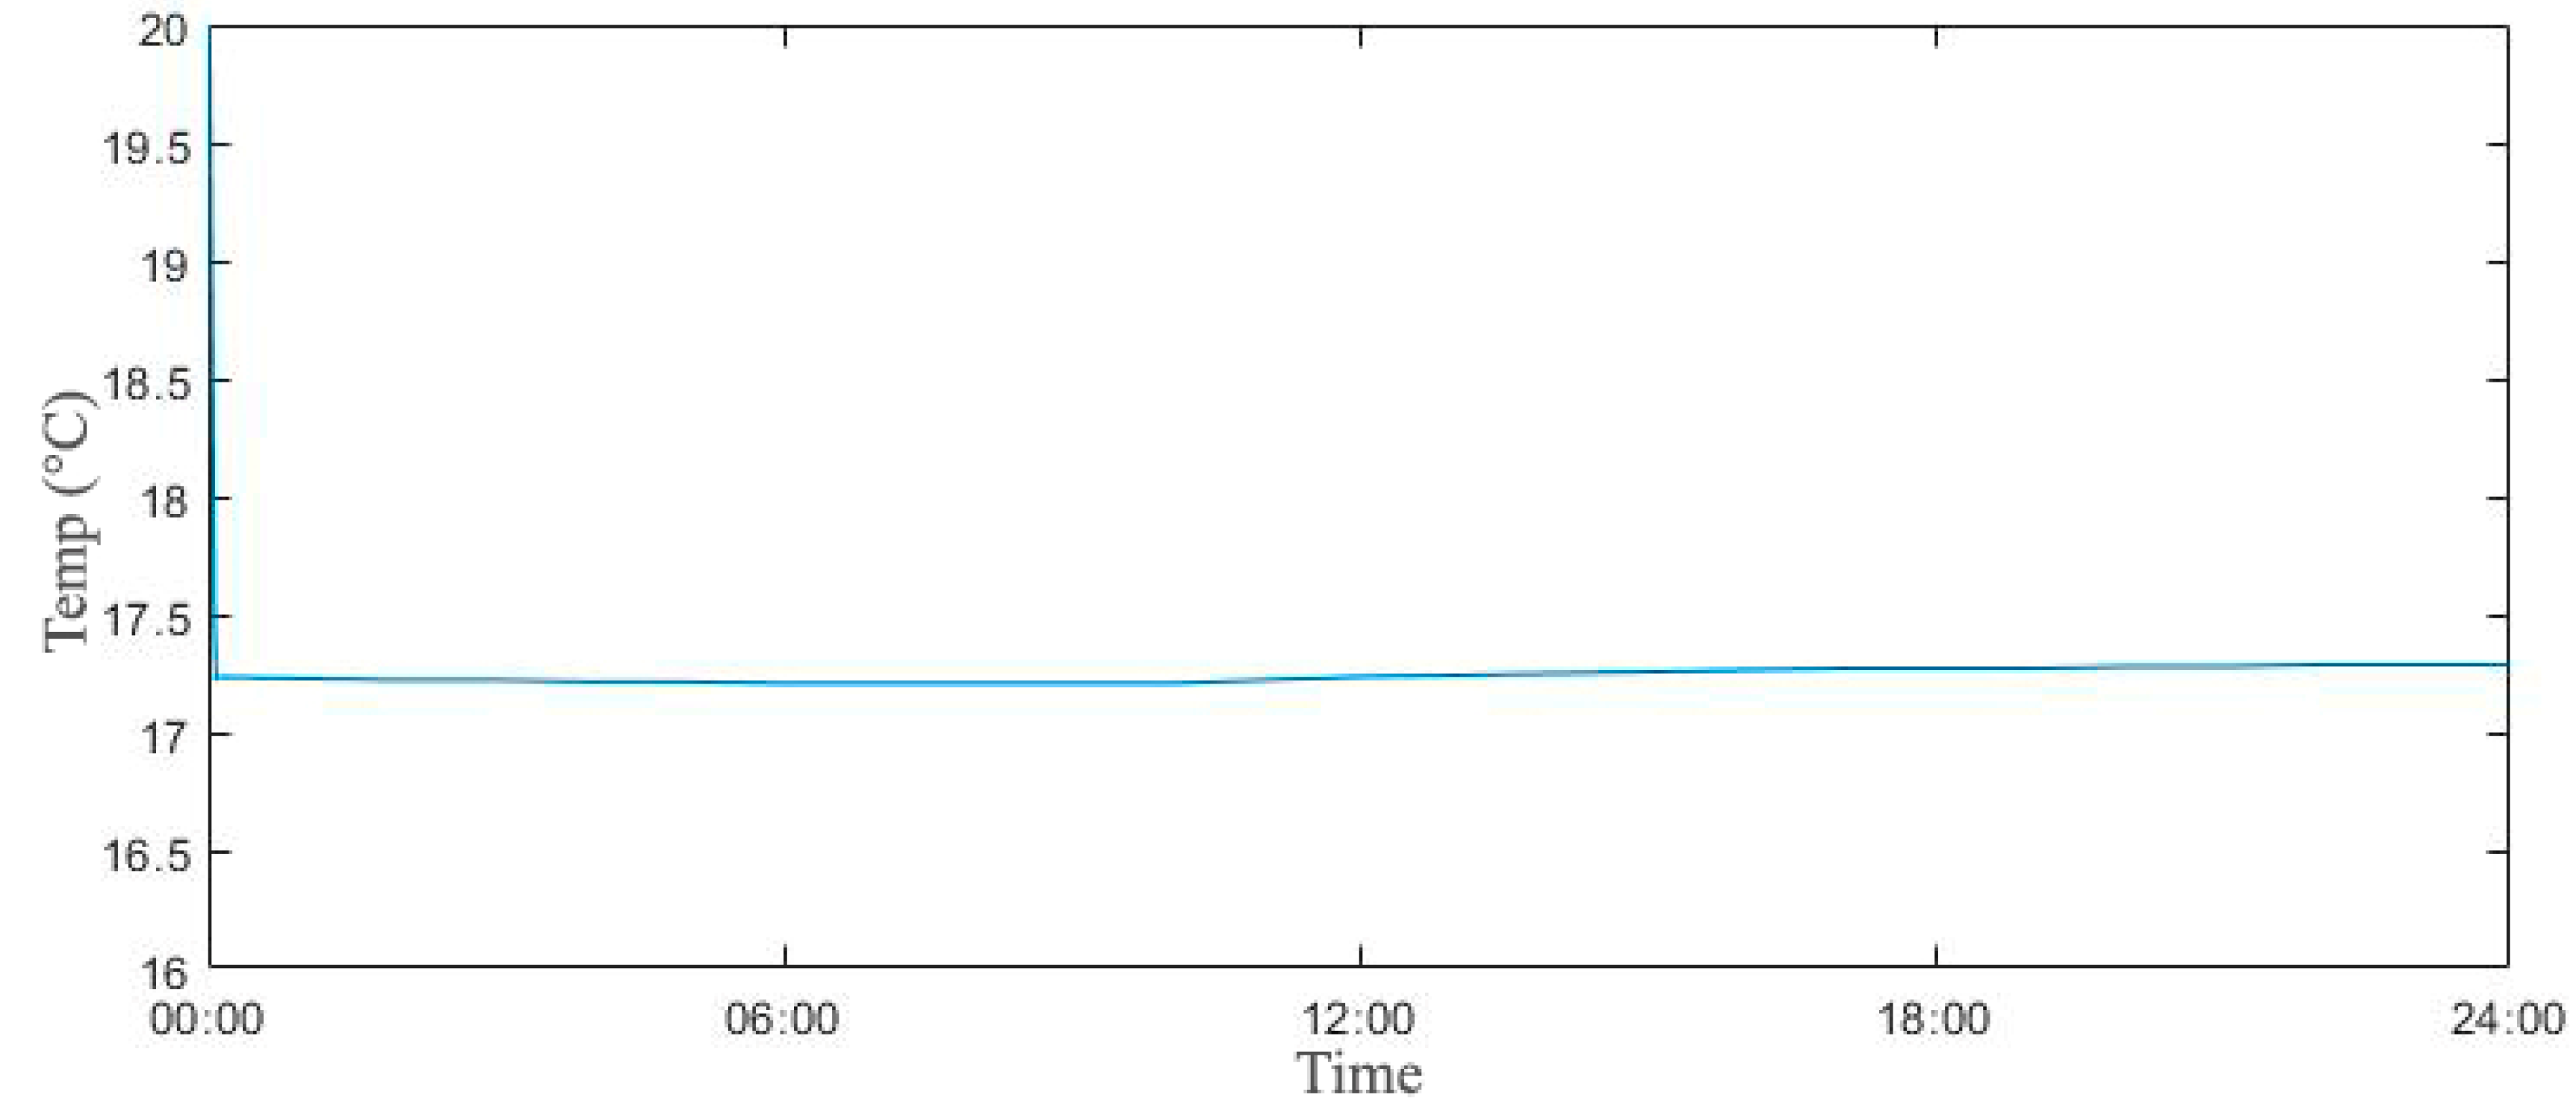
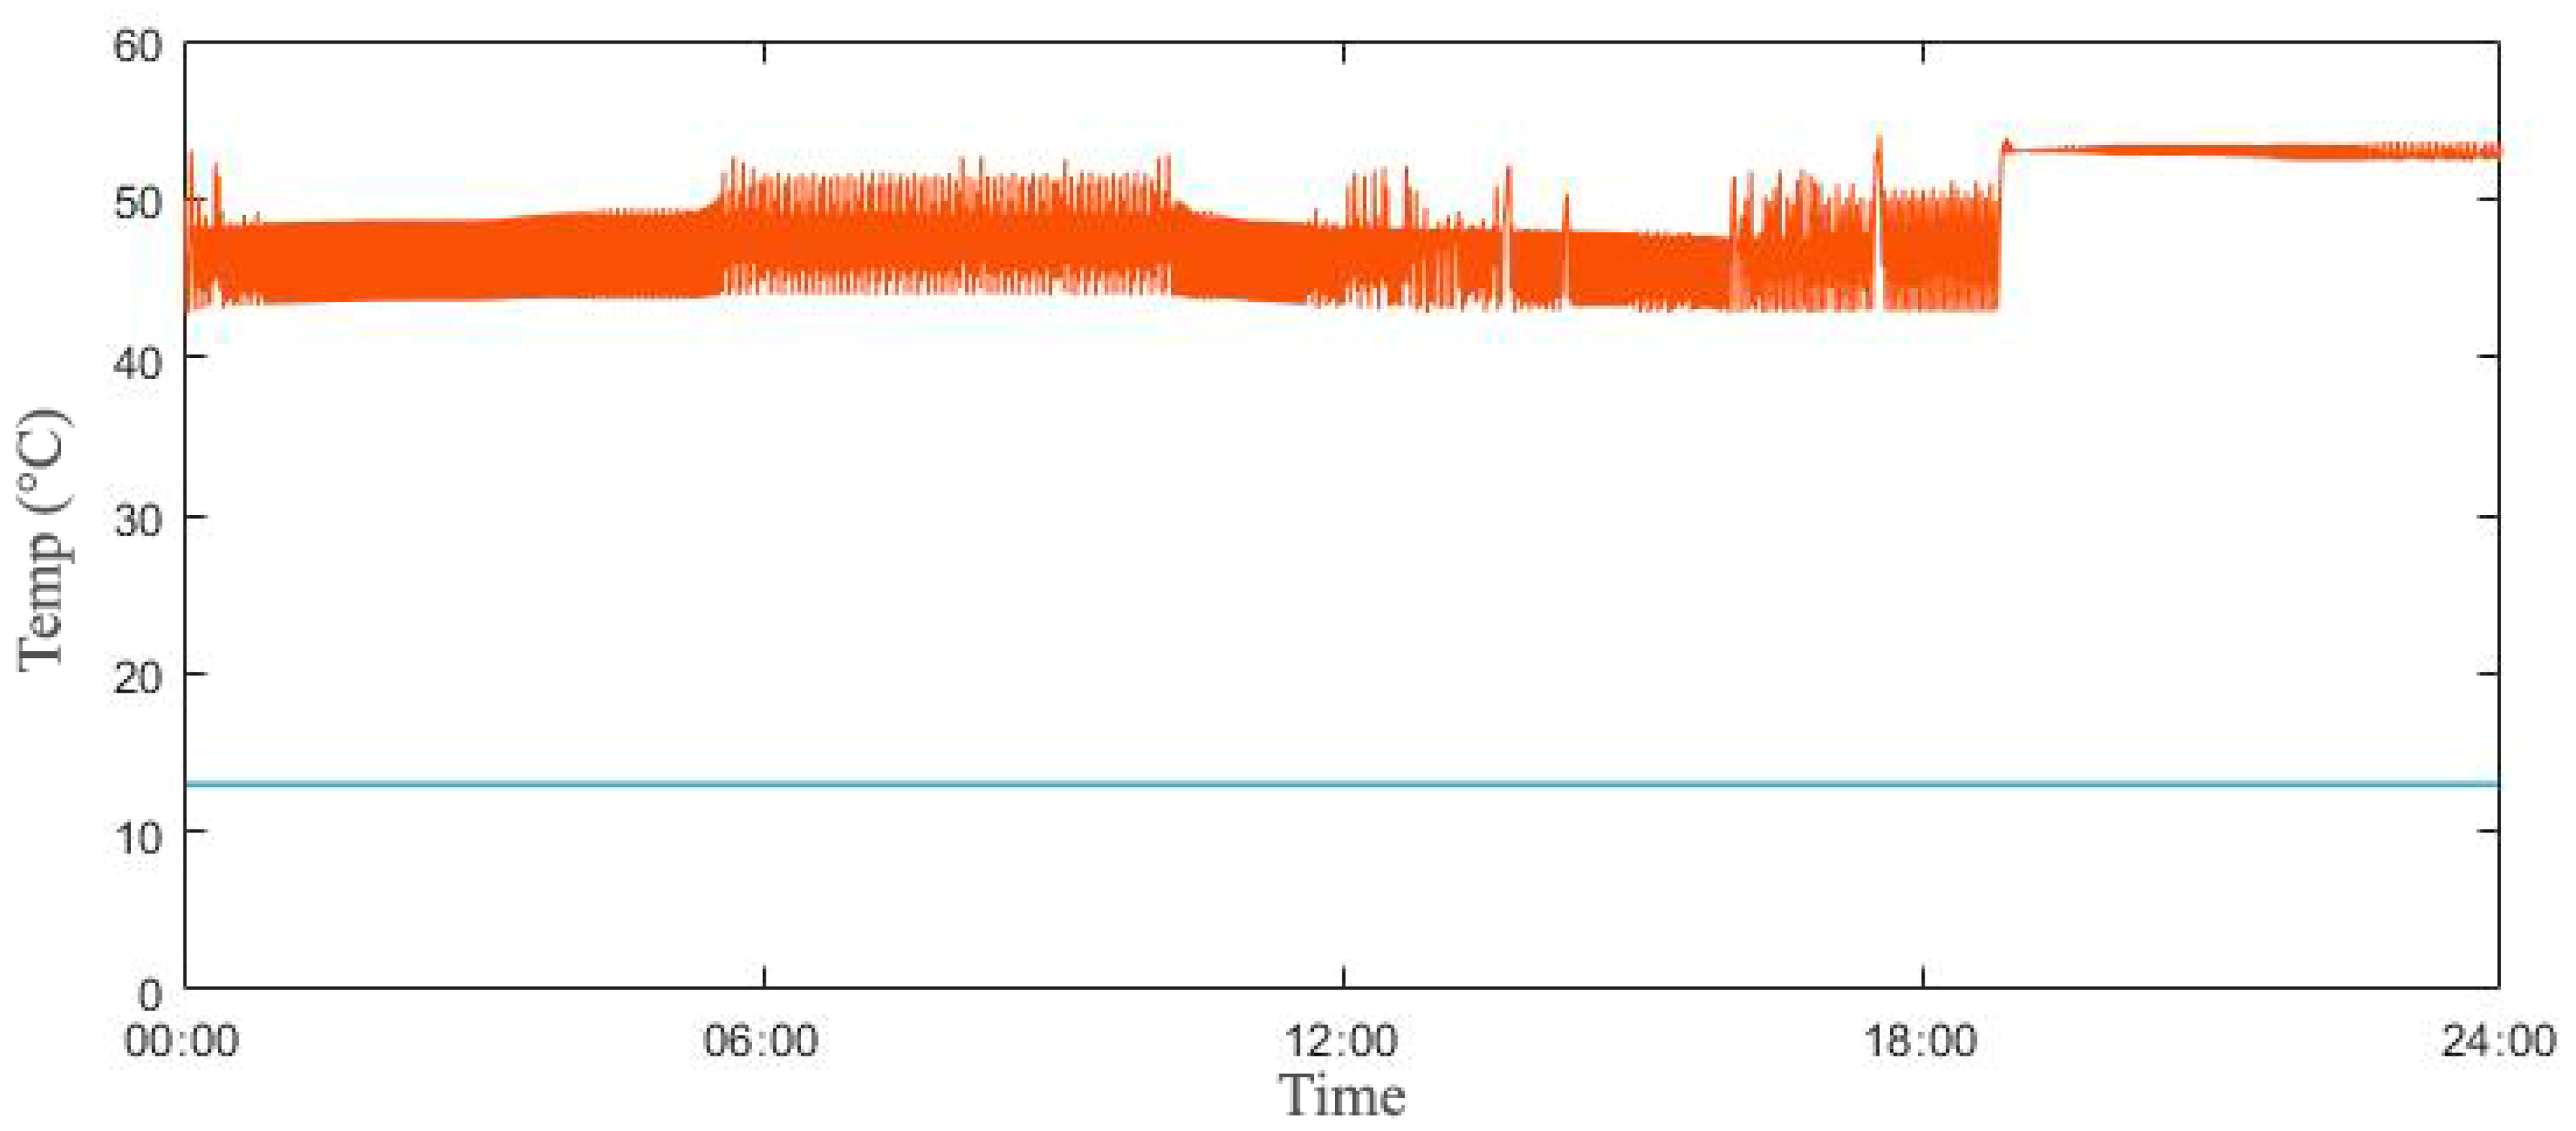
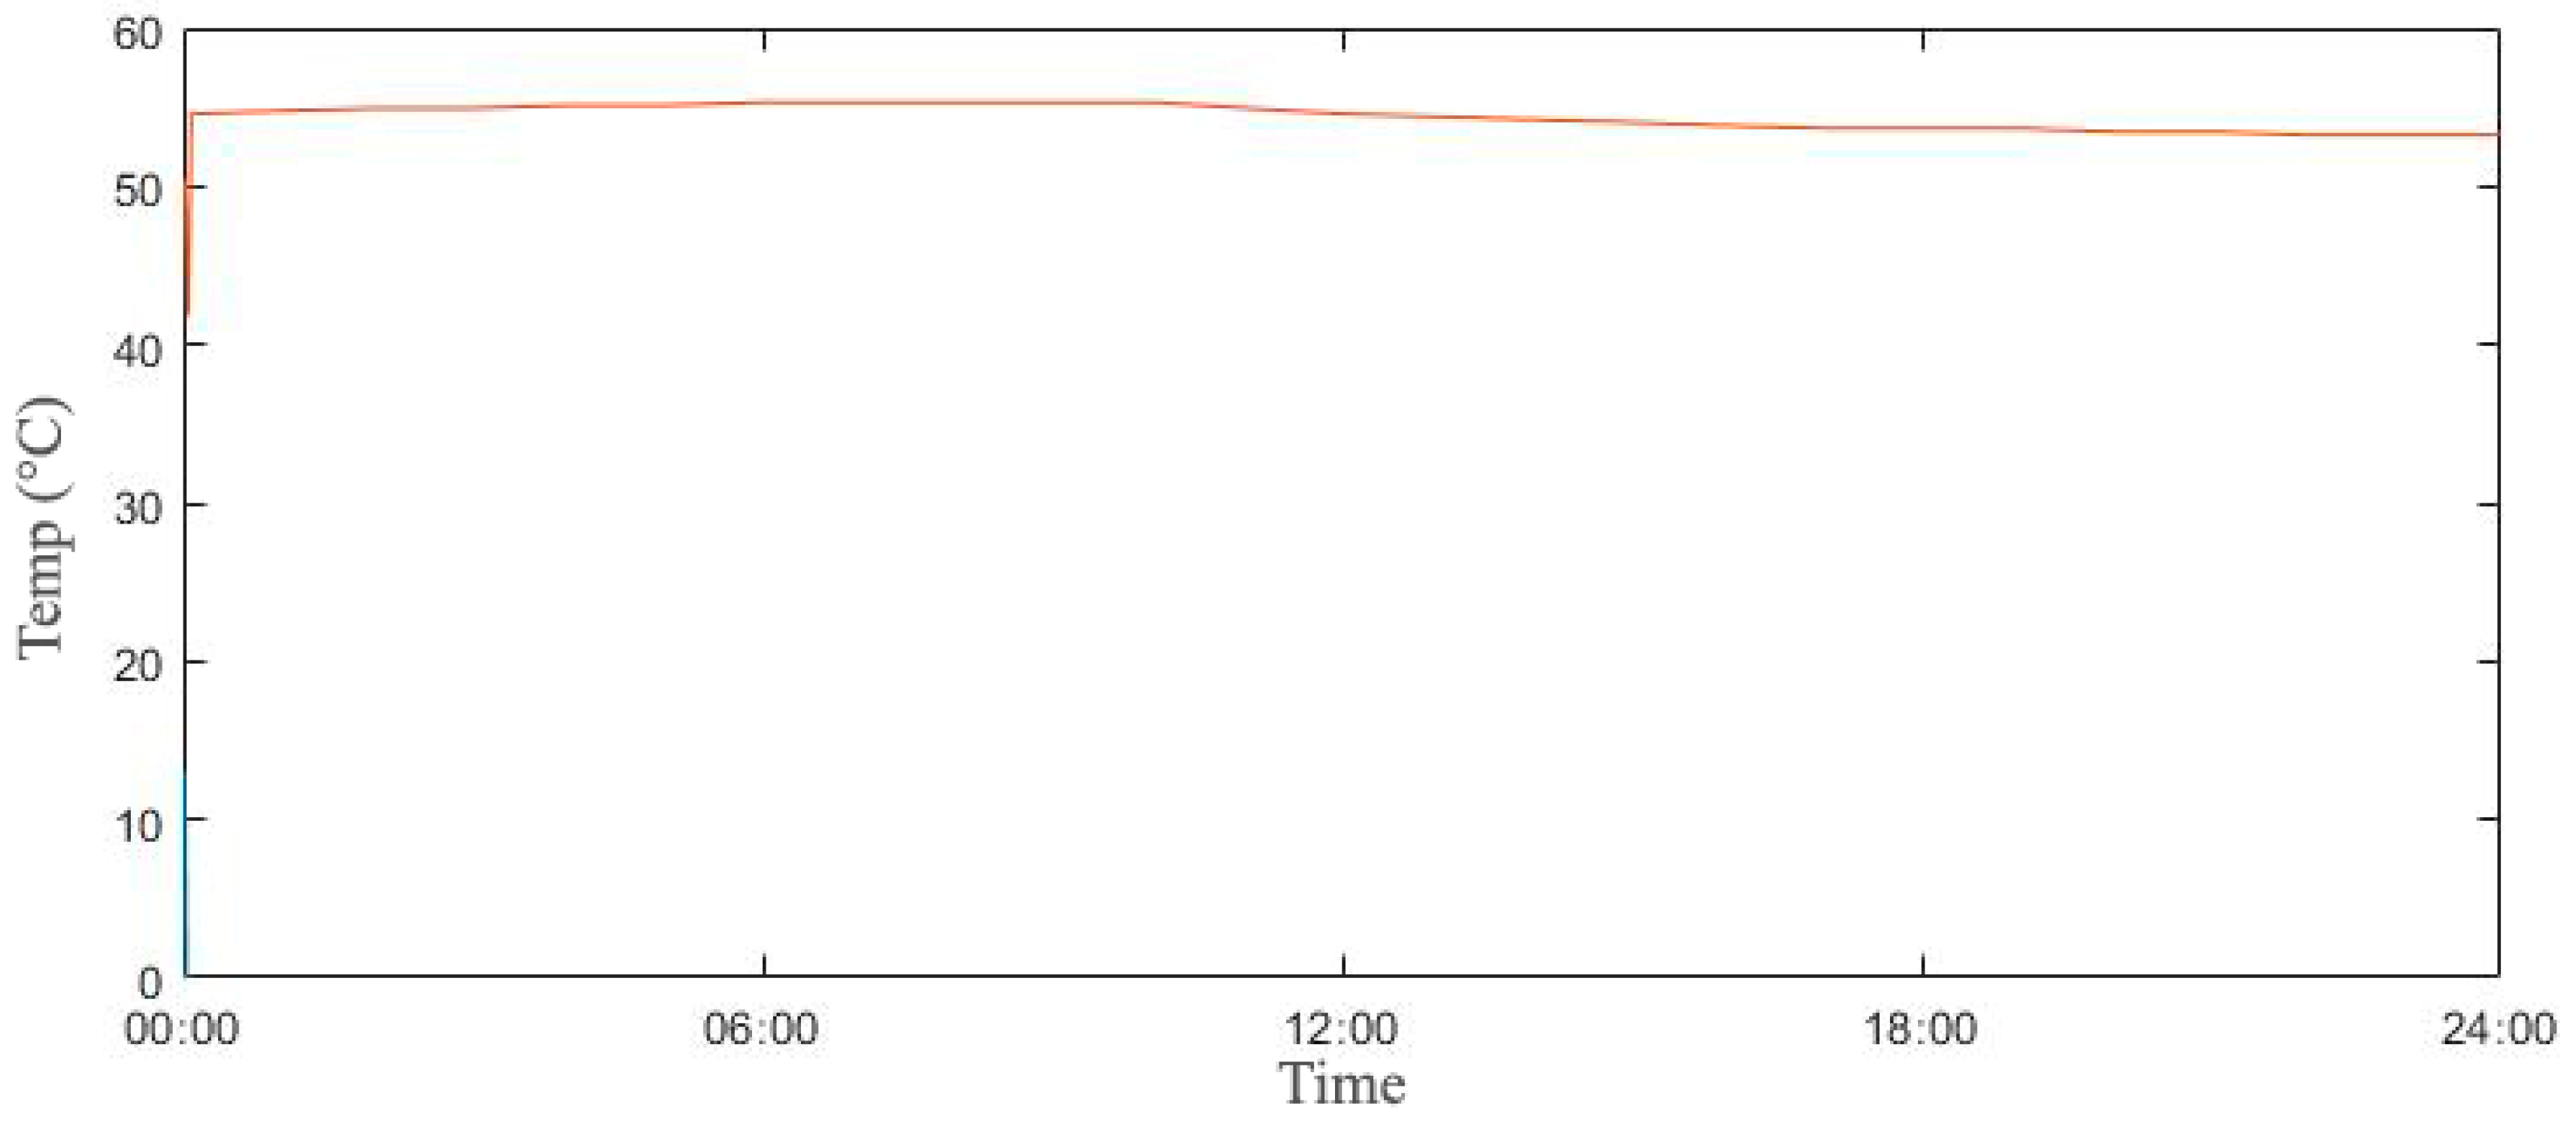
3.1. Indoor Temperature
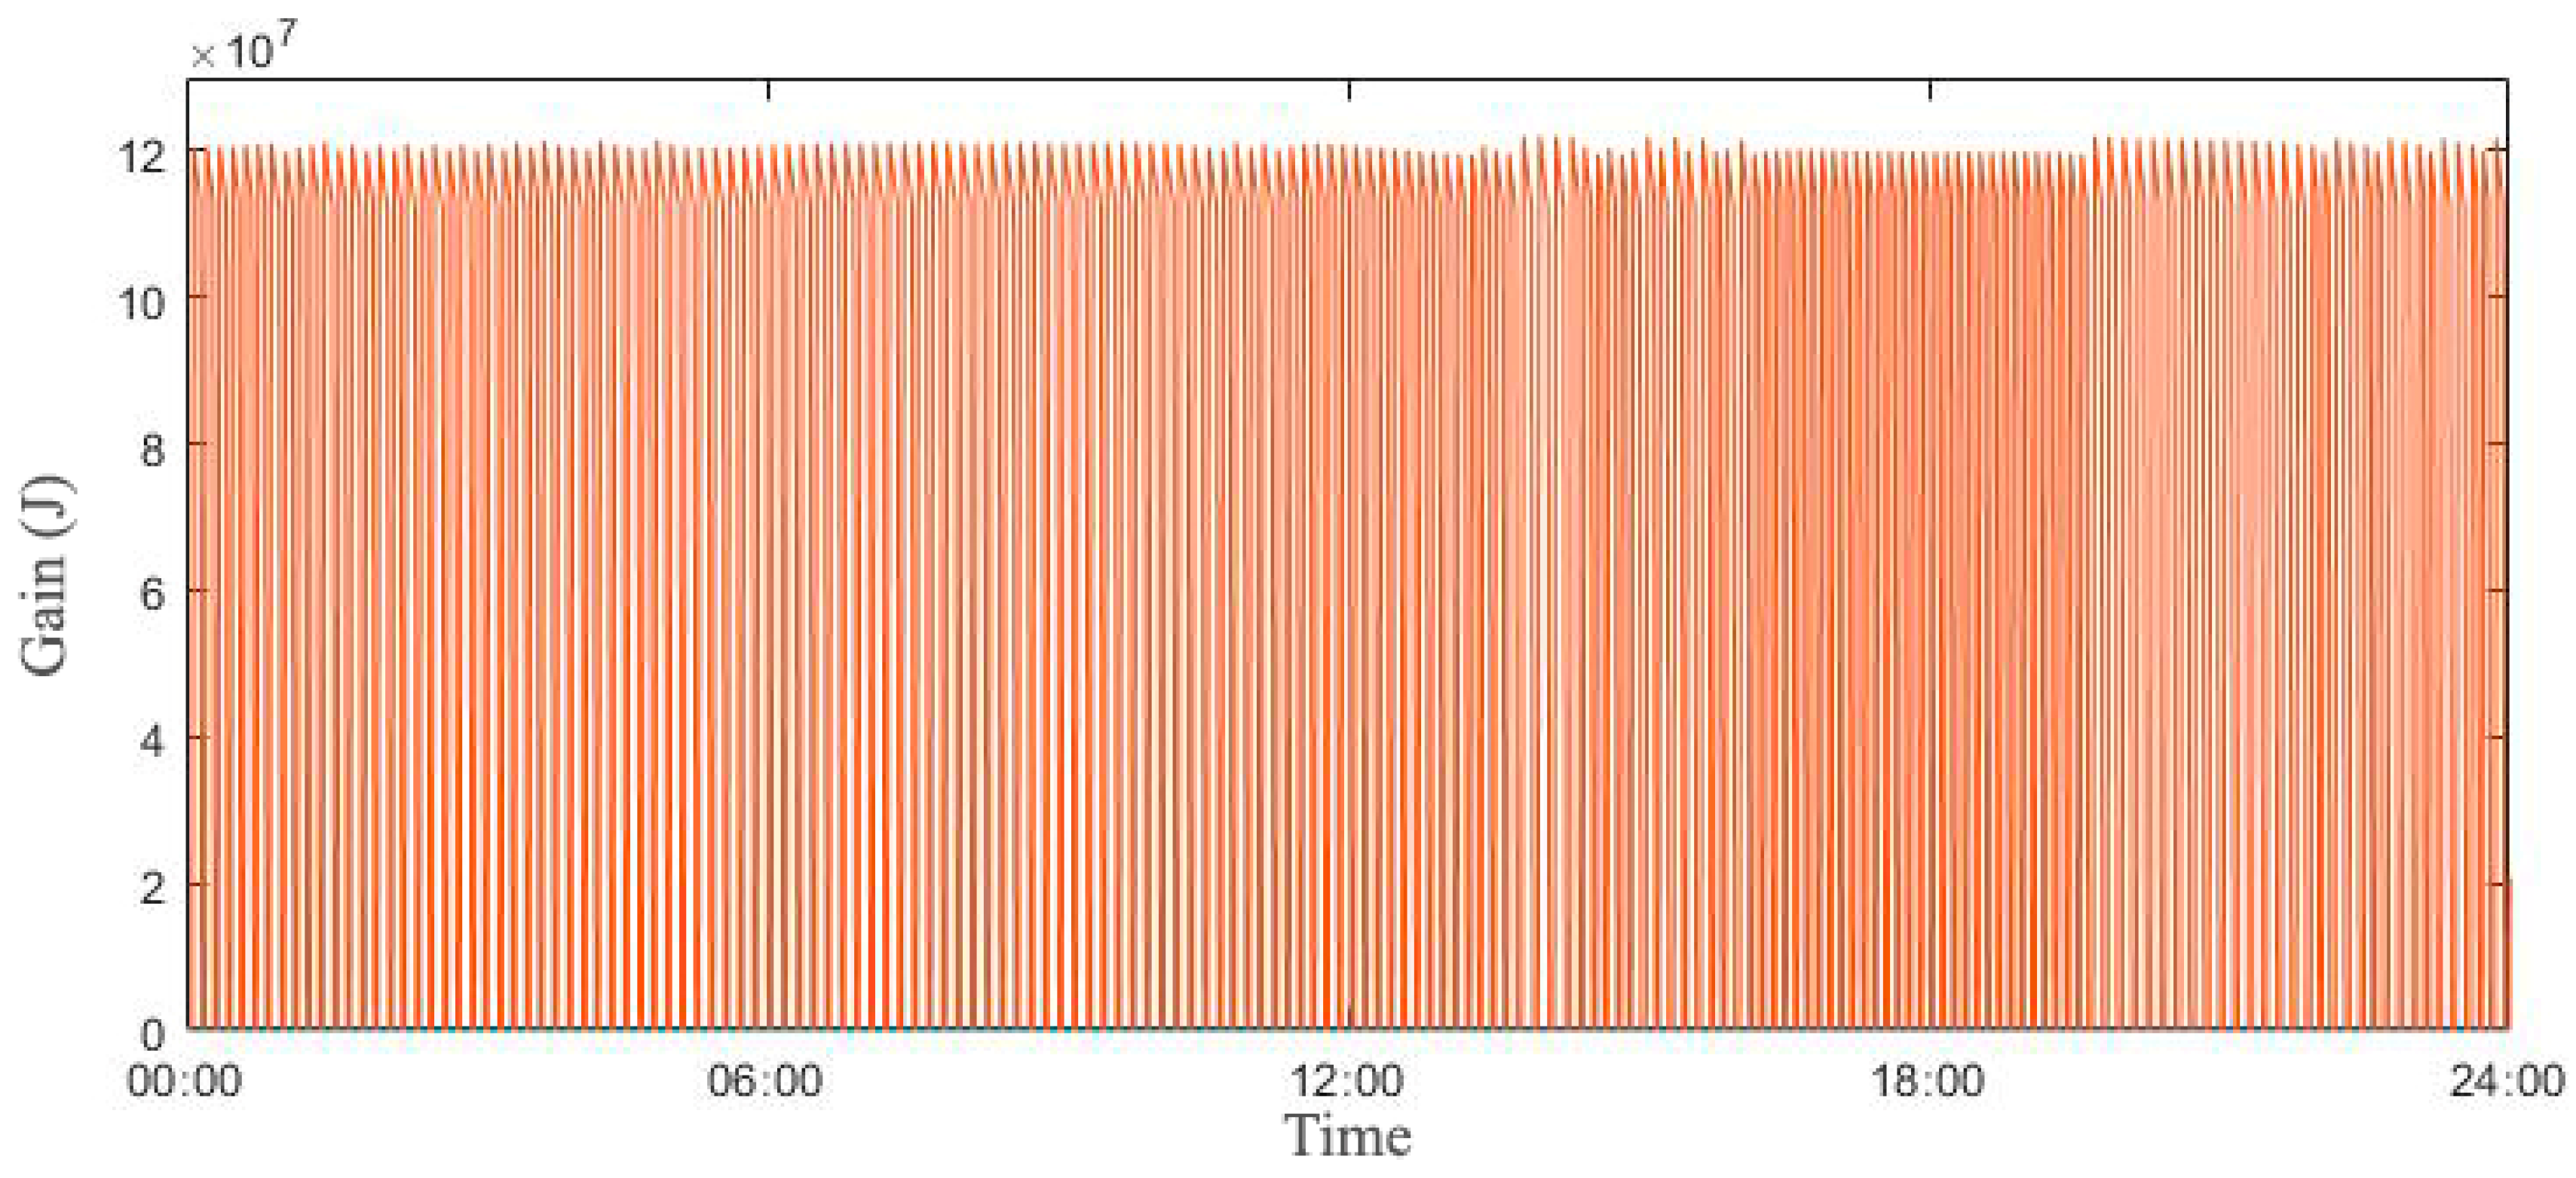
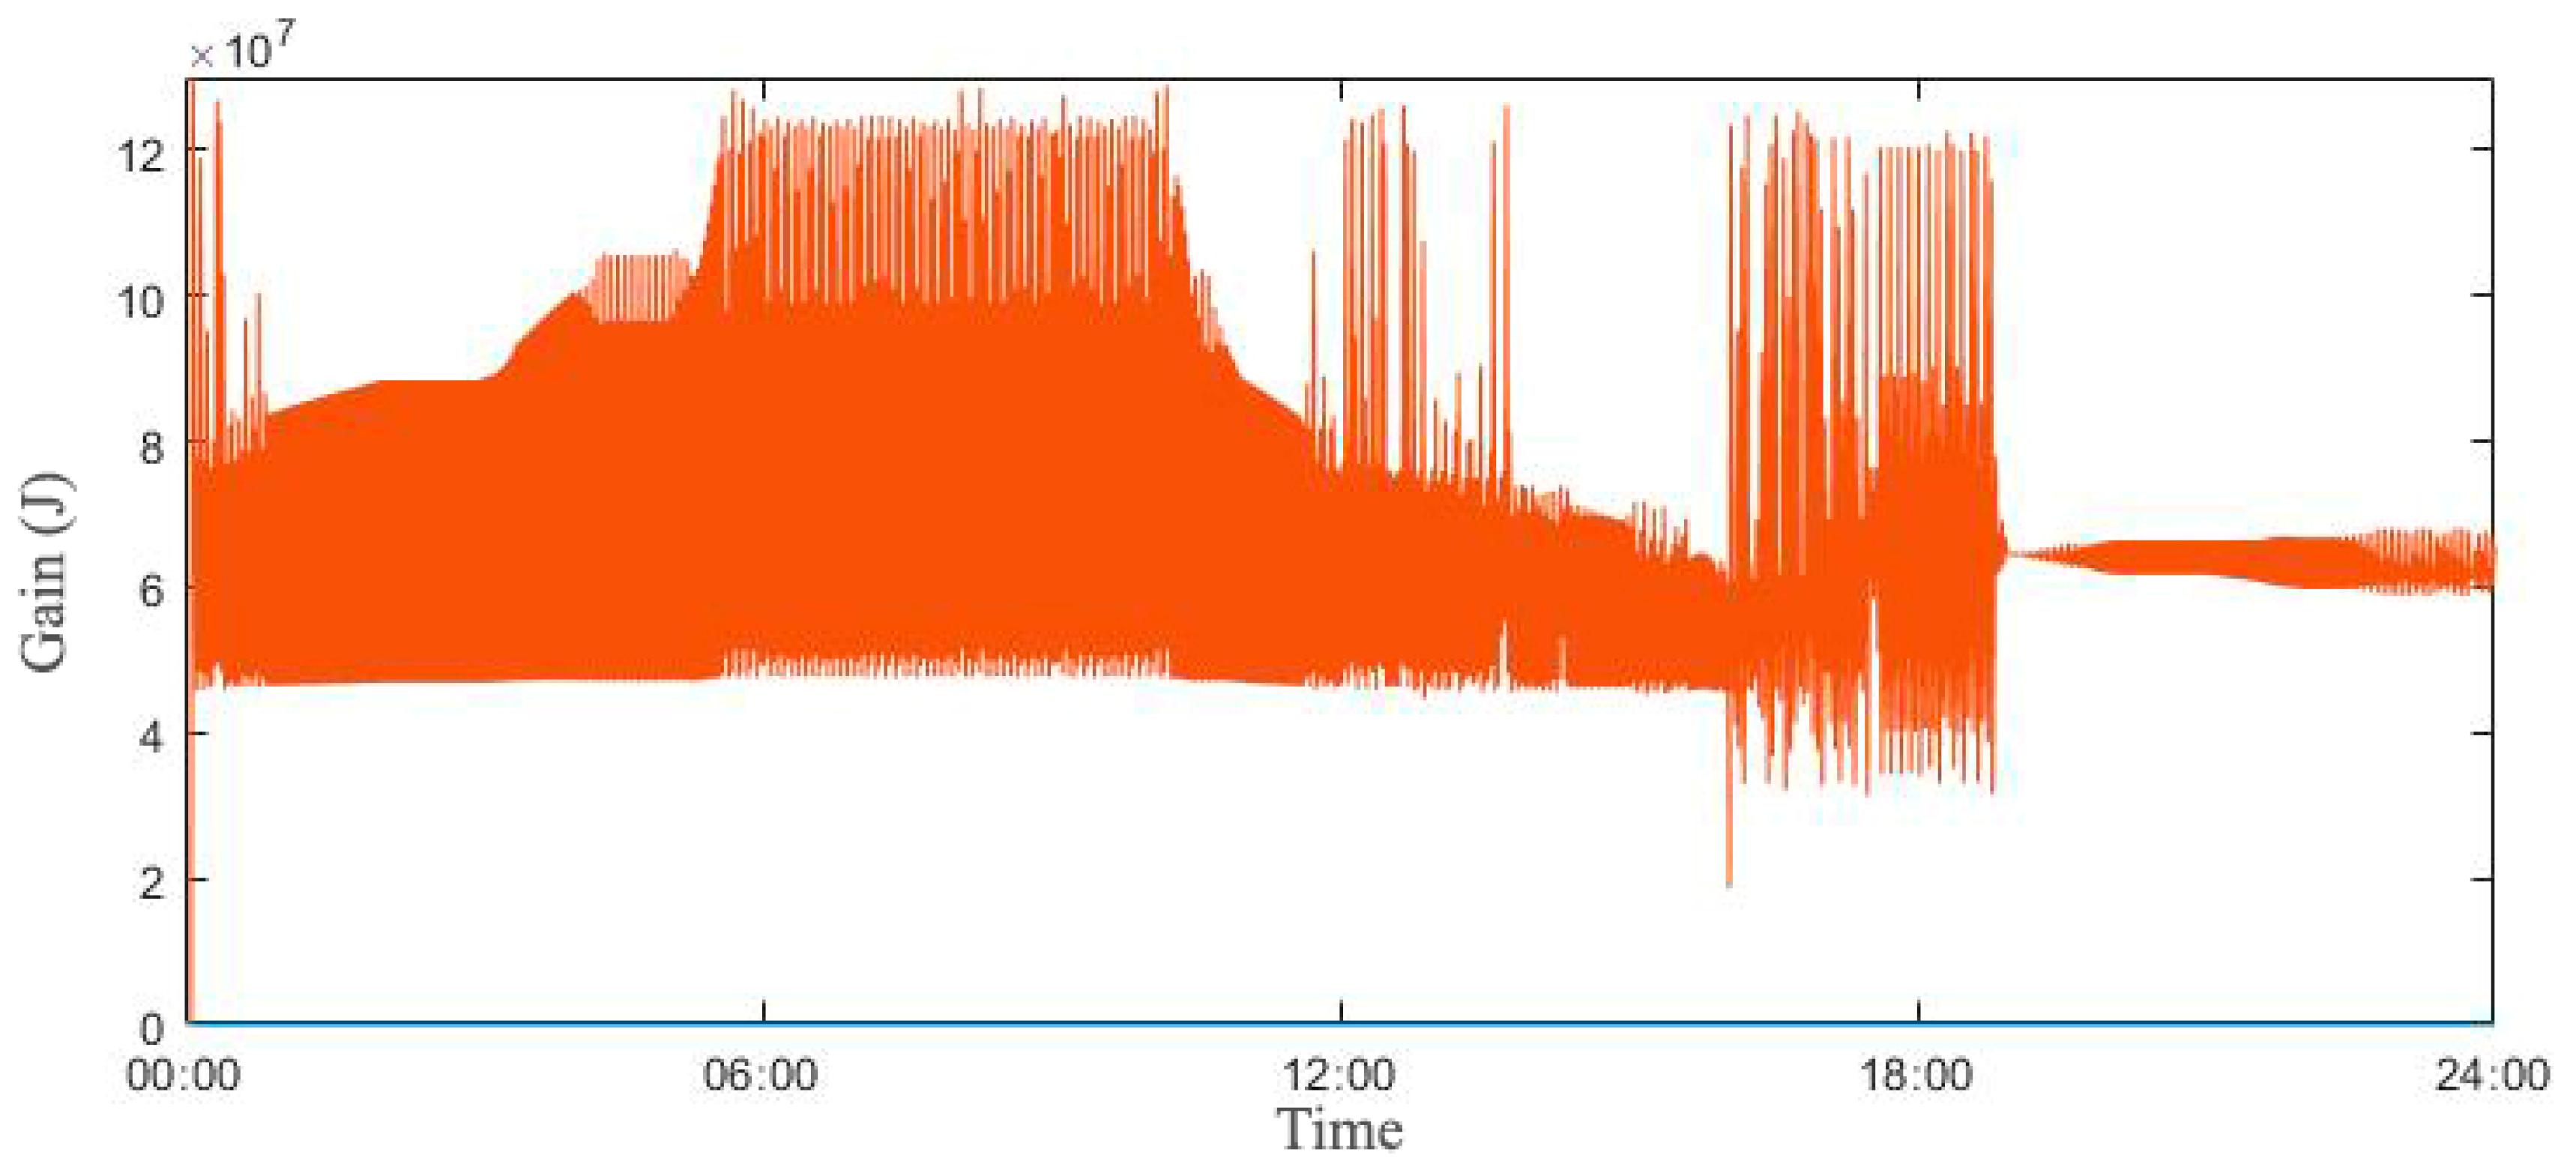
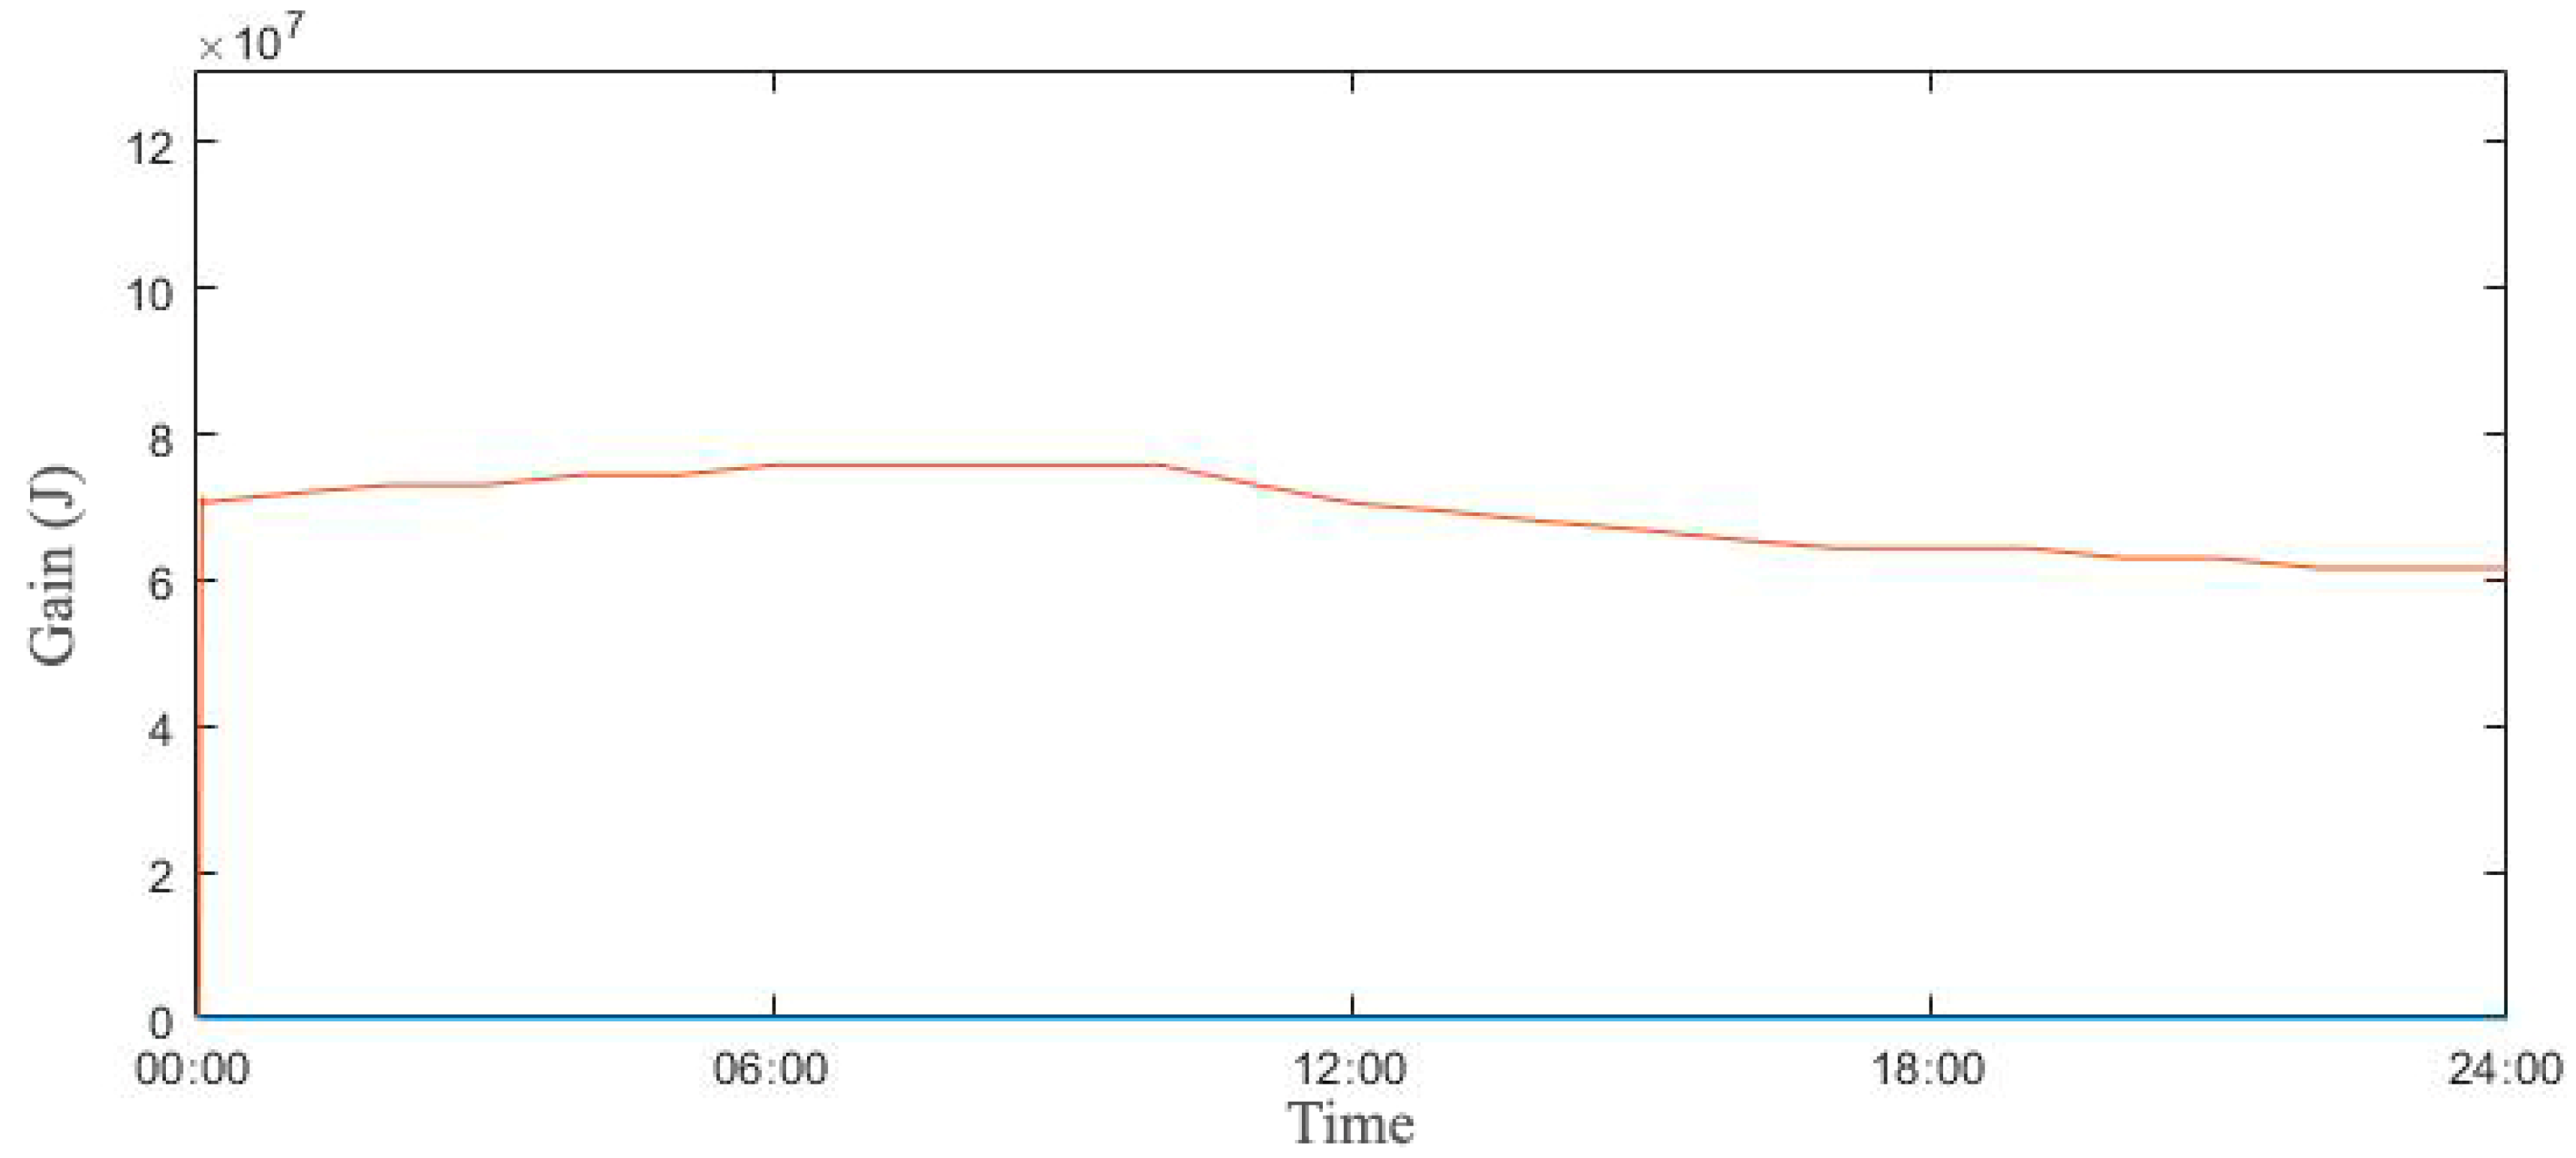
Figure 2 displays the outdoor temperature of Central Park in New York City on 23rd January which was retrieved from the weather data from the US Department of Energy (US DOE). The date of the lowest daily average temperature in winter was chosen, and as shown in the graph, the temperature is mostly below −10 °C. Uniquely, however, the temperature rises slightly at night. Figure 3, Figure 4 and Figure 5 describe the comparison of Troom controlled by the thermostat, the FIS and the ANN models. It can be seen that the range of temperature fluctuation for the thermostat is quite wide but regular. These fluctuations in temperature from the thermostat’s on-off functions may be effective in reducing its energy use, but there are disadvantages in maintaining the constancy of actual users’ thermal comfort.
Figure 4 describes the mostly improved temperature patterns controlled by the FIS control. As mentioned, the temperature changes by the thermostat on-off model may be disadvantageous to control of the Troom, but the FIS model effectively reduces the range of the temperature fluctuations. However, Figure 5 shows the even improved performance of Troom retention within the Tset by the ANN control model. Through learned and precise controls, it controls Troom quite flat and consistent, which can be regarded as having a relatively appropriate thermal comfort, but it can be possible that the energy use needs more.

3.2. Heating Gain

Figure 6, Figure 7 and Figure 8 clearly show the heating gain changed to maintain Tset by the three different controllers. In the case of the thermostat, as in the room temperature graph pattern, there is a constant change of heating gain, from 0 to 12 on y-axis, at 24 h a day. Unlike the thermostat, the FIS has a very complex aspect depending on the outside temperature change, which in turn is reversed with the room temperature graph in Figure 3. In areas where Troom are maintained at about 17.2 to 17.3 °C, heating gain appears quite large, while areas where Troom is maintained at about 17.7 to 17.8 °C, there is fewer heating gain. A relatively different pattern after 19:00, which can be inferred that the membership function of the FIS internal algorithms has begun to be applied in a different way when the outside temperature starts to rise above −10.5 °C.
As indicated in Figure 8, the ANN model shows a distinctly different graph pattern as in Troom graph. In order to maintain the constancy of indoor thermal comfort, the heating gain required to keep indoor temperatures steady for 24 h in the range of 17.2 to 17.3 °C. This, as seen in the thermostat graph, can help prevent unnecessary overshooting from several on-off signals for heating supply air between 0 and 12, as well as increase efficiency in the system or capacity design by predicting the minimum and maximum requirements for heating energy supply for 24 h.

4. Discussion

4.1. Comparison of Thermal Comfort

Table 2 describes the standard deviation of the PMV index. Since the PMV levels proceed on both sides (positive and negative) on a zero basis, simply on average there is an ambiguity in determining the system’s performance. Therefore, the standard deviation was calculated because it can be more effective to investigate its efficiency using errors from the reference value. As indicated, the FIS is by 1.76% and the ANN is by 17.83% more effective than the thermostat controller, respectively. As indicated in Figure 9, Figure 10 and Figure 11, about half of the time range, the PMV levels was on near −1.8, which means that users can feel a bit cold in the time range. Although typical recommended indoor temperature of typical offices is set at 20 °C (68 °F) in winter, some guidelines such as from Canada and WHO recommend that the heating temperature in winter is enhanced to 18 °C. In this study, for testing higher energy saving potentials, the 18 °C was utilized as a heating set-point in winter. In fact, it is not easy to figure out a clear result that the difference of the PMV between setting up and actual values affects the productivity and workability of a specific building space. Therefore, the issue of differences in thermal comfort at these reference values and how the mean or standard deviation values results in any economic effect is a part of follow-up studies.

4.2. Comparison of Energy Demand

At the viewpoint of the clear quantification, the energy use can be a common and effective index to investigate the performance of systems. Table 3 displays the results of the daily energy transfer between the indoor and outdoor space. As indicated, the FIS and the ANN achieved over 3% of energy use efficiency rather than the thermostat controller. Rather than the improved performance in thermal comfort, summarized by possible productivity and workability mentioned in the previous section, it is shown by the efficiency of the two models as a result of clearly quantification.
The result values of 3.30% for the FIS and 3.10% for the ANN, respectively, can be interpreted as clear efficiency in that it can reduce actual energy use or reduce capacity in the HVAC system design. This aspect can be clearly seen in the room temperature graphs in Figure 3, Figure 4 and Figure 5, where the thermostat model was controlled at an average of 18 °C responding to Tset. However, due to the operation of the adaptive controller, the FIS and the ANN models were controlled at an average of 17.6 °C and 17.3 °C, respectively. The results of these indoor temperature controls at the PMV levels are shown to be a reduction in energy transfer.

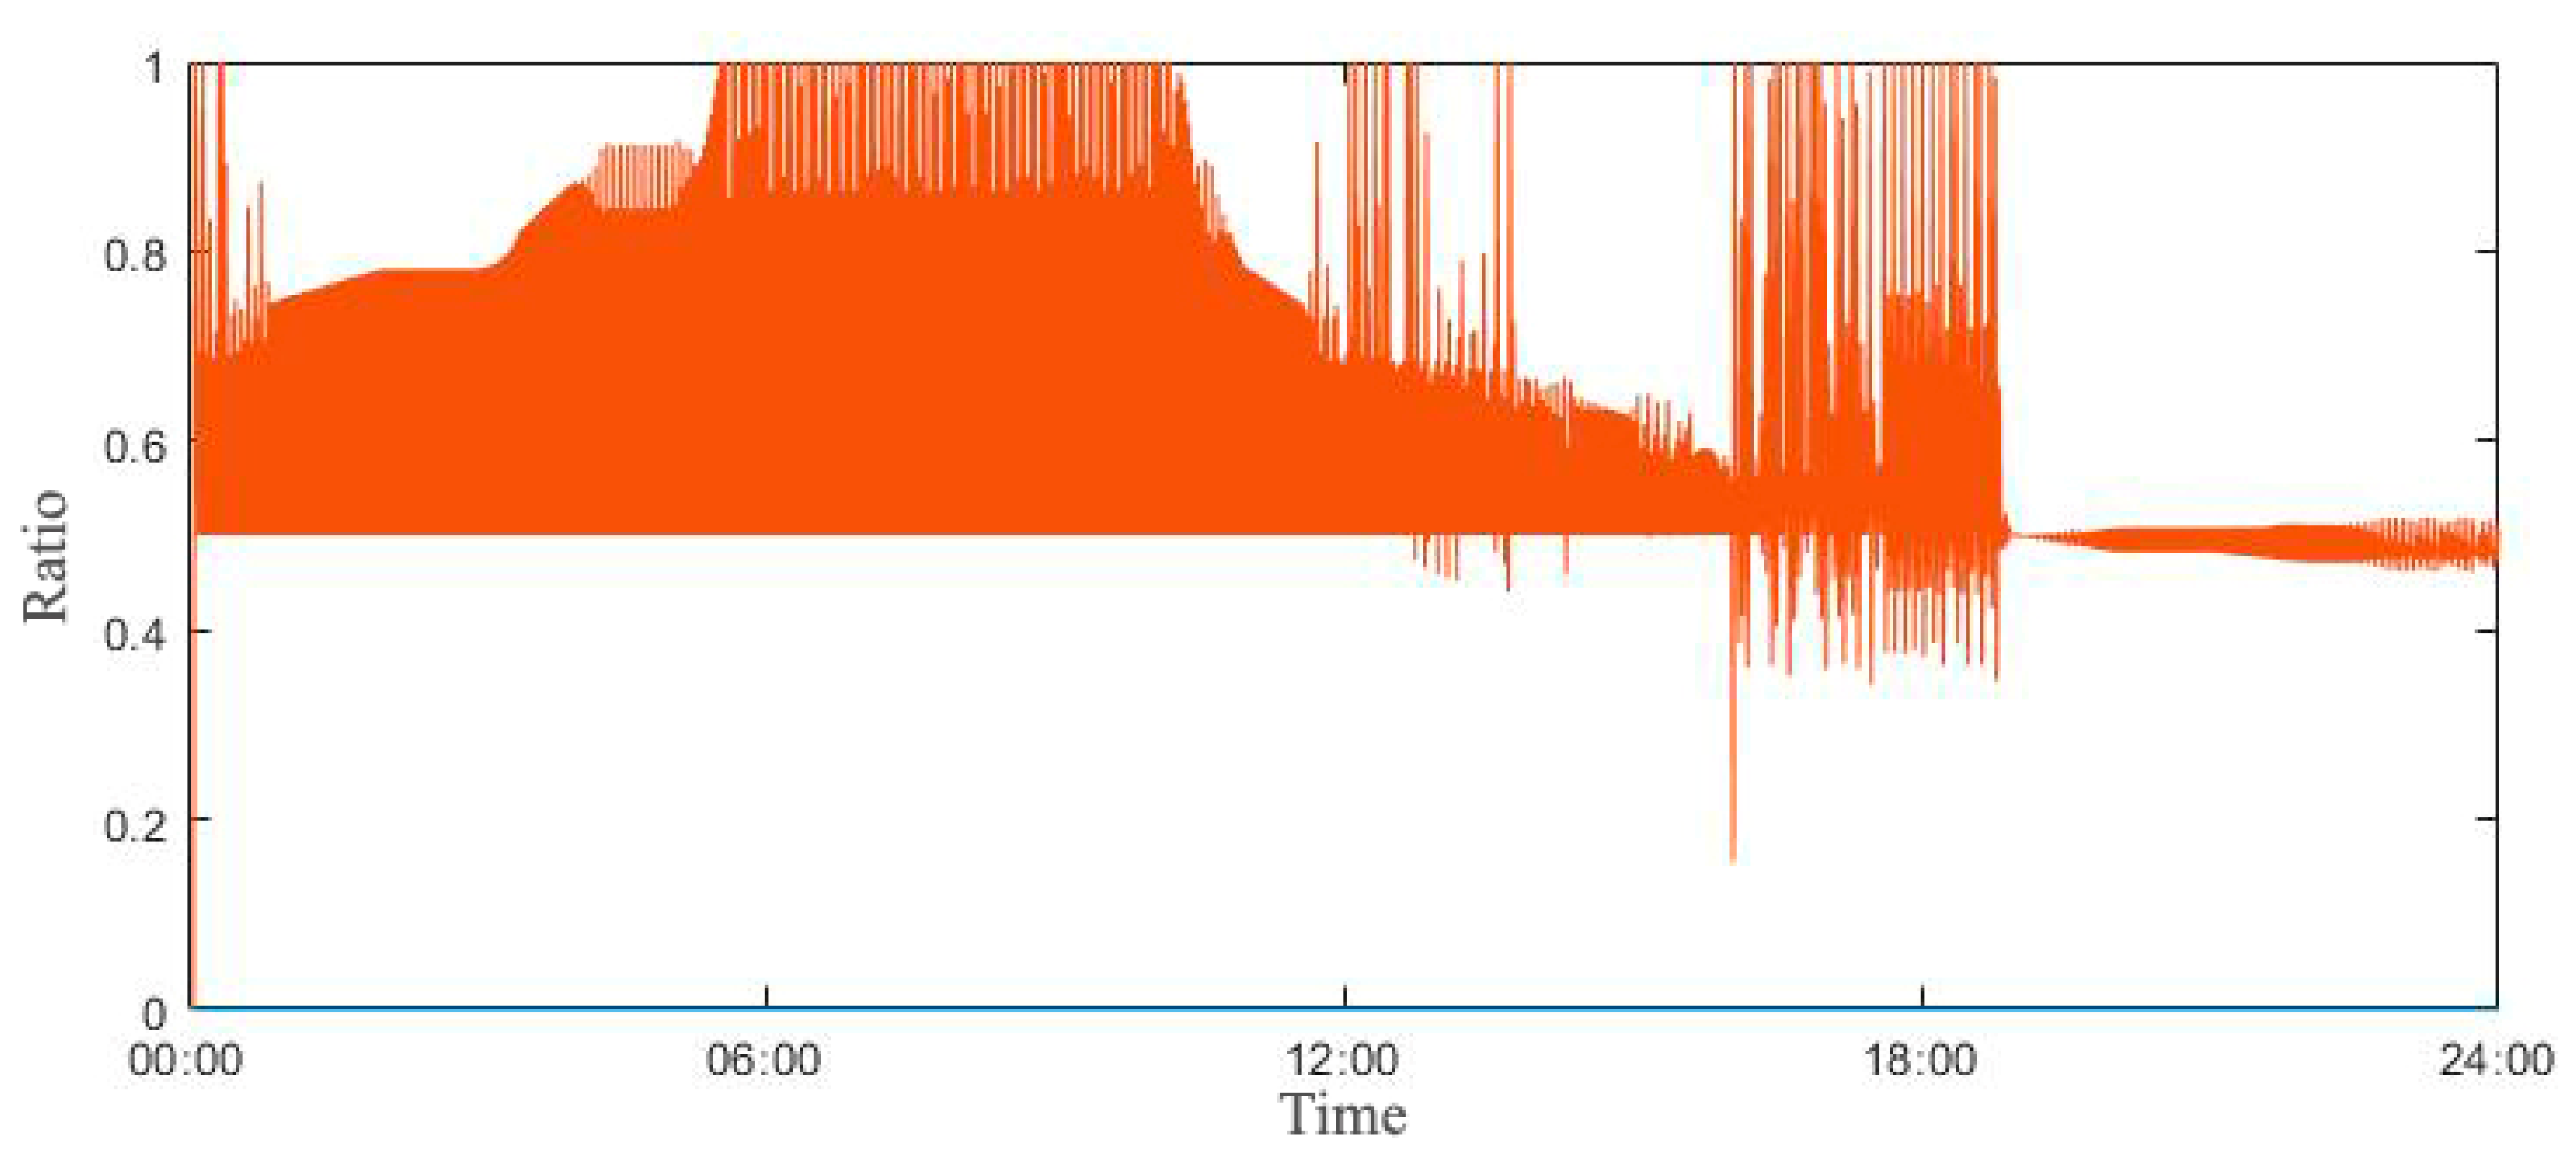
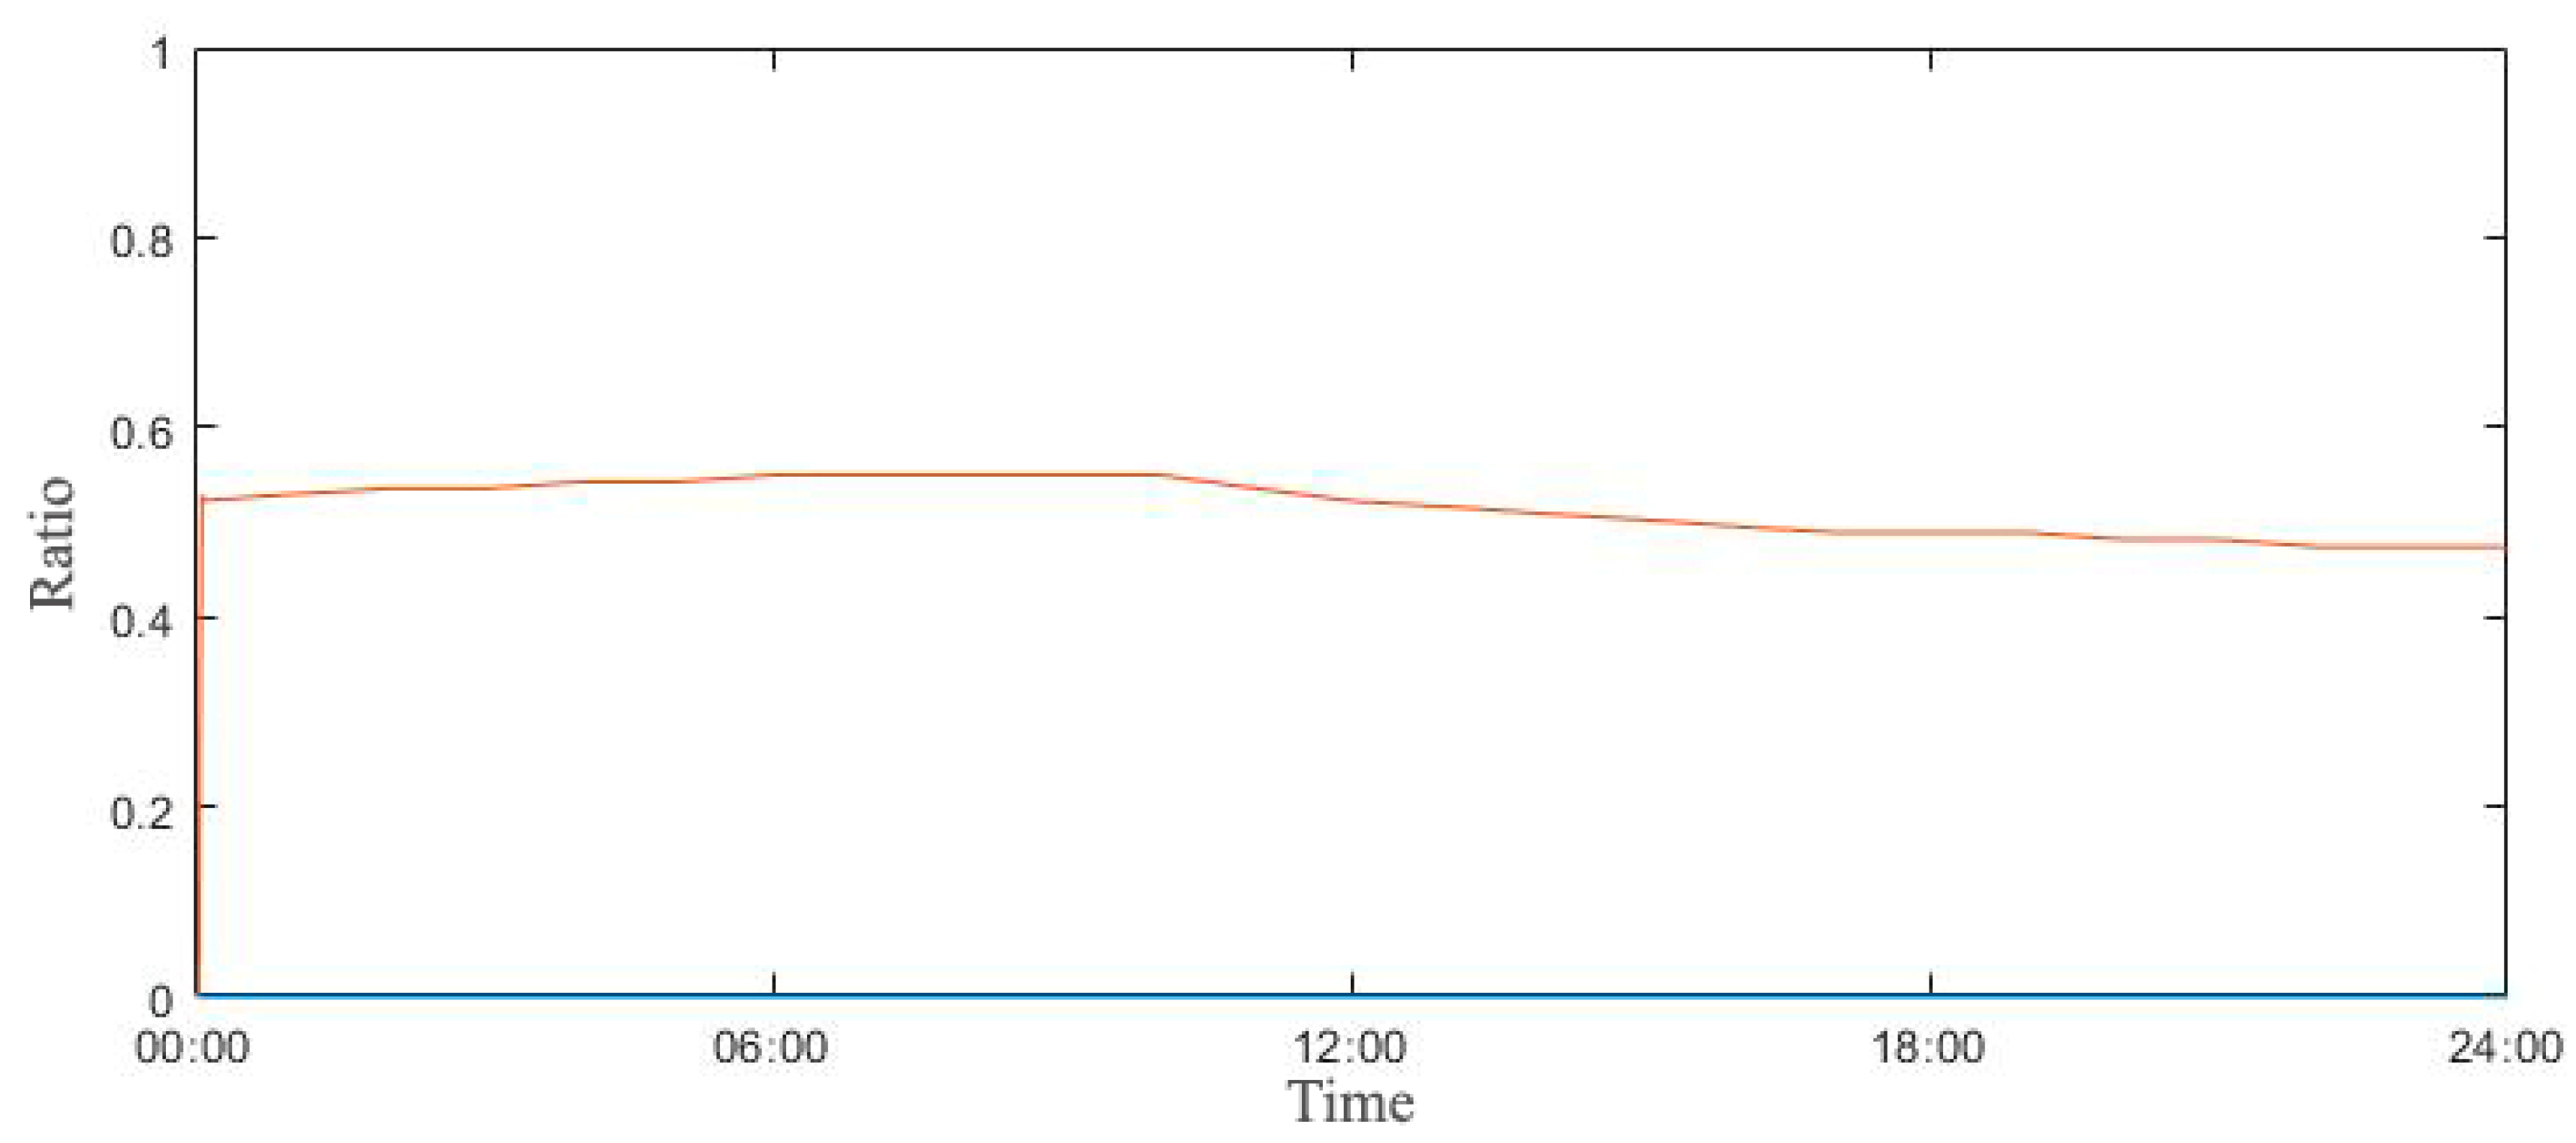
4.3. Comparison of Controlled Signals

As shown in Figure 12 and Figure 13, the heating supply air graphs for the FIS and the ANN models are almost the same as the temperature graphs, except the FIS situations where the system opens its damper less than 0.5 (50% opening) near 14:00. It can be assumed that within the FIS algorithm, the control of the amount of heating supply air is more advantageous in order to accurately match the Troom to the Tset. However, the signal for the amount of air from the FIS reached 1.0 (100% opening) ranging from 06:00 to 11:00, from 12:00 to 14:00, and from 16:00 to 19:00.
This means that at a certain point in time, the amount of heat exchange cannot be handled by the mass control to maintain Troom for Tset.
As shown in Figure 14, it can be seen that the supply air temperature from the heater exceeds 50 °C in those areas. This aspect proves that the difference in efficiency may not be greater than expected in the algorithm to reduce energy loss based on indoor thermal comfort. In the case of the ANN in Figure 15, the amount of supply air and its temperature control patterns are identified in all cases similar to changes in Troom. This data learning-based method can be applied in favor of calculating the capacity of the system for heating, since it can eliminate possible overshoots and optimize the mass and temperature controls due to heat transfer at relatively low outside temperature. Another strength of the ANN is confirmed where the outdoor temperature has been continuously dropping after 19:00. In the case of the FIS, it can be confirmed that non-continuity exists in the application of algorithm according to Tset of the thread of internal fuzzy membership function, but the ANN calculates relatively predictable signals in non-predictable situations based on the learning. These advantages confirm that ANN is a more effective model for controlling indoor environments in non-specific situations derived from the changes in users’ characteristics, climate change, or local abnormal weather conditions. On the other hand, algorithms that maintain signals as quite a constant value will result in a continuous supply of energy, so it can also be seen that its energy use is relatively less inefficient than the FIS controller.

5. Conclusions

This study tested three different controllers that reached the indoor set-point temperature quickly by controlling the amount of heating supply air and its temperature. At the same time, it investigated an adaptive model of reducing energy use within setting range by independently analyzing indoor thermal comfort or keeping the comfort level within a certain range even if energy use increases. In the viewpoint of the consistency of maintaining indoor thermal comfort level, the FIS controller was found to be 1.76% and the ANN to be 17.83%, respectively, more efficient than the conventional thermostat controller as a reference model. In addition, for the energy use efficiency, both of the FIS and the ANN controllers were found to be over 3.0% more efficient. Despite this study did not include all of variables in actual thermal systems and comfort models, it was confirmed that there were no theoretical disadvantages of combining energy supply and thermal comfort models to improve each energy efficiency.
Consequently, a network-based algorithm responding to users’ comfort levels properly worked to improve both energy efficiency and thermal comfort in simulation-based study. This reduction and improvement can be important because the energy savings can be significant in places such as commercial high-rise buildings, hospitals, and data centers where many rooms are intensively woven. In addition, the effect would be more significant if such indoor thermal conditions were a place where users’ workability and productivity could be greatly affected by their psychological state. Thus, in order to improve the validity of this simulation result, a follow-up study with lab-scaled or plug-in models need to be designed to investigate the actual performance by heating load and comfort level reflecting specific conditions by various building spaces and occupant characteristics.

Funding

This work was supported by the National Research Foundation of Korea (NRF) grant funded by the Korea government (MSIT) (No.2019R1G1A1006984).

Conflicts of Interest

The authors declare no conflict of interest.

Nomenclature

Aarea (m2)
Cvspecific heat capacity at constant volume (J/kg·K)
Cpspecific heat capacity at constant pressure (J/kg·K)
Ddepth of envelope components (m)
Edifference between set-point and room temperature (°C)
ΔEderivative of E
hconvection heat transfer coefficient (W/m2·K)
hinspecific enthalpy into room (J/kg)
houtspecific enthalpy out from room (J/kg)
IAEIntegral of Absolute Error between set-point and room temperature (no unit)
ktransmission coefficient (W/m·K)
m ˙ htmass flow-rate from heater (kg/h)
mroomairmass of air in room (kg)
Qlossheat loss by convection and transmission (J)
Qgainheat gain by convection and transmission (J)
Rthermal resistance (m·K/W)
R2fraction of variance
ttime
Thtair temperature into room (°C)
Toutoutdoor temperature
Troomroom temperature (°C)
Tsetset-point temperature (°C)
uinternal energy (J)
Wwork (J)

References

  1. Zhuang, M.; Atherton, D. Automatic tuning of optimum PID controllers. In Control Theory and Applications; IET Digital Library: Stevenage, UK, 1993; pp. 216–224. [Google Scholar]
  2. Tan, W.; Liu, J.; Fang, F.; Chen, Y. Tuning of PID controllers for boiler-turbine units. ISA Trans. 2004, 43, 571–583. [Google Scholar] [CrossRef]
  3. Braun, J.; Montgomery, K.; Chaturvedi, N. Evaluating the Performance of Building Thermal Mass Control Strategies. HVAC&R Res. 2001, 7, 403–428. [Google Scholar]
  4. Malhotra, R.; Sodhi, R. Boiler flow control using PID and fuzzy logic controller. Int. J. Comp. Sci. Eng. 2011, 1, 315–319. [Google Scholar]
  5. Groscurth, H.; Kress, K. Fuzzy data compression for energy optimization models. Energy 1998, 23, 1–9. [Google Scholar] [CrossRef]
  6. Fazzolari, M.; Alcala, R.; Nojima, Y.; Ishibuchi, H.; Herrera, F. A Review of the Application of Multiobjective Evolutionary Fuzzy Systems: Current Status and Further Directions. Fuzzy Syst. 2013, 21, 45–65. [Google Scholar] [CrossRef]
  7. Škrjanc, I.; Zupančič, B.; Furlan, B.; Krainer, A. Theoretical and experimental FUZZY modelling of building thermal dynamic response. Build. Environ. 2001, 36, 1023–1038. [Google Scholar] [CrossRef]
  8. Zhang, J.; Ou, J.; Sun, D. Study on Fuzzy Control for HVAC Systems. ASHRAE 2003, 18, 13–36. [Google Scholar] [CrossRef]
  9. Alcala, R. Fuzzy Control of HVAC Systems Optimized by Genetic Algorithms. Appl. Int. 2003, 18, 155–177. [Google Scholar]
  10. Wong, S.; Wan, K.; Lam, T. Artificial neural networks for energy analysis of office buildings with daylighting. Appl. Energy 2010, 87, 551–557. [Google Scholar] [CrossRef]
  11. Bourdeau, M.; Qiang Zhai, X.; Nefzaoui, E.; Guo, X.; Chatellier, P. Modeling and forecasting building energy consumption: A review of data-driven techniques. Sustain. Cities Soc. 2019, 48, 11533. [Google Scholar] [CrossRef]
  12. Simanic, B.; Nordquist, B.; Bagge, H.; Johansson, D. Influence of User-Related Parameters on Calculated Energy Use in Low-Energy School Buildings. Energies 2020, 13, 2985. [Google Scholar] [CrossRef]
  13. Palladio, D.; Nardi, I.; Burati, C. Artificial Neural Network for the Thermal Comfort Index Prediction: Development of a New Simplified Algorithm. Energies 2019, 12, 4187. [Google Scholar]
  14. Jung, Y. Analysis of Air Flow Distribution according to the Positions of Computer Room Air Conditioning and Perforated Plate in a Server Room of Data Center. KIEAE J. 2019, 19, 83–88. [Google Scholar] [CrossRef]
  15. Soyguder, S.; Alli, H. Predicting of fan speed for energy saving in HVAC system based on adaptive network based fuzzy inference system. Expert Syst. Appl. 2009, 36, 8631–8638. [Google Scholar] [CrossRef]
  16. Ahn, J.; Cho, S.; Chung, D. Analysis of energy and control efficiencies of fuzzy logic and artificial neural network technologies in the heating energy supply system responding to the changes of user demands. Appl. Energy 2017, 190, 222–231. [Google Scholar] [CrossRef]
  17. Moon, J.; Ahn, J. Improving sustainability of ever-changing building spaces affected by users’ fickle taste: A focus on human comfort and energy use. Energy Build. 2020, 208, 109662. [Google Scholar] [CrossRef]
  18. Singh, M.; Attia, S.; Mahapatra, S.; Teller, J. Assessment of thermal comfort in existing pre-1945 residential building stock. Energy 2016, 98, 122–134. [Google Scholar] [CrossRef]
  19. Ahn, J.; Chung, D.; Cho, S. Performance analysis of space heating smart control models for energy and control effectiveness in five different climate zones. Build. Environ. 2017, 115, 316–331. [Google Scholar] [CrossRef]
  20. Prowler, D.; Vierra, S. Space types. In Whole Building Design Guide; National Institute of Building Science: Washington, DC, USA, 2008; Available online: https://www.wbdg.org/space-types (accessed on 15 March 2018).
  21. Hussain, S.; Gabbar, H.A.; Bondarenko, D.; Musharavati, F.; Pokharel, S. Comfort-based fuzzy control optimization for energy conservation in HVAC systems. Control Eng. Pract. 2014, 32, 172–182. [Google Scholar] [CrossRef]
  22. Hamdi, M.; Lachiver, G. A Fuzzy control system based on the human sensation of thermal comfort. In Proceedings of the International Conference on Fuzzy Systems, Anchorage, AK, USA, 4–9 May 1998; pp. 487–492. [Google Scholar]
  23. Ren, Z.; Chen, D. Modelling study of the impact of thermal comfort criteria on housing energy use in Australia. Appl. Energy 2018, 210, 152–166. [Google Scholar] [CrossRef]
  24. Park, S.; Cho, S.; Ahn, J. Improving the quality of building spaces that are planned mainly on loads rather than residents: Human comfort and energy savings for warehouses. Energy Build. 2018, 178, 38–48. [Google Scholar] [CrossRef]
  25. Sung, L.; Ahn, J. Comparative Analyses of Energy Efficiency between on-Demand and Predictive Controls for Buildings’ Indoor Thermal Environment. Energies 2020, 13, 1089. [Google Scholar] [CrossRef] [Green Version]
  26. Ahn, J.; Chung, D.; Cho, S. Network-based energy supply optimal system in the condition where both heating and cooling are required simultaneously in a swing season. Intel. Build. Int. 2018, 10, 42–57. [Google Scholar] [CrossRef]
  27. Yang, S.; Wan, M.P.; Ng, B.F.; Zhang, T.; Babu, S.; Zhang, Z.; Dubey, S. A state-space thermal model incorporating humidity and thermal comfort for model predictive control in buildings. Energy Build. 2018, 170, 25–39. [Google Scholar] [CrossRef]
  28. Lauster, M.; Teichmann, J.; Fuchs, M.; Streblow, R.; Mueller, D. Low order thermal network models for dynamic simulations of buildings on city district scale. Build. Environ. 2014, 73, 223–231. [Google Scholar] [CrossRef]
  29. Bakhtiari, H.; Akander, J.; Cehlin, M.; Hayati, A. On the Performance of Night Ventilation in a Historic Office Building in Nordic Climate. Energies 2020, 13, 4159. [Google Scholar] [CrossRef]
  30. Ahn, J.; Cho, S. Anti-logic or common sense that can hinder machine’s energy performance: Energy and comfort control models based on artificial intelligence responding to abnormal indoor environments. Appl. Energy 2017, 204, 117–130. [Google Scholar] [CrossRef]
  31. Lee, S.; Joe, J.; Karava, P.; Bilionis, I.; Tzempelikos, A. Implementation of a self-tuned HVAC controller to satisfy occupant thermal preferences and optimize energy use. Energy Build. 2019, 194, 301–316. [Google Scholar] [CrossRef]
  32. Engineering Toolbox. Recommended Indoor Temperatures Summer and Winter. Available online: http://www.engineeringtoolbox.com (accessed on 11 November 2016).
  33. ASHRAE. Thermal Environmental Conditions for Human Occupancy; ASHRAE Standard 55-2004; ASHRAE: Atlanta, GA, USA, 2004. [Google Scholar]
  34. Bergman, T.; Incropera, F.P.; DeWitt, D.P.; Lavine, A.S. Fundamentals of Heat and Mass Transfer; John Wiley & Sons: New York, NY, USA, 2018; ISBN ES8-1-119-32042-5. [Google Scholar]
  35. Petković, D.; Ćojbašić, Ž.; Nikolić, V.; Shamshirband, S.; Kiah, M.L.M.; Anuar, N.B.; Wahab, A.W.A. Adaptive neuro-fuzzy maximal power extraction of wind turbine with continuously variable transmission. Energy 2014, 64, 868–874. [Google Scholar] [CrossRef]
  36. Braspenning, P.; Thuijsman, F.; Weijters, A. Artificial Neural Networks; Springer: Berlin/Heidelberg, Germany, 1995; ISBN 978-3-540-59488-8. [Google Scholar]
  37. O’Reilly. Introduction to Artificial Neural Networks; O’Reilly: Newton, MA, USA, 2020; Chapter 1; Available online: https://www.oreilly.com (accessed on 8 May 2020).
Figure 1. Simulation block model.
Sustainability 12 08515 g001
Figure 2. Outside temperature of NYC on 23rd January.
Sustainability 12 08515 g002
Figure 3. Room temperature controlled by the thermostat controller.
Sustainability 12 08515 g003
Figure 4. Room temperature controlled by the FIS controller.
Sustainability 12 08515 g004
Figure 5. Room temperature controlled by the ANN controller.
Sustainability 12 08515 g005
Figure 6. Changes of heating gain controlled by the thermostat controller.
Sustainability 12 08515 g006
Figure 7. Changes of heating gain controlled by the FIS controller.
Sustainability 12 08515 g007
Figure 8. Changes of heating gain controlled by the ANN controller.
Sustainability 12 08515 g008
Figure 9. Changes of PMV controlled by the thermostat controller.
Sustainability 12 08515 g009
Figure 10. Changes of PMV controlled by the FIS controller.
Sustainability 12 08515 g010
Figure 11. Changes of PMV controlled by the ANN controller.
Sustainability 12 08515 g011
Figure 12. Signals for the amount of air by the FIS controller.
Sustainability 12 08515 g012
Figure 13. Signals for the amount of air by the ANN controller.
Sustainability 12 08515 g013
Figure 14. Signals for the temperature of air by the FIS controller.
Sustainability 12 08515 g014
Figure 15. Signals for the temperature of air by the ANN controller.
Sustainability 12 08515 g015
Table 1. Design parameters.
GeometryUnitValue
RoomWidth × Depth × Heightm23.80 × 23.80 × 3.65
WallAream2347.48
Depthm0.2
Thermal Resistancehour∙°C/J1.60 × 10−6
WindowAream26.00
Depthm0.01
Thermal Resistancehour∙°C/J5.94 × 10−7
Table 2. Comparison of standard deviations of daily thermal comfort by controllers.
ControllerStandard Deviation of the Daily PMV ValuesEfficiency (%)
Thermostat1.29-
FIS1.27−1.76
ANN1.06−17.83
Table 3. Comparison of daily energy transfer by controllers.
ControllerDaily Energy Transfer (MJ)Efficiency (%)
Thermostat7.15-
FIS6.92−3.30
ANN6.93−3.10
Publisher’s Note: MDPI stays neutral with regard to jurisdictional claims in published maps and institutional affiliations.

