Article

Effect of B Corp Certification on Short-Term Growth: European Evidence

by
Valerie Paelman
,
Philippe Van Cauwenberge
* and
Heidi Vander Bauwhede
Department of Accounting, Corporate Finance and Taxation, Faculty of Economics and Business Administration, Ghent University, Sint-Pietersplein 7, 9000 Ghent, Belgium
*
Author to whom correspondence should be addressed.
Sustainability 2020, 12(20), 8459; https://doi.org/10.3390/su12208459
Submission received: 16 September 2020 / Revised: 7 October 2020 / Accepted: 12 October 2020 / Published: 14 October 2020

Abstract

:
This paper investigates the effect of sustainability certification on the short-term growth rates of socially responsible companies. A changing business environment in which stakeholders became more sensitive to the sustainability practices of companies induced a growing popularity of hybrid firms, which use market-based approaches to pursue environmental and social goals. However, stakeholders do not take unsubstantiated claims about companies’ sustainability efforts for granted, creating a potential economic role for independent certification organizations. In addition, the internal processes brought about by the external verification procedure could turn the social mission, which is often creating tension with financial goals, into a strategic advantage. B Lab is one such well-known and rapidly growing organization, granting so-called B Corp certificates across many countries around the world. This paper contributes to the hybrid firm literature by ascertaining the benefit of certification as measured by firm growth. Using a panel dataset of financial data of European firms that obtained B Corp certification between 2012 and 2018 and a quasi-experimental difference-in-difference research design, this paper empirically shows that B Corp certification positively impacts the turnover growth rates one year pre versus one year post certification. No significant effects on employee growth rates or total asset growth rates are found.

1. Introduction

This paper examines whether B Corp certification affects the short-term growth rates of socially responsible firms. The growing attention to the Corporate Social Responsibility (CSR) practices of companies over the past years [1] has been matched with an increase in the occurrence of so-called hybrid enterprises, which pursue, next to financial goals, also social and environmental outcomes [2]. One of the challenges that hybrid companies face is to establish to the outside world their category membership, especially since the existence of the class of hybrid companies is relatively new and the duality of goals might create confusion and disbelief among external stakeholders [3]. External verification of a company’s sustainability practices lends credence to the efforts that companies claim to make, establishes external legitimacy and can even help a company gain media exposure on its responsible business practices [4,5]. However, also internally, hybrid companies are known to experience conflicts between competing logics because of the goal duality [6,7]. Because of the internal audit and streamlining efforts that external verification implies for an organization, verification can contribute to internal harmony and the creation of a common organizational identity. In conclusion, external verification might be of strategic importance for hybrid companies [3].
One such provider of external certification is B Lab, an independent non-profit organization granting so-called B Corp certificates to the growing group of companies, which uses market-based approaches to pursue social and environmental missions [8]. The certification process and requirements are accustomed to the size and structure of the certifying company, making it suitable for large as well as small and medium sized enterprises, which partly might explain the rapid expansion of the B Corp certificate.
Using firm-level panel data from the financial reports of European firms that obtained B Corp certification between 2012 and 2018, this paper empirically assesses whether B Corp certification was beneficial for companies, as measured by the effect on their short-term growth. We employed a difference-in-difference approach to evaluate the causal effect of certification on several dimensions of firm growth. We observed firms’ growth rates from one year prior to certification to one year post certification and conduct both a univariate and a multivariate analysis. In the latter, we regress growth rates on a certification dummy, together with a set of control variables. We account for changes over time by including a control group in the analysis. The difference-in-difference method allows to eliminate on the one hand biases arising from time trends which are unrelated to the treatment, i.e., obtaining B Corp certification, and, on the other hand, permanent differences in characteristics between the treated and the control firms [9]. To mitigate the effects of self-selection bias, our control group is composed of firms that obtained certification one year after the treatment firms, rather than of firms that never achieved certification. This approach follows Parker, Gamble, Moroz and Branzei [10], who argue that certification is a lengthy process where the exact date of certification is random, causing the difference in properties that determine certification to be non-systematic between the treatment and the control group. Both the univariate and the regression analysis suggest that firms which attain certification experience higher turnover growth rates compared to firms of the control group over the same period. No significant effects on short-term employment growth or total asset growth were found.
This study contributes to the literature in several ways. First, on a general level, there is limited insight into the characteristics that make some hybrid companies more successful than others [11,12]. Because of the goal duality in hybrid companies, other characteristics may be relevant than for traditional companies. By studying the effect of B Corp certification, we hope to advance the knowledge in this area. Second, given that the average firm in our sample accords to the criteria of a small and medium sized enterprise (SME), as defined by the European Commission [13], our findings pertain to this understudied group of companies in the context of CSR. Transparency on CSR engagements is more challenging for SMEs, while the aggregate impact on the global economy of SMEs’ efforts to conduct good CSR practices is potentially large [14]. Third, despite the exponential growth of the B Corp community worldwide and the increasing popularity of business forms with hybrid missions, little scholarly attention has been paid to Certified B Corps. This pertains especially to companies outside the US. To our knowledge, European B Corps have thus far completely been ignored. In addition, the few studies that do empirically investigate the economic performance of B Corps are limited by data restrictions [10,15,16]. The Orbis database we used contains detailed financial information on European firms, both large listed and smaller unlisted firms, allowing us to calculate exact measures for company growth as well as for the control variables in the regression. Methodologically, our difference-in-difference approach combined with the selection of control companies that only differ in terms of timing with respect to B Lab certification from our treatment group allows us to handle both random changes that occurred over time, unrelated to B Lab certification and to handle concerns over endogeneity of certification.
The remainder of this paper is structured as follows. In Section 2, we describe the background of B Corp certification, provide an overview of the academic literature on B Corps and hybrid companies in general and present our hypothesis. We describe the applied methodology and data collection process in Section 3. Our empirical results are presented and discussed in Section 4. The last section concludes.

2. Background, Literature Review and Hypothesis Development

2.1. Certified B Corps

B Corp certificates are issued by the independent non-profit organization B Lab, which was founded in the US in 2006. This organization’s goals are fourfold:
(a) building a community of Certified B Corporations; (b) promoting legislation creating a new corporate form that meets higher standards of purpose, accountability, and transparency; (c) accelerating the growth of “impact investing” through the use of B Lab’s impact investment rating system; and (d) galvanizing support for the movement by sharing the stories of Certified B Corporations.
[17] (p. 3)
B Corps are for-profit companies that integrate societal and environmental goals in their business model and strategies. In order to be eligible for B Corp certification, a firm must first conduct a B Impact Assessment (BIA), a self-test measuring the impact on workers, customers, society and the environment. More precisely, the BIA generates a B Impact Report covering the following aspects: Governance (Mission and Engagement; Ethics and Transparency), Workers (Financial Security, Health, Wellness and Safety, Career Development, Engagement and Satisfaction), Environment (Environmental Management, Air and Climate, Water, Land and Life) and finally Customers (Customer Stewardship) [18].
If the minimum threshold BIA score of 80 on 200 is reached, B Lab conducts a rigorous audit procedure to verify this score. If this verification is successful, a company can achieve the B Corp certification by signing an agreement and paying a yearly fee to B Lab which is based on the annual sales level. Currently the fee ranges from $1000 to $50,000 [19]. The agreement states that B Corps are legally required to consider their impact on all stakeholders. Such legal requirement can be met by amending the company’s governing documents or taking on the benefit corporation legal status [20]. The certificate implies that companies adhere to rigorous transparency and accountability requirements and become part of a global network of corporations. Certification is valid for three years. At the end of this period a firm has to retake the BIA. In addition, B Lab conducts randomly chosen in-depth site reviews with 10% of its certified B Corps per year [20].
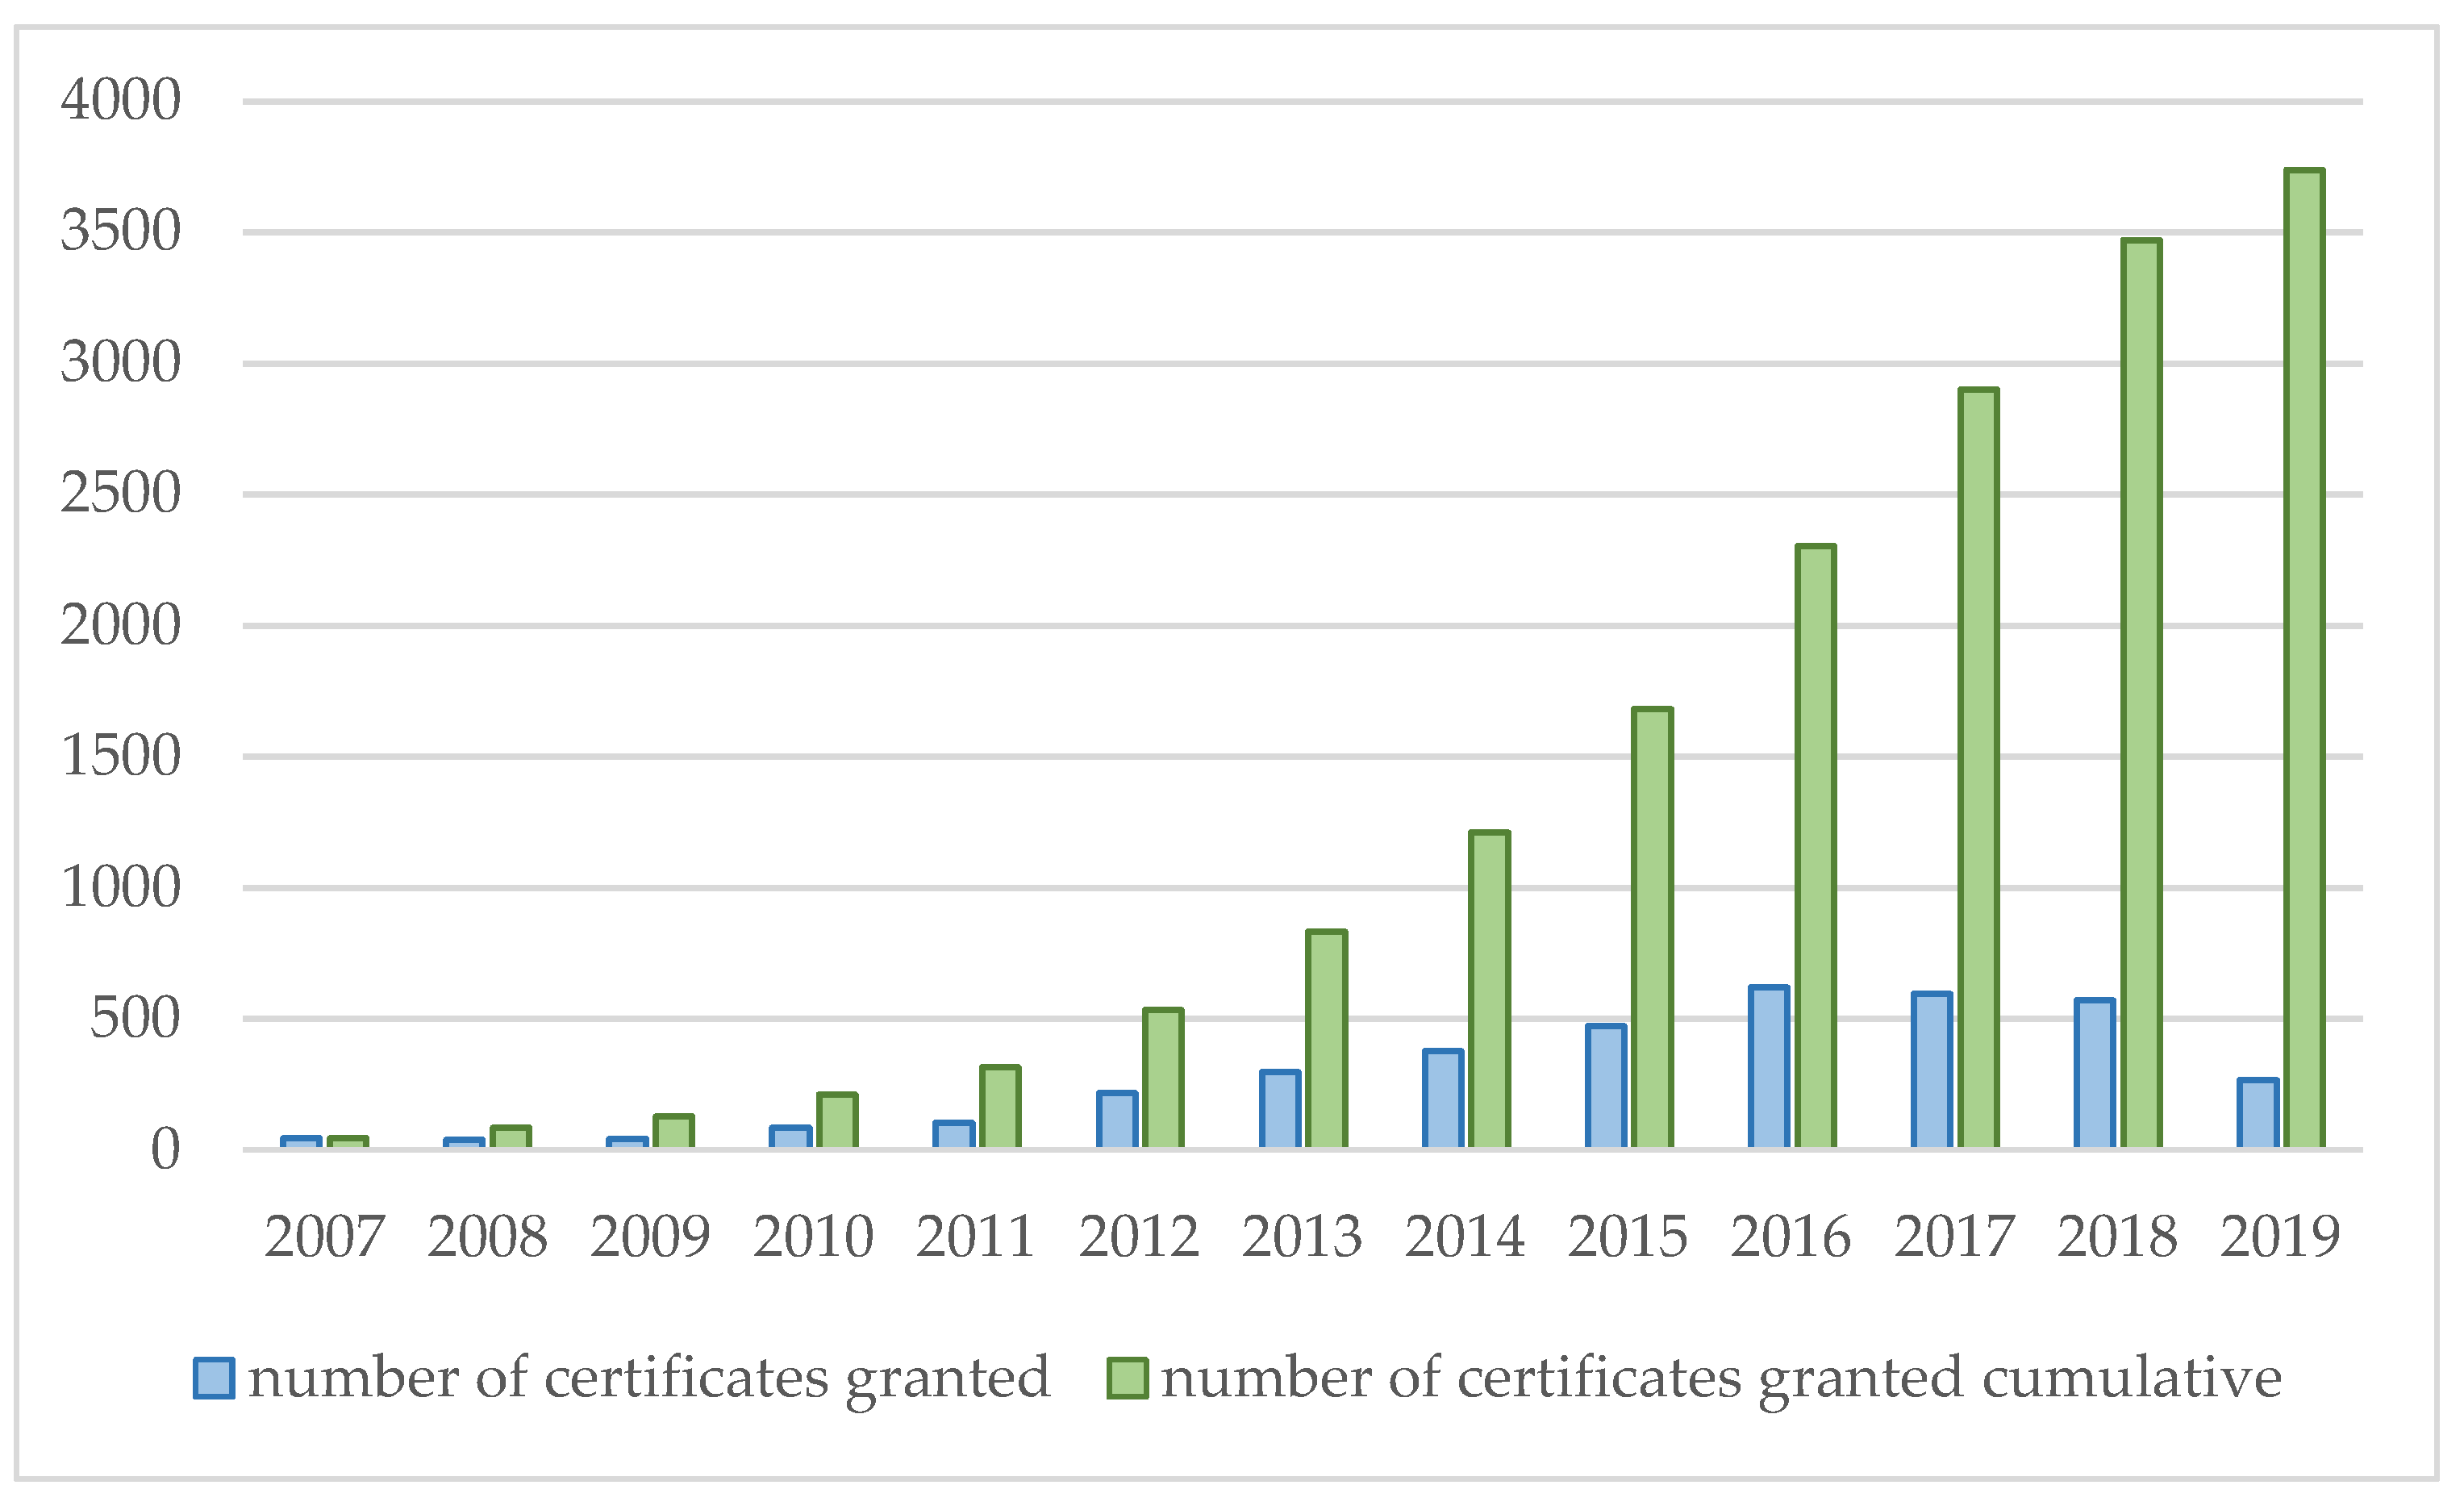
In the first year after the foundation of B Lab in the US in 2006, 82 certificates were granted. In the meantime, a geographical expansion occurred with regional B Labs currently operating in more than 50 countries and more than 3500 companies certified to date [21]. Figure 1 provides an overview of the yearly number of certificates that were granted to new B Corps worldwide. Table 1 and Table 2 portray the geographical and sectoral distribution of the B Corps existing in 2019.
B Corps are distinct from Benefit Corporations, a company concept which refers to a specific legal structure that exists in several states in the US for companies with societal or environmental goals. A European counterpart of this legal structure is the Societa Benefit in Italy [22]. Various B Corps have a legal structure which is adapted to their hybrid form and vice versa, however, these are not prerequisites for each other.
The BIA and B Corp certification are not the only impact measurement system and CSR related standard. Some well-known alternative impact measurement systems are the GRI and IRIS+. A common characteristic is the provision comparable information which supports benchmarking. There are however also some differences. While the GRI guidelines mainly focus on standardized reporting of non-financial information by companies [23], the BIA focuses on the actual performance of companies and provides a B Impact Report with scores in several domains. Also, while the IRIS+ system is mainly aimed at investors [24], the BIA targets all stakeholders. With regard to CSR related standards, alternatives to B Corp certification are for example ISO 14001:2015, ISO 26000:2020, SA 8000:2014. Like SA 8000, B Corp certification is a proprietary scheme developed by a group of independent experts in business and academia, i.e., the Standards Advisory Council (SAC) [25,26]. In contrast to ISO 26000 [27], B Corp requirements are certifiable, meaning that the implementation of a standard’s requirements can be audited and certified by an independent external entity (i.e., the certification body) [28]. Besides, the BIA covers the three sustainable development dimensions (economic, social and environmental), while ISO 14001 and SA 8000 mainly focus on environmental and social aspects, respectively [26,29].

2.2. Literature Review and Hypothesis Development

The pursuit of a mix of financial and social goals is not exclusively the domain of hybrid firm as also more traditional companies may envisage social outcomes. Numerous studies have explored the financial consequences of CSR activities of traditional companies [30,31,32]. Margolis and Walsh [30] reviewed 127 empirical studies, almost half of which documented a positive association between social and financial performance. Only seven studies found a negative relationship. A meta-analysis of Orlitzky et al. [31], came to the same conclusion. While the two previous papers considered empirical studies on large listed companies, Fonseca and Ferro [32], surveyed Portuguese SMEs and reached similar conclusions.
While the empirical evidence for traditional enterprises seems to suggest a positive relation between social and financial performance (it pays to be good), hybrid companies are often believed to suffer from tensions because of their duality of financial and social purposes [7]. Hybrid companies are considered as “sites of contradiction, contestation and conflict” [33] (p. 425). The literature typically assumes that social and economic objectives exist at either end of a continuum with hybrid companies operating somewhere in the middle. Hybrid enterprises risk drifting away from their social mission when financial objectives are in danger [34]. A potential solution to this tension and danger of mission drift is the conception of the social mission as a strategic advantage. This would mean that the social mission is not considered in a trade-off with the financial performance but rather is used as an impetus to improve the competitive position, to hire, motivate and retain employees, to assure finance and develop strategic alliances with other organizations [34,35]. Chauhan and O’Neill [3] argue that external verification of the social mission could be instrumental in turning the social mission into a strategic advantage. In their survey of B Corps, they find that the reported motives to obtain certification are manifold ranging from cognitive changes and increased awareness among the founders and managers, over increased promotional opportunities vis-à-vis clients and suppliers, clearer communication of corporate identity and strategy to stakeholders, improved perception and motivation of employees to more clear and credible profiling to investors and creditors.
Various academics have explored the characteristics of companies that pursue B Corp certification and their motivation to do so [17,36,37,38,39,40]. As concerns the motivation to pursue certification, Gehman, Grimes and Cao [41] and Stubbs [2] consider the B Corp model as a tool for change, which provides collective identity for internal and external validation by serving as a visual classification for the type of company that they are. This stamp lends credibility towards stakeholders and provides the opportunity to network with like-minded businesses [2]. This form of certification would positively affect accountability and corporate governance [42] and the BIA tool is used to integrate sustainability into the day-to-day decision-making [43]. Harjoto et al. [37] conclude that B Corp certification is a way of companies to respond to high competition. Alonso-Martínez, De Marchi and Di Maria [44] investigate which formal and informal institutions affect the BIA scores of European B Corps. Their results show that market pressure from demanding and conscious consumers as well as high technological and innovation capacities, are positively associated with BIA scores, while regulatory pressure has an adverse effect. The latter indicates that institutional voids offer the opportunity to surpass local standards as a differentiation strategy. As concerns the characteristics of the companies that pursue B Corp certification, Harjoto et al. [37] and Grimes et al. [36] find that woman-owned businesses are not only more likely to qualify for certification given their high scores on the BIA, but are also more likely to actually pursue certification. Furthermore, a large share of both American and European certified B Corps is active in the services and manufacturing industry [17,39,40]. While companies in the services industry generally excel in terms of progressive business models, those in the manufacturing industry appear to focus rather on process innovations. Regional differences also have been examined. López-Navarro et al. [40] conclude that B Corps are geographically clustered within each country around the country partner, being the B Corp that bears the responsibility of promoting the B Corp movement. Hickman et al. [38] and Harjoto et al. [37] find that US states with highly educated people, which exhibit liberal or progressive attitudes, show a higher number of B Corps per capita.
Besides studies on the motivation for and characteristics of companies that pursue certification, some studies examine the effect of geographical and sectoral contexts on the promotion and communication strategies regarding B Corp membership [8,17]. Cao et al. [12] stipulate different promotion strategies for B Corps, given the prevalence of B Corp peers within the same geographical area or industry. Such strategies might help companies to stand out or fit in, by showing the distinctiveness or legitimacy of their practices, respectively. Building on the idea that category promotion helps companies stand out while category membership helps companies to fit in, Gehman and Grimes [8] empirically assess the effect of regional and industrial contextual distinctiveness on the promotion of B Corp membership on companies’ websites. Their findings suggest that in situations where B Corps can clearly distinguish themselves from competitors or geographically proximate companies by being part of a sustainable community, they tend to promote their B Corp membership more strongly. Besides, the number of peers (other B Corps) present in the same state or industry amplifies these effects.
For hybrid companies, financial health is no less important to guarantee firm survival and success than for other companies. Consequently, some studies have investigated the financial characteristics of B Corps, such as growth rates and access to finance. To date, the majority of these studies focus on North American companies [10,16] and the evidence is mixed.
By becoming a B Corp, a company can gain media exposure on its responsible business practices and become part of a global network [5]. Given that the certification process is time and cost intensive, certification lends credence to a company’s commitment to sustainability practices [45]. According to Stubbs [46], B Corp certification can help to integrate social and economic opportunities in the marketing strategy. This type of certification could enhance consumers’ motivation to purchase from socially responsible companies [4]. This way, B Corp certification could positively affect turnover. Chen and Kelly [15] compared the financial performance of B Corps and their publicly listed and small private competitors. Their findings show that B Corps outperform their public competitors with regard to revenue growth rates. No significant differences with small private firms were found. Romi et al. [16] conduct a similar analysis, however, using more extensive matching criteria and report that B Corps experience higher sales growth than their non-B peers. These findings imply that these hybrid organizations have a strategic advantage in generating sales. An analysis within the sample of B Corps indicated that excellent employee and consumer scores on the BIA are associated with higher employee productivity and sales growth, respectively. Hence, additional investments in these domains are financially rewarding. These empirical findings corroborate on what would be expected from the Stakeholder Theory [47] and the Resource-Based Theory [48]. The former theory states that business success depends on collaboration with multiple stakeholders, hence, hybrid companies that better manage a broad set of stakeholders could benefit superior firm performance [49]. The latter theory states that firms’ competitive advantages depend on internal and external tangible, intangible and personnel-based resources. By engaging in proactive CSR, companies can generate new competitive resources [50]. Parker et al. [10] on the other hand document that B Corps experience a negative effect on the revenue growth rate in the year post certification. They argue that positive effects are potentially only noticeable in the longer term, given that the process of signaling B Corp membership to external stakeholders takes some time. Internal disruptions owing to the certification process, however, could have an immediate negative influence on turnover. More specifically, the rigorous third-party audit and certification might shift managerial attention away from the normal course of business, causing management to spend less time on generating sales.
Furthermore, for other growth measures than sales, potential effects of B Corp certification are conceivable. For instance, B Corp certification might change the position of a hybrid company on the job market, affecting employee growth rates. This change in employee growth can be supply or demand-driven. As concerns the supply side, B Lab certification demonstrates a company’s commitment to create a healthy and engaging working environment [51]. Besides, certification shows a sense of purpose of companies which can be used in recruitment practices [46], especially appealing in job markets where purposeful jobs are more aspired. According to the social identity theory, job seekers compare and classify potential employers, and attempt to imagine working at companies they identify with [52]. By comparing B Corps with traditional firms, potential candidates might identify more strongly with the former. Furthermore, B Lab launched a job platform dedicated to vacancies of B Corps [53]. Hence, it might be easier this way for B Corps to find talented employees [5]. From the demand side, companies might experience a need for additional workforce to comply with B Corp standards and make improvements on the BIA [46] without losing sight of the regular course of business [10].
Finally, B Corp certification might help a company scale up, by facilitating access to finance [54]. The majority of B Corps are small businesses, and the asset growth of these small firms is often constrained by internal financing mechanisms. Firms that make use of external finance have asset growth rates which are much higher than what could be supported by solely internal finance [55,56]. Choi and Gray [57] argue that socially responsible companies are especially selective about their financing sources, since traditional investors could impede the ability to reach non-financial goals. Likewise, Siqueira, Guenster Vanacker, and Crucke [58] conclude that Belgian so-called Social Purpose Companies, companies with a legal structure for for-profit social enterprises, display lower leverage ratios than commercial companies. B Corp certification could mitigate information asymmetry and agency costs, reducing capital constraints [59] and attract socially responsible investors [17], which could allow companies to scale up.
In sum, our analysis of the financial consequences of B Corp certification indicates that B Corp certification might have consequences for (short-term) firm growth of sales, employees and assets. However, whether the effect will be positive or negative remains an empirical question. We therefore posit the following hypothesis:
Hypothesis (H1).
Ceteris paribus, B Corp Certification has an effect on the short-term growth rate of firms.

3. Materials and Methods

3.1. Methodology

To verify our hypothesis, we use a difference-in-difference (DiD) design. A DiD design allows to empirically verify the effect of a treatment on an outcome variable by comparing the evolution over time with that of a control group. This setup eliminates biases arising from time trends which are unrelated to the treatment and permanent differences in characteristics between the observed treated and control firms [9]. A fundamental condition for a DiD design to provide an unbiased estimate of the treatment effect is the random allocation of firms between the treatment and control groups [60]. Applied to our research question, this would imply that the treatment and control groups display parallel trends in the growth rates ignoring the effect of certification. Following Parker et al. [10], we use as control group the firms that receive certification one year later than the firms in the treatment group. The motivation is as follows: The process of B Lab certification is long and the exact timing of the decision, i.e., the certification date, is to a certain extent random. In other words, firms that initiate the B Corp certification process simultaneously, might just as well obtain certification in a different year. Consequently, companies that receive certification in any given year versus companies that receive certification in the year ensuing can be considered ex ante as comparable with respect to their properties that determine certification but for the random moment at which they receive the treatment.
From Data.World [61], we obtained a list, provided by B Lab, of European firms that obtained B Corp certification since 2012, the first year that B Corp certificates were granted to European companies, until 2018, the last year for with financial data were available on Orbis at the moment of data collection. We labeled the treatment year, i.e., the year in which the treatment group obtained certification, τ. We conducted our analysis on the certifications granted over the period 2012–2017, i.e., τ = 2012, …, 2017. The last year 2018 serves to compose our last control group, i.e., controls for the certifications granted in 2017.
First, we performed a univariate analysis. We started by computing for each firm in the treatment and control group the change in growth rate as the difference of the growth rate one year after (year τ + 1) and the growth rate one year before (year τ − 1) the treatment year. Next, we computed the average change in growth rate for the treatment and control group and compared those averages, i.e., we evaluated the statistical significance of the following term:
D i D = ( G r o w t h τ + 1 T r e a t e d G r o w t h τ 1 T r e a t e d )   ( G r o w t h τ + 1 C o n t r o l G r o w t h τ 1 C o n t r o l )
Afterwards, we performed a multivariate panel data regression analysis, where we regressed growth on a dummy variable, indicating certification together with a set of control variables as they typically appear in the growth literature, e.g., [62,63,64]. In particular, we estimated the following regression equation:
G r o w t h i t = β i + β t + β 1 C e r t i f i e d i t 1 + β 2 ln ( S i z e ) i t 1 + β 3 ( ln ( S i z e ) i t 1 ) 2 + β 4 ln ( A g e ) i t 1 + β 5 ( ln ( A g e ) i t 1 ) 2 + β 6 [ ln ( S i z e ) i t 1 × ln ( A g e ) i t 1 ] + β 7 L e v e r a g e i t 1 + ε i t
Firm and time fixed-effects were included to control for time-invariant firm characteristics and to capture yearly specific aspects, respectively.
Since firm growth has multiple dimensions, which are not necessarily correlated [65], we employed several growth measures. In line with prior research [62,66], we used growth of turnover, employment as well as assets, and calculated growth rates as:
G r o w t h i t = ln ( S i z e i t ) ln ( S i z e i t 1 )
where Size represents turnover, the number of employees or total assets, respectively.
The difference-in-difference term Certifiedit−1 is our variable of interest in the regression analysis and takes 1 for treated firms in the post-treatment year. More specifically, it is measured as follows:
C e r t i f i e d i t 1 = [ T r e a t m e n t   τ × P o s t   τ ]
With τ taking on the values 2012, 2013,…, 2017. For each year τ, a pre-treatment year (t = τ − 1) and a post-treatment year (t = τ + 1) are taken into consideration, with each τ having its own treatment and control group.
[Treatment τ × Post τ] is an interaction term based on the binary variables Treatment τ and Post τ, where Treatment τ is 1 when firm i received the treatment in year τ and 0 if the firm serves as a control firm, obtaining its certification in year τ + 1. Post τ takes on the value 1 for post-treatment years τ + 1 and 0 for pre-treatment years τ − 1. As discussed above, B Corp certification can have either a positive or negative effect on firm growth. Therefore, we do not predict a sign for the coefficient of Certifiedit−1. Since time and firm fixed effects are included in the regression model, the variables Treatment τ and Post τ are not included separately in the regression equation.
We include various firm-specific control variables. Firstly, the natural logarithm of Size, lagged by one year is included in the regression equation. Depending on the adopted growth measure, Size is represented by turnover, the number of employees or total assets, respectively. Various studies documented a negative effect between size and firm growth, [55,62,63]. These empirical studies contradict Gibrat’s Law of Proportionate Effect, according to which, in a given industry, growth rates are independent of size. Secondly, the natural logarithm of Age, lagged by one year, whereby Age is calculated as the year under study minus the year of incorporation plus one. The relation between a firm’s age and growth has also been empirically examined, with contradictory findings. Evans [63], amongst others, examined the association between age and firm growth and found a negative relationship. This finding is consistent with Jovanovic’s [67] “learning model”, which states that firms learn about their efficiency once they are operating, providing young firms with more opportunities to tackle inefficiencies. Other studies show a positive relationship between firm age and growth [64,68] which can be explained by customer awareness and firm reputation that strengthen over time. To account for the non-linear relationships between size, age and growth which have been demonstrated in preceding studies, quadratic terms of size and age ((ln(Size)it−1)2 and (ln(Age)it−1)2) and an interaction term (ln(Size)it−1) × (ln(Age)it−1) are included in the model [62,63]. Finally, the lagged value of Leverage, measured as total debt divided by total assets, is included in the analysis. Positive as well as negative effects of debt ratios on firm growth are possible. On the one hand, higher amounts of debt might be associated with faster growth because of the increased ability to invest [69]. On the other hand, high debt levels could constrain additional financing [70].

3.2. Sample Selection and Data Collection

Given that the first European B Corps certified in 2012, the certification years 2012 up to 2017 are observed in this study as treatment years τ. Given the definition of our control group, European firms that certified from 2012 to 2018 are included in our analysis. Companies certified in 2012 solely serve as treatment group, while companies certified in 2018 solely serve as control group. Firms that certified in between those years, can serve as both treatment and control firms, depending on the observation year. For each pre-treatment observation, a post-treatment observation should be available and vice versa; otherwise, the observation was removed from the sample. Hence, each firm provides us with two or four suitable firm-year observations.
Data on the certification dates of European B Corps were provided by B Lab and accessed through Data.World [61] in November 2019. To obtain the financial data on these B Corps, we consulted Bureau van Dijk’s database Orbis Europe. The companies in B Lab’s database were matched with those in Orbis Europe using the company name, country, city and—if available in both databases—activities and website to assure the quality of the matching procedure. This linking process was independently conducted by both one of the authors and an undergraduate student. Companies for which discrepancies between both coders were found, were further discussed and a new match was made. Companies for which no unambiguous match was possible were left out of the analysis. In a next step, the required financial data from the statutory financial accounts were collected. Companies for which the length of the financial reporting period differed from 12 months, firms that only had consolidated accounts, and/ or firms-years where certain data for one or more variables in the regression analysis were unavailable were left out of the sample. Lastly, we excluded pre-treatment observations for which no post-treatment observation was available and vice versa. All continuous variables were symmetrically winsorized at the 1st and 99th percentile to mitigate the influence of outliers. Table 3 provides an overview of the sample selection and data collection process.

4. Results

4.1. Descriptive Statistics

Table 4 provides the descriptive statistics of the variables included in the univariate and regression analyses. All monetary variables are expressed in euros. Within the sample of the turnover growth analysis, the mean yearly growth rate is approximately 22%. A company included in this sample is on average 10 years old, generates a turnover of 1.7 million euros and finances itself for 64.3% with debt. 46.9% of the observations concern treatment observations, while 53.1% are control observations. In the other samples, the average characteristics are similar, except for size, growth rate and leverage. For the employee growth analysis, the average firm in our sample employs 20 workers with a yearly growth rate of 13% and a leverage of 70.9%. In the sample where we consider asset growth, average total assets equal 570 thousand euros which on average grow at a rate of 22%. Firms included in this sample use on average more debt financing (92.0%). We performed an additional analysis to verify whether the treatment and control group where similar in terms of pre-treatment characteristics. More precisely, we performed for each analysis a MANOVA test for each treatment year that was included in the analysis. In none of the analyses, significant differences in terms of size, age and leverage emerged, indicating that the treated and control firms can be considered comparable.
Table 5 displays the pairwise correlation coefficients of the variables included in each regression analysis. There is a moderate correlation between the control variables Size, Age and Leverage and the independent variable, Growth. There is a negative correlation between the variable of interest and all growth measures, which is, however, only significant in the sample of the asset growth analysis.

4.2. Univariate Analysis

Table 6 provides the results of the univariate DiD analysis. The table shows that for the treatment group, turnover nor employee growth have significantly increased or decreased in the post-versus pre-treatment year. In contrast, for the control group, the decrease in turnover and employee growth is highly significant. Asset growth rates have decreased over time for both the treatment and control groups. The last three columns provide the properties of the DiD test statistics. The sample mean comparison test indicates that there is a significant difference between the change in turnover growth rates of the treatment group compared to the control group in favor of the treatment group. With regard to employee and asset growth rates however, we found no such significant difference.

4.3. Multivariate Analysis

Table 7 provides the results of the regression analysis. The coefficients are estimated using ordinary least squares and the standard errors are clustered at the firm level. This method of clustering provides standard errors which are robust both in the potential presence of serial correlation and in case of heteroskedasticity of the error term [71]. The association between size and growth is negative and statistically significant in the turnover growth analysis. Hence, in line with expectations, smaller firms experience higher turnover growth. Furthermore, the statistically significant positive coefficient of the squared age variable in the employee growth analysis indicates that the age-growth relation is convex. In the third analysis, the significantly negative association between growth and the squared size variable suggests a concave relationship between size and asset growth.
The coefficient of our variable of interest is positive for all three growth measures, however, consistent with the findings from our univariate analysis, only significantly different from zero in the turnover growth analysis. Thus, in the short-term, positive effects of B Lab certification outweigh the potentially negative effects on turnover growth. The economic significance of the effect of B Lab certification on the short-term turnover growth rate is reflected by the coefficient of the DiD term.
The coefficient of 0.081 indicates that, ceteris paribus, firms that obtained their certification one year ago experience a change in turnover growth in the post-treatment compared to the pre-treatment year which is on average 8 percentage points more favorable than would be expected based on the evolution of the control group’s growth rates. Hence, the economic relevance of the effects found is relatively large, given the overall average turnover growth of 22%.

5. Discussion and Concluding Remarks

In recent years, hybrid companies have increased in popularity and prevalence. In order to stimulate the growth of hybrid companies, new insights are needed into the factors that determine why some hybrid organizations are more successful than others. As hybrid firms experience tensions that are unknown to traditional enterprises [6,12], the factors that determine success of hybrid firms likely differ from those that affect the success of traditional firms. One such factor is external verification as it could mitigate these tensions that arise from pursuing dual missions [3]. B Corp certification awarded by B Lab is one such type of external verification for hybrid enterprises that has known an exponential worldwide growth.
In our study we apply a DiD framework to examine the effect of B Corp certification on the short-term turnover, employment and total asset growth rates of European B Corps. We find a statistically significant positive impact one year after certification on the turnover growth rates of certifying firms compared to control firms. Besides, the economic significance of this effect is considerable. We find no statistically significant effects on the employee or total asset growth rates.
Our empirical results add to the hybrid firm growth literature. The hybrid firm growth literature is characterized by fragmented case-based studies, lacking knowledge on the actual performance of hybrid enterprises [12]. Besides, only little is known about the impact of B Corp certification on growth and future success of hybrid enterprises, while B Lab plays a key role in the growing number of hybrid enterprises [12,72]. Our findings show that, over the short-term, this impact can be positive. These findings support the rationale followed in Chauhan and O’Neill’s [3] qualitative study: external certification can help firms to become part of a certain visible category and can help them to internally align the company’s values, organization, resource allocation and employee efforts. In other words, external certification can help a hybrid company to transform its social mission from a source of tension into a strategic advantage. The significantly positive effect of B Corp certification on turnover growth also supports Harjoto et al.’s [37] findings. They argue that, given the fact that SMEs in highly competitive operating environments feel inclined to allocate resources to the certification process, their decision to obtain certification provides evidence of strategic advantages. This reasoning, however, contradicts with the results that were documented by Parker et al. [10], who found a negative relation between certification and sales growth for North American firms. In our opinion, these contradictory findings can be explained by the different approach of B Lab Europe compared to the one in the US, where the certificate was first launched. Whereas in the US B Lab aspires to facilitate access to capital, B Lab Europe aims to build a network of impactful companies and create the appropriate infrastructure to conduct business in a socially responsible manner [73]. This focus on networking might boost the promotional effect of B Corp certification. Besides, Parker et al. [10] only find a significantly negative effect on the sales growth rates for “young” and “small” firms (younger than 10 years, employing less than 10 people). As the average firm in our sample would be classified as “old” and “large”, this could also contribute to the difference in findings. Lastly, Gehman et al. [41] point out that the “category maturity and currency”, i.e., whether the B Corp label is well-established, might explain the growth penalty that Parker et al. [10] observe, provided that these authors investigated firms that obtained certification in 2013, when the label was relatively new. As our analysis spans several treatment years from 2012 up to 2017, this might also explain the divergent findings. The statistical insignificance of the effect of B Lab certification on employee and total asset growth rates may be due to the fact that such effects, if present, are only discernable on the long term.
Similar to other studies, this study has its limitations, keeping avenues open for further research. Firstly, we only examined one type of sustainability certification, disregarding other certification types. For comparison, previous research on ISO 14001 certification, another type of sustainability certification focusing on environmental management systems, is inconclusive about the short-term impact of certification on sales [74]. The motivations to pursue B Corp certification are of similar nature of those found relating to ISO 14001—Environmental Management Standards. The main reported benefits of ISO 14001 certification include the ability to improve the environmental performance and comply with environmental legislation, lowering the risk level of penalties and litigation and improving stakeholder satisfaction and employee morale [29]. This leads to both lower operating costs and new business opportunities, leveraging the competitive position of organizations. However, there are also some reported negative consequences of ISO 14001 certification, such as the difficulty in measuring the EMS efficiency, increased bureaucracy, and higher costs [29]. Further studies could compare the effect of several certification types. Secondly, we measured a firm’s certification status with a dummy variable. However, some firms reach higher scores on the BIA than others, which might potentially affect the observed effects. We did not take such scores into account, since the BIA is revised every year. Hence, different versions of the BIA apply over different certification years, resulting in non-comparable scores. Finally, our study design only allows to look at the short-term consequences of B Corp certification, while the effect might differ over time. Hence, further consideration of the medium to long term effects of B Corp certification on firm growth is recommended.
Nevertheless, our study provides relevant information for B Lab and prospective candidates for B Corp certification. Hybrid firms with the intention to certify, but which maybe are precarious about the financial impact are now provided with the information that the positive short-term effects on turnover growth resulting from increased transparency and verified positive social and environmental impact outweigh the negative effects owing to the rigorous audit procedure. Besides, our study provides more insights into the factors that shape the success of hybrid firms. B Lab can allude to our findings as a promotional strategy and encourage members to benefit more from their label.

Author Contributions

Conceptualization, V.P., P.V.C. and H.V.B.; methodology, V.P., P.V.C. and H.V.B.; software, V.P.; validation, V.P., P.V.C. and H.V.B.; formal analysis, V.P., P.V.C. and H.V.B.; investigation, V.P., P.V.C. and H.V.B.; resources, V.P.; data curation, V.P.; writing—original draft preparation, V.P.; writing—review and editing, V.P., P.V.C. and H.V.B.; supervision, P.V.C. and H.V.B; project administration, V.P., P.V.C. and H.V.B. All authors have read and agreed to the published version of the manuscript.

Funding

This research received no external funding.

Conflicts of Interest

The authors declare no conflict of interest.

References

  1. Russo, A.; Perrini, F. Investigating stakeholder theory and social capital: CSR in large firms and SMEs. J. Bus. Ethics 2010, 91, 207–221. [Google Scholar] [CrossRef]
  2. Stubbs, W. Sustainable entrepreneurship and B corps. Bus. Strategy Environ. 2017, 26, 331–344. [Google Scholar] [CrossRef]
  3. Chauhan, Y.; O’Neill, H.M. Strategic Advantages through Social Responsiveness: The Case of Certified B-Corps. Presented at the 2020 Global B Academics Paper Development Workshop, Online (Virtual event), US, 5 August 2020. Available online: https://ssrn.com/abstract=3627399 (accessed on 30 September 2020).
  4. Bianchi, C.; Reyes, V.; Devenin, V. Consumer motivations to purchase from benefit corporations (B Corps). Corp. Soc. Responsib. Environ. Manag. 2020, 27, 1445–1453. [Google Scholar] [CrossRef]
  5. B The Change. Why Become a B: 5 Companies Share Tangible Benefits of Becoming a B Corp. B The Change [Online], 2 January 2019. Available online: https://bthechange.com/why-become-a-b-5-companies-share-tangible-benefits-of-becoming-a-b-corp-d087069fdc4e (accessed on 7 May 2020).
  6. Pache, A.; Santos, F. Inside the hybrid organization: Selective coupling as a response to competing institutional logics. Acad. Manag. J. 2013, 56, 972–1001. [Google Scholar] [CrossRef] [Green Version]
  7. Battilana, J.; Lee, M. Advancing research on hybrid organizing–Insights from the study of social enterprises. Acad. Manag. Ann. 2014, 8, 397–441. [Google Scholar] [CrossRef]
  8. Gehman, J.; Grimes, M. Hidden badge of honor: How contextual distinctiveness affects category promotion among certified B corporations. Acad. Manag. J. 2017, 60, 2294–2320. [Google Scholar] [CrossRef] [Green Version]
  9. Imbens, G.W.; Wooldridge, J.M. Recent developments in the econometrics of program evaluation. J. Econ. Lit. 2009, 47, 5–86. [Google Scholar] [CrossRef] [Green Version]
  10. Parker, S.C.; Gamble, E.N.; Moroz, P.W.; Branzei, O. The impact of B lab certification on firm growth. Acad. Manag. Discov. 2019, 5, 57–77. [Google Scholar] [CrossRef]
  11. Eldar, O. The role of social enterprise and hybrid organizations. Colom. Bus. Law Rev. 2017, 2017, 92–198. [Google Scholar] [CrossRef] [Green Version]
  12. Saebi, T.; Foss, N.J.; Linder, S. Social entrepreneurship research: Past achievements and future promises. J. Manag. 2019, 45, 70–95. [Google Scholar] [CrossRef]
  13. European Commission. Commission Recommendation of 6 May 2003 concerning the definition of micro, small and medium-sized enterprises. Off. J. Eur. Union 2003, L124, 36–41. [Google Scholar]
  14. Morsing, M.; Perrini, F. CSR in SMEs: Do SMEs matter for the CSR agenda? Bus. Ethics Eur. Rev. 2009, 18, 1–6. [Google Scholar] [CrossRef]
  15. Chen, X.; Kelly, T.F. B-Corps—A growing form of social enterprise: Tracing their progress and assessing their performance. J. Leadersh. Organ. Stud. 2015, 22, 102–114. [Google Scholar] [CrossRef]
  16. Romi, A.; Cook, K.A.; Dixon-Fowler, H.R. The influence of social responsibility on employee productivity and sales growth: Evidence from certified B corps. Sustain. Account. Manag. Policy J. 2018, 9, 392–421. [Google Scholar] [CrossRef]
  17. Cao, K.; Gehman, J.; Grimes, M.G. Standing out and fitting in: Charting the emergence of Certified B Corporations by industry and region. In Hybrid Ventures; Corbett, A.C., Katz, J.A., Eds.; Emerald Publishing Limited: Bingley, UK, 2018; Volume 19, pp. 1–38. [Google Scholar]
  18. B Impact Report. Available online: https://bcorporation.net/directory/sep-jordan (accessed on 1 October 2020).
  19. B Lab. Certification. Available online: https://bcorporation.net/certification (accessed on 4 November 2019).
  20. B Lab. Certification Requirements. Available online: https://bcorporation.net/certification/meet-the-requirements (accessed on 4 November 2019).
  21. B Lab. About B Corps. Available online: https://bcorporation.net/about-b-corps (accessed on 14 September 2020).
  22. Maier, A. A Map of Social Enterprises and Their Eco-Systems in Europe; European Commission: Brussels, Belgium, 2015. [Google Scholar]
  23. Global Reporting Initiative. The New Look of GRI. Available online: https://www.globalreporting.org (accessed on 28 September 2020).
  24. Global Impact Investing Network. IRIS+ is the Generally Accepted System for Measuring, Managing, and Optimizing Impact. Available online: https://iris.thegiin.org (accessed on 28 September 2020).
  25. B Lab. Standards and Governance. Available online: https://bcorporation.net/about-b-lab/standards-and-governance (accessed on 28 September 2020).
  26. Social Accountability International. About SA8000. Available online: https://sa-intl.org/programs/sa8000/ (accessed on 28 September 2020).
  27. MVO Vlaanderen. ISO 26000. Available online: https://www.mvovlaanderen.be/iso-26000–0 (accessed on 28 September 2020).
  28. Gantz, S.D. The Basics of IT Audit: Purposes, Processes, and Practical Information; Elsevier: Amsterdam, The Netherlands, 2014; Chapter 5; pp. 83–104. [Google Scholar]
  29. Fonseca, L.M.; Domingues, J.P. Exploratory research of ISO 14001: 2015 transition among Portuguese organizations. Sustainability 2018, 10, 781. [Google Scholar] [CrossRef] [Green Version]
  30. Margolis, J.D.; Walsh, J.P. Misery loves companies: Rethinking social initiatives by business. Adm. Sci. Q. 2003, 48, 268–305. [Google Scholar] [CrossRef] [Green Version]
  31. Orlitzky, M.; Schmidt, F.L.; Rynes, S.L. Corporate social and financial performance: A meta-analysis. Organ. Stud. 2003, 24, 403–441. [Google Scholar] [CrossRef]
  32. Fonseca, L.; Ferro, R. Does it Pay to be Social Responsible? Portuguese SMEs feedback. Intang. Cap. 2016, 12, 487–505. [Google Scholar] [CrossRef] [Green Version]
  33. Doherty, B.; Haugh, H.; Lyon, F. Social enterprises as hybrid organizations: A review and research agenda. Int. J. Manag. Rev. 2014, 16, 417–436. [Google Scholar] [CrossRef] [Green Version]
  34. Muñoz, P.; Kimmitt, J. Social mission as competitive advantage: A configurational analysis of the strategic conditions of social entrepreneurship. J. Bus. Res. 2019, 101, 854–861. [Google Scholar] [CrossRef]
  35. Teasdale, S.; Lyon, F.; Baldock, R. Playing with numbers: A methodological critique of the social enterprise growth myth. J. Soc. Entrep. 2013, 4, 113–131. [Google Scholar] [CrossRef] [Green Version]
  36. Grimes, M.G.; Gehman, J.; Cao, K. Positively deviant: Identity work through B Corporation certification. J. Bus. Ventur. 2018, 33, 130–148. [Google Scholar] [CrossRef]
  37. Harjoto, M.; Laksmana, I.; Yang, Y.W. Why do companies obtain the B corporation certification? Soc. Responsib. J. 2018, 15, 621–639. [Google Scholar] [CrossRef]
  38. Hickman, L.; Byrd, J.; Hickman, K. Explaining the Location of Mission-Driven Businesses. J. Corp. Citizsh. 2014, 55, 13–25. [Google Scholar]
  39. Lacmanovic, S.; Milec, D. The Relevance and Distribution of Certified B Corporations in the European Union Economy. In Proceedings of the Economic and Social Development: 36th International Scientific Conference on Economic and Social Development—“Building Resilient Society”, Zagreb, Croatia, 14–15 December 2018; Veselica, R., Dukic, G., Hammes, K., Eds.; Varazdin Development and Entrepreneurship Agency: Varazdin, Croatia, 2018; pp. 337–346. [Google Scholar]
  40. López-Navarro, M.Á.; Fuertes, I.; Flor, M.L.; Cabedo, J.D. Hybrid organisations, environmental sustainability and social impact: An analysis of European B corp firms. In Proceedings of the R&D Management Conference 2018 R & Designing Innovation: Transformational Challenges for Organizations and Society, Milan, Italy, 30 June–4 July 2018. [Google Scholar]
  41. Gehman, J.; Grimes, M.G.; Cao, K. Why We Care about Certified B Corporations: From Valuing Growth to Certifying Values Practices. Acad. Manag. Discov. 2019, 5, 97–101. [Google Scholar] [CrossRef]
  42. Nigri, G.; Del Baldo, M.; Agulini, A. Governance and accountability models in Italian certified benefit corporations. Corp. Soc. Responsib. Environ. Manag. 2020, 27, 2368–2380. [Google Scholar] [CrossRef]
  43. Nigri, G.; Del Baldo, M. Sustainability Reporting and Performance Measurement Systems: How do Small-and Medium-Sized Benefit Corporations Manage Integration? Sustainability 2018, 10, 4499. [Google Scholar] [CrossRef] [Green Version]
  44. Alonso-Martínez, D.; De Marchi, V.; Di Maria, E. Which country characteristics support corporate social performance? Sustain. Dev. 2019, 28, 670–684. [Google Scholar] [CrossRef]
  45. Weinreb, S. Mission Driven Business? Here’s Why to Become A B Corp, According to Four Certified Companies. Forbes [Online], 13 April 2018. Available online: https://www.forbes.com/sites/saraweinreb/2018/04/30/mission-driven-business-here-are-six-reasons-to-consider-b-corp-certification/#1276a4627def (accessed on 16 December 2019).
  46. Stubbs, W. Strategies, practices, and tensions in managing business model innovation for sustainability: The case of an Australian BCorp. Corp. Soc. Responsib. Environ. Manag. 2019, 26, 1063–1072. [Google Scholar] [CrossRef]
  47. Freeman, R.E. Strategic Management: A Stakeholder Approach; Pitman: Boston, MA, USA, 1984. [Google Scholar]
  48. Russo, M.V.; Fouts, P.A. A resource-based perspective on corporate environmental performance and profitability. Acad. Manag. J. 1997, 40, 534–559. [Google Scholar]
  49. Andries, P.; Stephan, U. Environmental innovation and firm performance: How firm size and motives matter. Sustainability 2019, 11, 3585. [Google Scholar] [CrossRef] [Green Version]
  50. Jiang, Y.; Xue, X.; Xue, W. Proactive corporate environmental responsibility and financial performance: Evidence from Chinese energy enterprises. Sustainability 2018, 10, 964. [Google Scholar] [CrossRef] [Green Version]
  51. Stammer, R. It Pays to Become a B Corporation. Harvard Business Review [Online], 6 December 2016. Available online: https://hbr.org/2016/12/it-pays-to-become-a-b-corporation (accessed on 31 January 2020).
  52. Tajfel, H. Social psychology of intergroup relations. Annu. Rev. Psychol. 1982, 33, 1–39. [Google Scholar] [CrossRef] [Green Version]
  53. B Lab; Fitzii. About—B Work. Available online: https://in.bwork.com/about/ (accessed on 30 March 2020).
  54. B Lab Australia & New Zealand. Why Fast-Growth Startups Should Become B Corps. B The Change [Online], 12 December 2019. Available online: https://bthechange.com/why-fast-growth-startups-should-become-b-corps-6acf7d10bf8 (accessed on 31 January 2020).
  55. Becchetti, L.; Trovato, G. The determinants of growth for small and medium sized firms. The role of the availability of external finance. Small Bus. Econ. 2002, 19, 291–306. [Google Scholar] [CrossRef]
  56. Carpenter, R.E.; Petersen, B.C. Is the growth of small firms constrained by internal finance? Rev. Econ. Stat. 2002, 84, 298–309. [Google Scholar] [CrossRef]
  57. Choi, D.Y.; Gray, E.R. Socially responsible entrepreneurs: What do they do to create and build their companies? Bus. Horiz. 2008, 51, 341–352. [Google Scholar] [CrossRef]
  58. Siqueira, A.C.O.; Guenster, N.; Vanacker, T.; Crucke, S. A longitudinal comparison of capital structure between young for-profit social and commercial enterprises. J. Bus. Ventur. 2018, 33, 225–240. [Google Scholar] [CrossRef] [Green Version]
  59. Cheng, B.; Ioannou, I.; Serafeim, G. Corporate social responsibility and access to finance. Strateg. Manag. J. 2014, 35, 1–23. [Google Scholar] [CrossRef]
  60. Angrist, J.D.; Pischke, J.-S. Mostly Harmless Econometrics: An Empiricist’s Companion; Princeton University Press: Princeton, NJ, USA, 2008. [Google Scholar]
  61. B Lab. B Corp Impact Data. Available online: Data.world/blab/b-corp-impact-data (accessed on 4 November 2019).
  62. Almus, M.; Nerlinger, E.A. Growth of new technology-based firms: Which factors matter? Small Bus. Econ. 1999, 13, 141–154. [Google Scholar] [CrossRef]
  63. Evans, D.S. Tests of alternative theories of firm growth. J. Polit. Econ. 1987, 95, 657–674. [Google Scholar] [CrossRef]
  64. Heshmati, A. On the growth of micro and small firms: Evidence from Sweden. Small Bus. Econ. 2001, 17, 213–228. [Google Scholar] [CrossRef]
  65. Delmar, F.; Davidsson, P.; Gartner, W.B. Arriving at the high-growth firm. J. Bus. Ventur. 2003, 18, 189–216. [Google Scholar] [CrossRef] [Green Version]
  66. Goddard, J.; Tavakoli, M.; Wilson, J.O. Sources of variation in firm profitability and growth. J. Bus. Res. 2009, 62, 495–508. [Google Scholar] [CrossRef]
  67. Jovanovic, B. Selection and the Evolution of Industry. Econometrica 1982, 50, 649–670. [Google Scholar] [CrossRef]
  68. Das, S. Size, age and firm growth in an infant industry: The computer hardware industry in India. Int. J. Ind. Organ. 1995, 13, 111–126. [Google Scholar] [CrossRef]
  69. Huynh, K.P.; Petrunia, R.J. Age effects, leverage and firm growth. J. Econ. Dyn. Control 2010, 34, 1003–1013. [Google Scholar] [CrossRef]
  70. Lang, L.; Ofek, E.; Stulz, R. Leverage, investment, and firm growth. J. Financ. Econ. 1996, 40, 3–29. [Google Scholar] [CrossRef] [Green Version]
  71. StataCorp. Stata 15 Base Reference Manual; StataCorp LLC: College Station, TX, USA, 2017. [Google Scholar]
  72. Haigh, N.; Walker, J.; Bacq, S.; Kickul, J. Hybrid organizations: Origins, strategies, impacts, and implications. Calif. Manag. Rev. 2015, 57, 5–12. [Google Scholar] [CrossRef] [Green Version]
  73. MVO Vlaanderen. Certificaat voor impactbedrijven verovert Europa. MVO Vlaanderen [Online], 14 June 2019. Available online: https://www.mvovlaanderen.be/inspiratie/certificaat-voor-impactbedrijven-verovert-europa (accessed on 2 April 2020).
  74. De Jong, P.; Paulraj, A.; Blome, C. The financial impact of ISO 14001 certification: Top-line, bottom-line, or both? J. Bus. Ethics 2014, 119, 131–149. [Google Scholar] [CrossRef]
Publisher’s Note: MDPI stays neutral with regard to jurisdictional claims in published maps and institutional affiliations.
Figure 1. Yearly number of B Corp certificates granted.
Sustainability 12 08459 g001
Table 1. Geographical distribution of B Corps existing in 2019.
CountryNo. of B CorpsCountryNo. of B CorpsCountryNo. of B CorpsCountryNo. of B Corps
United States1200Peru17Guatemala4Greece1
Canada252Kenya15Sweden4Russian Federation1
Australia241Korea (Republic of)13Uganda3Nicaragua1
United Kingdom177China12Turkey3Rwanda1
Chile130Portugal11Thailand3Afghanistan1
Brazil128Paraguay10Austria3Bangladesh1
Argentina79Denmark10Hungary2United Arab Emirates1
Italy78Uruguay9Panama2Myanmar1
France70Belgium9Ghana2Finland1
Netherlands66South Africa8Luxembourg2Czech Republic1
Colombia53Singapore8Bolivia2Viet Nam1
Spain43Hong Kong8Egypt1Bahamas1
Mexico33Costa Rica7Zambia1Indonesia1
Germany31Ecuador6Philippines1Norway1
Taiwan27Israel5Poland1
Switzerland23India5Ireland1
New Zealand21Japan5Malta1Total2860
Table 2. Sectoral distribution of B Corps existing in 2019.
SectorNo. of B Corps
Business Products and Services1055
Consumer Products and Services732
Financial Services276
Energy and Environmental Services156
Education and Training Services126
Building117
Agriculture90
Health and Human Services85
Restaurant, Hospitality and Travel78
Media52
Retail39
Legal Services37
Transportation and Logistics13
Unknown4
Total2860
Table 3. Sample selection and data collection.
(1) Turnover Growth(2) Employee Growth(3) Asset Growth
European B Corps (2012–2018)644 Firms644 Firms644 Firms
−No Orbis match(20) Firms(20) Firms(20) Firms
−Year length ≠ 12 months or consolidated accounts (52) Firms(52) Firms(52) Firms
−Missing data for relevant years(367) Firms(292) Firms(146) Firms
−No pre or post observation(77) Firms(152) Firms(130) Firms
Final sample
Firms128128296
Firm-years a418380966
a We observe each firm for 2 or 4 years.
Table 4. Descriptive statistics a.
MeanStd. Dev.MinMax
Turnover Growth (N = 418)
Growth0.2230.578−0.8513.667
Treatment0.4690.50001
Post0.50.50101
Certified (Treatment × Post)0.2320.42801
Ln(Size)14.3582.5839.10520.018
Ln(Age)2.3230.93404.304
Leverage0.6430.2630.0701.369
Employee Growth (N = 380)
Growth0.1300.352−0.8361.609
Treatment0.4580.49901
Post0.50.50101
Certified (Treatment × Post)0.2290.42101
Ln(Size)3.0131.70607.012
Ln(Age)2.5470.87804.304
Leverage0.7090.2700.1711.646
Asset Growth (N = 966)
Treatment0.4510.49801
Post0.50.50001
Certified (Treatment × Post)0.2260.41801
Growth0.2170.576−1.2332.861
Ln(Size)13.2522.7920.92819.220
Ln(Age)2.1280.90104.159
Leverage0.9201.373010.547
a For variable definitions: see text.
Table 5. Pairwise correlation matrix a.
GrowthCertifiedLn(Size)Ln(Age)Leverage
Turnover Growth (N = 418)
Growth1
Certified−0.0361
Ln(Size)−0.363 ***0.0081
Ln(Age)−0.381 ***0.0730.710 ***1
Leverage0.0701−0.0246−0.001−0.093 *1
Employee Growth (N = 380)
Growth1
Certified−0.0751
Ln(Size)−0.230 ***0.0091
Ln(Age)−0.220 ***0.0660.558 ***1
Leverage0.0233−0.022−0.148 ***−0.261 ***1
Asset Growth (N = 966)
Growth1
Certified−0.094 ***1
Ln(Size)−0.261 ***0.0411
Ln(Age)−0.314 ***0.101 ***0.468 ***1
Leverage0.0992 ***−0.002-0.140 ***−0.097 ***1
a For variable definitions: see text. ***, **, * indicate statistical significance at the 1%, 5% and 10% level, respectively.
Table 6. Results of univariate t-tests a.
( G r o w t h τ + 1 T r e a t e d G r o w t h τ 1 T r e a t e d ) ( G r o w t h τ + 1 C o n t r o l G r o w t h τ 1 C o n t r o l ) D i D
(1) Turnover Growth(2) Employee Growth(3) Asset Growth(1) Turnover Growth(2) Employee Growth(3) Asset Growth(1) Turnover Growth(2) Employee Growth(3) Asset Growth
Obs.9887218111103265
Mean−0.031−0.094−0.151 ***−0.267 ***-0.093 **−0.176 ***0.236 **−0.0010.024
St. Err.0.0650.0650.0480.0780.0390.0500.1020.0760.696
Test statistic−0.467−1.449−3.144−3.437−2.404−3.4482.328−0.0160.351
a This table reports the results of a univariate t-test for difference in means from 0. Unequal variances are assumed. For variable definitions: see text. ***, **, * indicate statistical significance at the 1%, 5% and 10% level, respectively. The p-values were calculated using a two-tailed t-test.
Table 7. Regression results a.
Dependent Variable
Expected Sign(1)(2)(3)
Turnover GrowthEmployee GrowthAsset Growth
Test variable
C e r t i f i e d i t 1 ?0.081 *0.0230.019
(0.043)(0.044)(0.046)
Control variables
ln ( S i z e ) i t 1 −0.812 *0.111−0.175
(0.415)(0.230)(0.108)
( ln ( S i z e ) i t 1 ) 2 ?0.0030.023−0.016 ***
(0.017)(0.039)(0.006)
ln ( A g e ) i t 1 ?−0.751−0.197−0.020
(0.486)(0.246)(0.387)
( ln ( A g e ) i t 1 ) 2 ?0.1550.246 *0.196
(0.190)(0.147)(0.132)
ln ( S i z e ) i t 1 × ln ( A g e ) i t 1 ?0.073−0.306 ***0.002
(0.046)(0.115)(0.035)
L e v e r a g e i t 1 ?−0.219−0.3800.035
(0.158)(0.242)(0.032)
Firm Fixed Effects YesYesYes
Year Fixed Effects YesYesYes
R-squared 0.7260.3910.499
Observations 418380966
Number of firms 128128296
a Robust standard errors clustered by firm in parentheses. For variable definitions: see text. ***, **, * indicate statistical significance at the 1%, 5% and 10% level, respectively. The p-values were calculated using a two-tailed t-test.

