Article

Construction Cost Estimation Using a Case-Based Reasoning Hybrid Genetic Algorithm Based on Local Search Method

1
Department of Architectural Engineering, Seoul National University, Seoul 08826, Korea
2
Civil & Environmental Engineering, San Jose State University, Washington Sq, San Jose, CA 95192, USA
3
Institute of Construction and Environmental Engineering, Seoul National University, Seoul 08826, Korea
*
Author to whom correspondence should be addressed.
Sustainability 2020, 12(19), 7920; https://doi.org/10.3390/su12197920
Submission received: 5 July 2020 / Revised: 22 September 2020 / Accepted: 23 September 2020 / Published: 24 September 2020

Abstract

:
Estimates of project costs in the early stages of a construction project have a significant impact on the operator’s decision-making in essential matters, such as the site’s decision or the construction period. However, it is not easy to carry out the initial stage with confidence, because information such as design books and specifications is not available. In previous studies, case-based reasoning (CBR) is used to estimate initial construction costs, and genetic algorithms are used to calculate the weight of the retrieve phase in CBR’s process. However, it is difficult to draw a better solution than the current one, because existing genetic algorithms use random numbers. To overcome these limitations, we reflect correlation numbers in the genetic algorithms by using the method of local search. Then, we determine the weights using a hybrid genetic algorithm that combines local search and genetic algorithms. A case-based reasoning model was developed using a hybrid genetic algorithm. Then, the model was verified with construction cost data that were not used for the development of the model. As a result, it was found that the hybrid genetic algorithm and case-based reasoning applied with the local search performed better than the existing solution. The detail mean error value was found to be 3.52%, 6.15%, and 0.33% higher for each case than the previous one.

1. Introduction

Cost estimation at the early project stage plays an important role in a contractor’s decision-making, especially in budgeting for the project and construction period calculation [1]. The initial estimation is conducted with insufficient information lacking complete construction drawing sets or construction specifications. Thus, despite the importance of accurate initial cost estimation, the question of how to achieve a reliable estimated cost remains unsolved [2]. Additionally, if the construction cost is accurately predicted, it is possible to save resources, because it does not waste unnecessary resources on the construction project.
To address this current limitation, studies have made significant efforts to improve the accuracy of the initial construction cost by developing cost estimating models. One of the well-known estimating methods is case-based reasoning, which solves current problems based on past experience [3]. It is used to estimate initial construction costs. This paper defines this as CBR. It consists of four steps: to retrieve, to reuse, to revise, and to retain. The first step to retrieve is a reasoning process to explore similar cases in the project case data [4].
At this stage, determination of property weights is prioritized. This is because the choice of similar cases depends on the weight and affects the accuracy of the CBR results more [5]. In previous studies based on case-based reasoning, a genetic algorithm (GA) was employed to calculate the attribute weight [6]. This paper defines this as GA. GA is a representative optimization algorithm that mimics the principles of evolution and has been adopted to solve problems in various fields. It performs the optimization process of parameter selection, crossover, and mutation. The limitation of this process is that the operation is conducted based on the rules and the equation so that the relevance between the parameter and the feature of data is not considered [7]. Specifically in a typical genetic algorithm process, by adopting a random numeric value, the model can deduce a solution and then form the population, a group of solutions.
However, this method of iterative calculation using random numbers has a limitation in finding the optimal solution. Specifically, it is difficult to find a better solution than the current one, and its randomness in solving problems may or may not be solved quickly [8]. To overcome these limitations and to achieve better performance, there is a research approach to combine the genetic algorithm and local search technique [9,10,11,12], and it is defined as the hybrid genetic algorithm [13].
Thus, this research develops the cost estimation model using case-based reasoning (CBR) with the property weight calculated using a hybrid genetic algorithm with the local search technique and correlation coefficient from the genetic algorithm. In particular, the correlation coefficient is calculated using Pearson correlation analysis, and the value is employed to a local search method for the population creation process of each generation to improve the process. Then, the CBR construction cost estimation model with the improved process is verified with the case data.

2. Methods and Materials

2.1. Research Method

The rest of this research follows the procedure below:
(a)
The implications are derived through the analysis of the preceding study.
(b)
The theoretical backgrounds and practical applications of case-based reasoning, genetic algorithms, and local search are studied considered for developing a hybrid genetic algorithm.
(c)
Correlative analysis with the data from three cases of apartment housing, military barracks, and office buildings are conducted, and then the corresponding correlation coefficient is calculated for each property.
(d)
A model for estimating case-based reasoning construction costs is developed using a hybrid genetic algorithm with local search application.
(e)
The validity of this study is verified by comparing the estimated accuracy of the hybrid GA–CBR model and the model with different weighting methods.

2.2. Literature Review

Calculating property weight plays an important role in estimating performance in case-based reasoning. In this research, the optimization process is carried out with a hybrid genetic algorithm that combines local search methods with a genetic algorithm in order to improve the quality of determining attribute weights. This chapter defines the concept of case-based Reasoning and discusses the principles of genetic algorithm and local search.

2.2.1. Case-Based Reasoning

Case-based reasoning is a problem-solving method based upon information and knowledge of similar cases in the past.
The process is described in Figure 1. The distinguishing features of case-based reasoning from other artificial intelligence techniques are first, its use of concrete knowledge of past cases to solve new, and second, how this solved new problem is stored as a case-based historical case, so that it can be used for future problems [14].
In this paper, construction cost data from similar cases were extracted using the retrieving step during the process of case-based reasoning to estimate a new construction cost of the new data. The retrieve phase extracted similar cases by comparing matched problems’ attributes from past cases. The determination of similar cases was by case-by-case scores, and they were determined by calculating the property similarity score and the attribute-weighted values. The property similarity was measured by calculating the difference between the property value from the past case and the value of the problem case by means of a formula or a rule.
Property weights were calculated based upon the analysis process of the historical case, and they helped to assign high weights to critical input attributes when looking up similar cases, so that accurate retrieving could be induced. Calculating methods for attribute weights included the regression method [15] and genetic algorithm. In this research, a hybrid genetic algorithm using correlations and search to calculate attribute weights was employed.

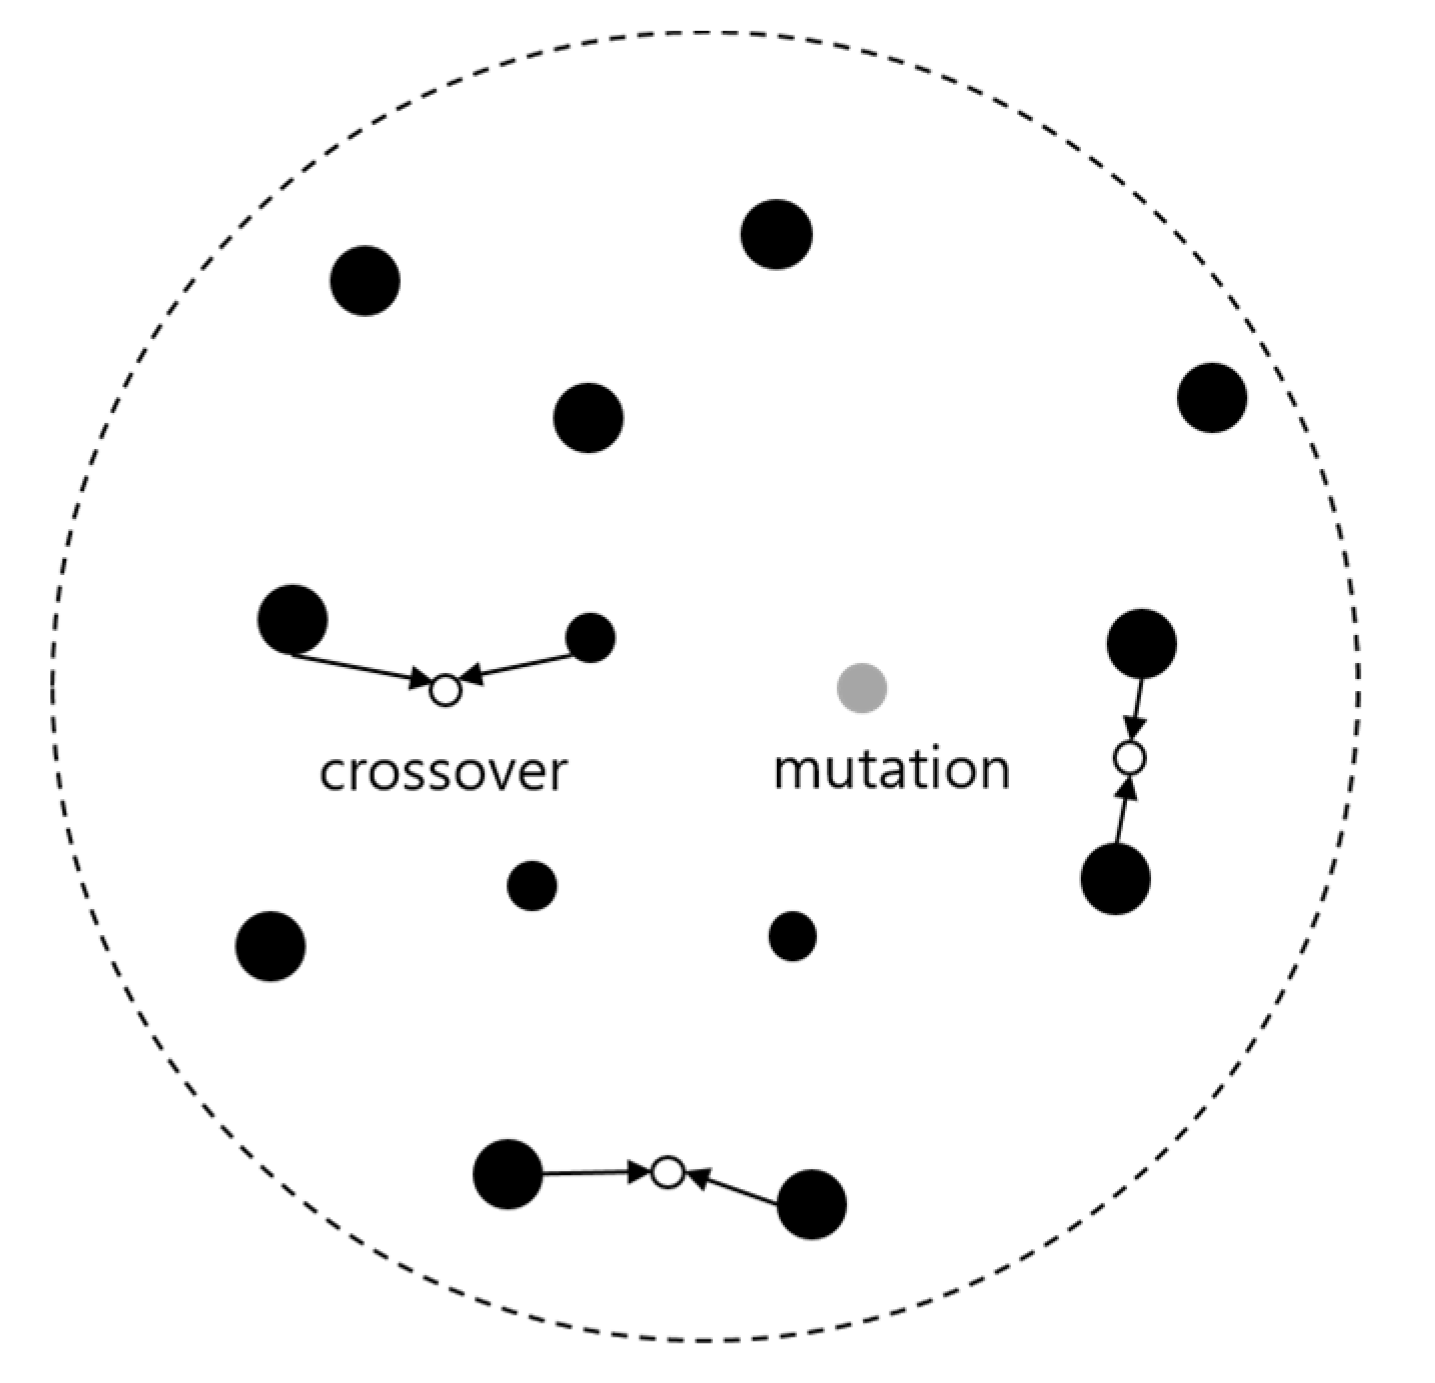
2.2.2. Genetic Algorithm (GA)
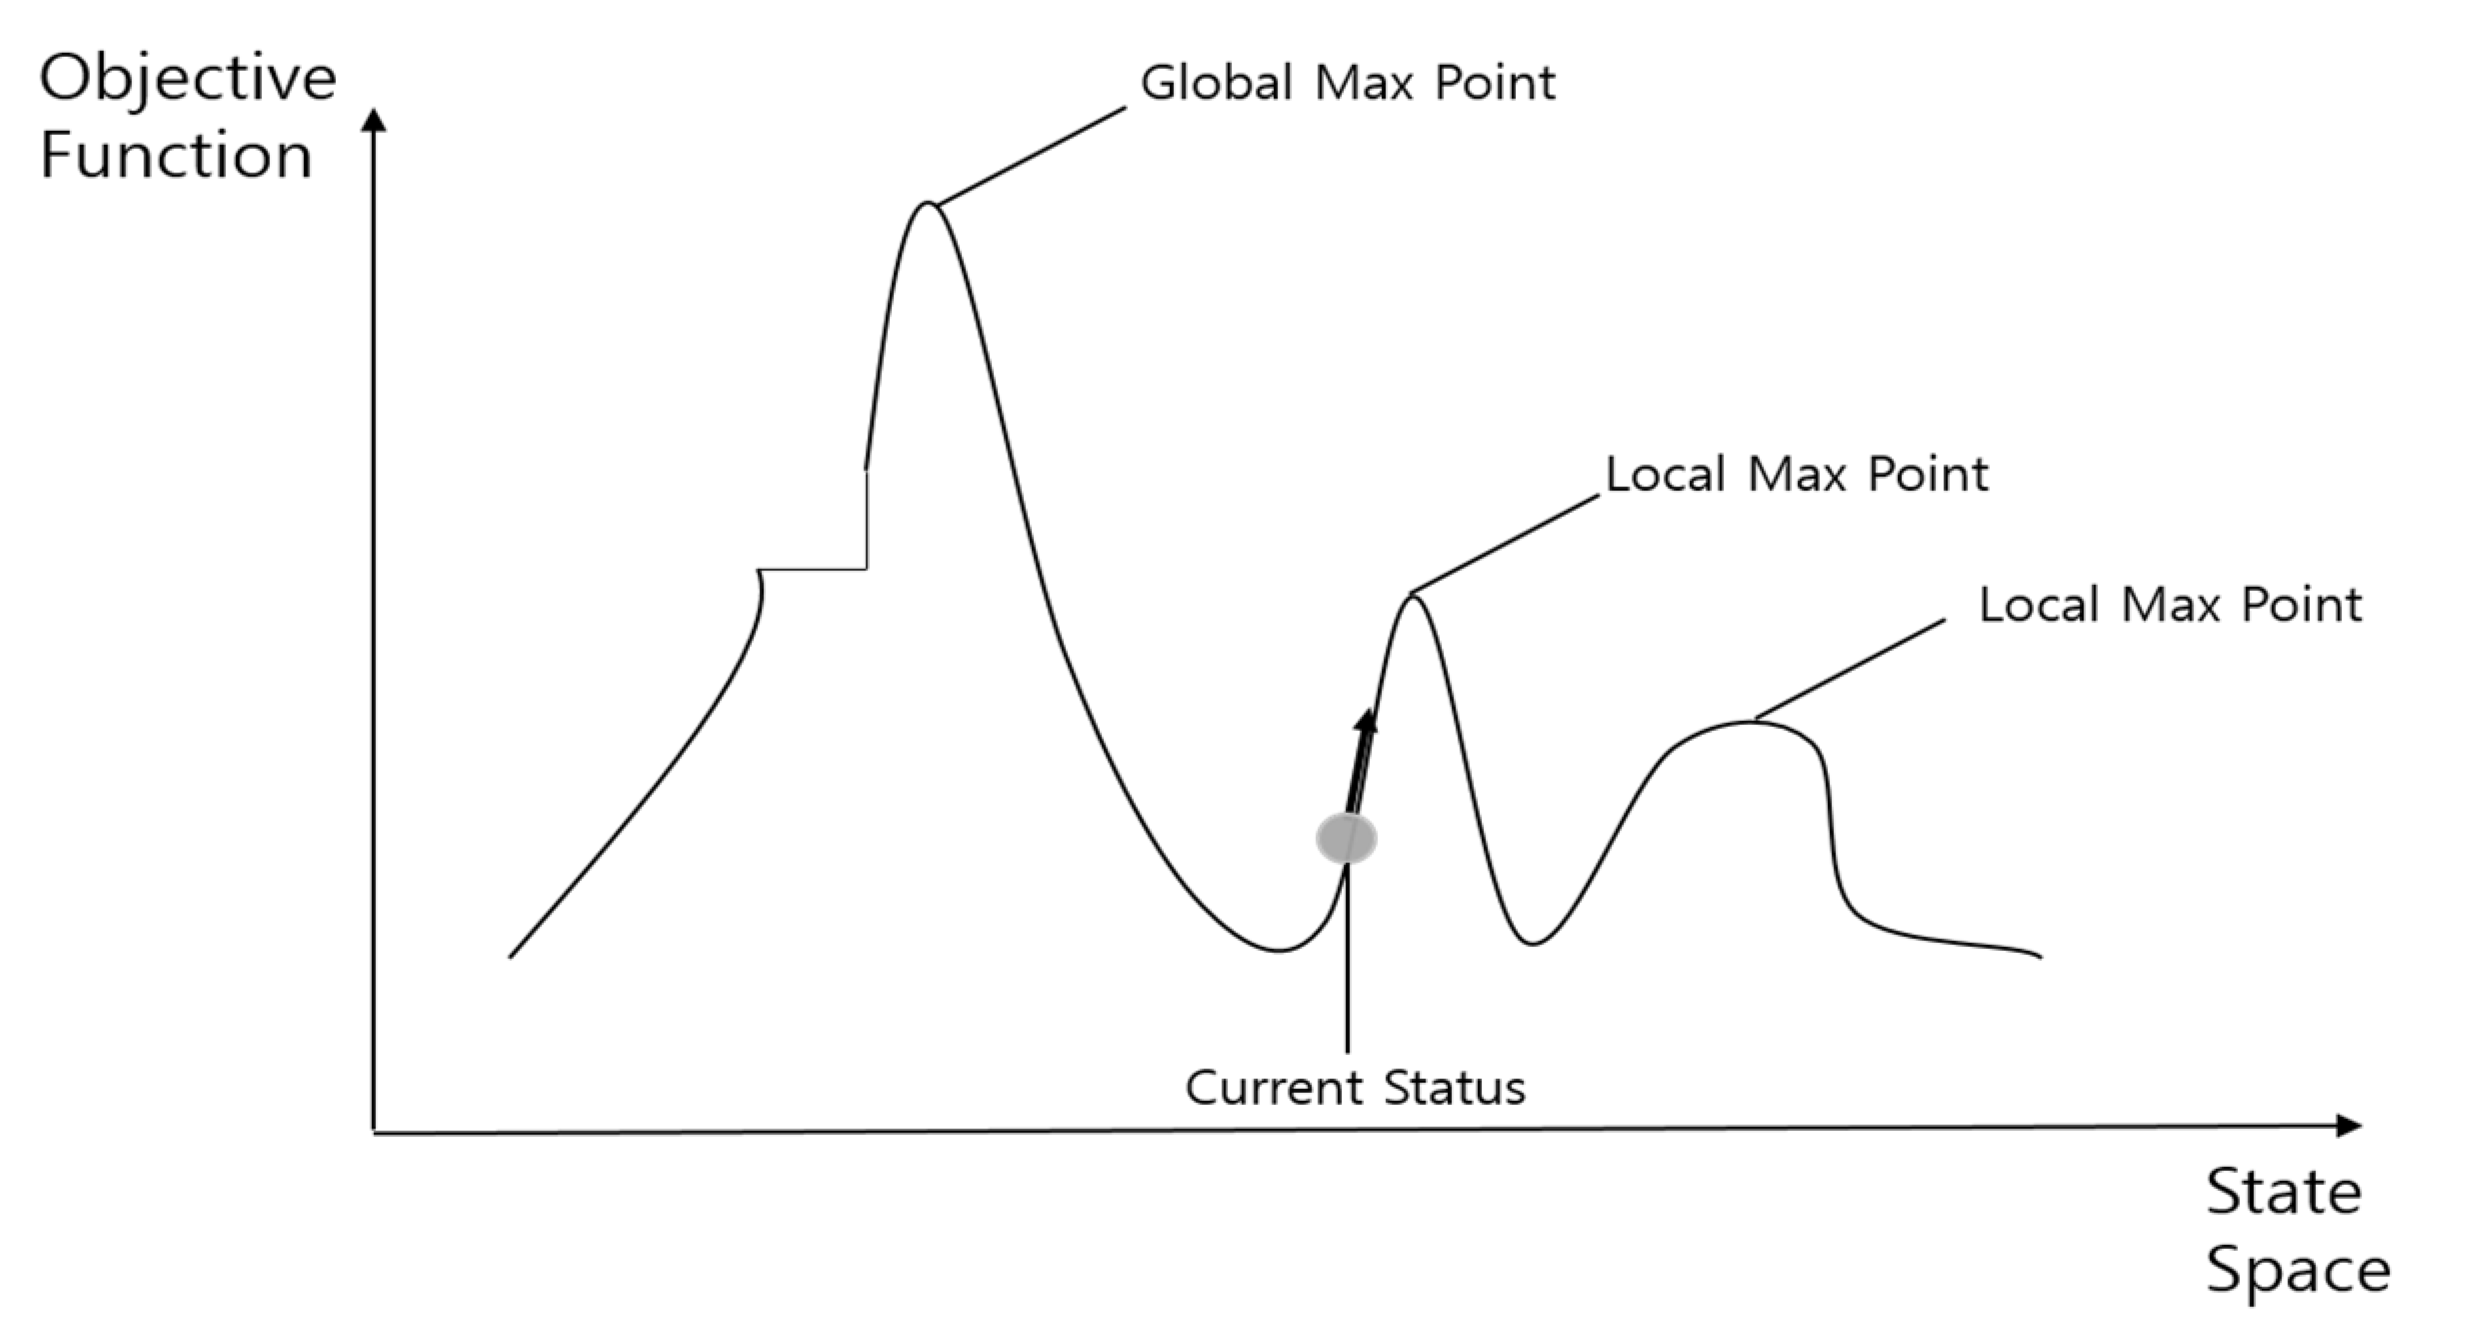
The genetic algorithm is one of the typical global optimization methods, and it is an evolutionary algorithm based on Darwin’s theory of evolution used to find the best solution with a step-by-step evolvement. This works through operators of natural population initialization, selection, crossover, and mutation [16], as in Figure 2.
In this process, data structures that represent the solutions are compared as genes, and the process of finding better solutions by transforming them is called evolution.
The typical process of a genetic algorithm is the same as in Figure 3. A group of initial solutions is employed as parameters to find the optimal solution. In general, genes are generated with random numbers to form an initial set of groups, and then the quality of solutions in the group is calculated through the fitness process. Based on this fitness, the process of selection, crossover, and mutation will create a set of solutions for the next generation. By conducting this process repeatedly, the solutions get closer to the optimal value. The genetic algorithm needs to repeat generations of reproduction and natural selection while maintaining a large population to find the optimal solution. This repetitive evolution process is concluded when the generation has achieved the target level of evolution or solution.
There have been studies that have used GA to estimate construction costs in the construction sector.
Park et al. [6] validated the performance of the genetic algorithm by comparing it with a model that calculates weights using the genetic algorithm and a model that used a method such as standardized regression coefficients and equivalent weights in the construction cost estimation field.
Lee et al. [17] improved estimative accuracy by presenting a method for calculating the attribute weights for qualitative variables when data for case-based reasoning included qualitative attributes.
Kim et al. [18] conducted a study to estimate construction costs by combining neural networks and a genetic algorithm, for instance by determining each parameter of the error-reversing neural network by genetic algorithm and implementing learning of the neural network using a genetic algorithm.
These existing studies apply the basic concept of a genetic algorithm: how to perform computations using random numbers. This means that the features of the construction project’s properties are not reflected in the seeking process for the optimized solution, and the random numbers are employed to address the solution. Additionally, creating a random value for a group of the solution faces a difficulty in finding any better solution than the current one [8].
To overcome these shortcomings, this research analyzes the correlation between each attribute of construction cost data rather than any value and applies the result values in a local search method to each generation where the genetic algorithm is in progress.

2.2.3. Local Search

Local search is a common metaheuristic method that involves searching the neighboring solution based on the current solution within the search area of the solution and making it into the optimal solution by comparing the results of the purpose function, such as Figure 4. Local search refers to changing the current solution to a near-target function within the local, rather than exploring the optimal solution for all solutions of the group like the global search method [8].
The purpose of this is to discover optimized local search continuously, and the use of the target function aims to converge the next search away from the local minimum and into a better optimal solution. Setting the target function in local search is different according to the individual problem, and the corresponding resolution varies. Local search has been successfully applied to many optimization and exploration issues, such as the vehicle path problem [19], human resources scheduling problem [20], and radio link frequency allocation problem [21].
In addition, prior research has been conducted to combine local search with other optimization methods. Hwang and Kim verified that solutions can achieve better results by combining the method of the hill-climbing search with the integer programming method, one of the local search techniques. The difference reduction method is applied for the hill-climbing search [8].
The hill climbing method in Figure 5 explains that the way to reach a high goal is to go up. Its concept is that when the state goes along the road, it will reach the highest point of any hill (local maximum) that is lower than the highest point (global maximum).
This is a way to approach the goal by reducing the difference between the current state and the target state. Specifically, this means reducing the functional difference by achieving a new current state that is closed to the target state.
This research repeats the process of creating one neighbor and resetting it as the current solution until the termination requirement, as the usual simple hill-climb search after the initial creation. The application of the local search method is part of the integer programming method as a function of the neighboring solution generation. After an experiment with the N-Queens maximization problem [22] using the applied model, it was validated that the model using local search and the integer programming method produced a better solution than other search techniques.
In addition, Kim and Choi [23] presented a scheduling problem solution with A* Algorithm, one of the best first search techniques, to prevent any deadlock in the required tasks while minimizing the total execution time. Best first search is a method to make the best path as the first visiting node according to the heuristic information about the characteristic of the problem. The reachability graph employed in this research adopted the same method of searching the smallest nodes as the best first search technique, and thus the optimal schedule could be calculated. It also validated the reduced number of node searches by 43.7% or more than the target using the existing algorithm.
The local search is effective in searching solutions and can improve the performance of the algorithm when applied within the optimization algorithm [12]. In addition, the local search is a method for local optimization, and the above-mentioned genetic algorithm is a typical method for global optimization calculation. This research combined the genetic algorithm’s global solution–space search capability and the strength of local search using the correlative analysis to calculate the weights with a hybrid genetic algorithm. Afterwards, we performed a construction cost estimation through case-based reasoning; we specifically explain the method in the following chapters.

3. Results

3.1. Determination of the Weight of Hybrid Genetic Algorithm by Local Search

This research used correlations of each attribute in the already mentioned concept of local search to determine the weight of GA–CBR. For this purpose, correlation numbers needed to be derived through correlation analysis.
There are two parts in the genetic algorithm that applied the local search method.
(a)
For the initialization of populations by the existing genetic algorithm in any number, this research improved the method of population initialization by reflecting the correlation of each attribute in the existing population.
(b)
The next-generation evolution was carried out by reflecting the correlation coefficient calculated for each gene in the immediately preceding evolution of the generation within the genetic algorithm. Unlike conventional genetic algorithms, these two can reflect the properties of construction properties in the algorithm by applying correlation factors in calculating weights and expect a good performance by applying correlations of each attribute, rather than a random number.

3.1.1. Correlation Analysis

In this study, the project data on public apartments, military facilities (barracks), and office buildings were collected and used for the development of a model using a hybrid genetic algorithm combining a genetic algorithm and local search methods based on correlation analysis. The collected construction cost data, which were not used for the development of the model, were used for the model validation.
Construction project attribute information available at the design stage was collected and used to estimate construction costs. Samples of attribute information on the project data are shown in Table 1, Table 2 and Table 3 for each case.
Correlation analysis was performed between independent variables (total construction costs) and dependent variables (other attributes) among each attribute of the data to perform a local search. The local search was conducted using the computed correlation coefficient, and the optimized weight was calculated by combining it with the genetic algorithm. Pearson correlation is the covariance of the two variables divided by the product of the standard deviation, and the application is as shown in Equation (1) [24]:
P = i = 1 M ( X i     X ¯ ) ( Y i     Y ¯   ) i = 1 M ( X i     X ¯ ) 2 ( Y i     Y ¯   ) 2
where: X i ,   Y i   are i th sample value of X and Y variables, X ¯ ,   Y ¯ are value of X and Y variables.

3.1.2. Public Apartments (Case 1)

The Case 1 public apartments data used in this research were nine apartment complexes ordered by Construction A company in Korea. A total of 165 public apartment project data were collected for this study. There were 12 data attributes, including the number of generations, floor space, elevator numbers, and construction costs. Each attribute’s information and its corresponding correlation is as follows in Table 1.
The analysis found that the four attributes, X1 (number of households), X2 (gross floor area), X3 (number of unit floor households), and X5 (number of floors) had a correlation with the total construction cost of 0.5 or more, and that the correlation was high at about 0.83, 0.97, 0.69, and 0.72.
Conversely, X4 (number of elevators), X7 (number of households per elevator), X9 (depth of feet), and X11 (hallway type) had a correlation of less than 0.5 and represented about 0.38, 0.45, 0.016, and 0.41, respectively, with relatively low correlation.

3.1.3. Facilities (Barracks) (Case 2)

The project data in Case 2 was for direct construction of the barracks, and the number of attributes was nine, including the number of capacity, number of floors, office area, and so on, and the total number of project data was 117. Each piece of attribute information and its corresponding correlation is as follows in Table 2.
The analysis showed that the attributes of X1 (number of capacity), X3 (gross floor area), and X4 (Building area) were related to the total construction cost at 0.7 or higher, and that the correlation was high at about 0.82, 0.98, and 0.93. Conversely, X5 (room area), X6 (office area), and X7 (Basement floor status) had a correlation of less than 0.3 and represented about 0.02, 0.21, and 0.29, respectively, and found relatively low correlation.

3.1.4. Office Buildings (Case 3)

The data in Case 3 were collected from general offices among the project types of public workspace data from the Public Procurement Service Center. A total of 52 office building project data were collected for this study. The 10 attributes of the office buildings’ data were factors such as land area, number of underground floors, number of ground floors, floor space rate, and construction cost. Each piece of attribute information and its corresponding correlation was as follows in Table 3.
The analysis found that the four attributes, X2 (gross floor area), X5 (number of underground floors), X6 (number of ground floors), and X7 (structural type: RC) had a relatively high correlation with the total construction cost, with about 0.25, 0.22, 0.24, and 0.27. In contrast, the X3 (building coverage ratio) and X4 (floor area ratio) were less than 0.04, representing about 0.005 and 0.033, respectively, and the correlation was relatively low.
Correlation analysis of the data in Case 1, Case 2, and Case 3 shows a common high coefficient of gross floor area. The computed correlation between attributes as used as a function of the purpose of the local search technique and was reflected in the form of multiplying the population and generation (weights) within the genetic algorithm process.

3.1.5. Application of Local Search

In general, random number generators were used for the process of creating the first chromosome generation during the initialization of populations in a genetic algorithm. This population initialization process is the process that forms the computation of the problem. The genetic algorithm will search and can affect the performance and efficiency of the genetic algorithm depending on the configuration of the placement of each chromosome in space [25]. This research, therefore, proceeded with the initialization of an improved population that reflects the correlation of each attribute in the existing initialized population in order to enhance the performance of the genetic algorithm.
The application for population initialization is as shown in Equation (2):
P i = R i * C i
where: P i   is i th value of new population, R i is i th value of the random number group, C i is i th value of the correlation number group
The first generation to be created through the above process carries out a genetic algorithm, improve the group by reflecting correlations in the genes (weights by attributes) extracted through each operator (selection, crossover, variation) by local search.
As shown in Figure 6, a set of weights is produced through a generation of operators such as fitness assessment and selection, crossover, and mutation. The sequence involves extracting the correlation coefficient of each attribute in the data, then multiplying the attribute’s weight value. It then evolves to the next generation and repeats the same process to generate the optimum weight.
After that, hybrid genetic algorithm with local search method found a better solution as generation evolved. Figure 6 shows the whole process of adding the local search algorithm to the existing GA. Output of existing GA process is the weight set. After that, the newly updated weight set is finally obtained by the local search process, which is calculated by the correlation coefficients derived in advance and the weight set from pure GA.
Through the local search process, the weights of attributes were updated compared to the previous weight set, in a way such that the attributes with relatively larger correlation had lower weight, while keeping the sum of the weights equal to 1. Equation (3) shows the calculation formula for reflecting the correlation coefficient in the generational weights.
An Equation (3) shows the calculation formula for reflecting the correlation coefficient in the generational weights:
P i = X i * C i
where: P i   is i th value of new population, X i is i th value of the previous generation gene group, C i is i th value of the correlation number group
Genetic algorithms were implemented based on the initialized population and evolving generations in the same way to reflect the correlation of each attribute in each generation until the solution converges within a certain range. The population and each generation were improved to reflect project property information by applying data attribute correlations. This improved hybrid genetic algorithm was used to calculate weights and to apply them to the case-based reasoning construction cost estimation model.

3.2. Development of Cost Estimating Model

The construction cost estimation model of this research represents the process of using case-based reasoning to extract past examples similar to the estimation target from the data set. The case-based reasoning in this research used the K-nearest neighbors (K-NN) method for the retrieve phase [7]. KNN is a methodology for estimating new data by extracting the k neighbors closest in existing data [6]. The process of developing a construction cost estimation model was as follows. First, the weights were calculated using a hybrid genetic algorithm with correlative numbers. Second, the construction cost estimation model was developed by combining attribute similarity and attribute weight to calculate case similarity.

3.2.1. Weighted Value Calculation

To determine the extent to which cases are similar, the degree of difference between cases and the attribute weight must be determined. As described in Section 3, this research used a hybrid genetic algorithm by applying the correlation coefficient of each attribute in construction cost data for optimal weighting. The ratio of operators (elite survival, selection, crossover, and mutation) of hybrid genetic algorithm was applied at 5%, 40%, 50%, and 5%, respectively, while generations repeated 100 generations to perform the algorithm.

3.2.2. Case Similarity

The data used in this research were divided into qualitative and quantitative data, and to quantitatively determine the degree of similarity between attributes, a method of measuring the distance of cases based on Euclidian distance was used [26]. The Euclidian Distance measuring method is often used to find similarities between two objects by these attributes if they have multiple attributes in the field of artificial intelligence.
As mentioned above, the score of the case similarity was obtained by multiplying the attribute weight by the similarity between each attribute calculated using this distance formula by the sum of the attribute weights and the used Equation (4):
Similarity of case
i ( x i ,   x j ) = [ 1 i = 1 n w r 2 a r ( x i )   a r ( x j )   i = 1 n w r 2 ]
where: w i     is weight of r th attribute, a r   ( x i   ) is r th property value i th case, a r   ( x j   ) is r th case value of estimation.
After measuring the similarity in each case, the scores were then drawn in a high order, with either single or multiple similar cases. In this research, multiple similar cases were extracted from three higher scores and the construction cost estimation model was learned.

4. Discussion

4.1. Experimental Results

From the three cases of data collected to verify the construction cost estimation model in this research, 30%of the total number of data were validated, excluding 70%of the data used in the development of the model.
For Case 1, 113 (70%) of the 165 total data were used to develop the model as a training set, and 52 (30%) test sets were used for model verification. For Case 2, 82 of the 117 total data were used as a training set, and 35 were used as a test set. For Case 3, 36 of the 52 total data were used as a training set, and 16 were used as a test set. All training sets and test sets were randomly selected.
The performance of the construction cost estimation model shows the difference between the actual construction cost and the estimated cost, divided by the actual construction cost, and the error rate was obtained. In addition, to determine the validity of the model, we compared the error rates of each construction cost estimation model carried out by the hybrid genetic algorithm, existing genetic algorithm, the uniform weighting method, and the regression method in this research.
Table 4 is the value of the attribute weight resulting from the weighting calculation of each methodology in Case 1, Case 2, and Case 3, and the mean of error for the case-based reasoning, to estimate the cost of construction [17].
From Case 1, when the methodology of this research was applied, the weighting of X2 (gross floor area) was the highest at 0.87 among the optimized attributes. Case-based reasoning was used to extract similar cases and to estimate the cost of construction using optimal weights, resulting in a mean error rate of 4.73% for each case.

4.2. Model Verification

In the same way, Case 2 showed the highest weighting value of X3 (gross floor area) at about as 0.92, and the mean error rate of 8.72 was obtained as a result of the construction cost estimation.
For Case 3, the property weight value of X7 (structural type: SRC) was the highest at 0.43 with a mean error rate of 7.67%. When comparing this with the estimated accuracy of estimates defined by the American Association of Cost Engineers (AACE) by categorizing the project into five levels according to the amount of information the project has, the estimated accuracy of AACE was shown to be superior to that of AACE when under-measuring −20% and +30% when over-measuring the project [27].
In addition, to review the validity of the method of calculating weights in this research, we compared the estimation models of the four methods: the hybrid GA–CBR, the existing GA–CBR, the uniform weight method, and the regression method (Table 5). Additionally, the meaning of error mean was the average value of the test set error (%) estimated by the case-based reasoning.
As a result, the mean error rate of the construction cost estimation model was shown in Case 1 (APT) in the order of the hybrid GA–CBR/existing GA–CBR/uniform weighted method/regression method, with a mean error of 4.73/8.25/11.18/8.76. Case 2(Military) was shown as 8.72/14.87/19.24/9.03, and Case 3 (Office) was shown as 7.67/8.00/10.94/8.82. This allows us to determine that the estimative model developed in this research represents a higher accuracy than the estimation model using different weighting methods.
To show the difference between the mean of actual construction cost and the estimation cost, the model’s estimation results are as shown in Figure 7. As can be seen in the graph, the hybrid GA–CBR presented in this research was most similar to the actual construction cost in each case, respectively, than in other methodologies. The resulting estimated error rate is shown in Figure 8, which also indicated that the methodology of this research had the lowest mean error.

5. Conclusions

The accuracy of the case-based reasoning model is heavily influenced by the allocation of weights for each attribute. In the previous GA–CBR construction cost estimation model, random numbers and operators within the genetic algorithm were used to calculate weights.
However, this method is limited to deducing the solution as the equation, and it is hard to find a better solution considering the current status. To address these limitations, this research developed the process by combining local search methods with correlations in the calculating attribute weights using a genetic algorithm.
Subsequently, the construction costs estimation model based on case-based reasoning was developed by calculating attribute weights through an improved hybrid genetic algorithm based on actual data. Validation of the model shows better performance than existing models such as the general GA–CBR, the uniform weight method, and the regression method. Additionally, the mean error rate of the construction cost estimation model was shown in Case 1 (APT) in the order of the hybrid GA–CBR/existing GA–CBR/uniform weighted method/regression method, with a mean error of 4.73/8.25/11.18/8.76. Case 2 (Military) was shown as 8.72/14.87/19.24/9.03, and Case 3 (Office) was shown as 7.67/8.00/10.94/8.82, which are judged to be more accurate than the estimation accuracy of the AACE.
Compared to the existing case-based Reasoning research with the basic genetic algorithm, this research has improved performance by applying a hybrid generic algorithm combined with the local search.
In addition, the knowledge of the existing domain can influence as a factor in the method of calculating optimal weight by applying the correlation coefficient between the attribute and construction cost in the local search process.
Despite these accurate and explanatory research results, the research has the limitation that can cause rapid convergence to fall into local optimality due to the nature of the suggested local search methods.
Future research is expected to develop improved local search method to utilize other models together to complement these limitations.

Author Contributions

Conceptualization: S.J.; methodology: I.Y. and S.J.; validation: S.J.; formal analysis: I.Y.; investigation: M.P.; resources: H.-S.L.; data curation: J.-H.P.; writing—original draft preparation: S.J.; writing—review and editing: J.R.; supervision: M.P. All authors have read and agreed to the published version of the manuscript.

Funding

This work was supported by the Technology Innovation Program (10077606, To Develop an Intelligent Integrated Management Support System for Engineering Project) funded by the Ministry of Trade, Industry & Energy (MOTIE, Korea).

Acknowledgments

The authors would also thanks to Ministry of Trade, Industry & Energy Government of Korea, Technology Innovation Program, Korea Evaluation Institute of Industrial Technology for supporting this research.

Conflicts of Interest

The authors declare no conflict of interest. The funders had no role in the design of the study; in the collection, analyses, or interpretation of data; in the writing of the manuscript; or in the decision to publish the results.

References

  1. Trost, S.M.; Oberlender, G.D. Predicting accuracy of early cost estimates using factor analysis and multivariate regression. J. Constr. Eng. Manag. 2003, 129, 198–204. [Google Scholar] [CrossRef]
  2. An, S.H.; Kang, K.I. A study on predicting construction cost of apartment housing using experts’ knowledge at the early stage of projects. J. Archit. Inst. Korea 2005, 21, 81–88. [Google Scholar]
  3. Kolodner, J. Case-Based Reasoning; Morgan Kaufmann: Middlesex County, MA, USA, 2014; ISBN 1483294498. [Google Scholar]
  4. Goh, Y.M.; Chua, D.K.H. Case-based reasoning for construction hazard identification: Case representation and retrieval. J. Constr. Eng. Manag. 2009, 135, 1181–1189. [Google Scholar] [CrossRef]
  5. Doğan, S.Z.; Arditi, D.; Günaydın, H.M. Determining attribute weights in a CBR model for early cost prediction of structural systems. J. Constr. Eng. Manag. 2006, 132, 1092–1098. [Google Scholar] [CrossRef] [Green Version]
  6. Park, M.-S.; Seong, K.-H.; Lee, H.-S.; Ji, S.-H.; Kim, S.-Y. Schematic cost estimation method using case-based reasoning: Focusing on determining attribute weight. Korean J. Constr. Eng. Manag. 2010, 11, 22–31. [Google Scholar] [CrossRef] [Green Version]
  7. Lee, H.-S.; Kim, E.; Kim, D. Pattern Recognition System Combining KNN rules and New Feature Weighting algorithm. J. Inst. Electron. Eng. Korea CI 2005, 42, 43–50. [Google Scholar]
  8. Hwang, J.-H.; Kim, S.-Y. Integer programming-based local search technique for linear constraint satisfaction optimization Problem. J. Korea Soc. Comput. Inf. 2010, 15, 47–55. [Google Scholar] [CrossRef]
  9. Hwang, J.-H. An Integration of Local Search and Constraint Programming for Solving Constraint Satisfaction Optimization Problems. J. Korea Soc. Comput. Inf. 2010, 15, 39–47. [Google Scholar] [CrossRef]
  10. Kang, M.-G.; Park, S.-W.; Im, S.-J.; Kim, H.-J. Parameter calibrations of a daily rainfall-runoff model using global optimization methods. J. Korea Water Resour. Assoc. 2002, 35, 541–552. [Google Scholar] [CrossRef] [Green Version]
  11. Burke, E.K.; Curtois, T.; Post, G.; Qu, R.; Veltman, B. A hybrid heuristic ordering and variable neighbourhood search for the nurse rostering problem. Eur. J. Oper. Res. 2008, 188, 330–341. [Google Scholar] [CrossRef] [Green Version]
  12. Qu, R.; He, F. A Hybrid Constraint Programming Approach for Nurse Rostering Problems. In Proceedings of the International Conference on Innovative Techniques and Applications of Artificial Intelligence; Springer: London, UK, 2008; pp. 211–224. [Google Scholar]
  13. Oh, I.-S.; Lee, J.-S.; Moon, B.-R. Hybrid genetic algorithms for feature selection. IEEE Trans. Pattern Anal. Mach. Intell. 2004, 26, 1424–1437. [Google Scholar] [PubMed] [Green Version]
  14. Aamodt, A.; Plaza, E. Case-based reasoning: Foundational issues, methodological variations, and system approaches. AI Commun. 1994, 7, 39–59. [Google Scholar] [CrossRef]
  15. Kim, B.; Hong, T. Revised case-based reasoning model development based on multiple regression analysis for railroad bridge construction. J. Constr. Eng. Manag. 2012, 138, 154–162. [Google Scholar] [CrossRef]
  16. Benesty, J.; Chen, J.; Huang, Y.; Cohen, I. Pearson Correlation Coefficient. In Noise Reduction in Speech Processing; Springer: Berlin/Heidelberg, Germany, 2009; pp. 1–4. [Google Scholar]
  17. Goldberg, D.E. Messy genetic algorithms: Motivation, analysis, and first results. Complex Syst. 1989, 3, 493–530. [Google Scholar]
  18. Lee, H.-S.; Kim, S.-Y.; Park, M.-S.; Ji, S.-H.; Seong, K.-H.; Pyeon, J.-H. A method of assigning weight values for qualitative attributes in CBR cost model. Korean J. Constr. Eng. Manag. 2011, 12, 53–61. [Google Scholar]
  19. Kim, G.H.; An, S.H.; Cho, H.K. Comparison of the Accuracy between Cost Prediction Models Based on Neural Network and Genetic Algorithm: Focused on Apartment Housing Project Cost. J. Archit. Inst. Korea 2006, 23, 111–118. [Google Scholar]
  20. De Backer, B.; Furnon, V.; Prosser, P.; Kilby, P.; Shaw, P. Local Search in Constraint Programming: Application to the Vehicle Routing Problem. In Proceedings of the Proc. CP-97 Workshop Indust. Constraint-Directed Scheduling; Schloss Hagenberg Austria: Hagenberg im Mühlkreis, Austria, 1997; pp. 1–15. [Google Scholar]
  21. Lau, T.L.; Tsang, E.P.K. Solving the Processor Configuration Problems with a Mutation-Based Genetic Algorithm. Int. J. Artif. Intell. Tools 1997, 6, 567–585. [Google Scholar] [CrossRef]
  22. Paredis, J. Genetic State-Space Search for Constrained Optimization Problems. In Proceedings of the IJCAI; Citeseer: Chambéry, France, 1993; pp. 967–973. [Google Scholar]
  23. Kim, H.-H.; Choi, J.-Y. An Efficient Search Algorithm for Flexible Manufacturing Systems (FMS) Scheduling Problem with Finite Capacity. IE Interfaces 2009, 22, 10–16. [Google Scholar]
  24. Zhou, H.; Deng, Z.; Xia, Y.; Fu, M. A new sampling method in particle filter based on Pearson correlation coefficient. Neurocomputing 2016, 216, 208–215. [Google Scholar] [CrossRef]
  25. Maaranen, H.; Miettinen, K.; Penttinen, A. On initial populations of a genetic algorithm for continuous optimization problems. J. Glob. Optim. 2007, 37, 405. [Google Scholar] [CrossRef]
  26. Ji, S.-H.; Park, M.-S.; Lee, H.-S.; Seong, K.-H.; Yoon, Y.-S. Method of Quantity Data Analysis for Building Construction Cost Estimation: Focusing on Finish Work of Public Apartment Project. Korean J. Constr. Eng. Manag. 2008, 9, 235–243. [Google Scholar]
  27. Christensen, P.; Dysert, L.R. Cost Estimate Classification System. In AACE International Recommended Practice 17R–97; AACE: Durham, NH, USA, 1997. [Google Scholar]
Figure 1. Case-based reasoning process.
Sustainability 12 07920 g001
Figure 2. Search scope of global optimized solution (Genetic Algorithm).
Sustainability 12 07920 g002
Figure 3. General genetic algorithm process.
Sustainability 12 07920 g003
Figure 4. Search scope of local optimized solution.
Sustainability 12 07920 g004
Figure 5. Hill climbing search.
Sustainability 12 07920 g005
Figure 6. Genetic algorithm with local search in this research.
Sustainability 12 07920 g006
Figure 7. Comparison of actual and estimated cost of construction by methodology.
Sustainability 12 07920 g007
Figure 8. Comparison of mean error rate between actual and estimated construction costs by methodology.
Sustainability 12 07920 g008
Table 1. Information of Case 1 attributes.
NoAttributesTypeCorrelation Coefficient
X1Number of householdsNumeric0.8336
X2Gross floor area Numeric0.9701
X3Number of unit floor householdsNumeric0.6952
X4Number of elevatorsNumeric0.3865
X5Number of floorsNumeric0.7290
X6Number of pilots with household scaleNumeric0.4854
X7Number of households of unit floor per elevatorNumeric0.4556
X8Height between storiesNumeric0.5171
X9Depth of pitNumeric0.0166
X10Roof typeFlat or inclined (1 or 0)0.4296
X11Hallway typeHall or corridor (1 or 0)0.4135
X12CostNumeric1
Table 2. Information of Case 2 attributes.
NoAttributesTypeCorrelation Coefficient
X1Number of capacityNumeric0.8263
X2Number of floorsNumeric0.6830
X3Gross floor area Numeric0.9814
X4Building areaNumeric0.9306
X5Room areaNumeric0.0295
X6Office areaNumeric0.2108
X7Basement floor statusExistence or
Non(1 or 0)
0.2936
X8Pit statusExistence or
Non(1 or 0)
0.4160
X9CostNumeric1
Table 3. Information of Case 3 attributes.
NoAttributesTypeCorrelation Coefficient
X1Lot AreaNumeric0.1905
X2Gross floor area Numeric0.2512
X3Building Coverage RatioNumeric0.0057
X4Floor Area RatioNumeric0.0333
X5Number of Underground FloorNumeric0.2278
X6Number of Ground FloorNumeric0.2434
X7Structure Type(RC)Existence or
Non(1 or 0)
0.2717
X8Structure Type(SRC)Existence or
Non(1 or 0)
0.0965
X9External MaterialMetal or
Stone(1 or 0)
0.0518
X10CostNumeric1
Table 4. Weight set and error rate according to method.
MethodologyX1X2X3X4X5X6X7X8X9X10X11X12Error Rate (%)
Case1
(APT)
Hybrid GA–CBR0.10510.87410.00390.000320.00490.00060.00050.00082.571 × 10−80.00040.00040.00864.73
Existing
GA–CBR
0.12540.14790.04120.014470.14200.00790.14170.13250.00770.04200.13350.06318.25
Uniform
Weight
0.08330.08330.08330.08330.08330.08330.08330.08330.08330.08330.08330.083311.18
Regression
Analysis
0.0020.00050.09030.25430.07420.02400.0800.04830.02370.08290.09710.22108.76
Case2
(Military)
Hybrid GA–CBR0.00240.00030.92450.07262.607 × 10−151.785 × 10−82.600 × 10−74.485 × 10⁻⁶ 8.72
Existing
GA–CBR
0.16320.15400.18110.19310.09950.07120.02890.1091 14.87
Uniform
Weight
0.1250.1250.1250.1250.1250.1250.1250.125 19.24
Regression
Analysis
0.00140.31120.00140.00150.2160.19170.07210.204 9.03
Case3
(Office)
Hybrid GA–CBR0.07170.11462.865 × 10−60.00040.11160.24540.43090.01490.0004 7.67
Existing
GA–CBR
0.07730.21550.07590.07320.22910.07390.11670.13790.0005377 8.00
Uniform
Weight
0.1110.1110.1110.1110.1110.1110.1110.1110.111 10.94
Regression
Analysis
2.99 × 10−65.42 × 10−68.53 × 10−50.08950.02540.37100.43050.02140.0618 8.82
Table 5. Case comparison of actual construction cost per estimating models.
Hybrid GA–CBRExisting GA–CBRUniform WeightRegression Analysis
CaseActual Cost
(Unit: USD)
Estimated CostError
(%)
Estimated CostError
(%)
Estimated CostError
(%)
Estimated CostError
(%)
A14,041,7593,461,23814.363,194,99420.953,308,64918.143,708,8318.24
A22,480,7682,368,2514.542,932,60218.213,263,49131.552,299,0107.33
A32,616,2442,697,0743.093,718,77042.143,718,77042.142,578,8021.43
A43,009,0743,065,3331.872,985,2770.792,921,4672.913,318,27910.28
A512,935,5102,819,1283.962,985,2771.73,104,6375.763,562,27121.35
A522,348,7072,368,2510.833,040,76429.473,040,76429.471,869,97920.38
Error mean4.738.2511.188.76
M11,905,9691,683,48111.671,828,7684.051,821,2004.451,737,4908.84
M2839,159855,0921.9866,9643.31855,0921.9744,61411.27
M3664,576703,0045.78617,6597.06564,14415.11617,6597.06
M4904,227941,9194.17870,5803.72855,0925.43744,61417.65
M34523,213517,3091.13516,8581.21505,0493.47574,0719.72
M35490,932506,2633.12497,3591.31497,3591.31497,3591.31
Error mean8.7214.8719.249.03
O1474,186562,94418.72511,2117.81514,6798.54589,46724.31
O2655,188481,88926.45490,87725.08482,22026.4492,87424.77
O3438,030414,9945.26455,6454.02577,41531.82533,21921.73
O5390,990458,64117.3405,1703.63423,0638.2441,95513.04
O15422,950492,87416.53498,36517.83522,70923.59492,87416.53
O16538,911591,3149.72591,3149.72541,8030.54591,3149.72
Error mean7.678.0010.948.82
Case A: Apartment, Case M: Military, Case O (Office).

