1. Introduction
According to World Hunger Statistics, about 1 in 9 people globally do not have enough food to lead a healthy active life. The situation can be even worse in the future with the fast-growing world population. The 2050 world population is estimated at 9 billion and it requires a 70% increase in food production to meet people’s demands for food [
1]. Despite the precious value of food, it is estimated that a quarter to one-third of food produced for human consumption is lost or wasted. This makes food loss and waste (FLW) a hot research topic, especially during the last five years (e.g., Fiore et al. [
2], Fiore et al. [
3], Spada et al. [
4], Adamashvili et al. [
5], Pellegrini et al. [
6], Vittuari et al. [
7], Vittuari et al. [
8], Pagani et al. [
9], Ishangulyyev et al. [
10]). FLW does not only escalate the issue of food security but also significantly contributes to anthropogenic greenhouse gas (GHG) emissions; many, including Springmann et al. [
11], estimated that “halving food loss and waste would reduce environmental pressures by 6–16% compared with the baseline projection”. Based on expected production volumes and global dietary changes, Hiç et al. [
12] estimated that in 2050 the global FLW-associated GHG emissions in the production phase only will equal the total GHG emissions of the US in 2011. Therefore, FLW is also a serious problem related to climate change.
Given the importance of the topic, efforts have been made for quantifying FLW and associated GHG emissions to provide data-based decision support. However, much of the existing literature just focuses on a limited set of chain stages and specific countries with limited detailing of food commodities [
13]. For example, the studies by Quested et al. [
14], Wenlock and Buss [
15], and Wenlock et al. [
16] limited the scope to the household level. Buzby and Hyman [
17] and Kantor et al. [
18] studied FLW in the US downstream supply chain stages.
Xue et al. [
19] conducted a literature review on FLW-related studies. They find that existing studies’ spatial coverage is quite limited, with a strong focus on the developed world (e.g., Kling [
20], Harrington et al. [
21], Engström and Carlsson-Kanyama [
22], Williams et al. [
23], Leal Filho and Kovaleva [
24]). Moreover, existing studies emphasize the retail and consumer stages but overlook the upstream food supply chain (e.g., Hodges et al. [
25], Fehr and Romão [
26], Jones [
27], Loke and Leung [
28], Stenmarck et al. [
29]). Those studies generate useful information on FLW in the specific country and food commodity combinations but fail to show a bigger picture on the super-nation scales with a holistic commodity and chain coverage. Other relevant studies to address the FLW quantification issues in a partial way include Åhnberg and Strid [
30], Beretta et al. [
31], Caldeira et al. [
32], and Lanfranchi et al. [
33], etc.
In addition to the aforementioned country and chain stage-specific studies, limited research has been conducted at continental and global levels with a comprehensive geographical and commodity coverage (hereafter called comprehensive studies).
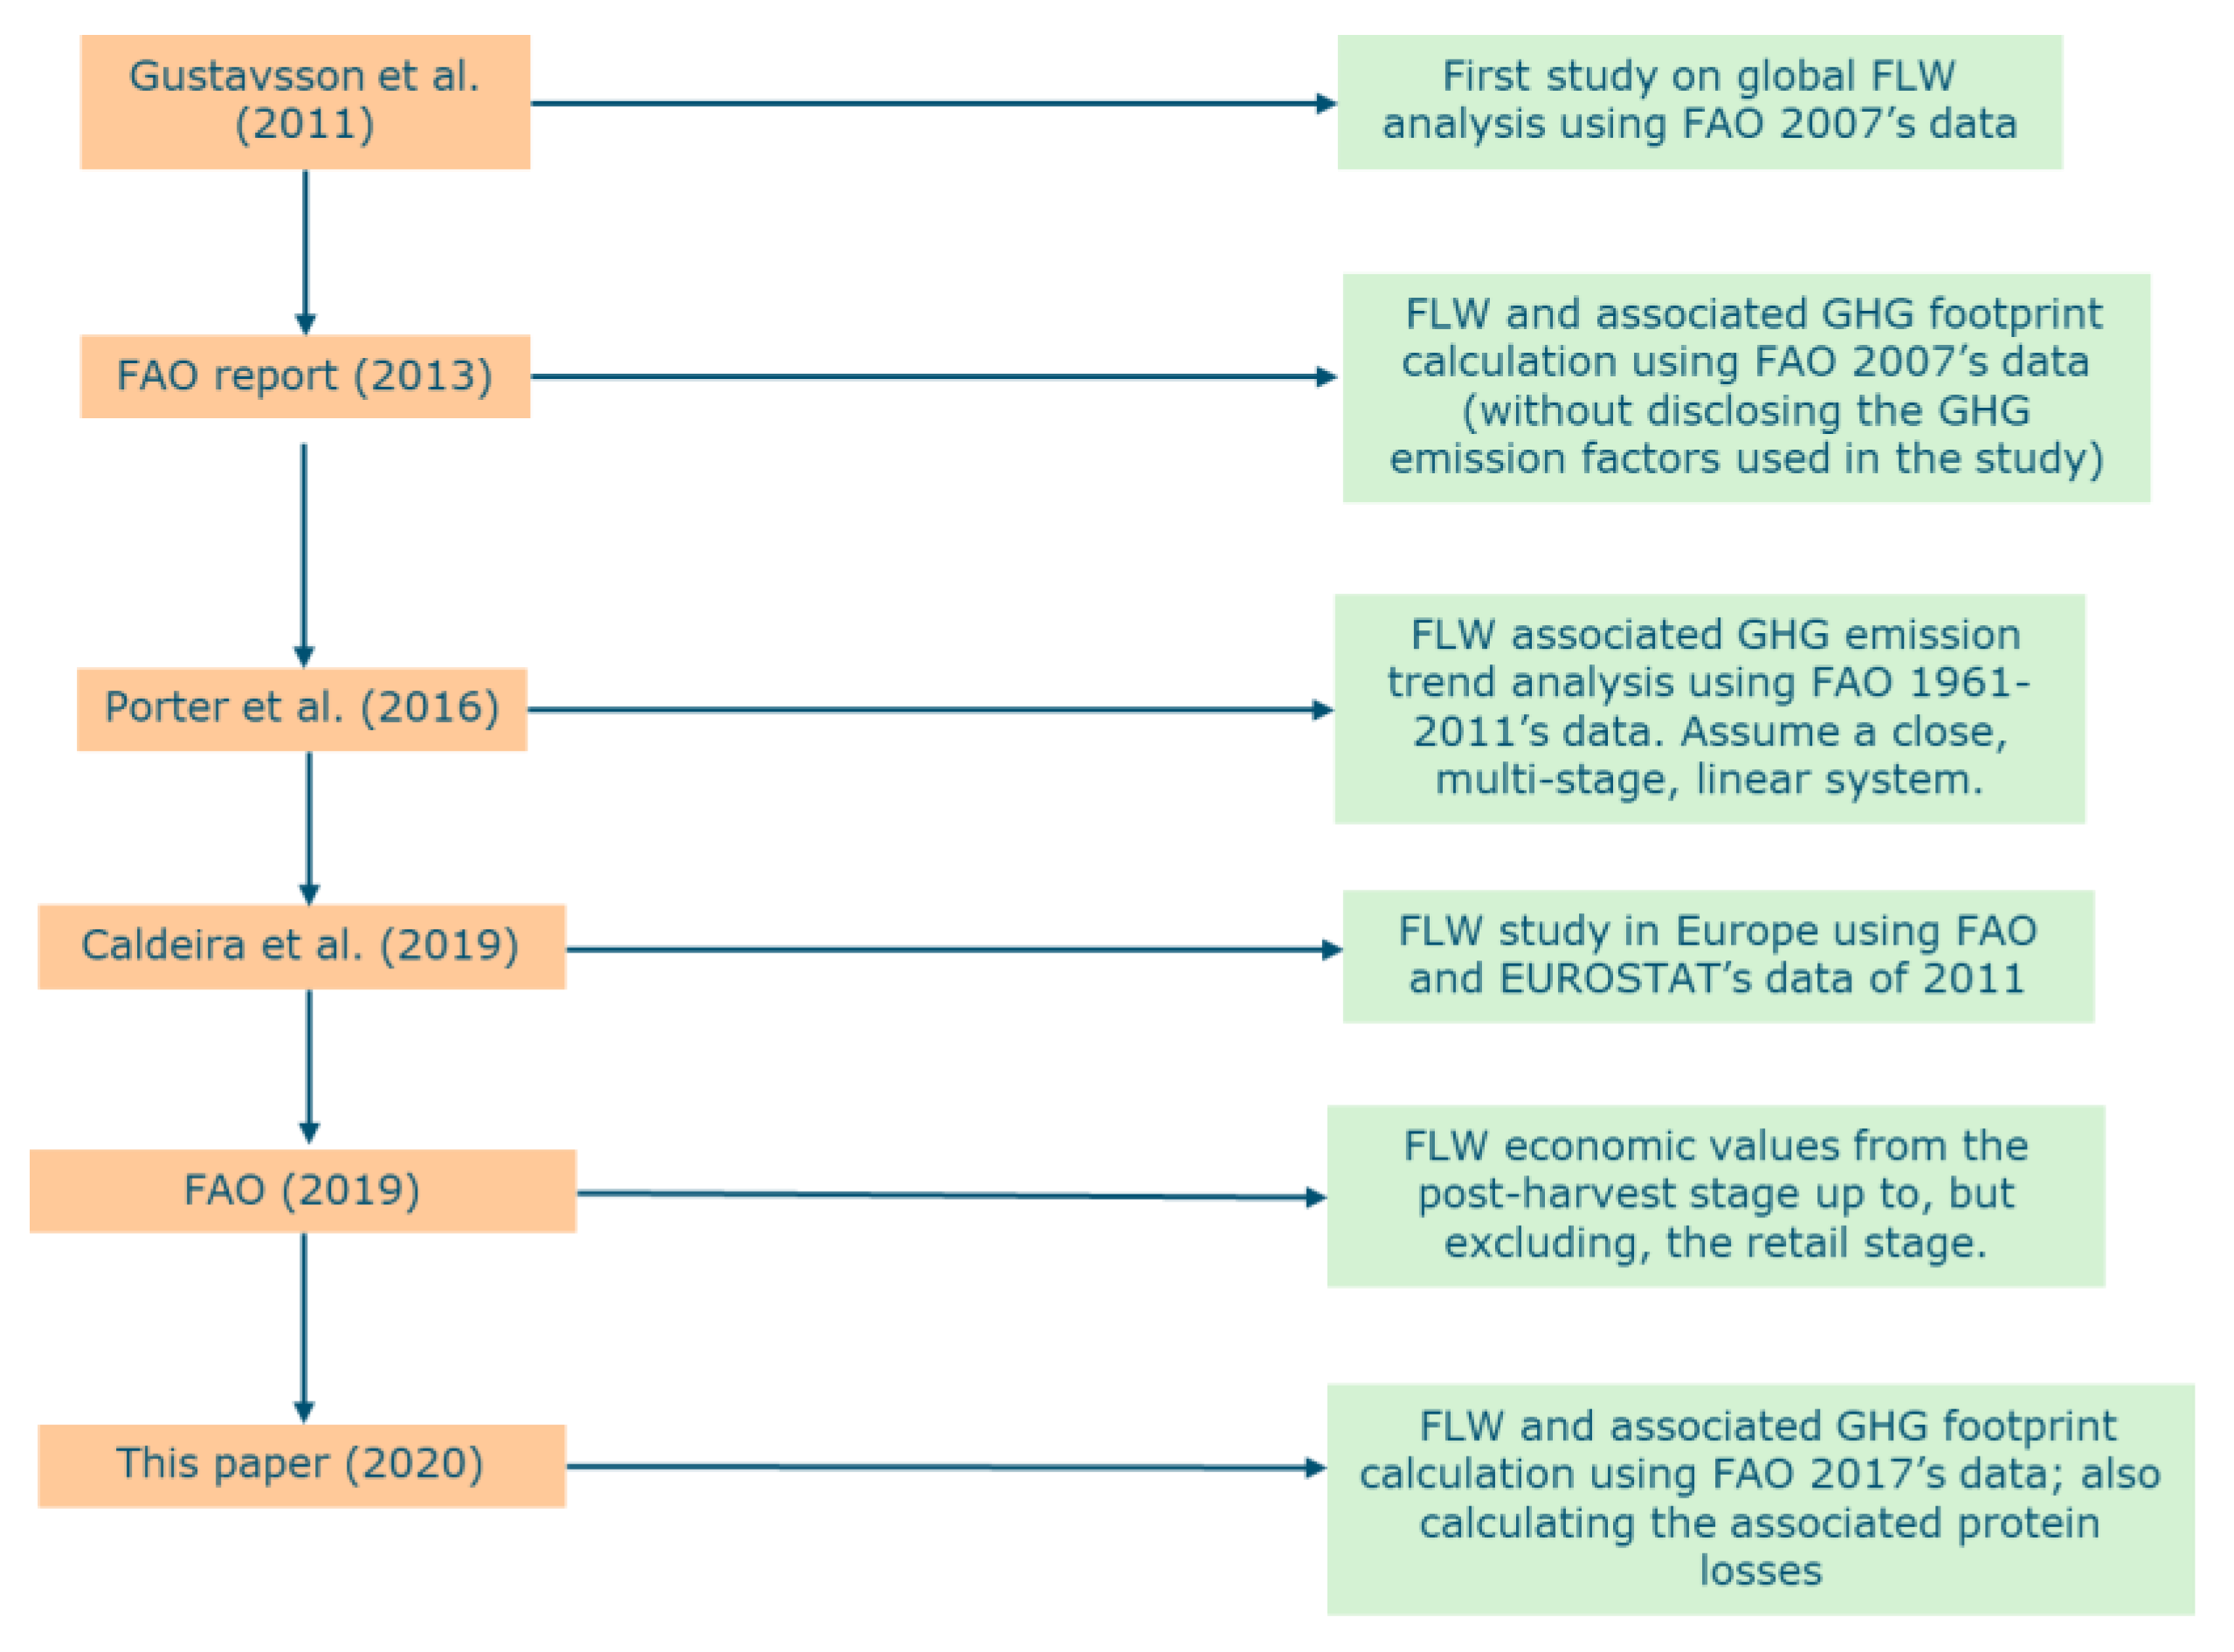
Figure 1 lists the relevant comprehensive studies (including this paper) in chronological order.
Gustavsson et al. [
34] is recognized as the first integrated study on global FLW. They specified FLW percentages to individual stages of the food chain based on FAO Food Balance Sheets (FBS) data from 2007. The FLW percentages used in that study were partly derived from the literature; when literature data were not available, the authors used assumptions and estimations to fill the gap. As a follow-up, two years later, FAO issued a technical report that investigated a food wastage footprint on natural resources [
35]. It used the FAO FBS’s data of 2007 with the same FLW percentages in Gustavsson et al. [
34] as the basis to calculate GHG emissions associated with FLW. However, this study does not disclose the used emission factors to the readers. Following the two FAO studies, Porter, Reay, Higgins and Bomberg [
13] made important contributions to this research line by conducting a more comprehensive literature review on FLW percentages and primary-production-phase GHG emission factors along all supply chain stages, across different supranational regions. They used the FAO FBS’s data from 1961 to 2011 to investigate the trend development of FLW and associated GHG emissions. A big advantage of Porter’s study is that the used FLW percentages and emission factors were derived from more recent literature; these are transparently listed in the article. Despite its significant scientific contribution, there is one point to be improved for Porter’s study. Porter, Reay, Higgins and Bomberg [
13] assumed a closed, multi-stage, linear system (i.e., a linear chain) in which the input food mass to each chain stage equals the output food mass (after losses) of its previous stage. This implies that all the raw products need to go through the five supply chain stages including processing. However, many raw products can skip the processing stage and directly go to the food distribution stage as fresh produce. Another limitation of Porter’s work is that it only presents the GHG emissions from all FLW but not the chain-wise overview.
After Porter’s work, Caldeira, De Laurentiis, Corrado, van Holsteijn and Sala [
32] performed a mass flow analysis to quantify FLW in the European Union (EU) and concluded that the stage contributing the most to FLW varies amongst product groups (e.g., for many food groups, the highest share of food waste is at consumption stage, but this is not the case for fish or oil crops). Also in 2019, FAO issued another report to introduce their Global Food Loss Index [
36,
37]. Instead of looking into the FLW mass, it calculated the economic value of FLW. The limitation of this research is that it was based on the survey data from only 23 countries for 10 key commodities and all other data were estimated. Moreover, this analysis only includes part of the food chain (from the post-harvest stage up to, but excluding, the retail stage).
Through the literature review, we observed that existing studies have limitations of lacking comprehensive coverage (e.g., geography, chain stages, food commodities), and using outdated data (e.g., the food volume data before 2011) and literature. Moreover, the existing comprehensive studies hardly addressed the protein loss issue associated with the FLW (except for Alexander et al. [
38]), which is very relevant to global food security.
To fill the knowledge gap, we carried out a comprehensive global hotspot analysis on FLW, as well as the associated GHG emissions and protein losses. We used the most up-to-date data (i.e., the new Food Balance Sheets published in 2020) and literature as the basis to provide the policymakers with an updated overview. This study enriches the research line of the comprehensive FLW studies, as shown in
Figure 1, along the entire food chain at both regional and global levels.
2. Materials and Methods
Similar to the majority of the relevant studies in this field, the primary source to obtain data in this research was the FAO FBS. However, all the previous studies used the old version of FBS with the most recent data year 2011. This research is the first to use the new FBS (updated in 2020) that covers 2017’s data. Different from Porter’s study, which only considered the primary-production-phase GHG emissions, we also incorporated the emissions due to international transportation in global food trades. The Detailed Trade Matrix (DTM) from FAODATA was used to map the global food trade flows. Because other post-harvest operations (like processing, packaging, refrigerated storage, etc.) largely differ between and even within product categories, we did not include those effects. However, such emissions may be significant (see e.g., Scherhaufer et al. [
39]).
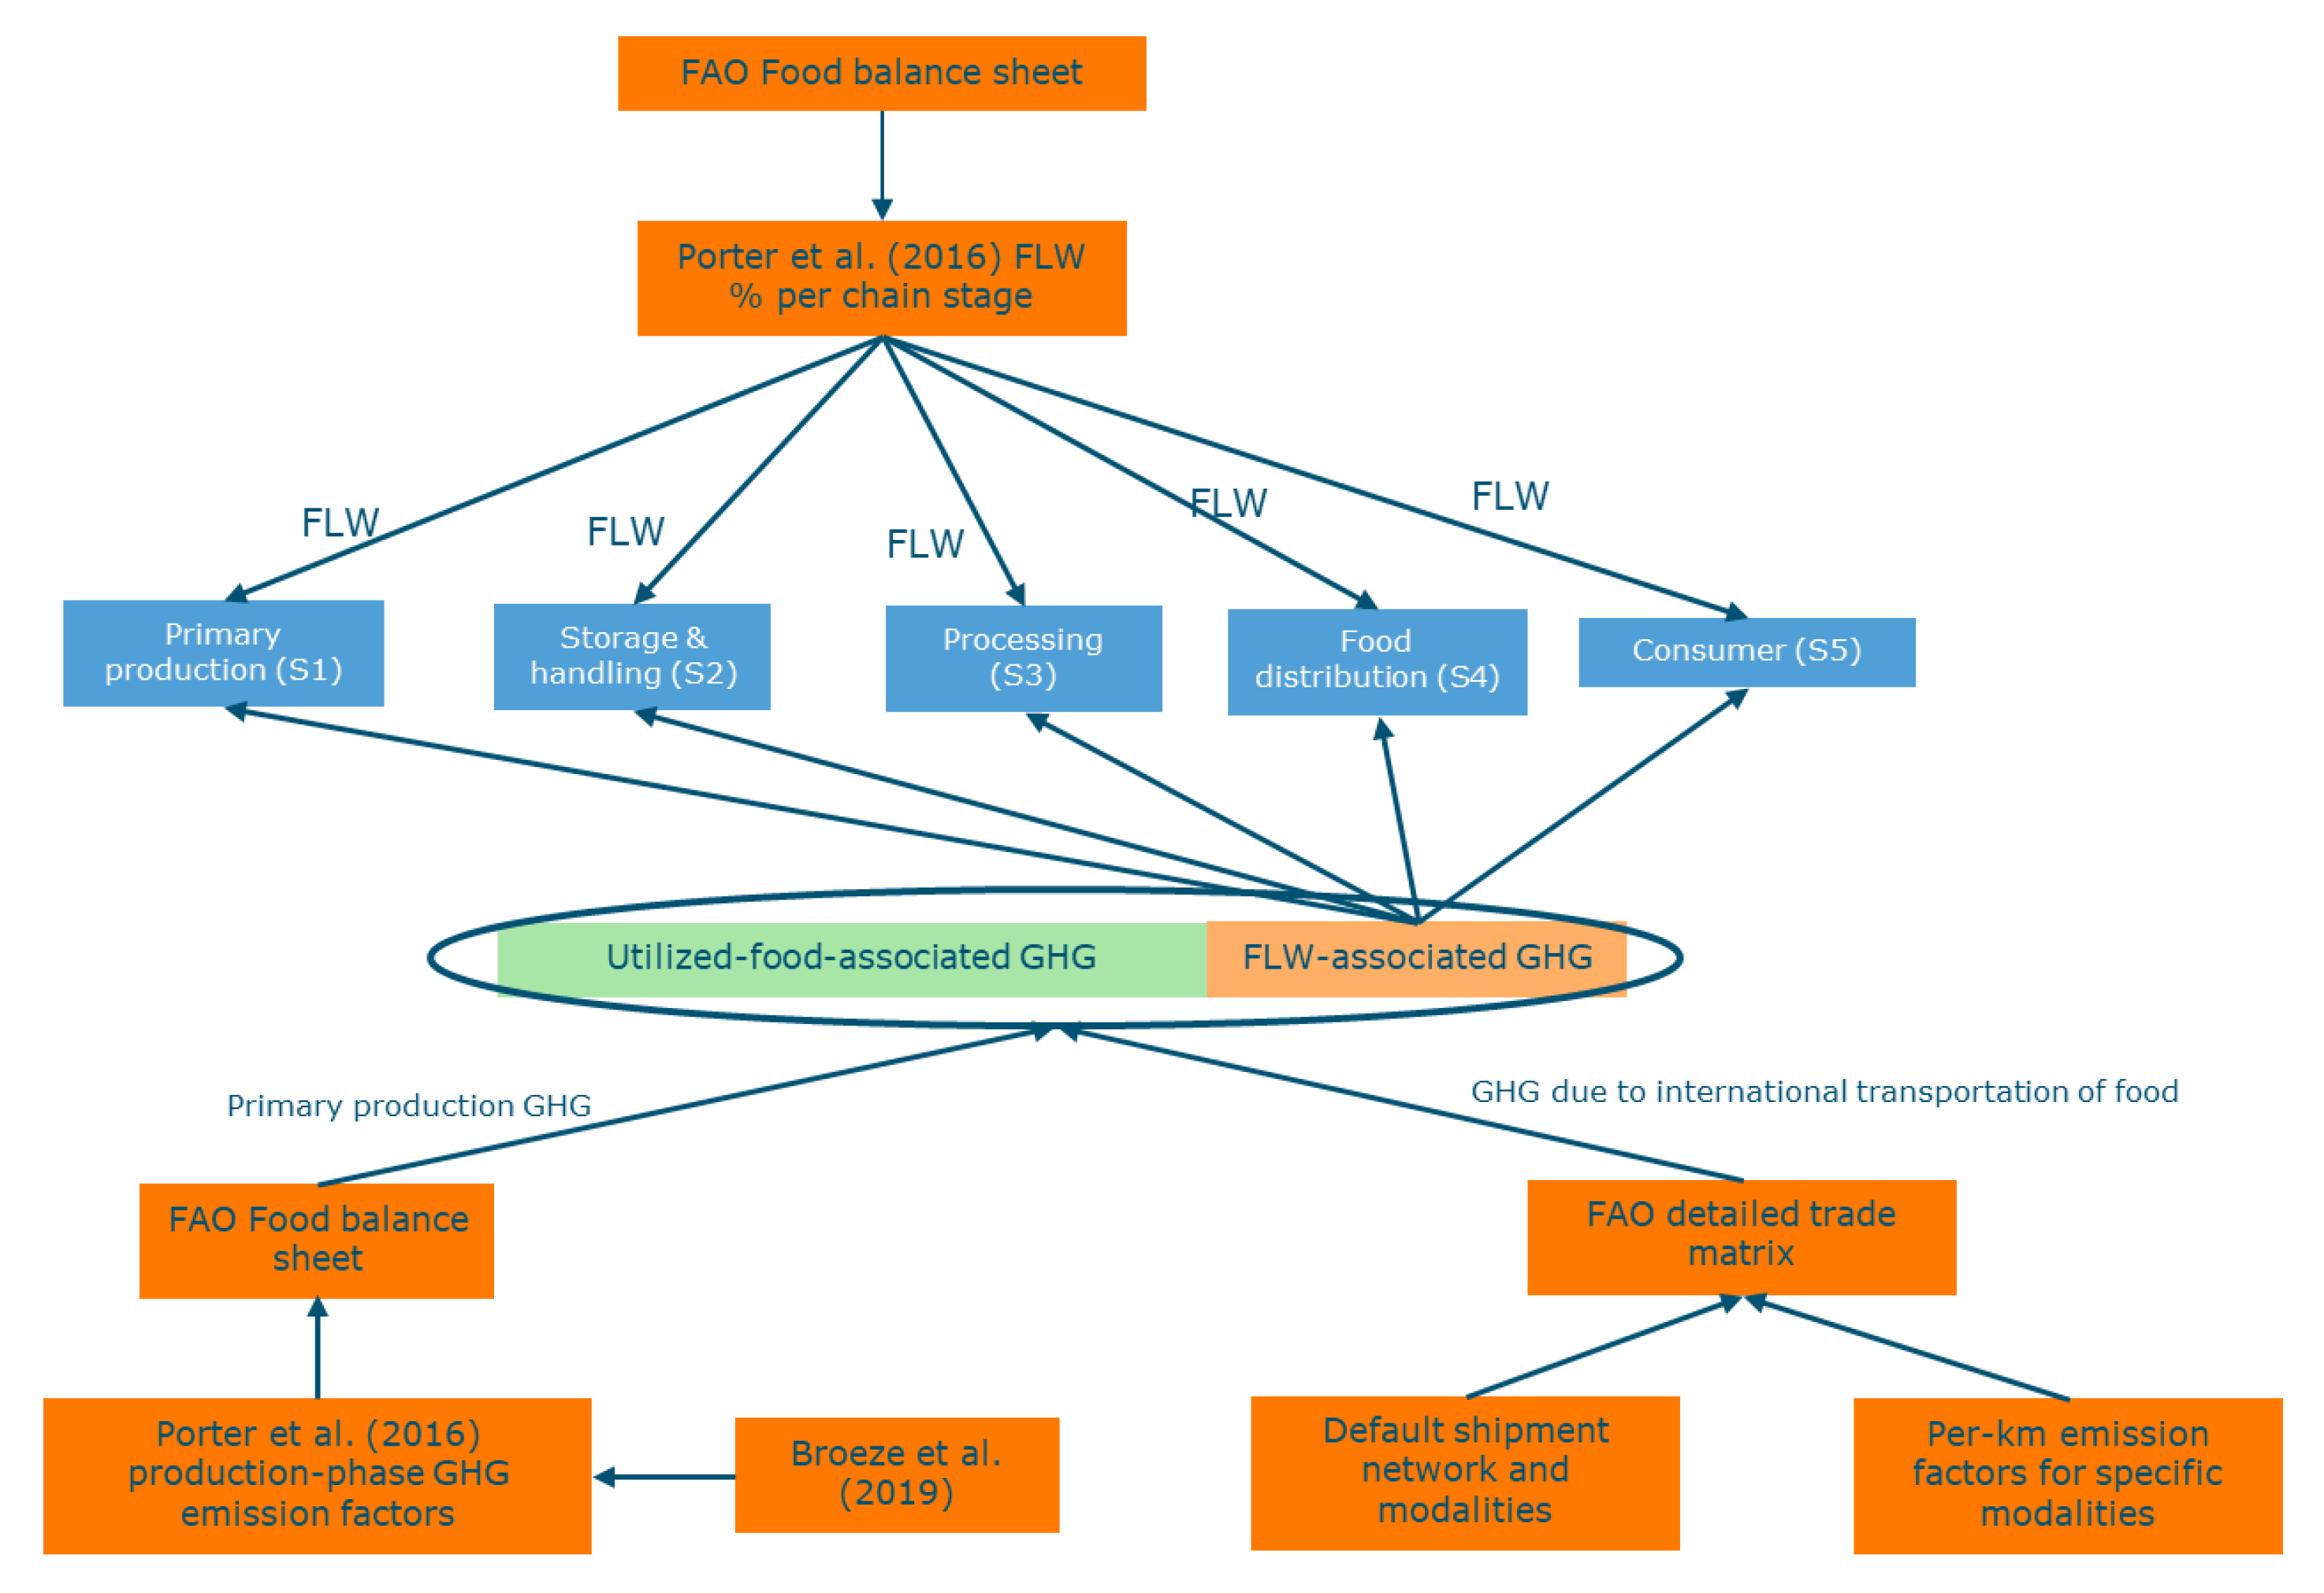
A schematic structure of the methodology employed in this research is presented in
Figure 2.
From the FAO FBS, the most important categories of data include primary production, import and export quantities, processing, food, and feed. The data were retrieved for each country and commodity combination for 2017. Porter, Reay, Higgins and Bomberg [
13] is the source from which we derived the FLW percentages. The primary-production-phase GHG emission factors that were applied to the corresponding food chain stages were also obtained from Porter, Reay, Higgins and Bomberg [
13]. GHG emissions are expressed as CO
2 equivalents. The transportation-related GHG emission factors were from CO2emissiefactoren.nl. The DTM was used to derive import profile (percentages) for each food commodity and each reporter country (i.e., mapping the sourcing flows in percentages from all trade partner countries). The reason why we did not directly use the import quantity numbers registered in the DTM is that those numbers differ from the ones registered in FAO FBS. Since FBS is the leading data source in our study, we decided to use the DTM in an indirect way (i.e., generating the import profile) to keep the data consistent with the FBS data.
The analysis starts with the agricultural production data which we derived from the FBS. Since the production volumes registered in FBS also include the produce for feed, seeds, and other uses, we need to subtract them from the total primary production. To realize that, we applied the same multiplier as defined in Porter’s work (see Equation (1)).
where FOF indicates the fraction of total primary production that is for food use.
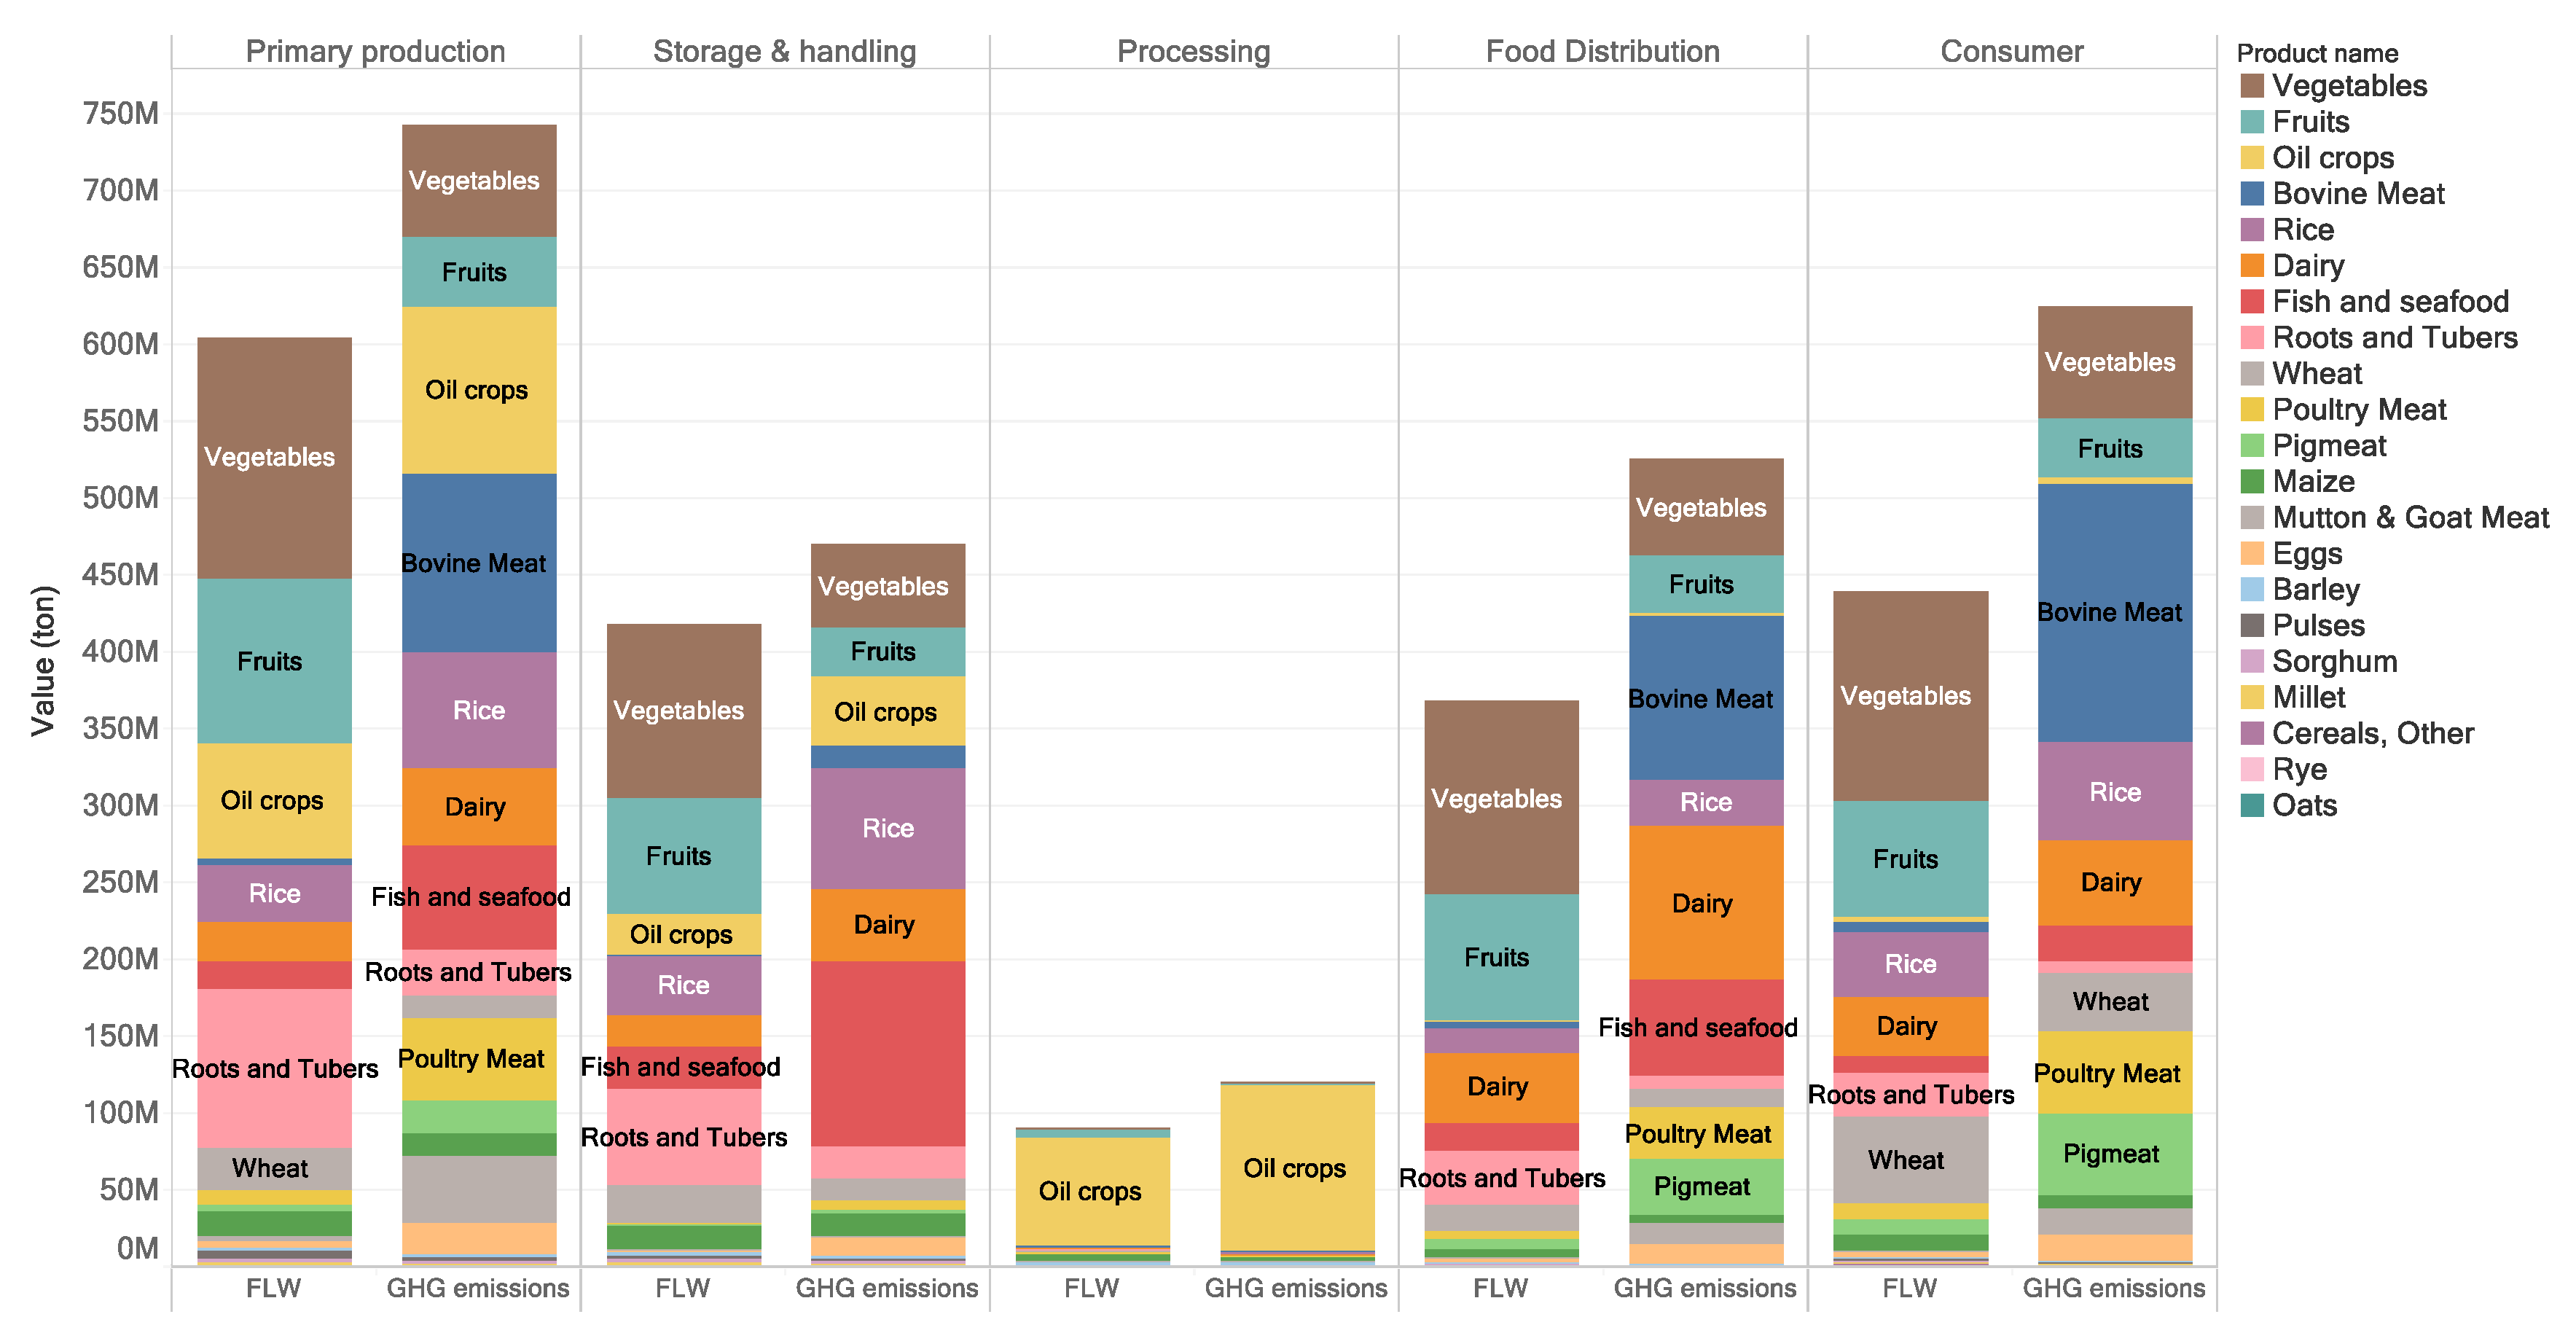
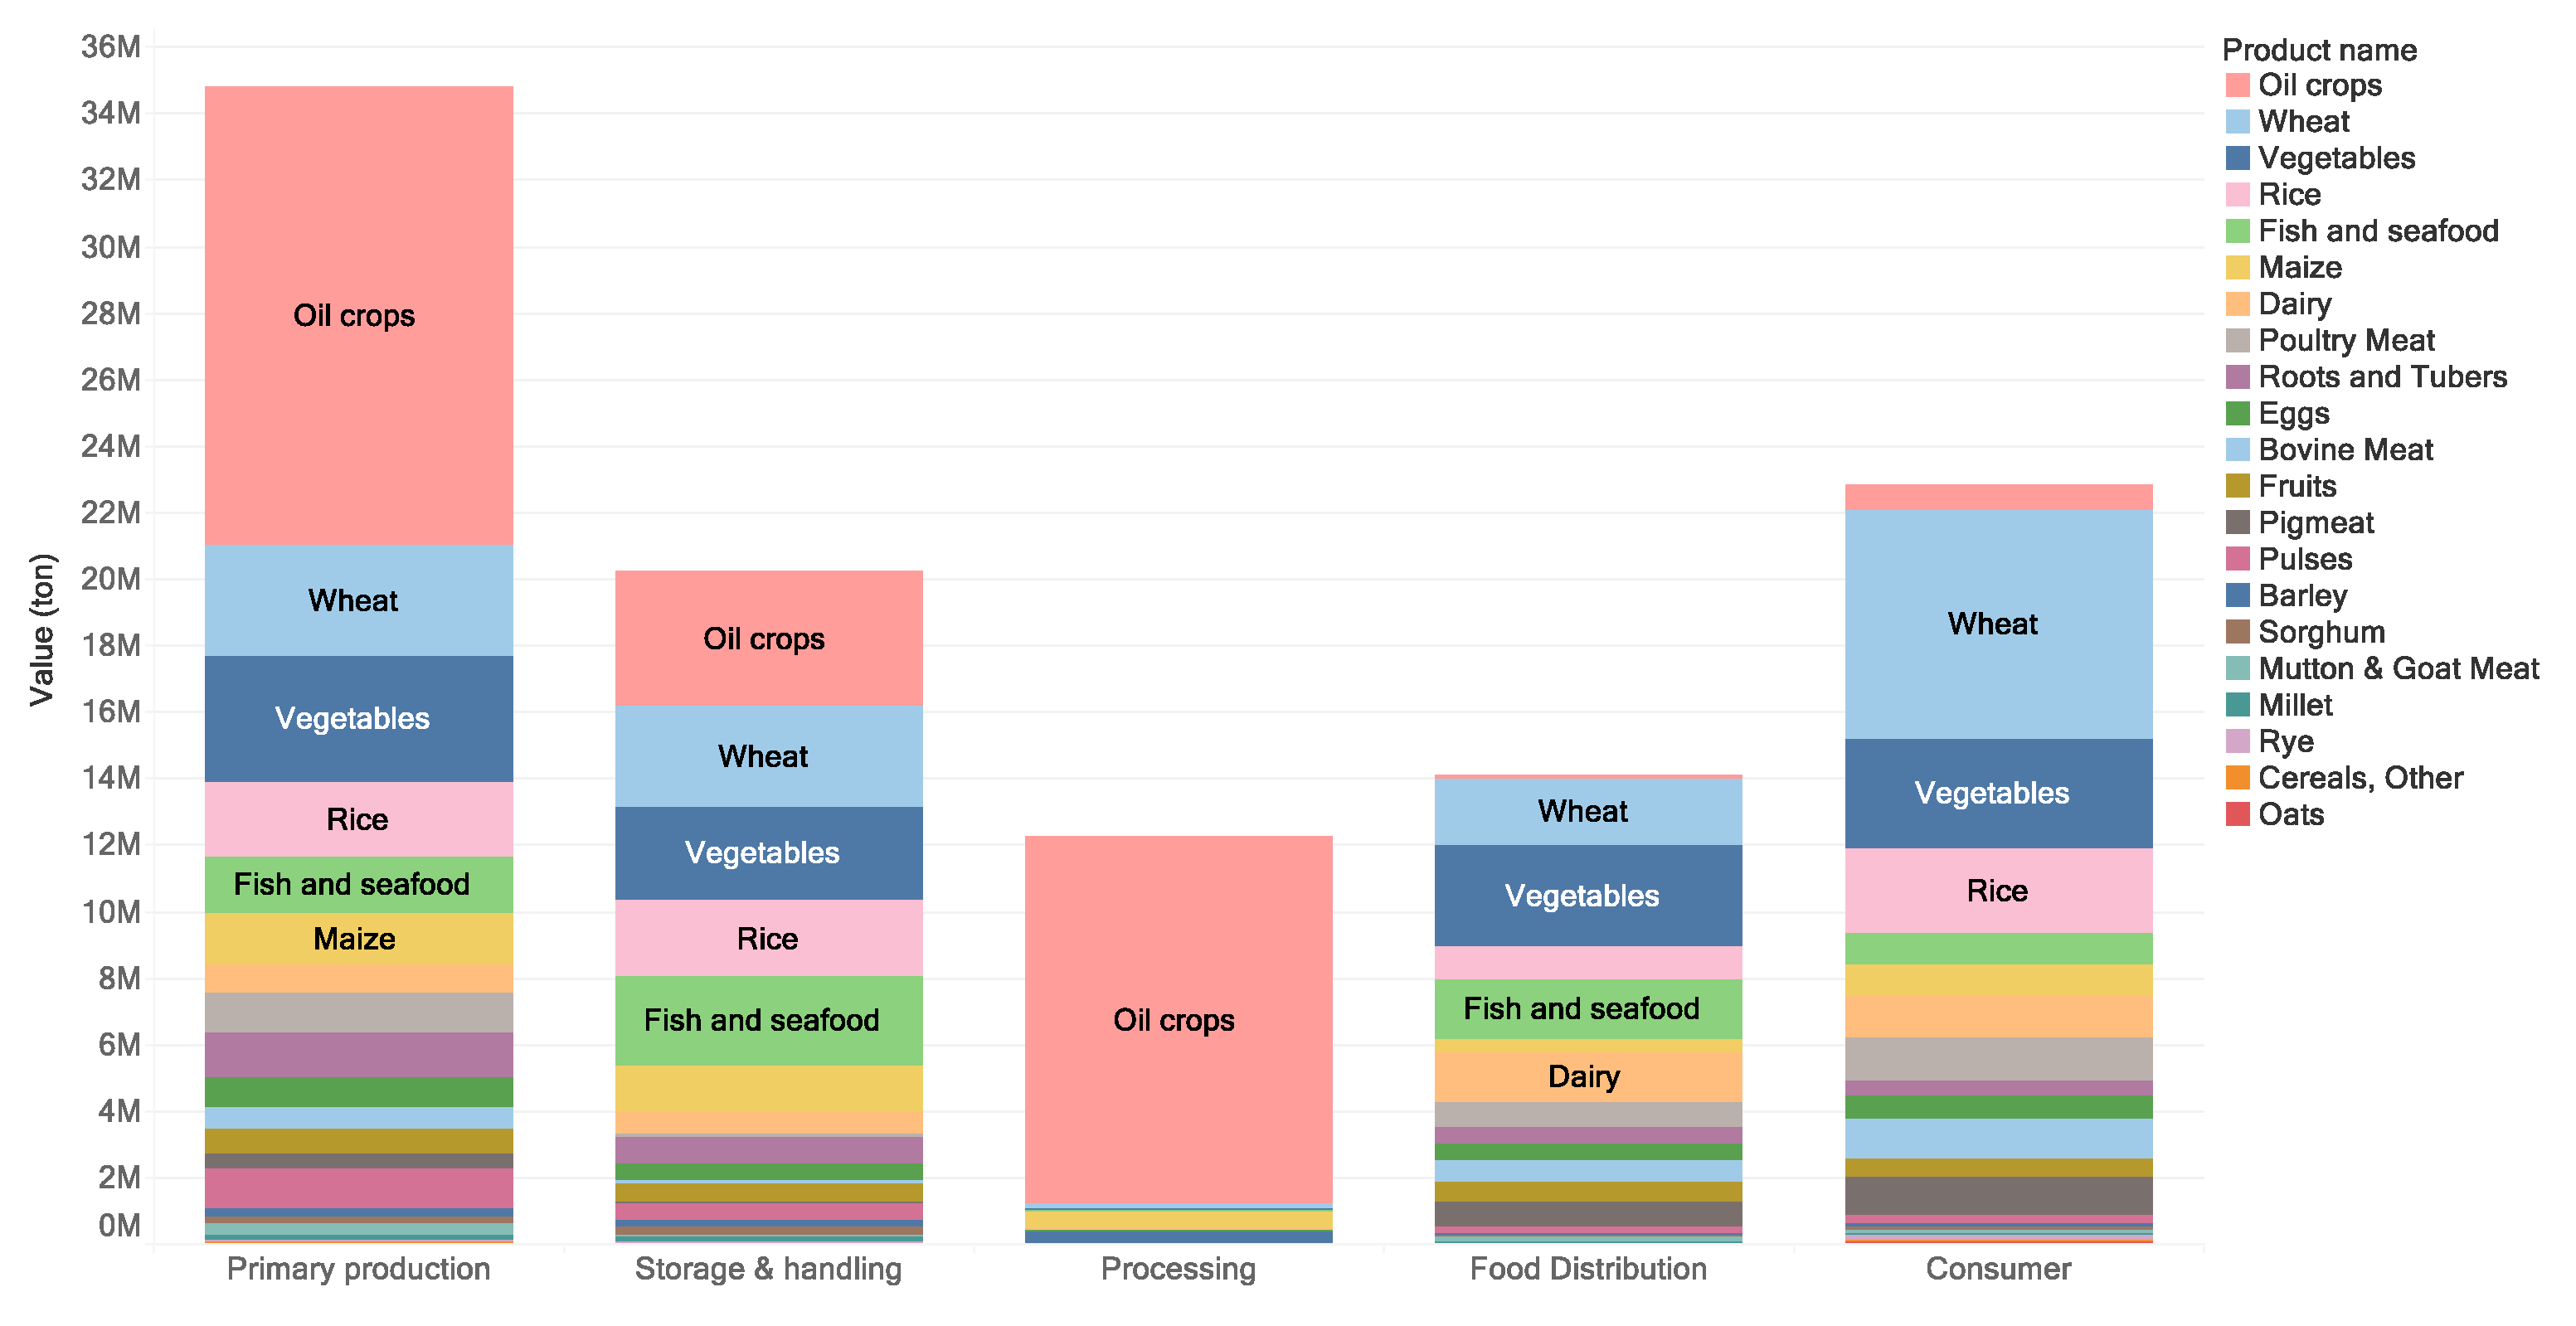
Our analysis is targeted at a food supply chain with 5 stages: primary production (S1), storage and handling (S2), processing (S3), food distribution (S4), and consumer (S5). Here, two features of the FBS are essential: (1) there are no data records available for S2 and S5 and (2) the quantity registered for S1, S3, and S4 is the “net quantity” after subtracting the losses in the referred stage. These features determine that different formulas need to be applied to calculate the FLW for the two types of stages. For S2 and S5, their input food mass is just equal to the registered quantity in S1 and S4 because this registered quantity is the “net quantity” after losses. Multiplying the input food mass of S2 and S5 by the associated FLW percentage, we can obtain the FLW in S2 and S5 using Formula (2a):
where FLWP is the FLW percentage and FM is the input food mass of S2 or S5. An FLWP is associated with a specific food item and a specific supply chain stage varied by the different regions.
Differently, the FLW losses for S1, S3, and S4 are calculated by solving Equation (2b), also because the registered quantity for those stages is the “net quantity” after losses:
where NFM denotes the net food mass after subtracting FLW of the current stage (S1, S3, S4).
Regarding the GHG, only the emissions related to primary production and trade transportation were taken into account due to limited data availability. For the total primary-production-phase GHG emissions, we multiplied the GHG emission factor with the total food mass of the primary production (see Equation (3)).
where PGHG is the primary-production-phase GHG emissions and GHGFP denotes the GHG emission factor for primary production. PFM is the total food mass in the primary production stage. Here, it is necessary to note that since GHGFP does not include the emissions in the post-harvest chain stages, PGHG only accounts for GHG emissions due to the on-farm activities.
Except for the GHG emissions from the on-farm activities, the emissions from international trade transportation are also considered. To calculate the transportation-related GHG emissions, Equation (4) is used:
where TGHG is the transportation-related GHG emissions, TFM is the transported food mass, D is the transportation distance, and GHGFT is the modality-dependent GHG emission factor for food transportation (per km per ton). The transport distances and modality choices were determined by reasonable assumptions for all trade streams listed in the DTM. For countries located on the same continent (or generally reachable by truck), truck transport was presumed. In case a flow goes from one continent to another, the first part of the transport was assumed by truck from the capital city of the origin country to its closest seaport, then by sea freight shipping to the closest seaport of the capital city of the destination country, followed by truck transport from the port to the destination city. For the sea freight, the following two assumptions were made: ambient bulk transport for robust products (e.g., cereals) and reefer transport for perishable products (e.g., meat, dairy, fruit, and vegetables). In the latter case, additional fuel use for reefer cooling was taken into account, i.e., assuming 20% more GHG emissions than the ambient sea container.
The total GHG emissions were allocated to different supply chain stages according to the amounts of FLW yielded in those stages. The allocated GHG emissions are therefore called FLW-associated GHG emissions, which are the GHG footprints of FLW. For S1 and S2, the corresponding fraction of the primary-production-phase GHG emissions was allocated based on the quantity of FLW generated at that stage. For the remaining stages, the corresponding fraction of both primary production and transportation-related GHG emissions were allocated in accordance with the quantity of FLW per stage.
To calculate the associated protein losses of the FLW, the “FAO Food Composition Table” was used. In the “FAO Food Composition Table”, the protein content per food item is listed. We have already obtained the mass of FLW of the food items in different supply chain stages. Therefore, we multiplied the mass of FLW to the protein content of the corresponding food items to derive the protein losses associated with those FLW.
4. Discussion
In this research, we conducted a global hotspot analysis by quantifying the FLW as well as the associated GHG emissions and protein losses. Different from the traditional climate-smart agriculture viewpoint, we adopted the prospect of climate-smart food chains. This research is of high significance because of the fast-growing world population with more middle classes favoring higher-income dietary patterns. It requires more fresh and nutritional food supplies (e.g., fresh fruit and vegetables, milk, meat, oil crops). Those are responsible for large amounts of FLW associated with huge GHG emissions and protein losses, as well as other nutrients. The hotspot analysis can help the policymakers identify the crops and animal products that have the highest potentials on FLW. It therefore contributes to food and nutrition security, as well as climate change mitigation.
4.1. Conclusions and Implications
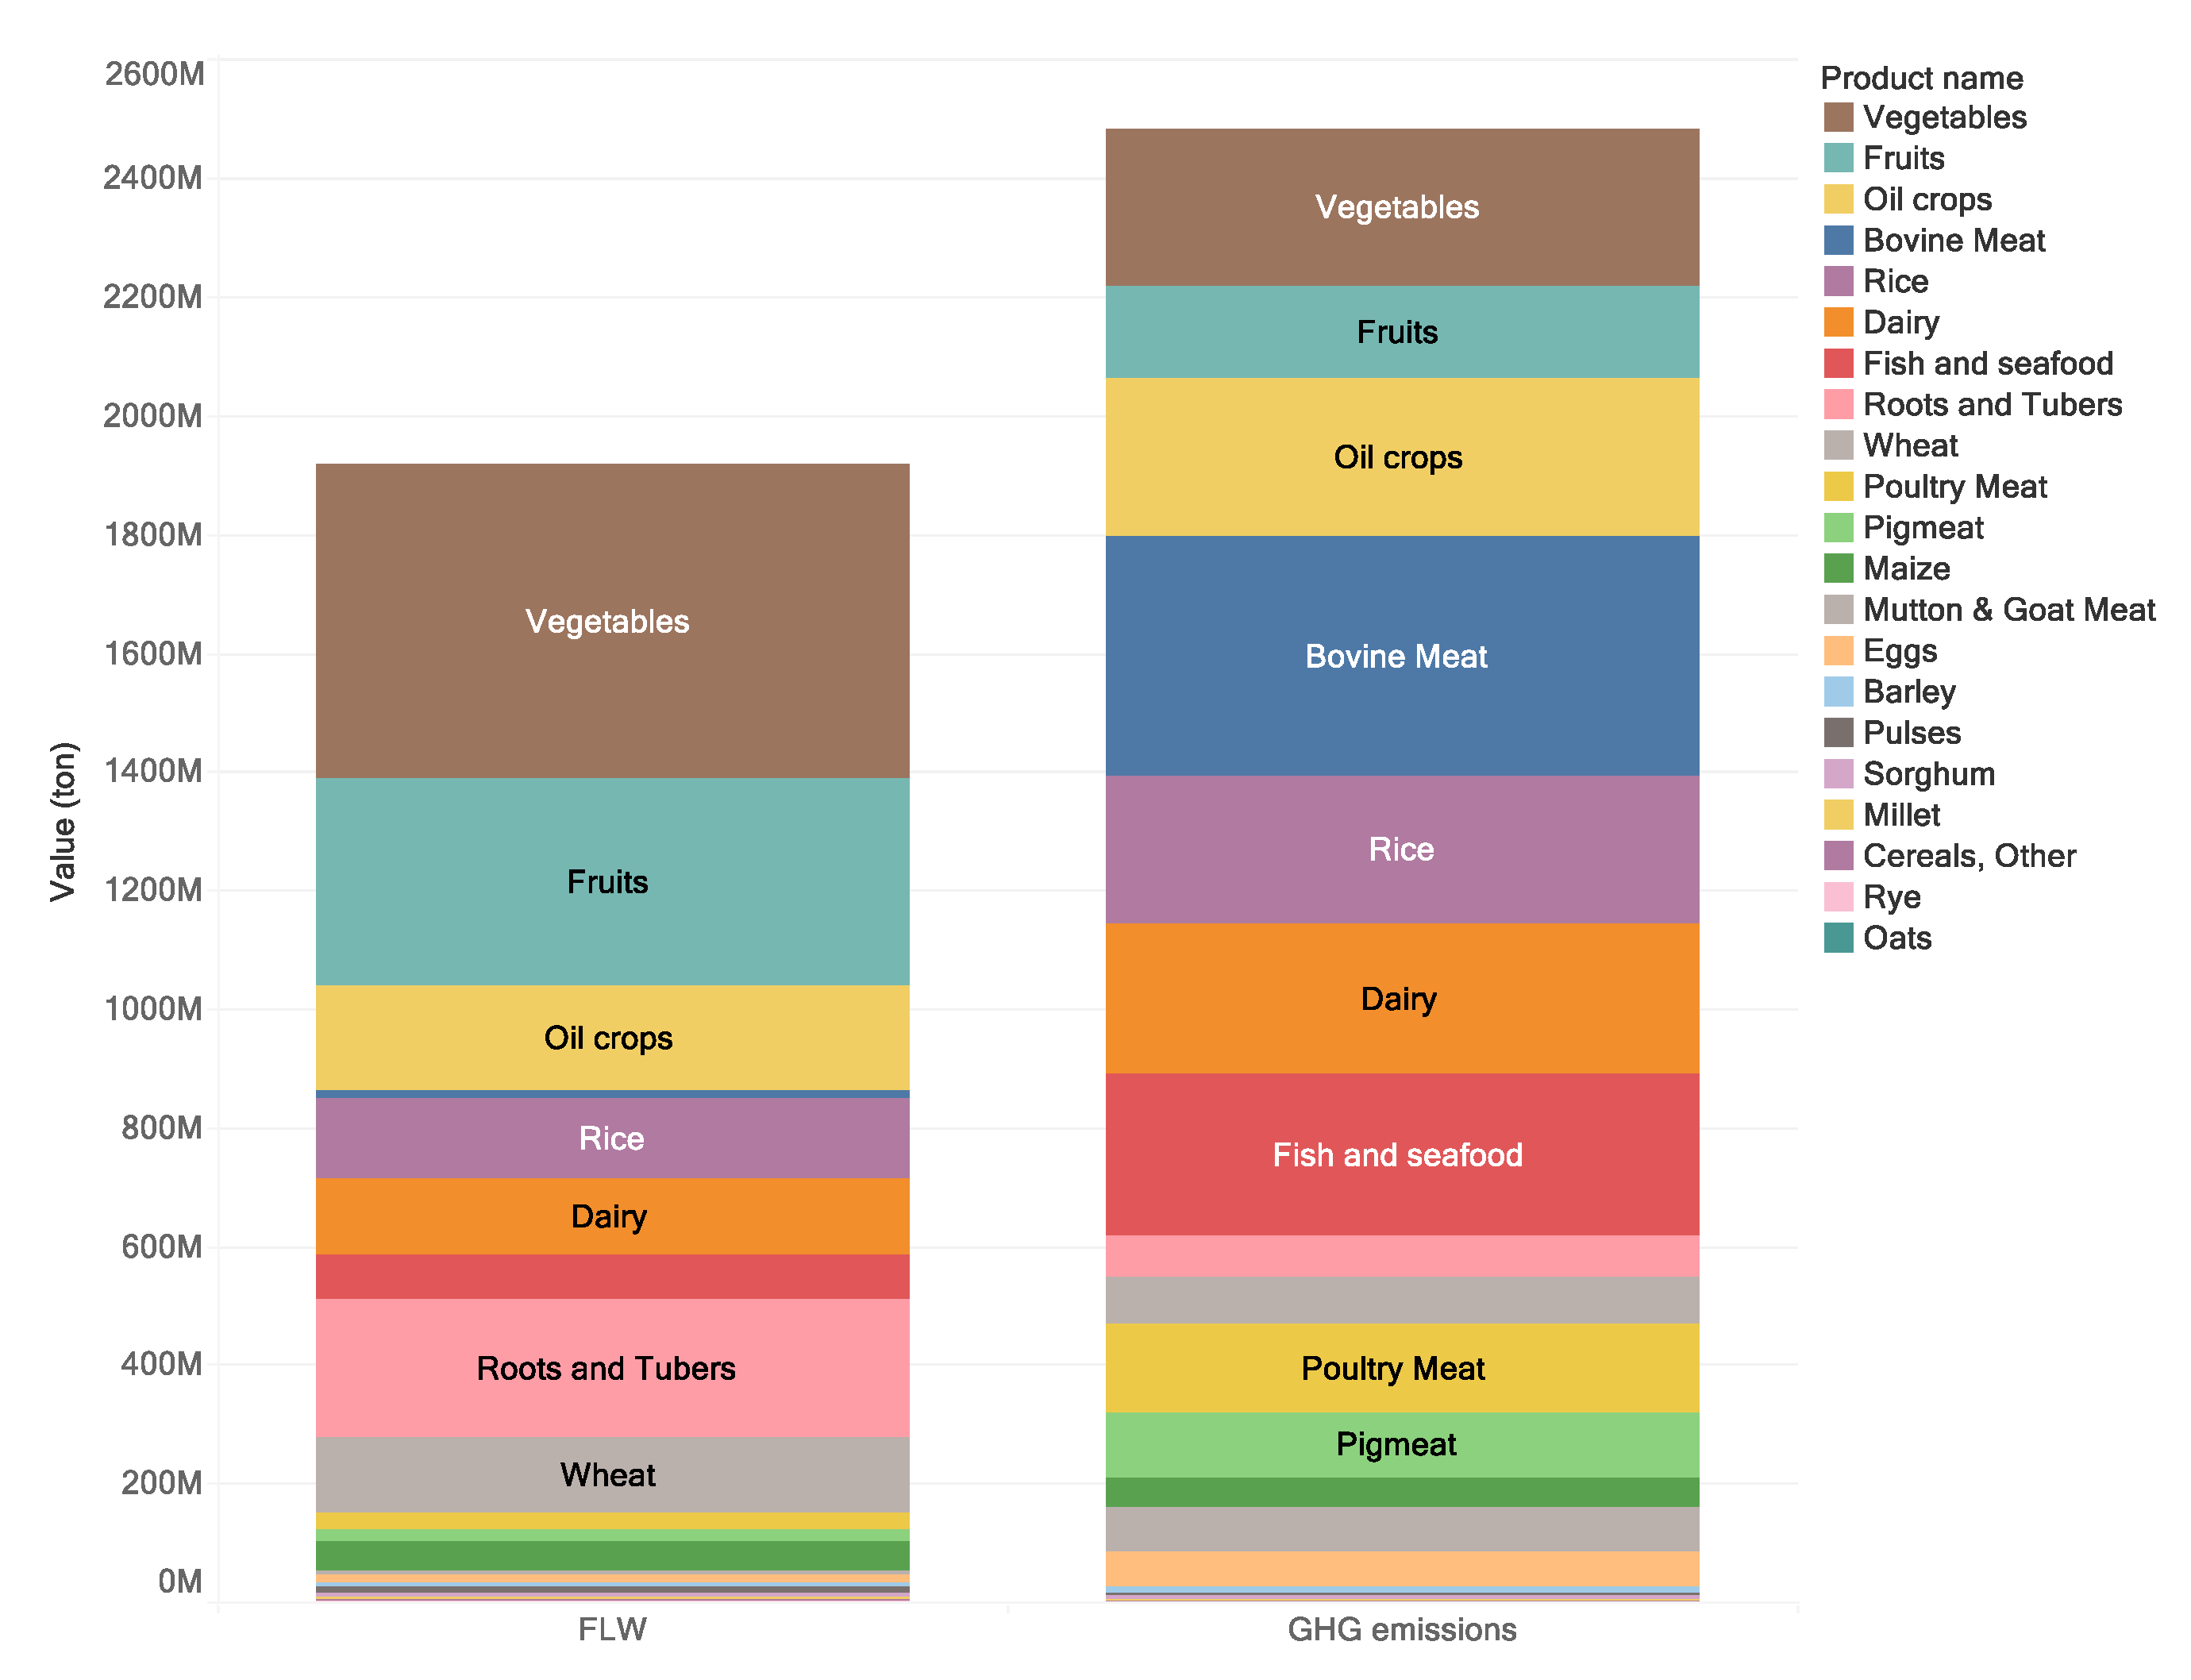
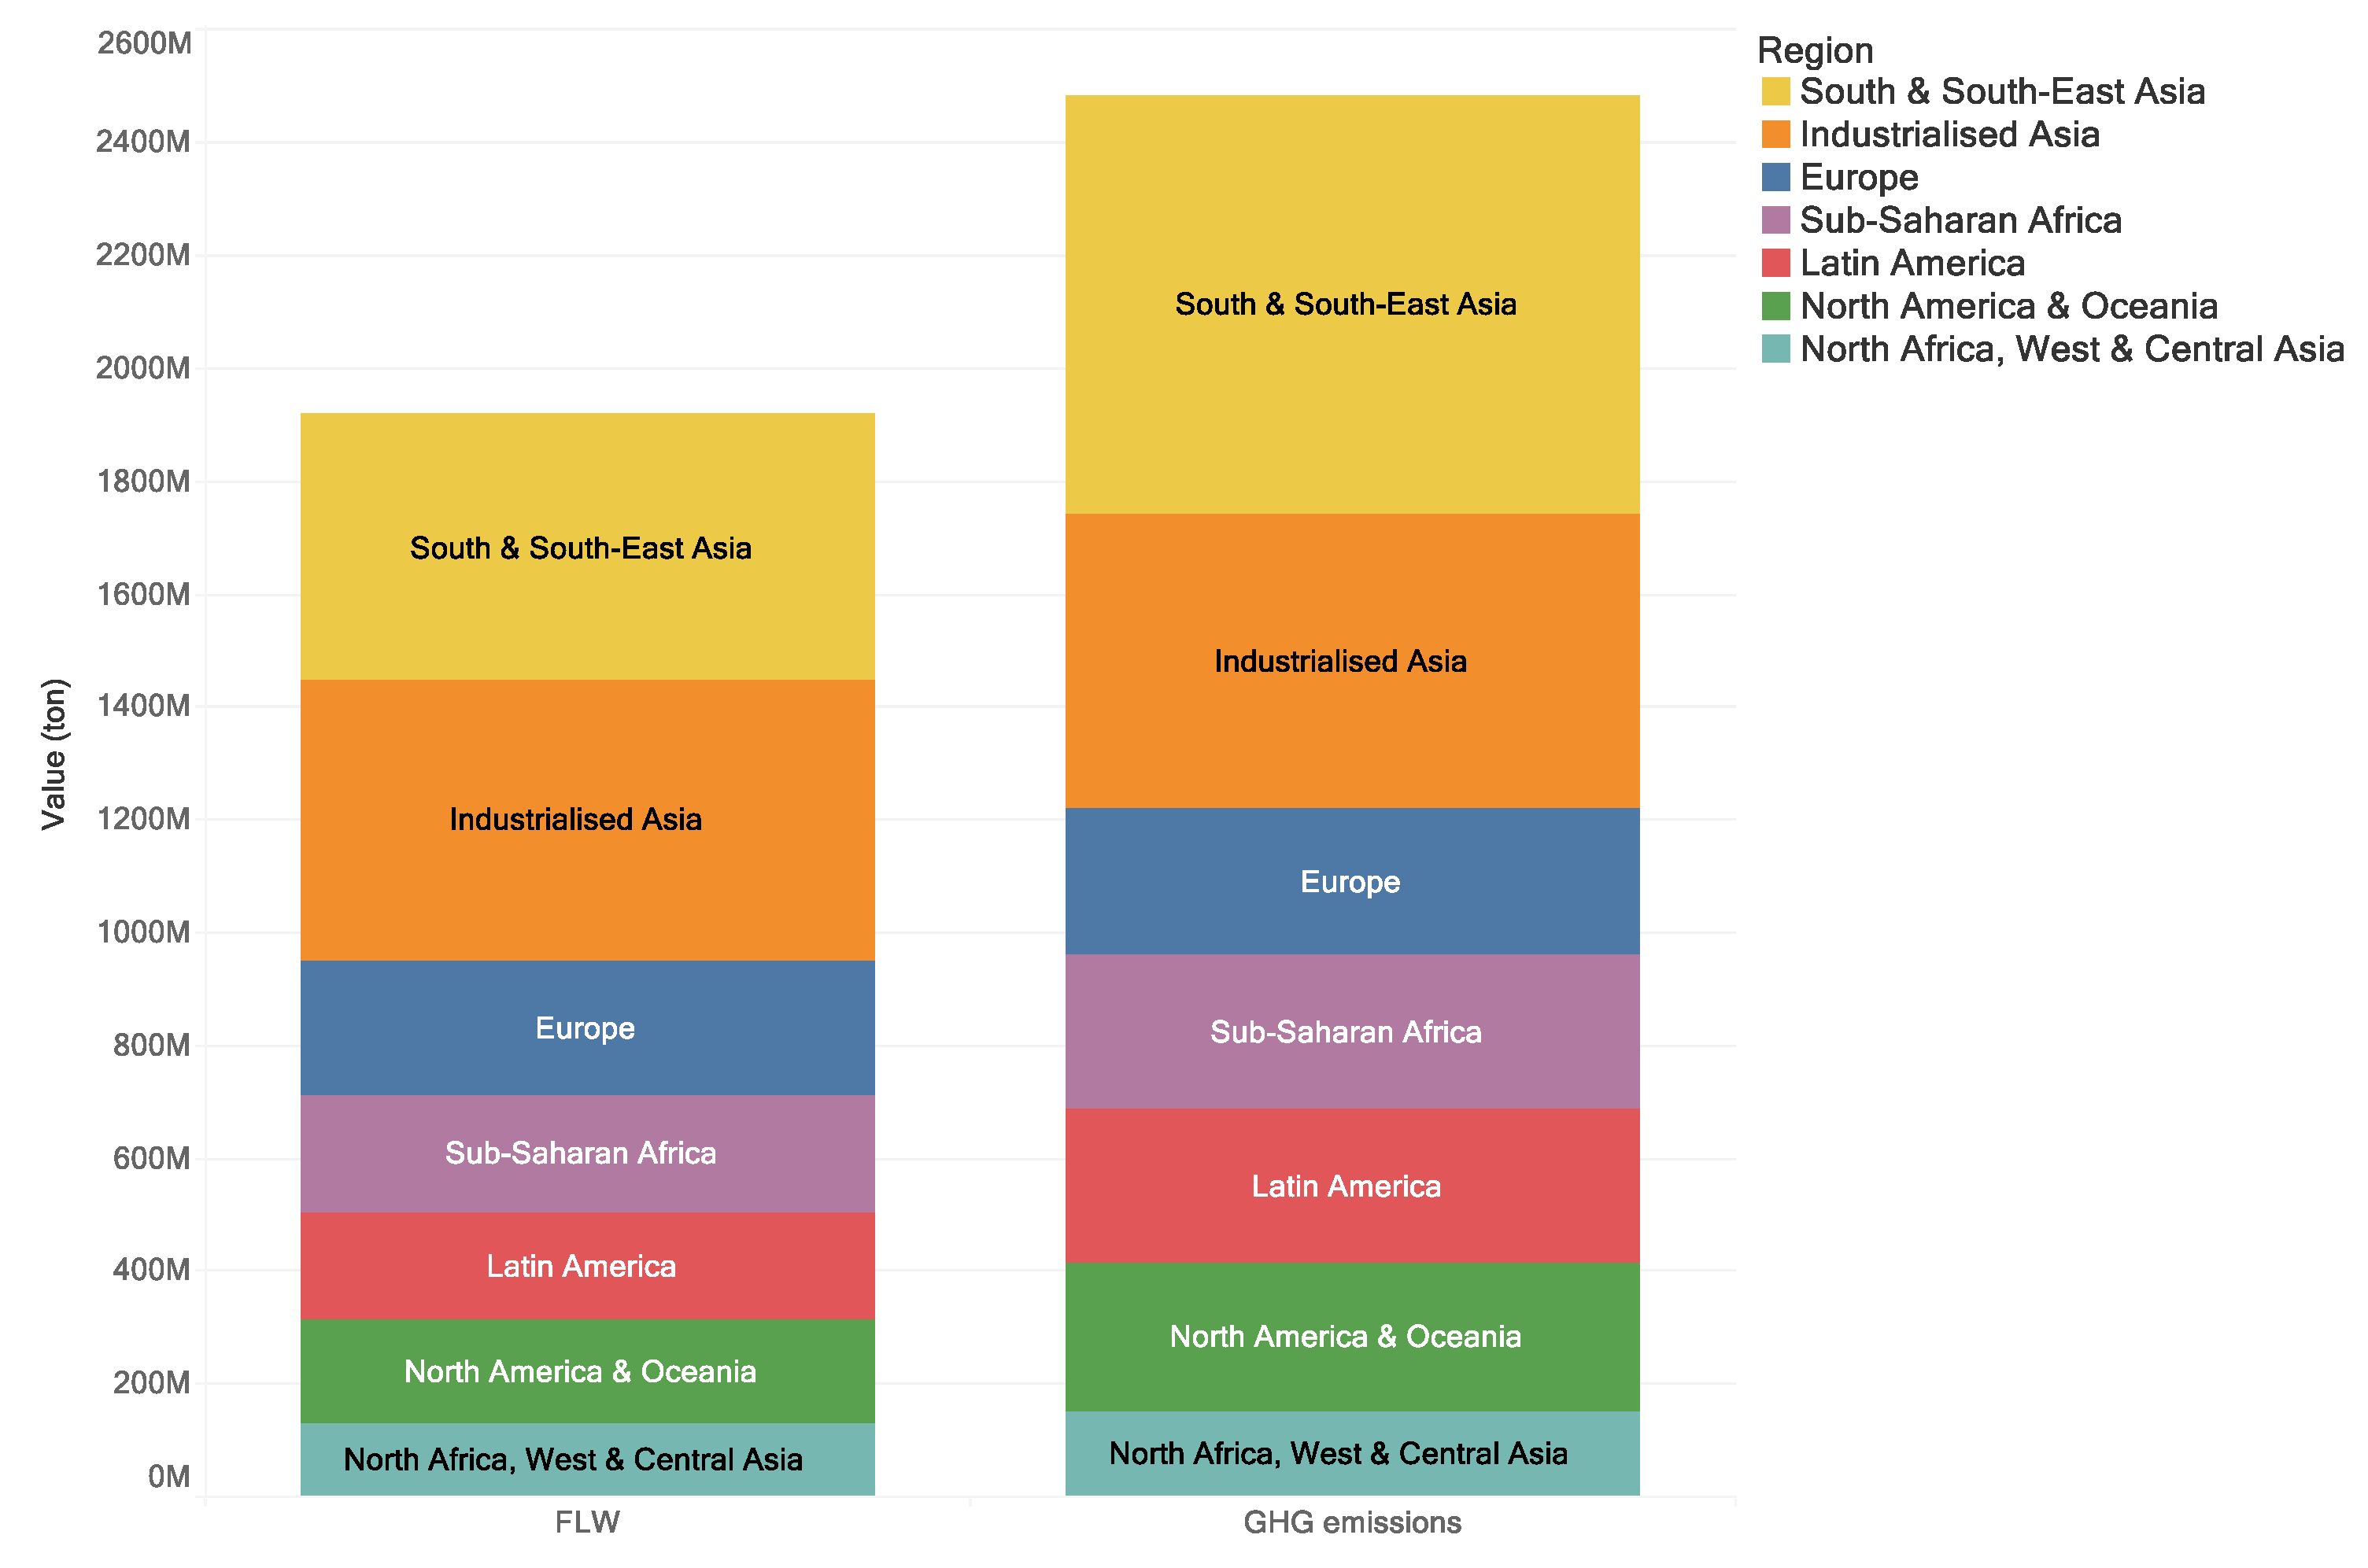
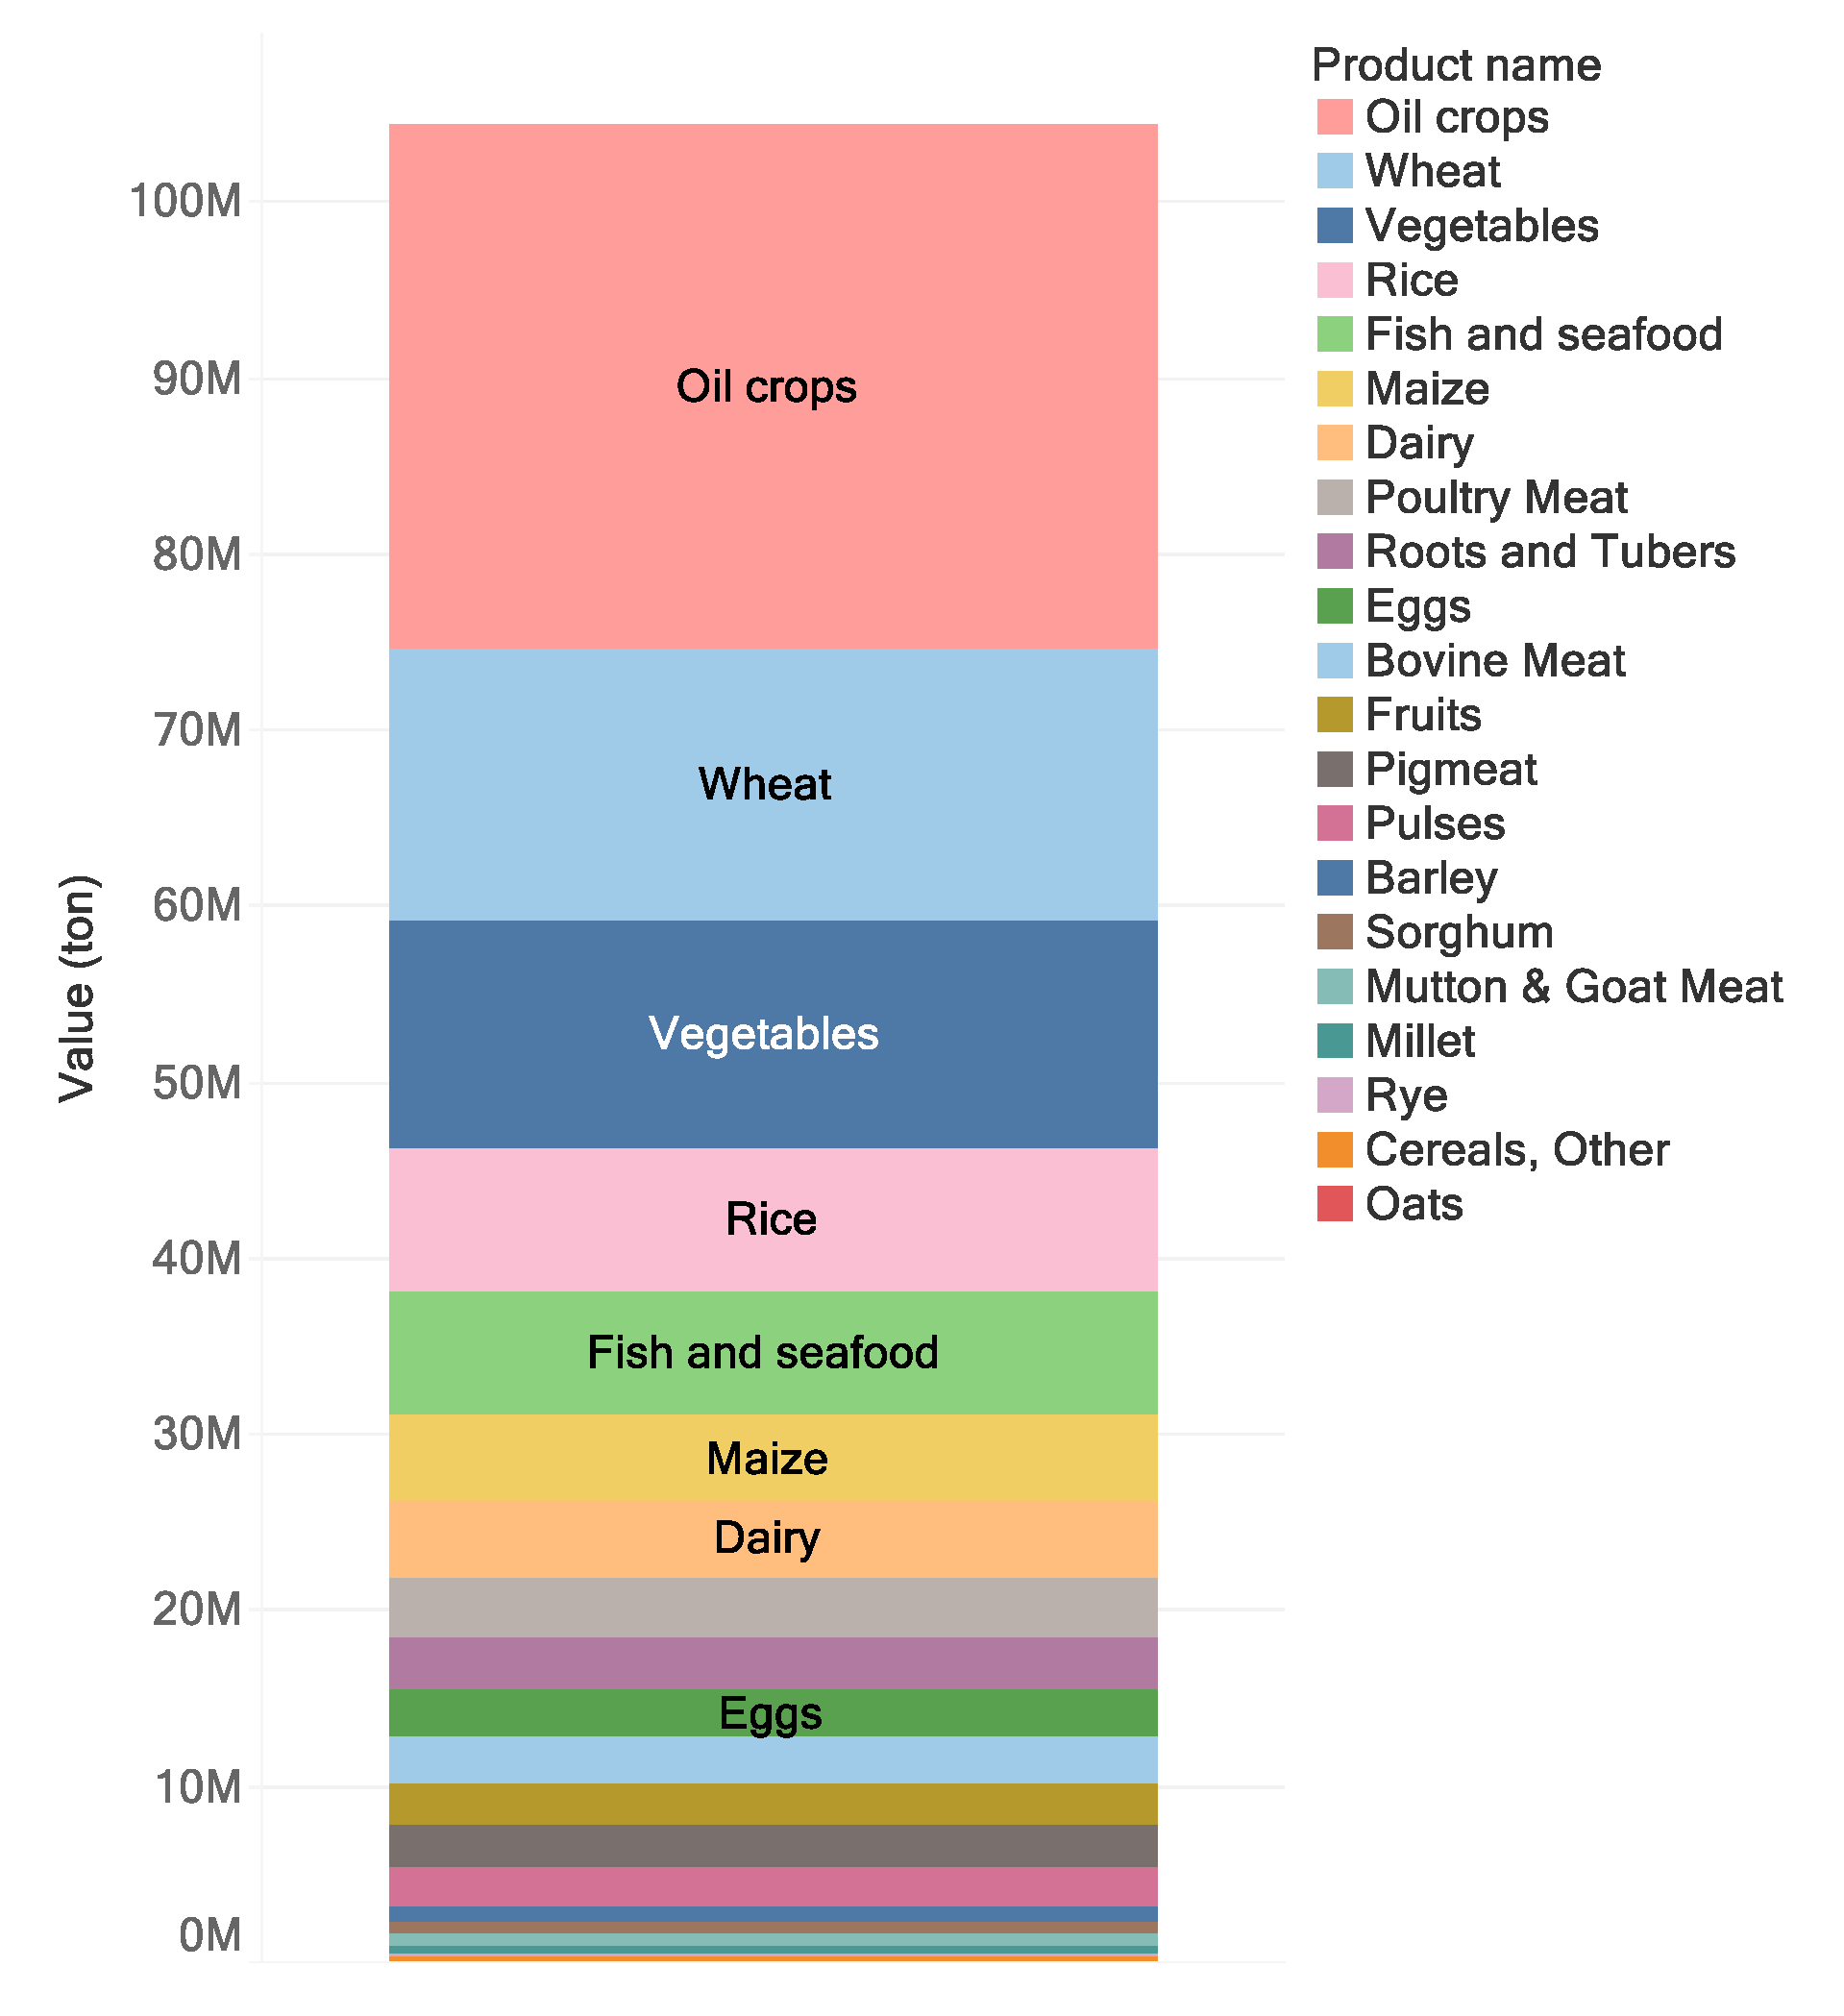
The total values on FLW and associated GHG emissions are quite comparable to other studies. The computed global FLW in this research is equal to 1.9 Gt for 2017. This complies with the 1.6 Gt for 2011 calculated by Porter, Reay, Higgins and Bomberg [
13], taking the different years in use into account. The calculated FLW accounts for 29% of the total primary food production. This is in line with the widely accepted concept that roughly a quarter to one-third of the food produced in the world is lost or wasted based on the research of Gustavsson, Cederberg, Sonesson, van Otterdijk and Meybeck [
34] and others. The total calculated FLW-associated GHG emissions in 2017 equals 2.5 Gt, which also makes sense compared to 2.2 Gt in 2011 estimated by Porter, Reay, Higgins and Bomberg [
13].
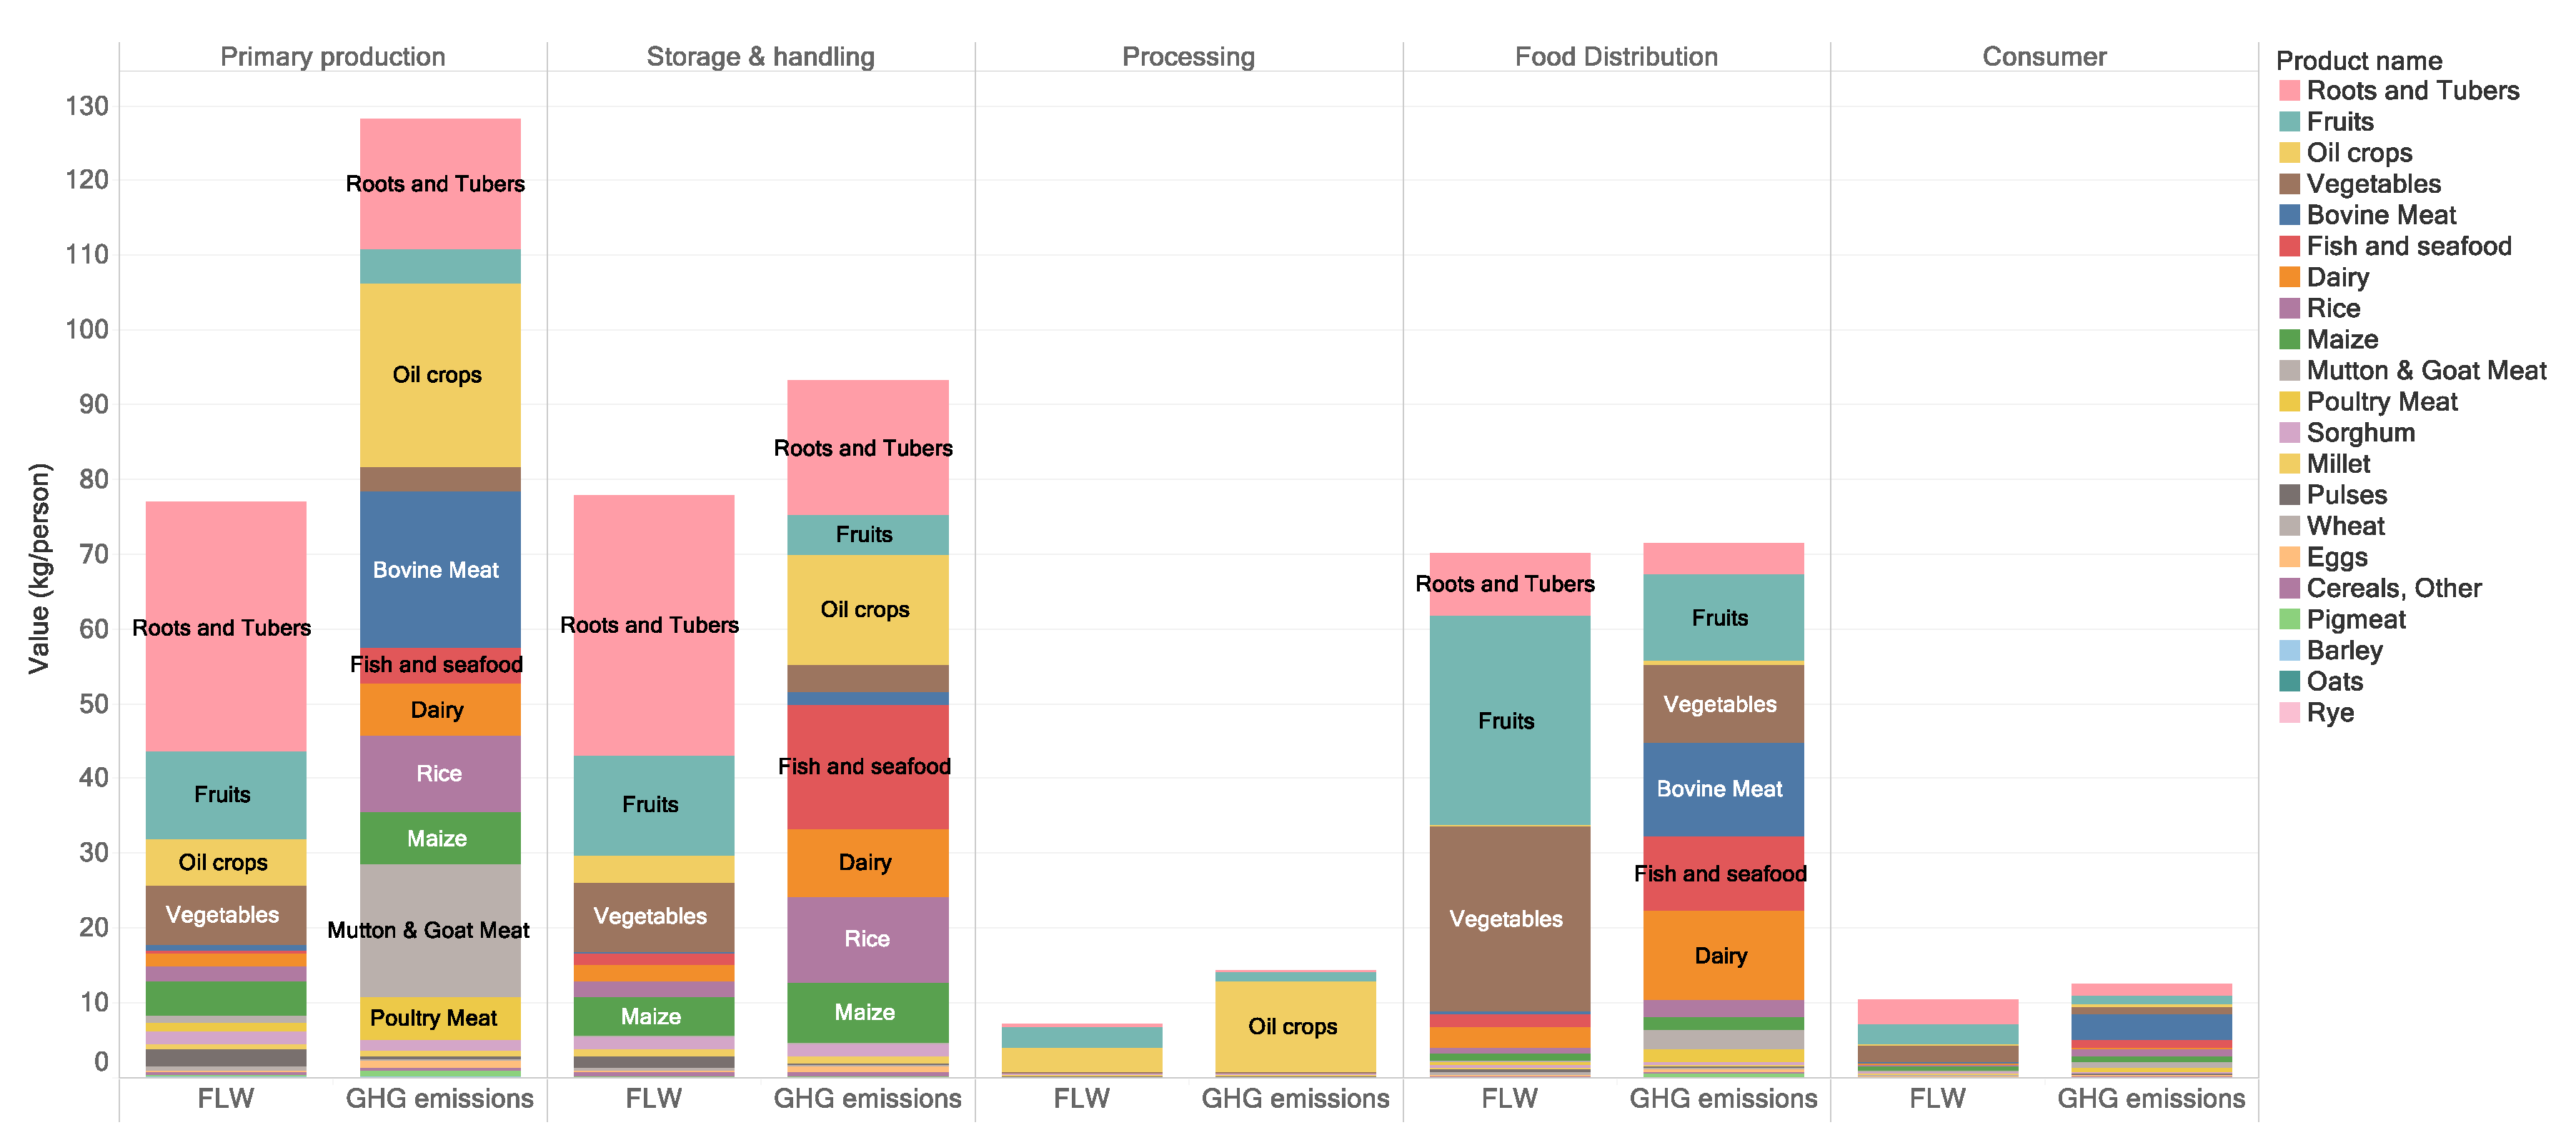
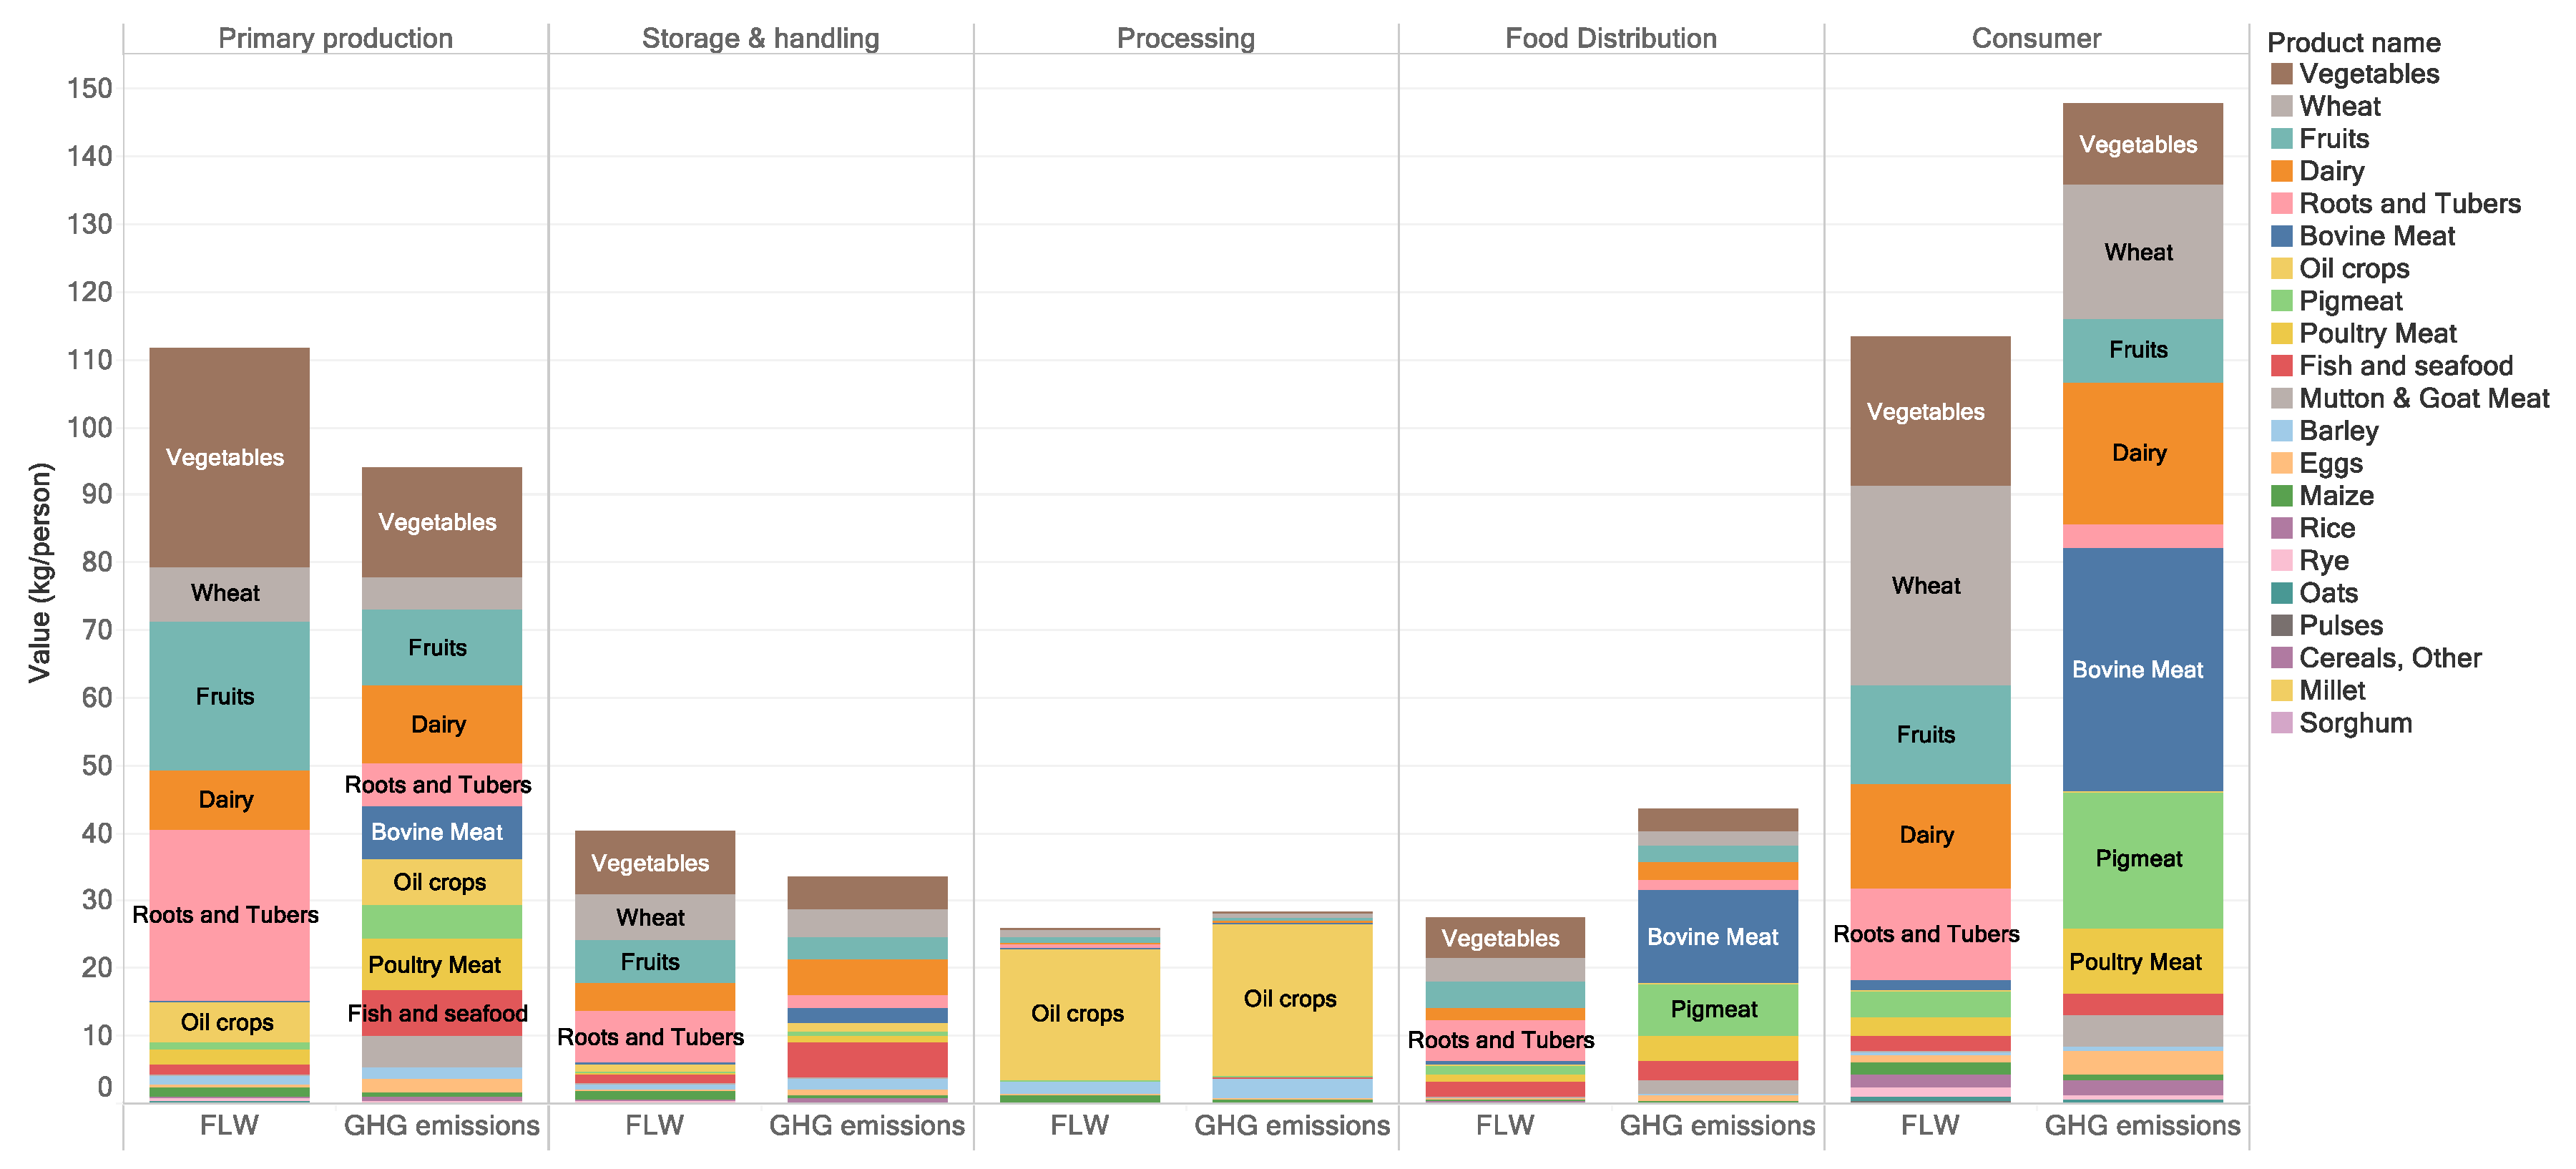
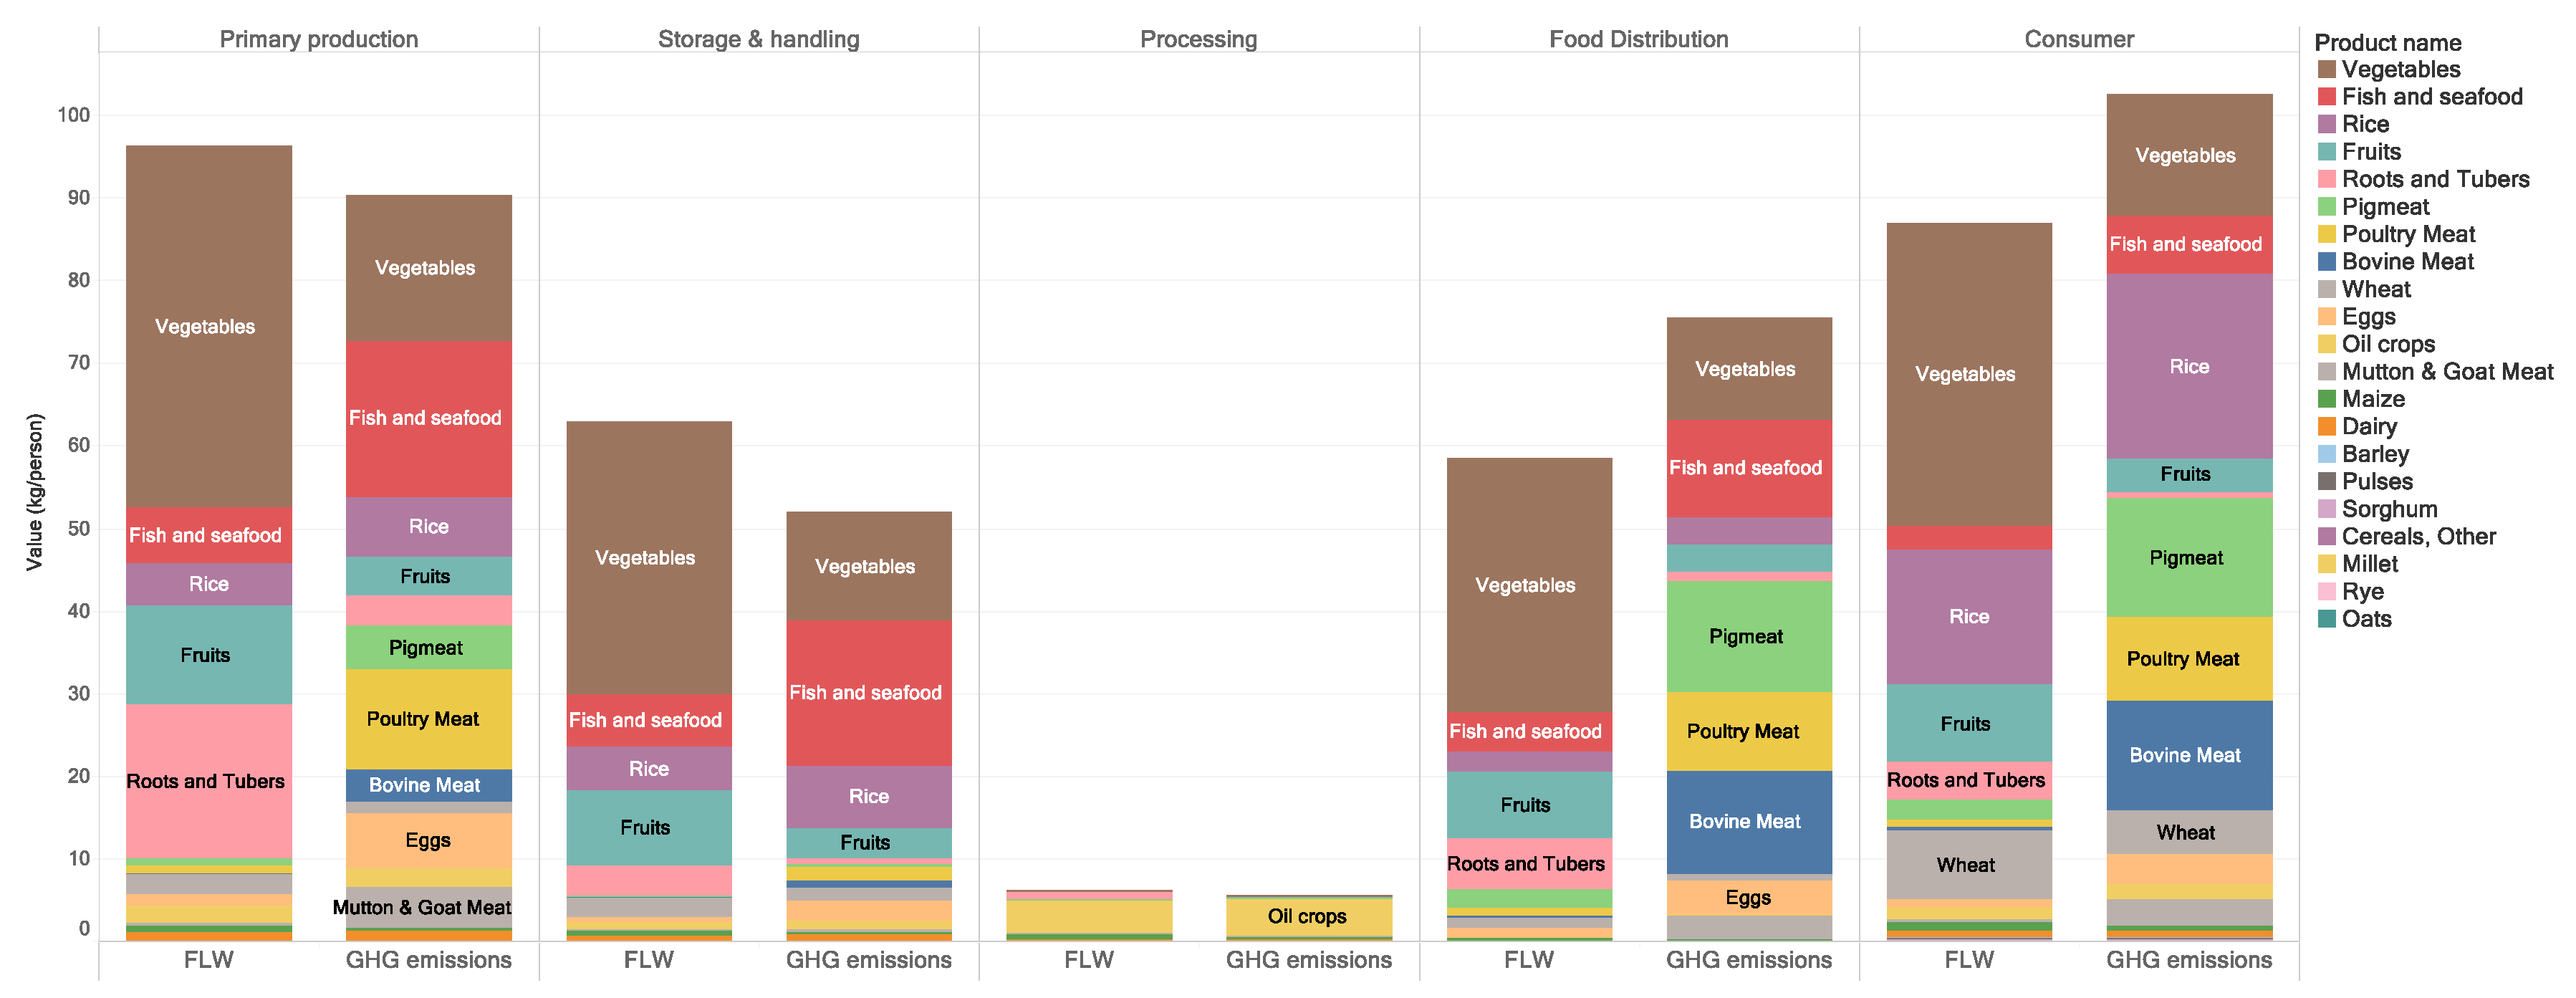
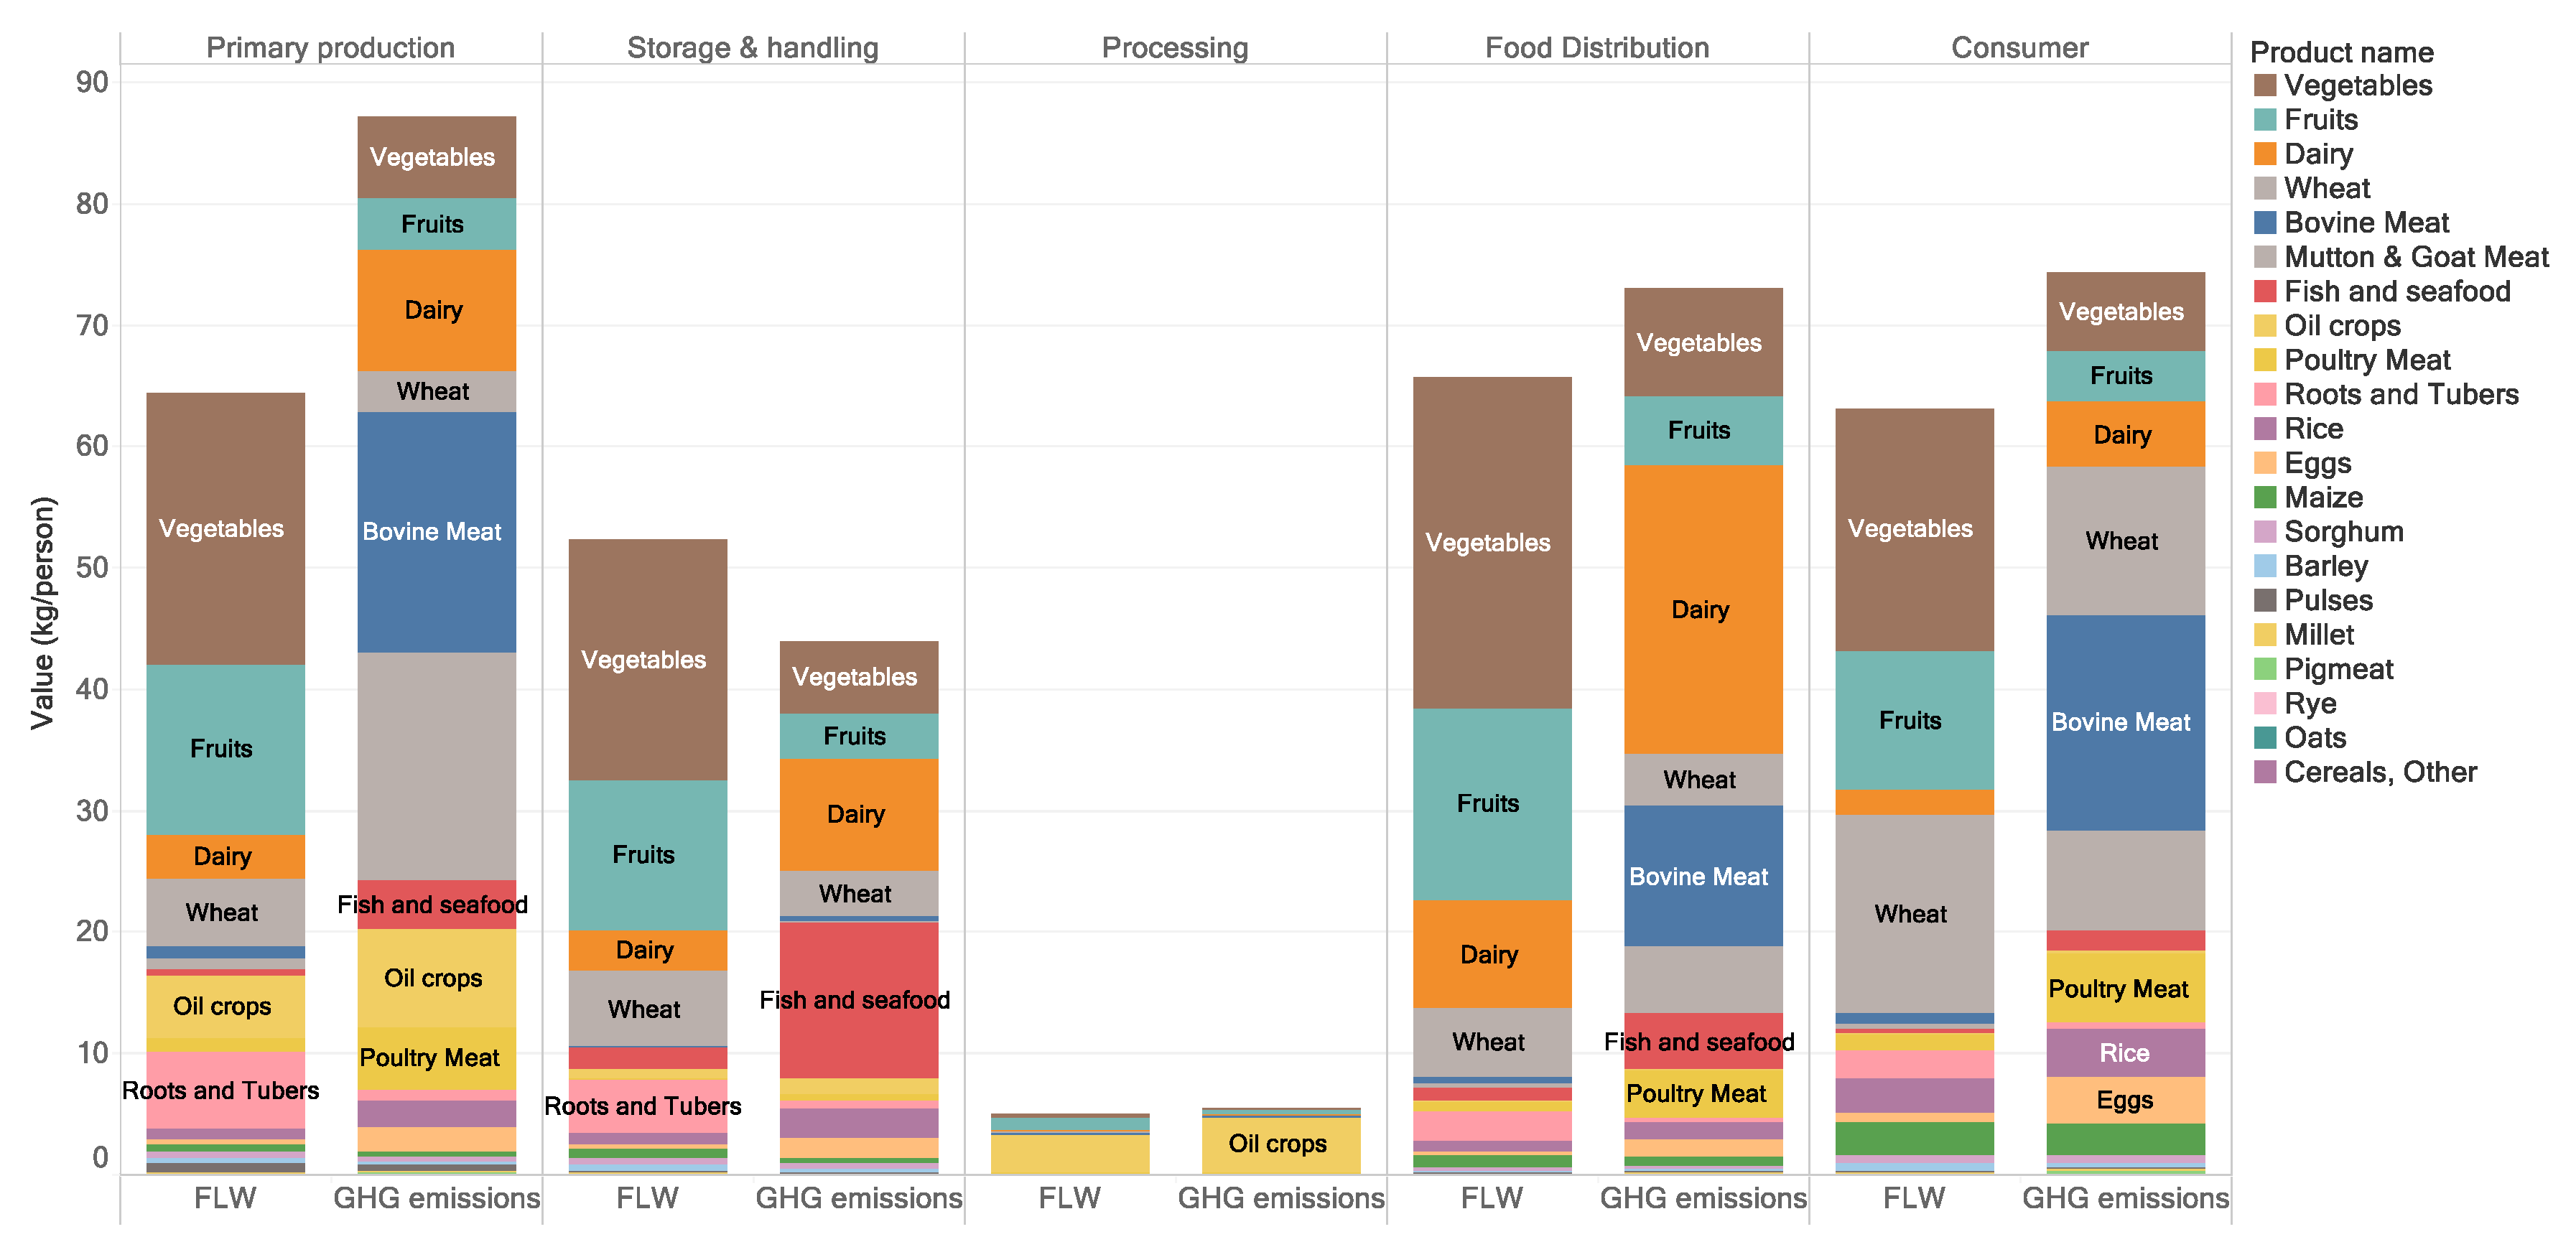
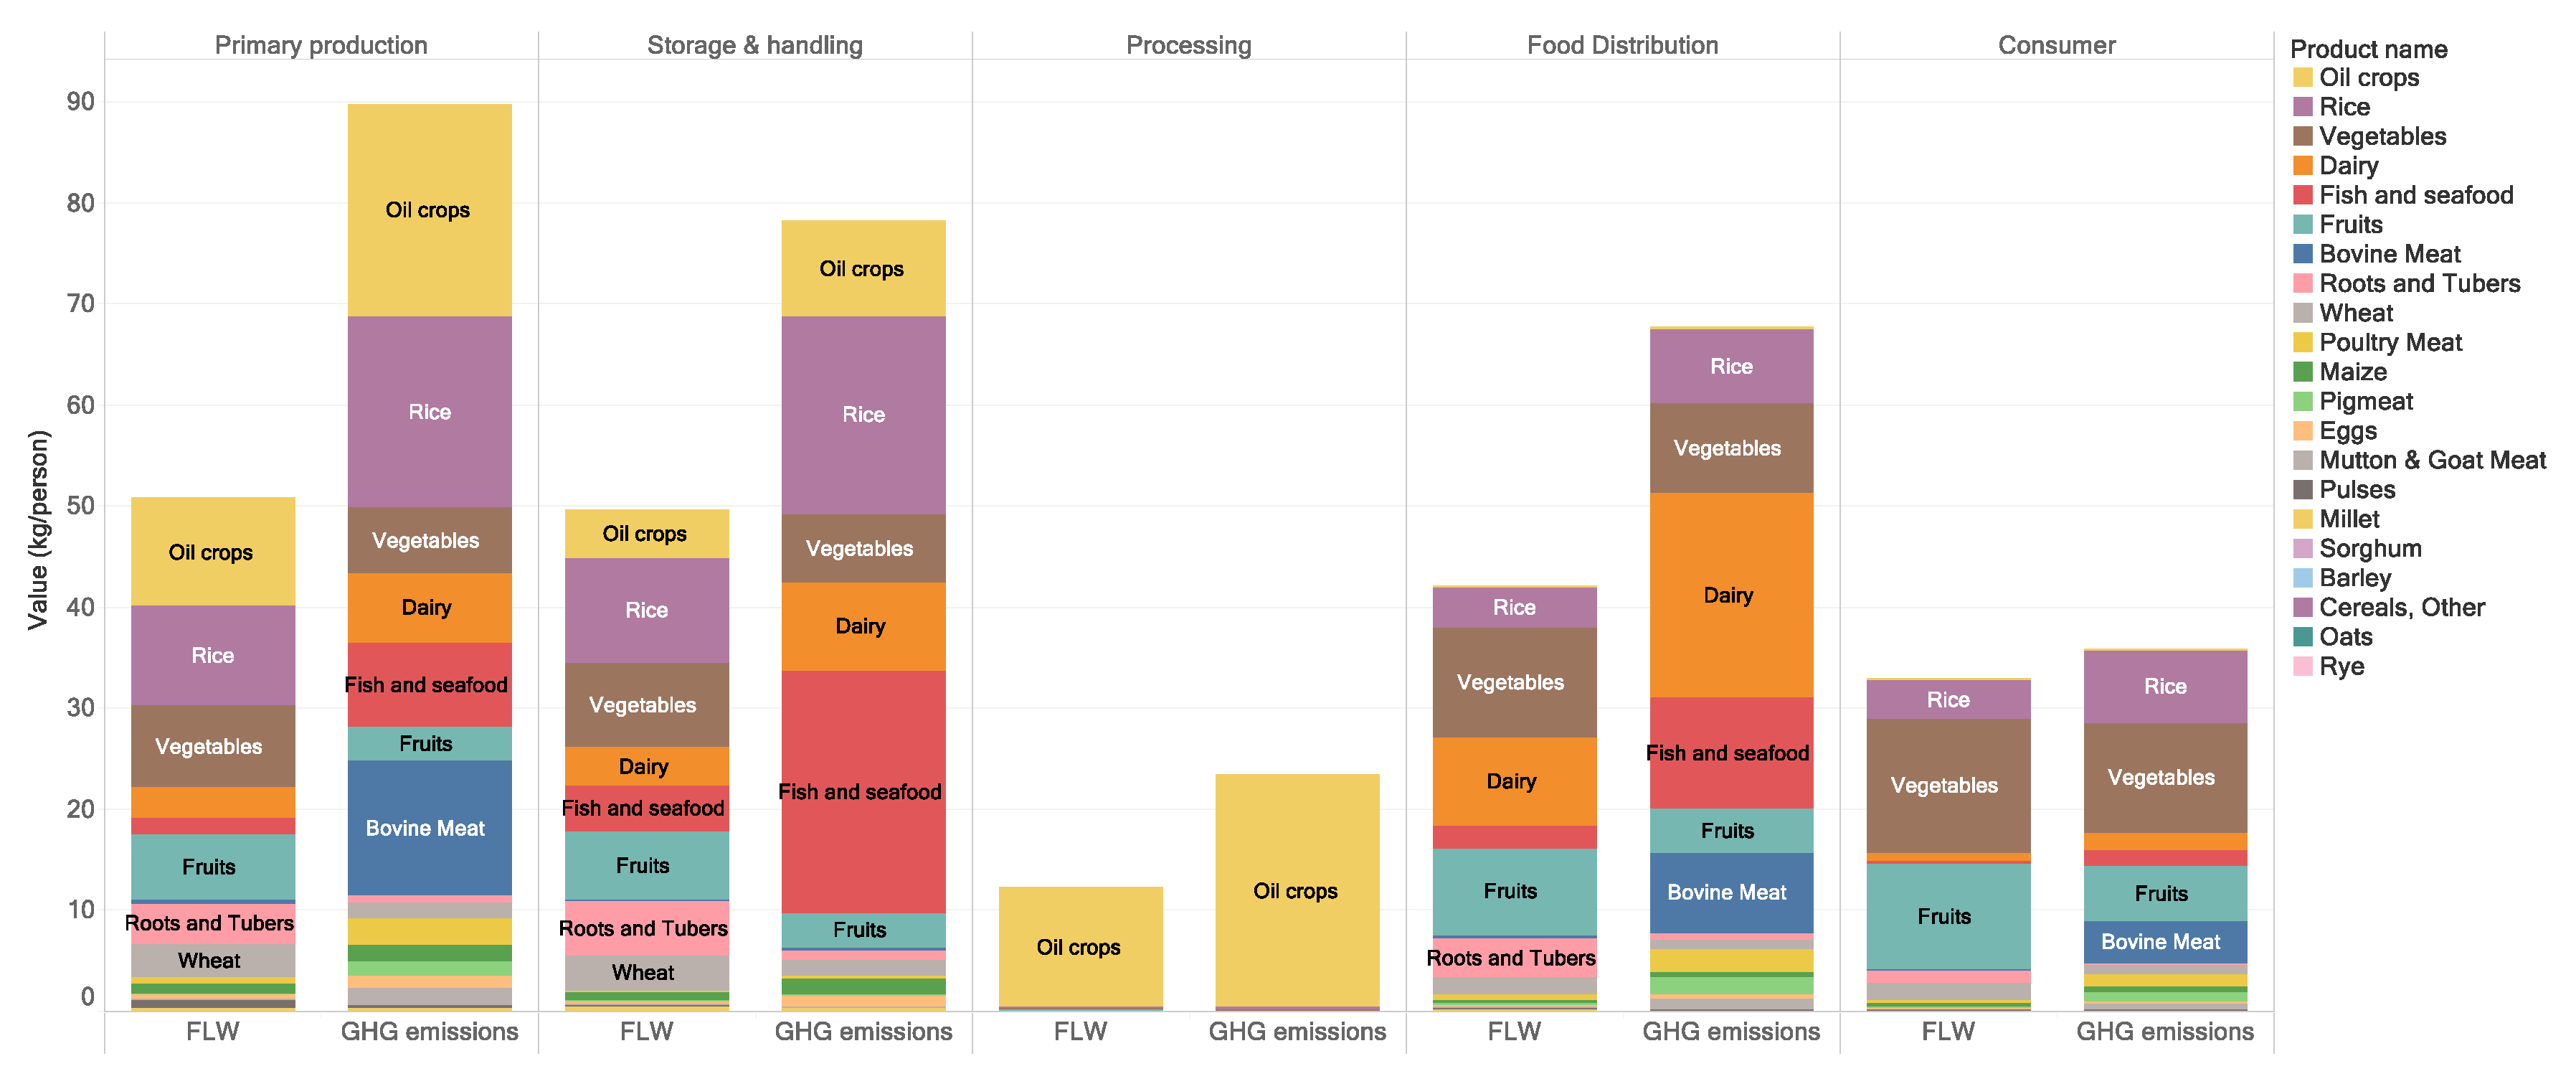
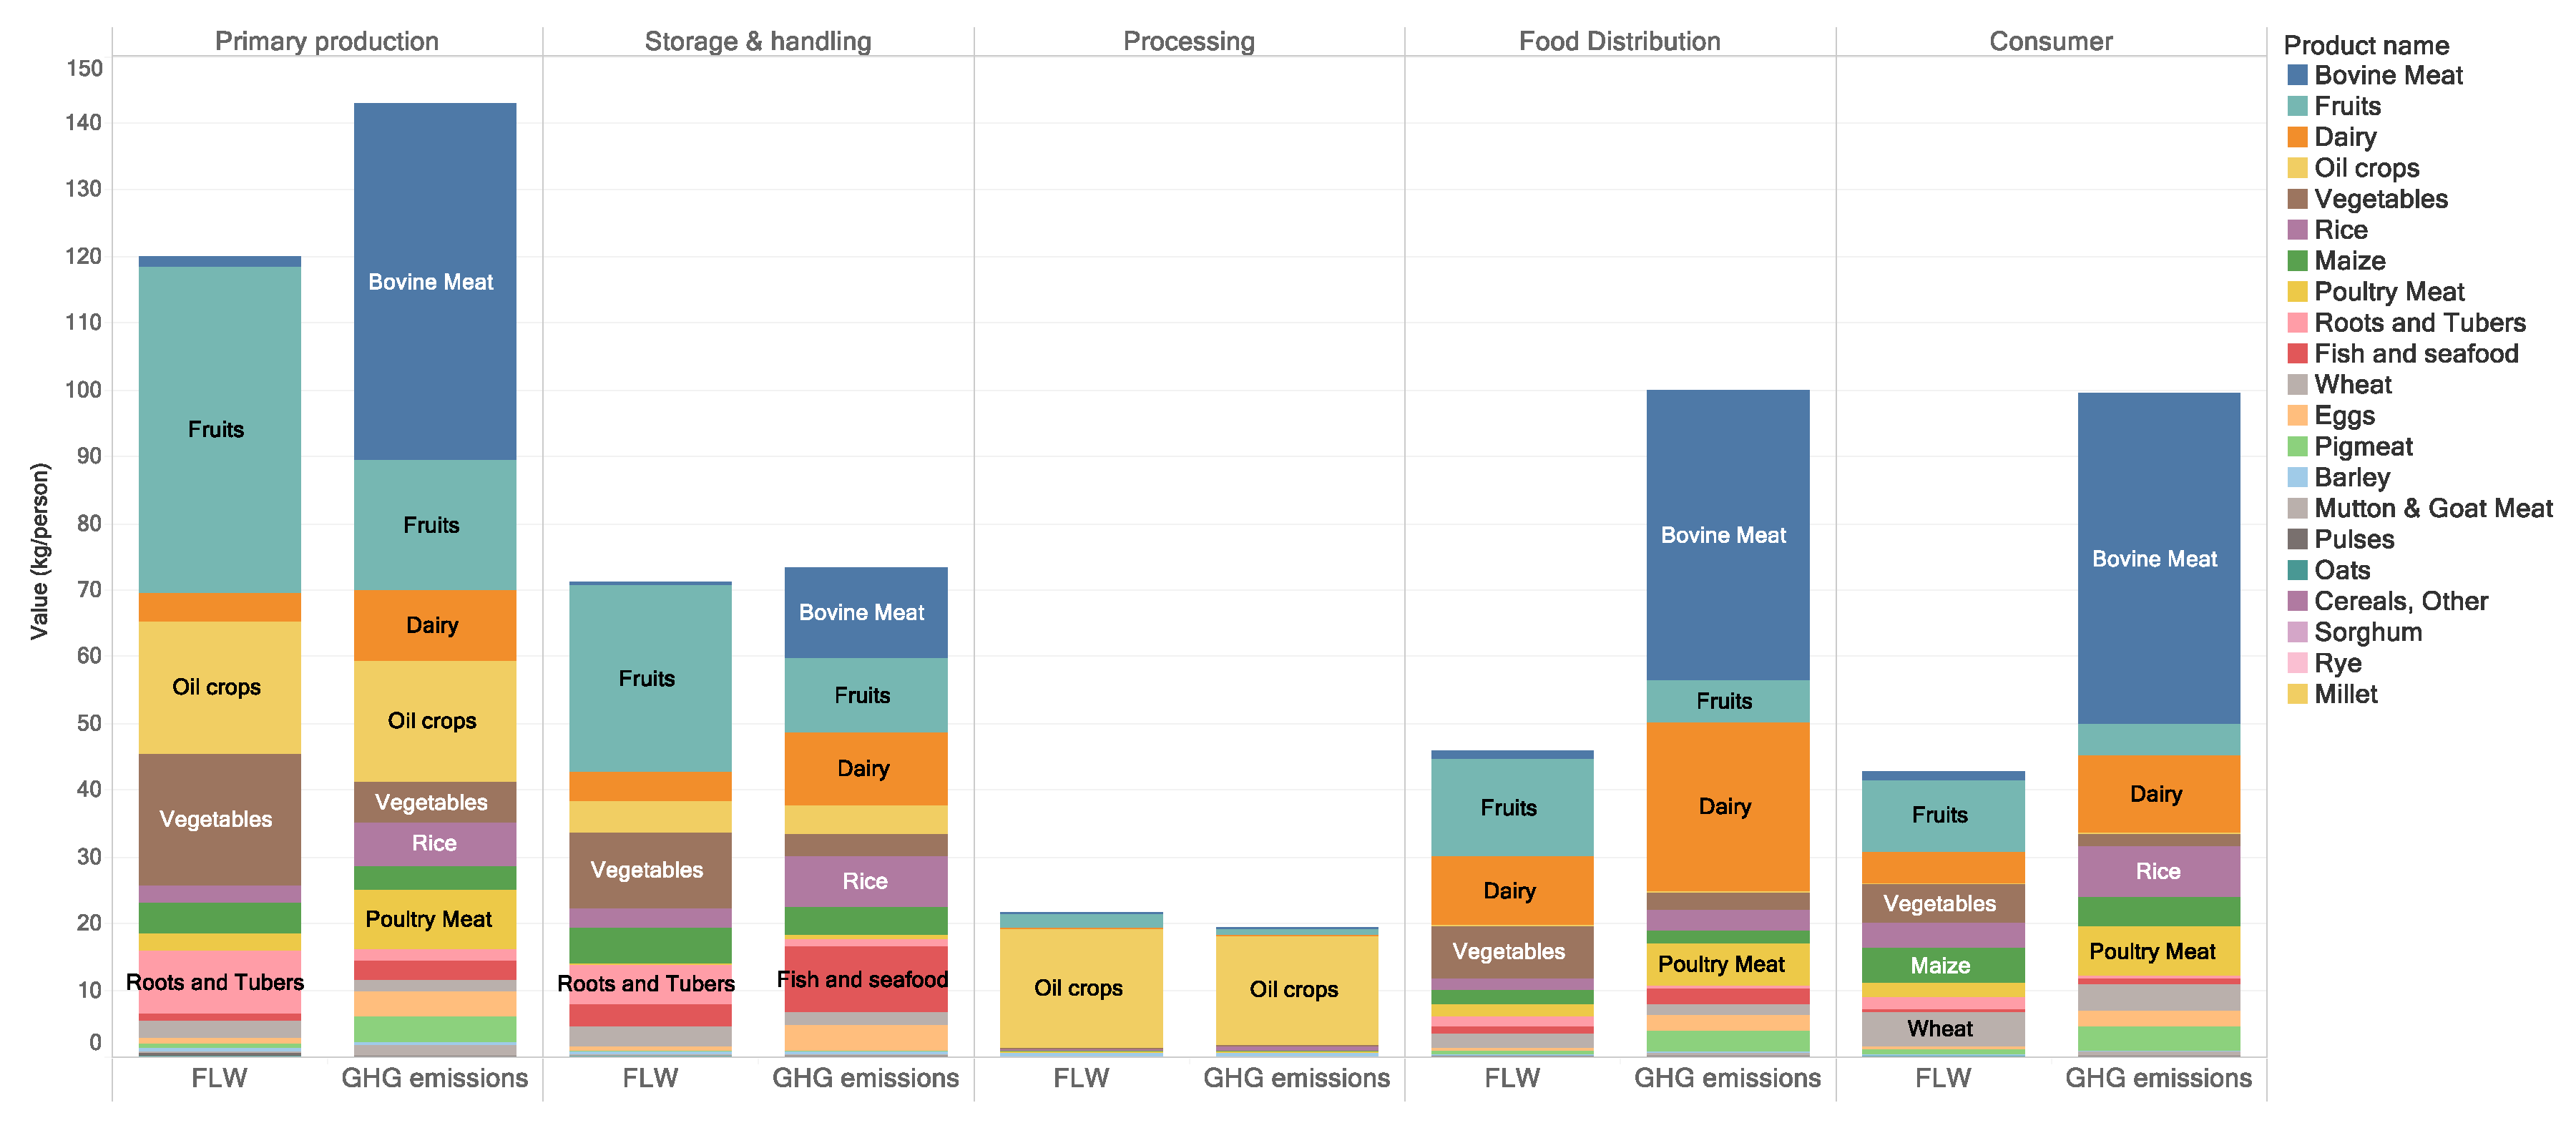
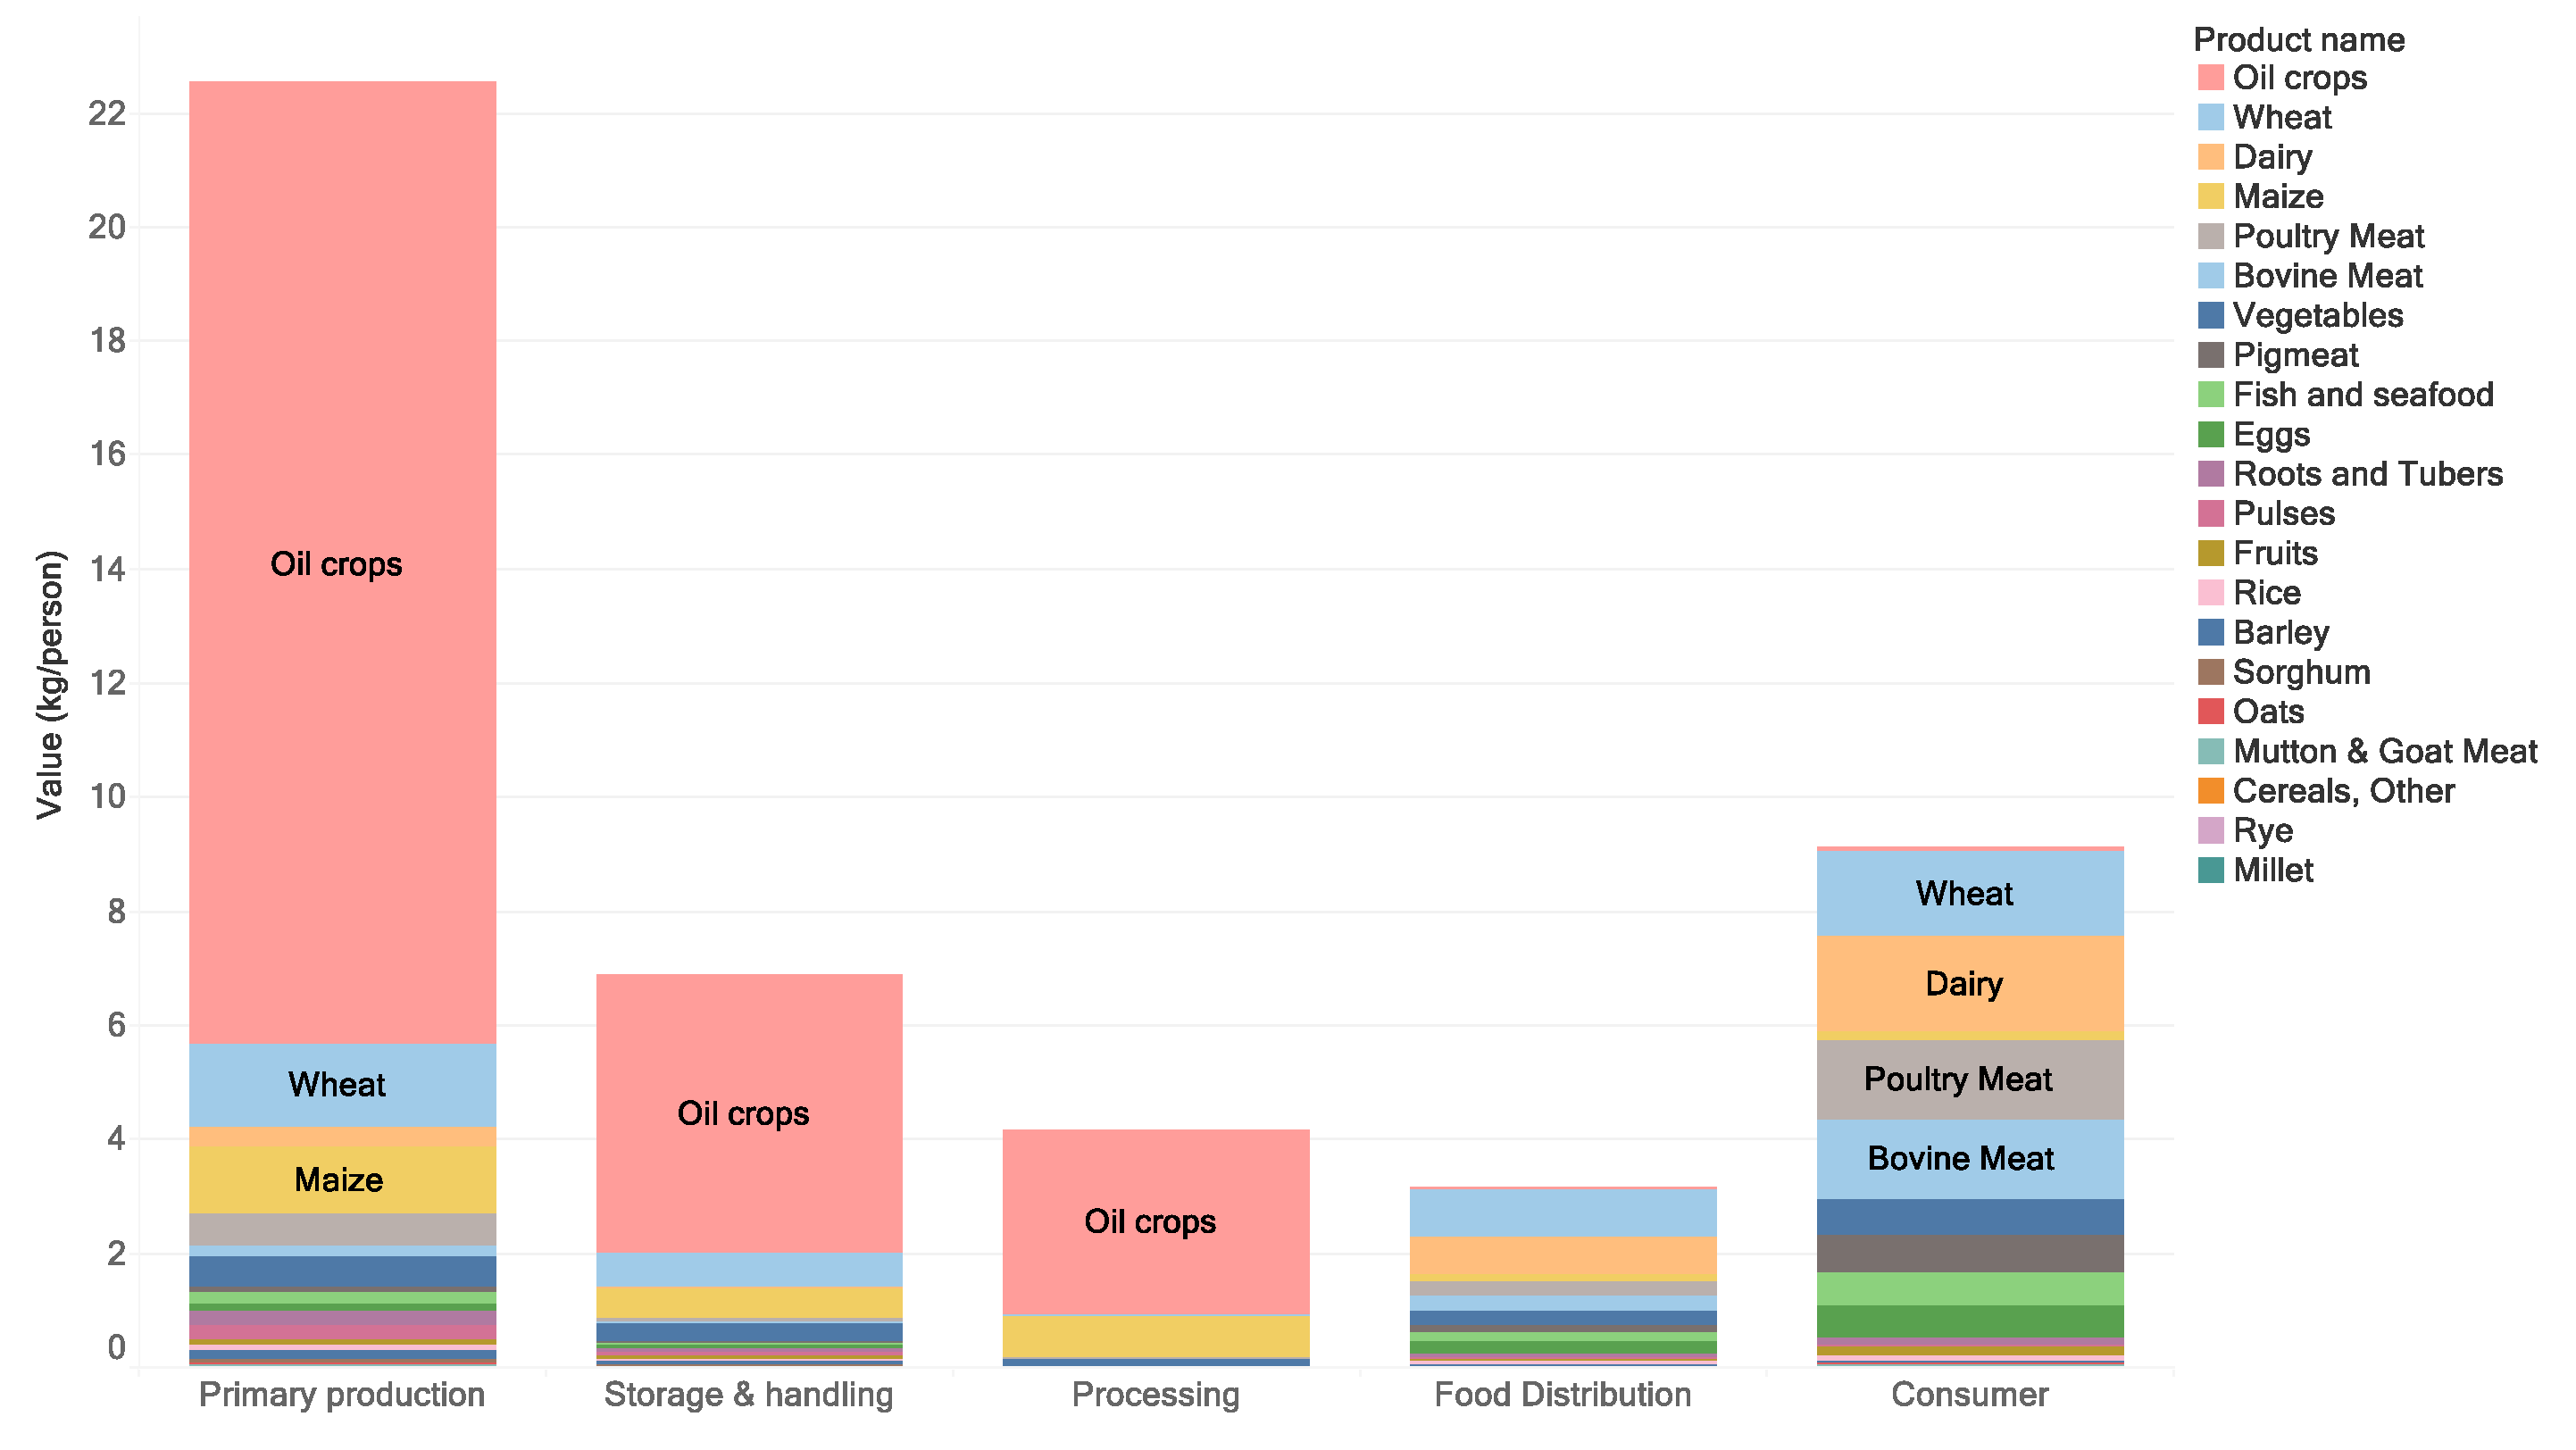
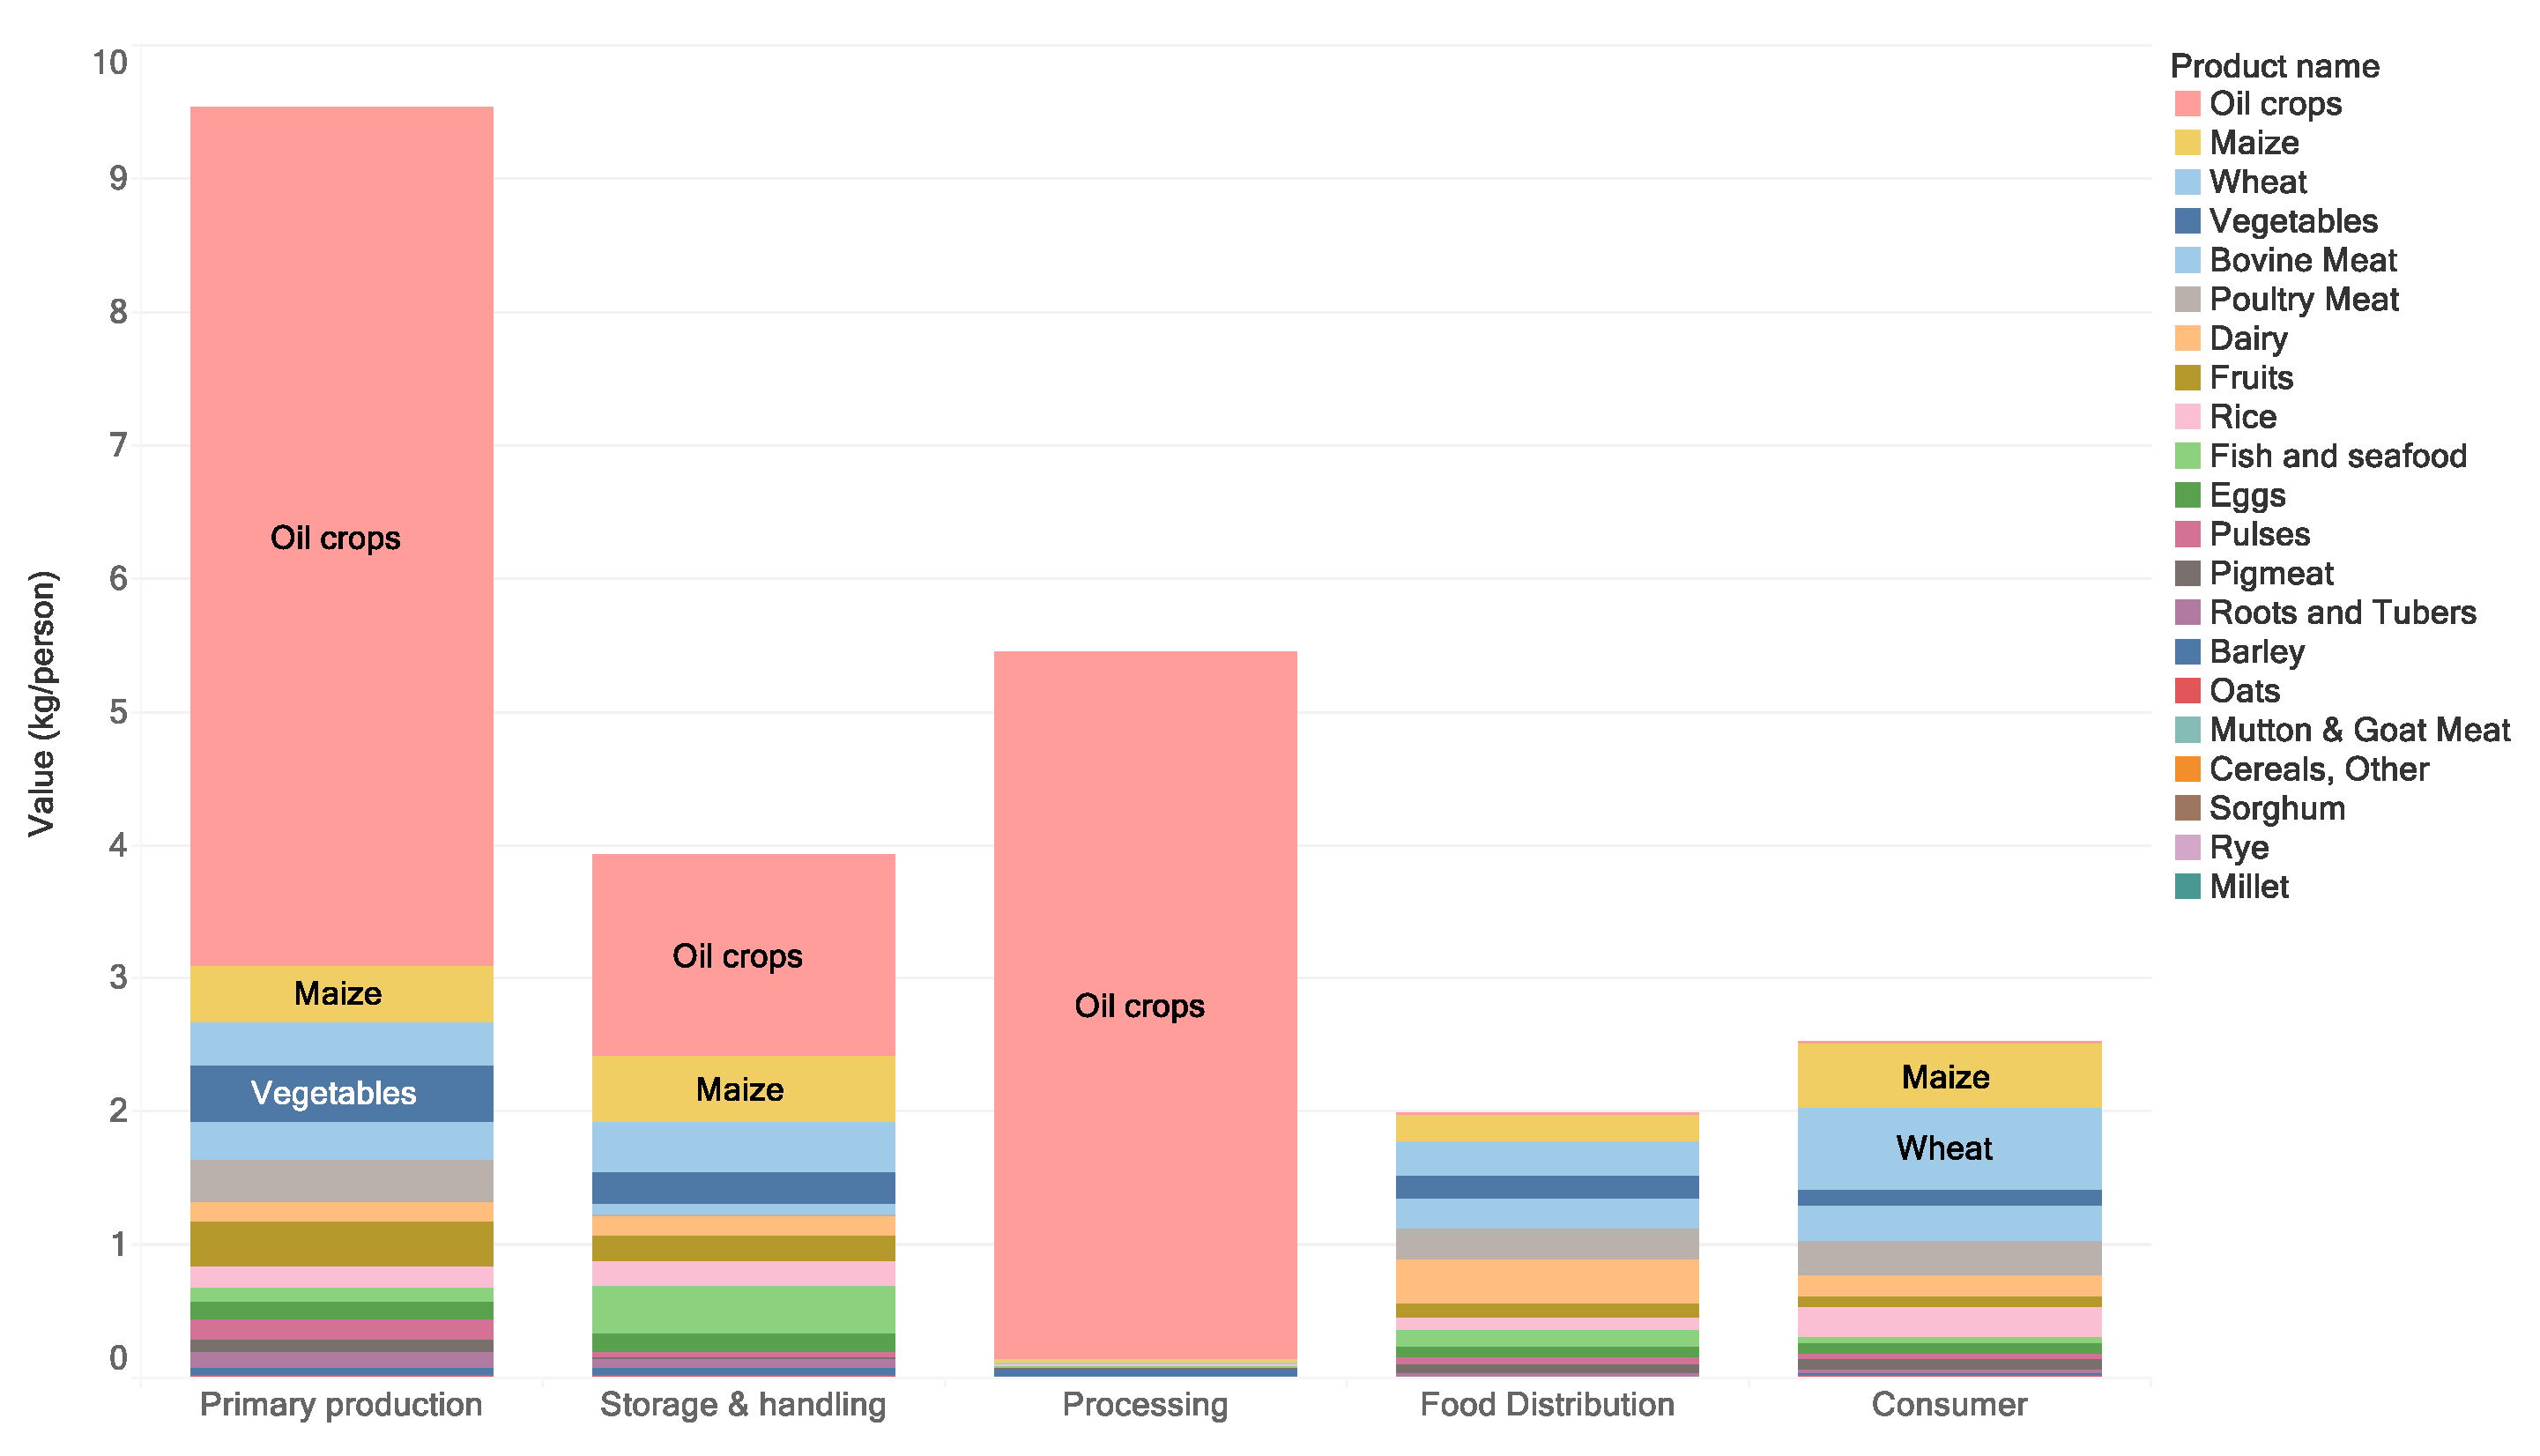
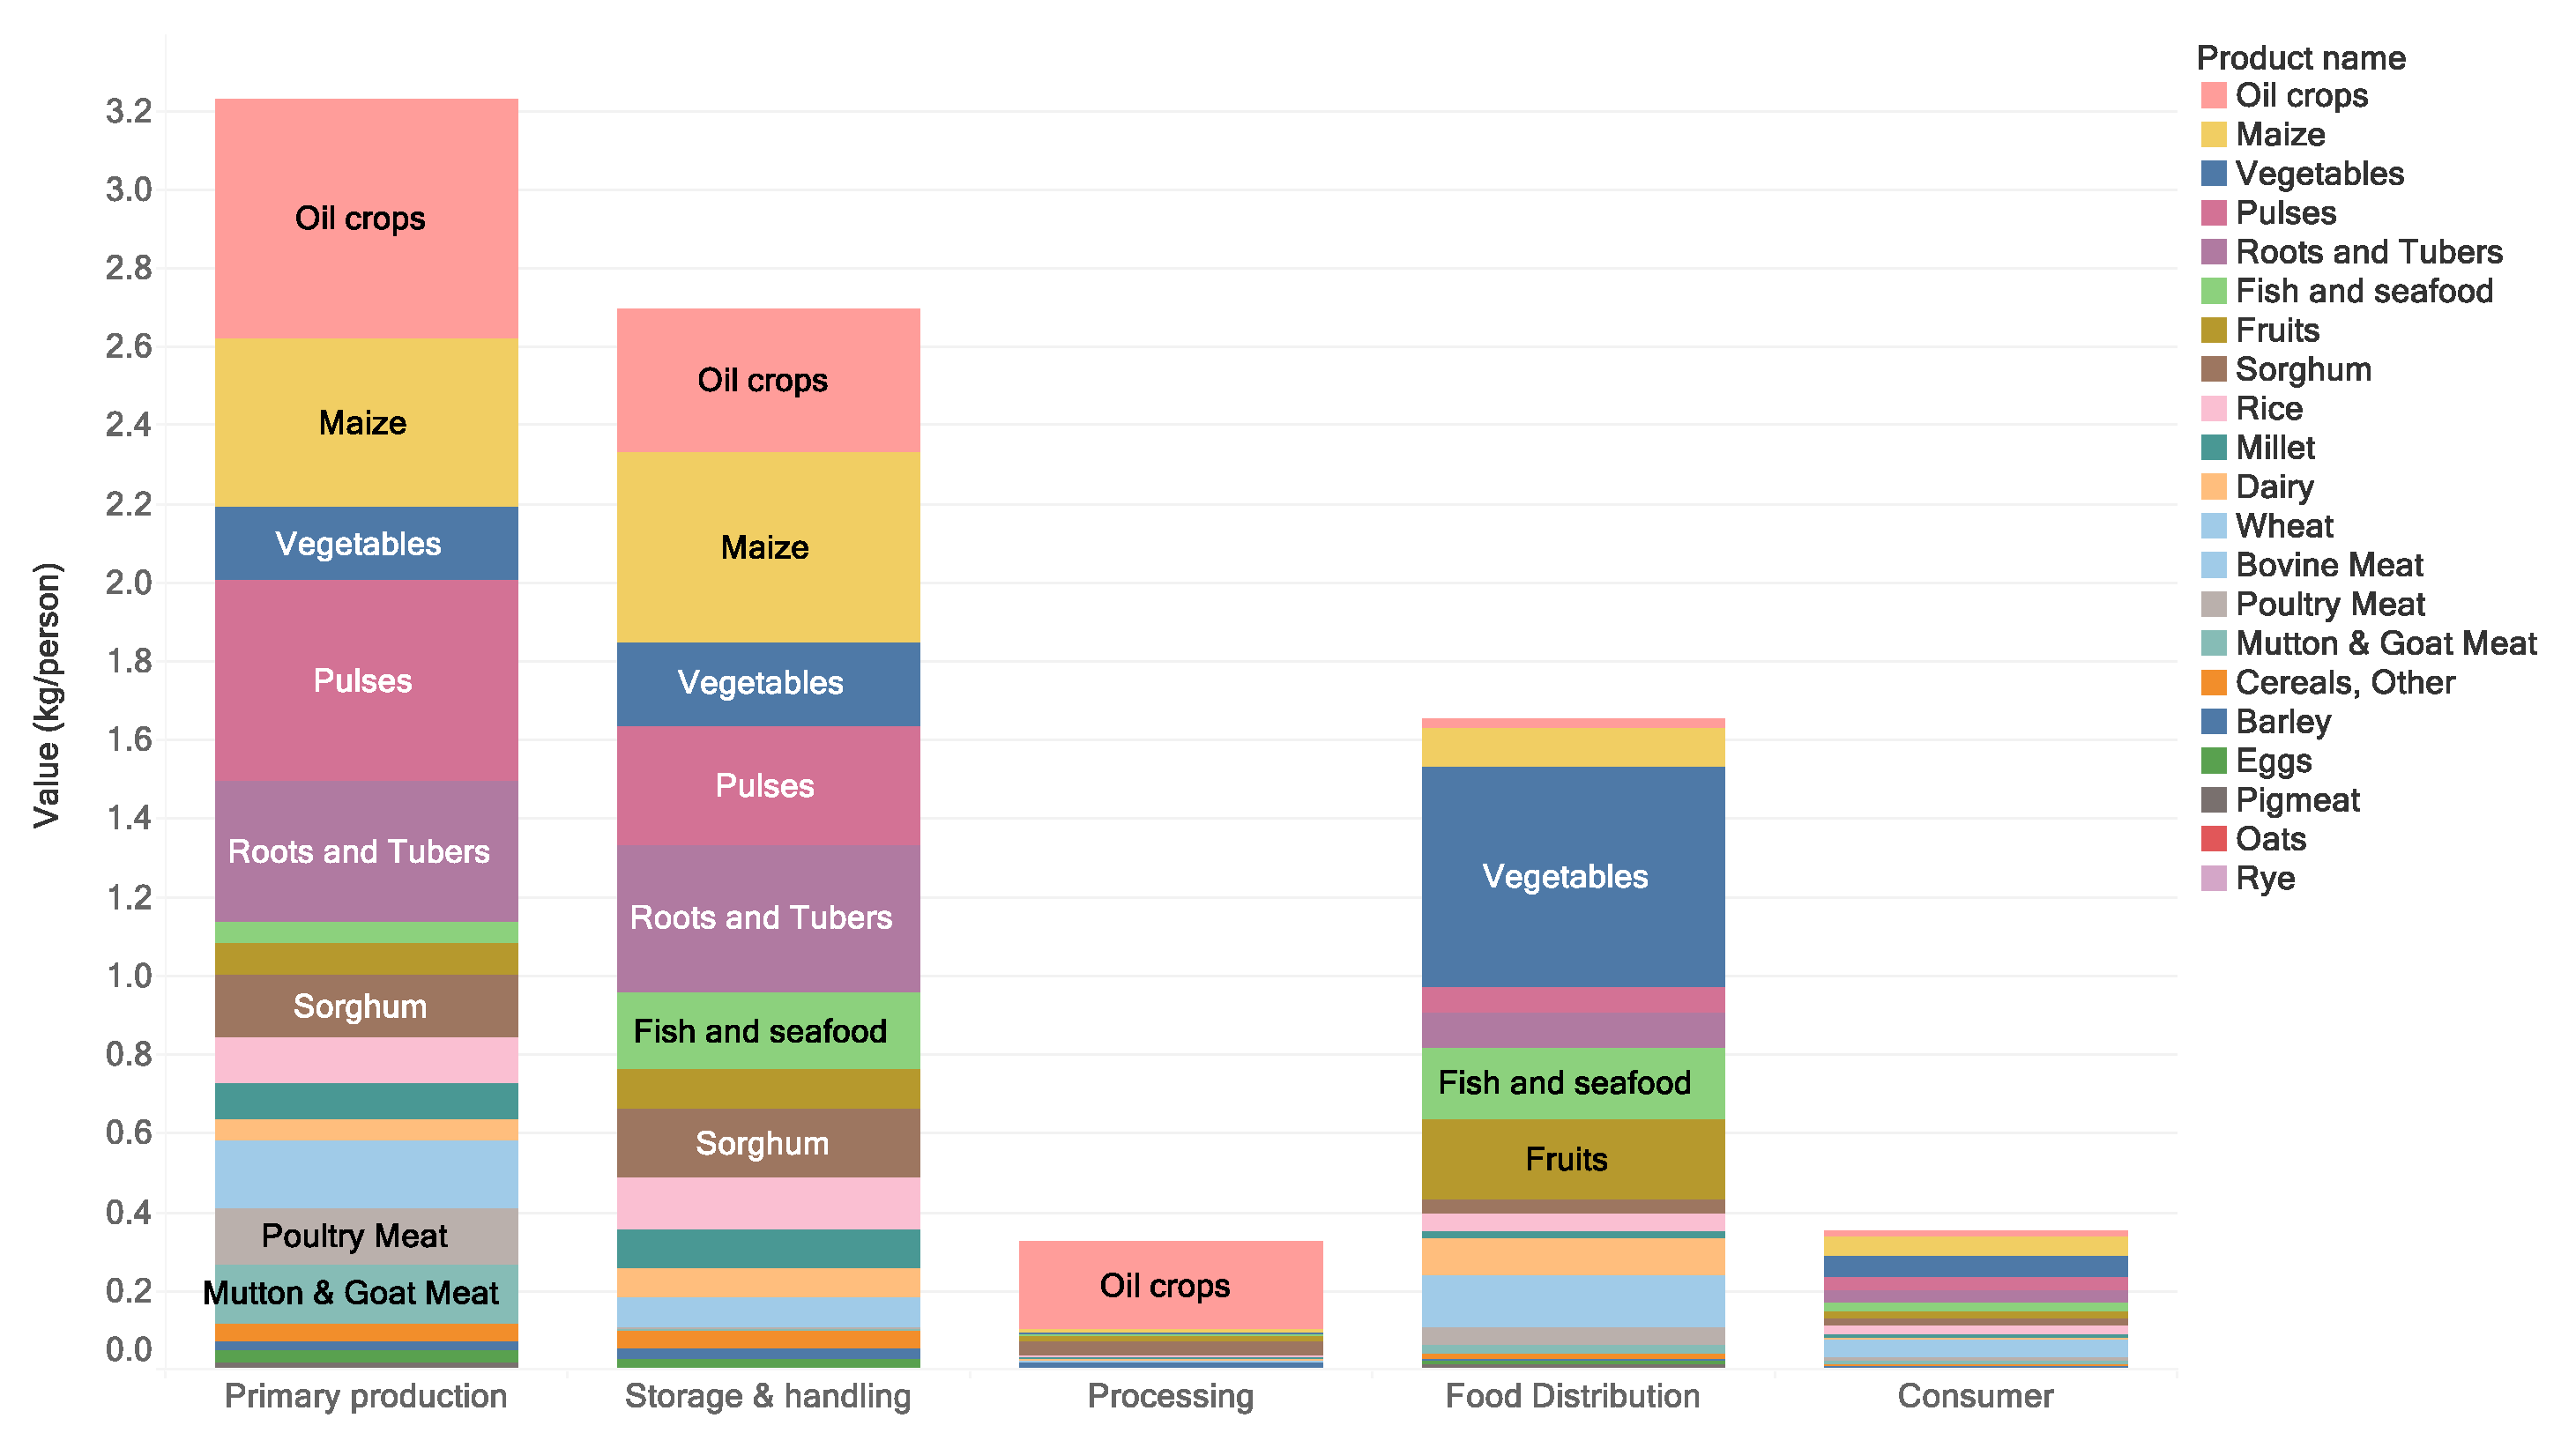
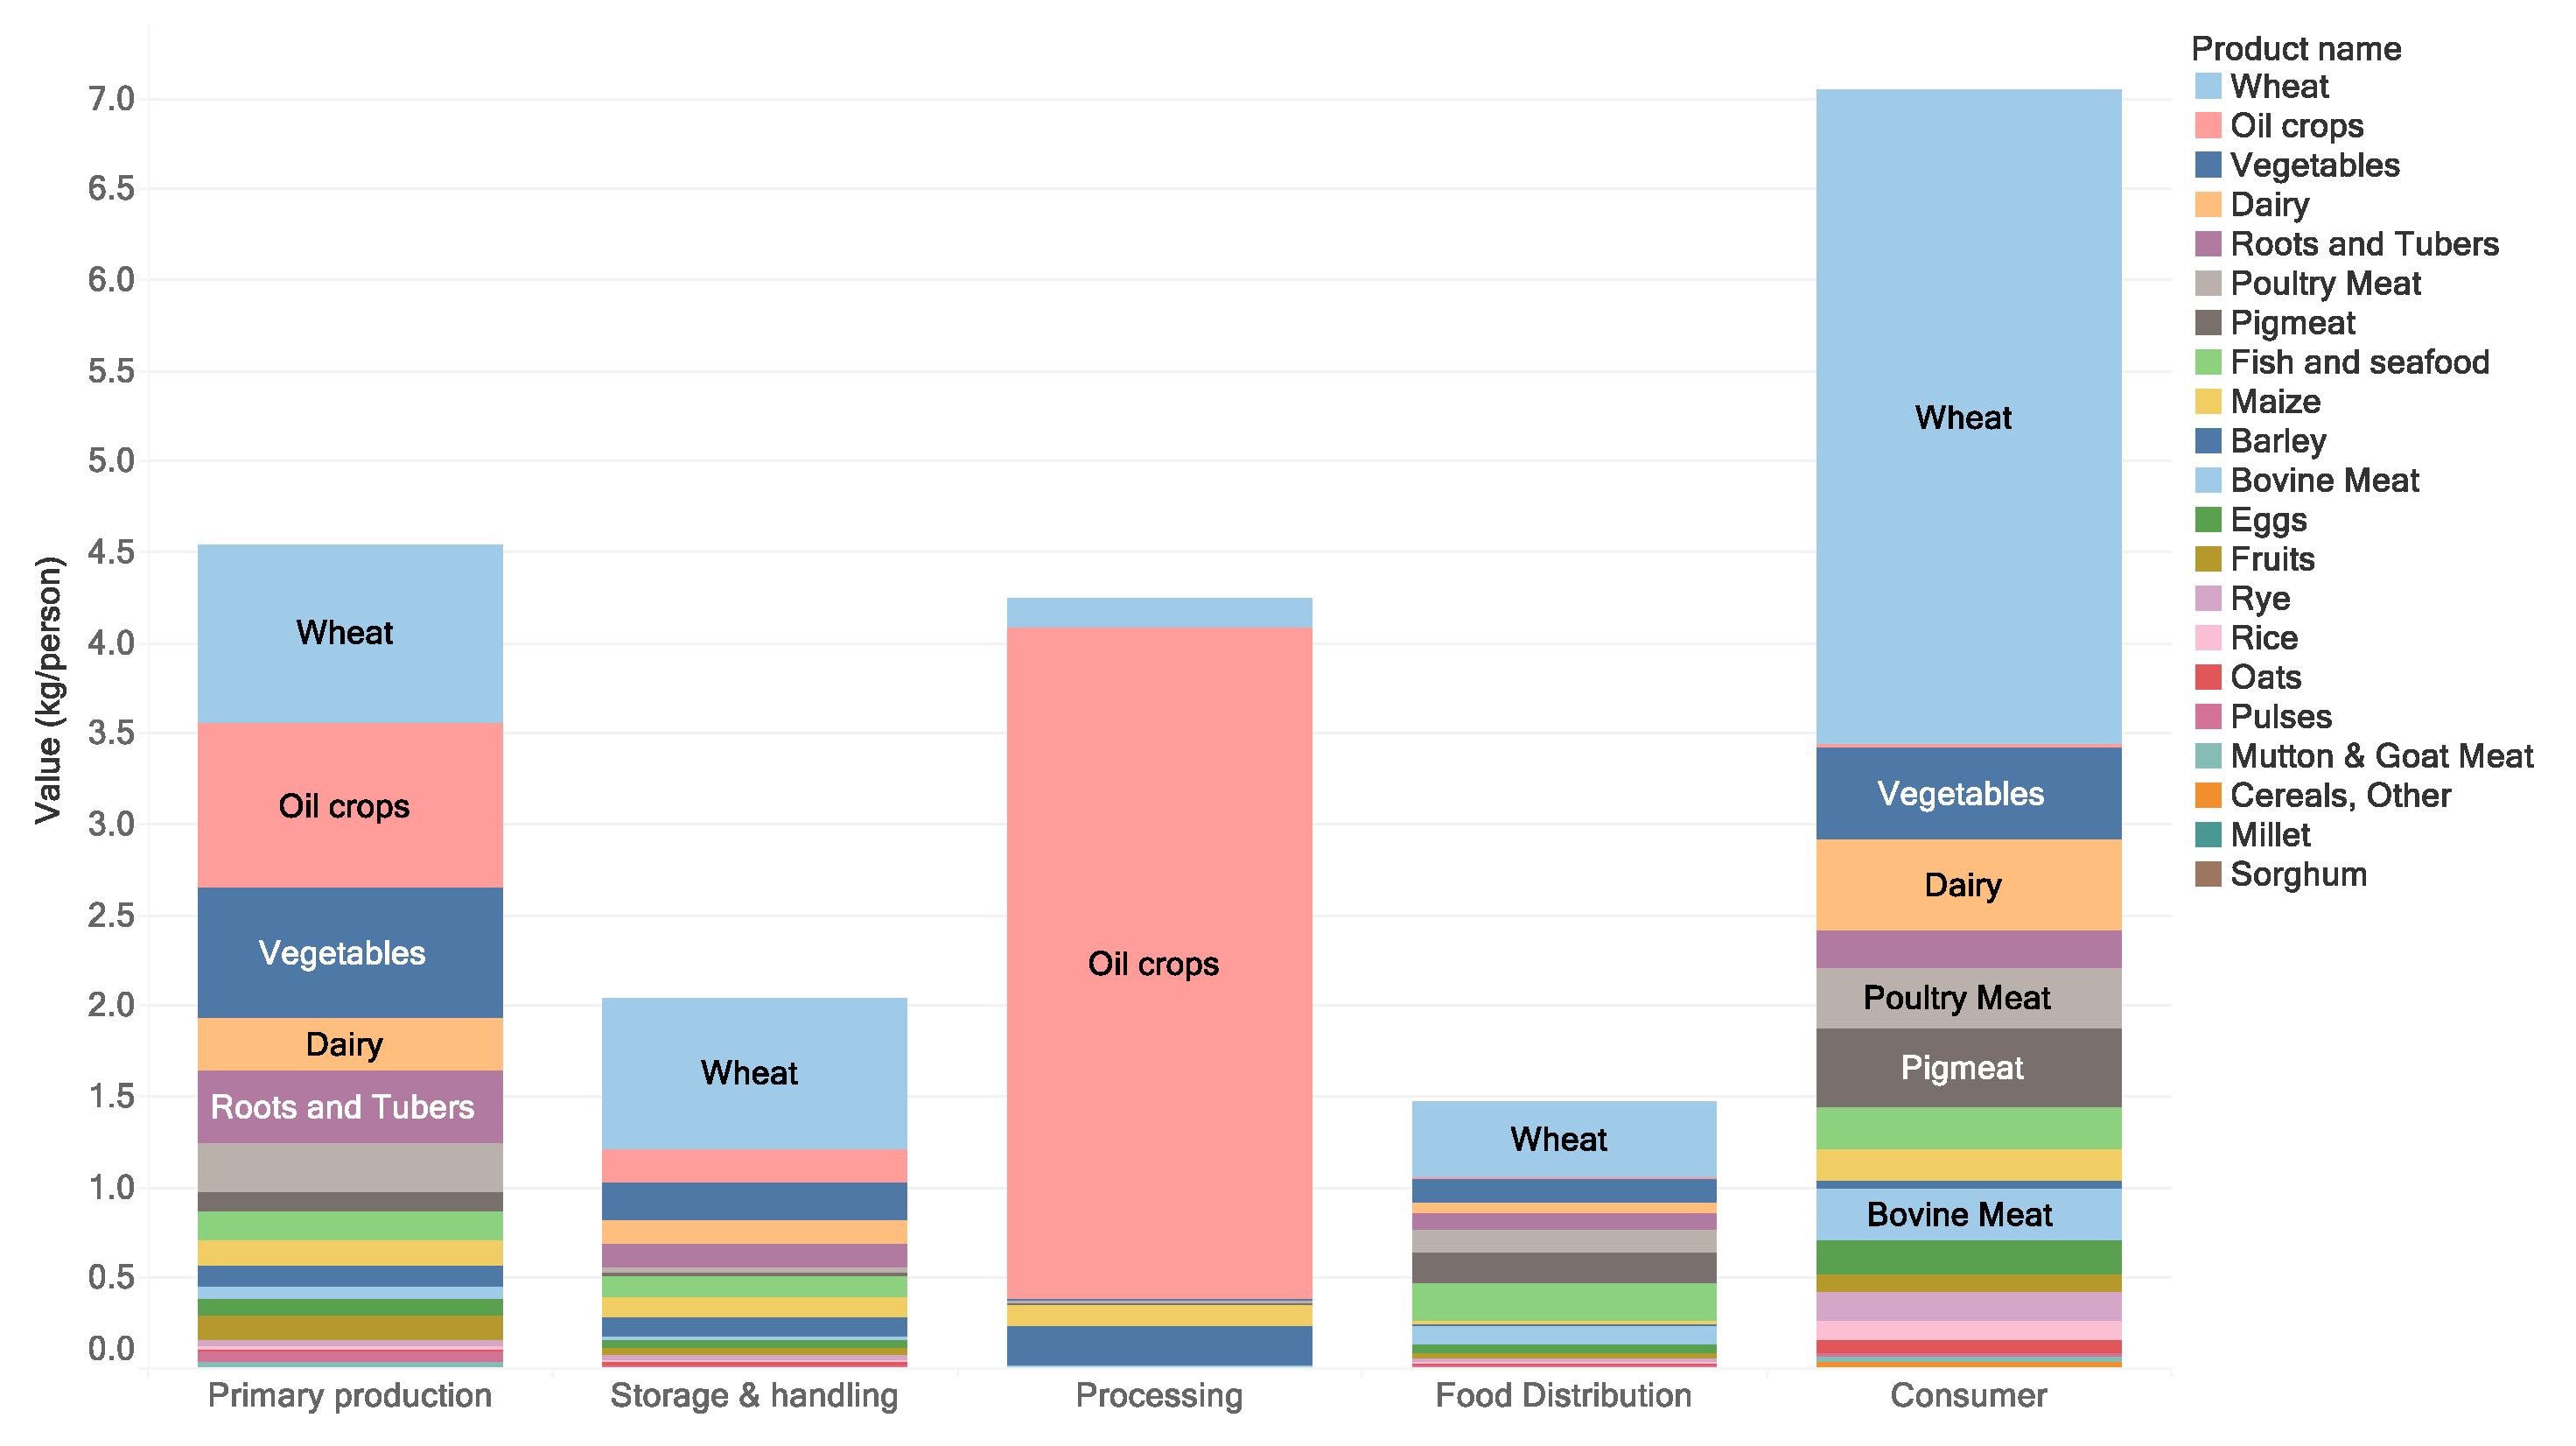
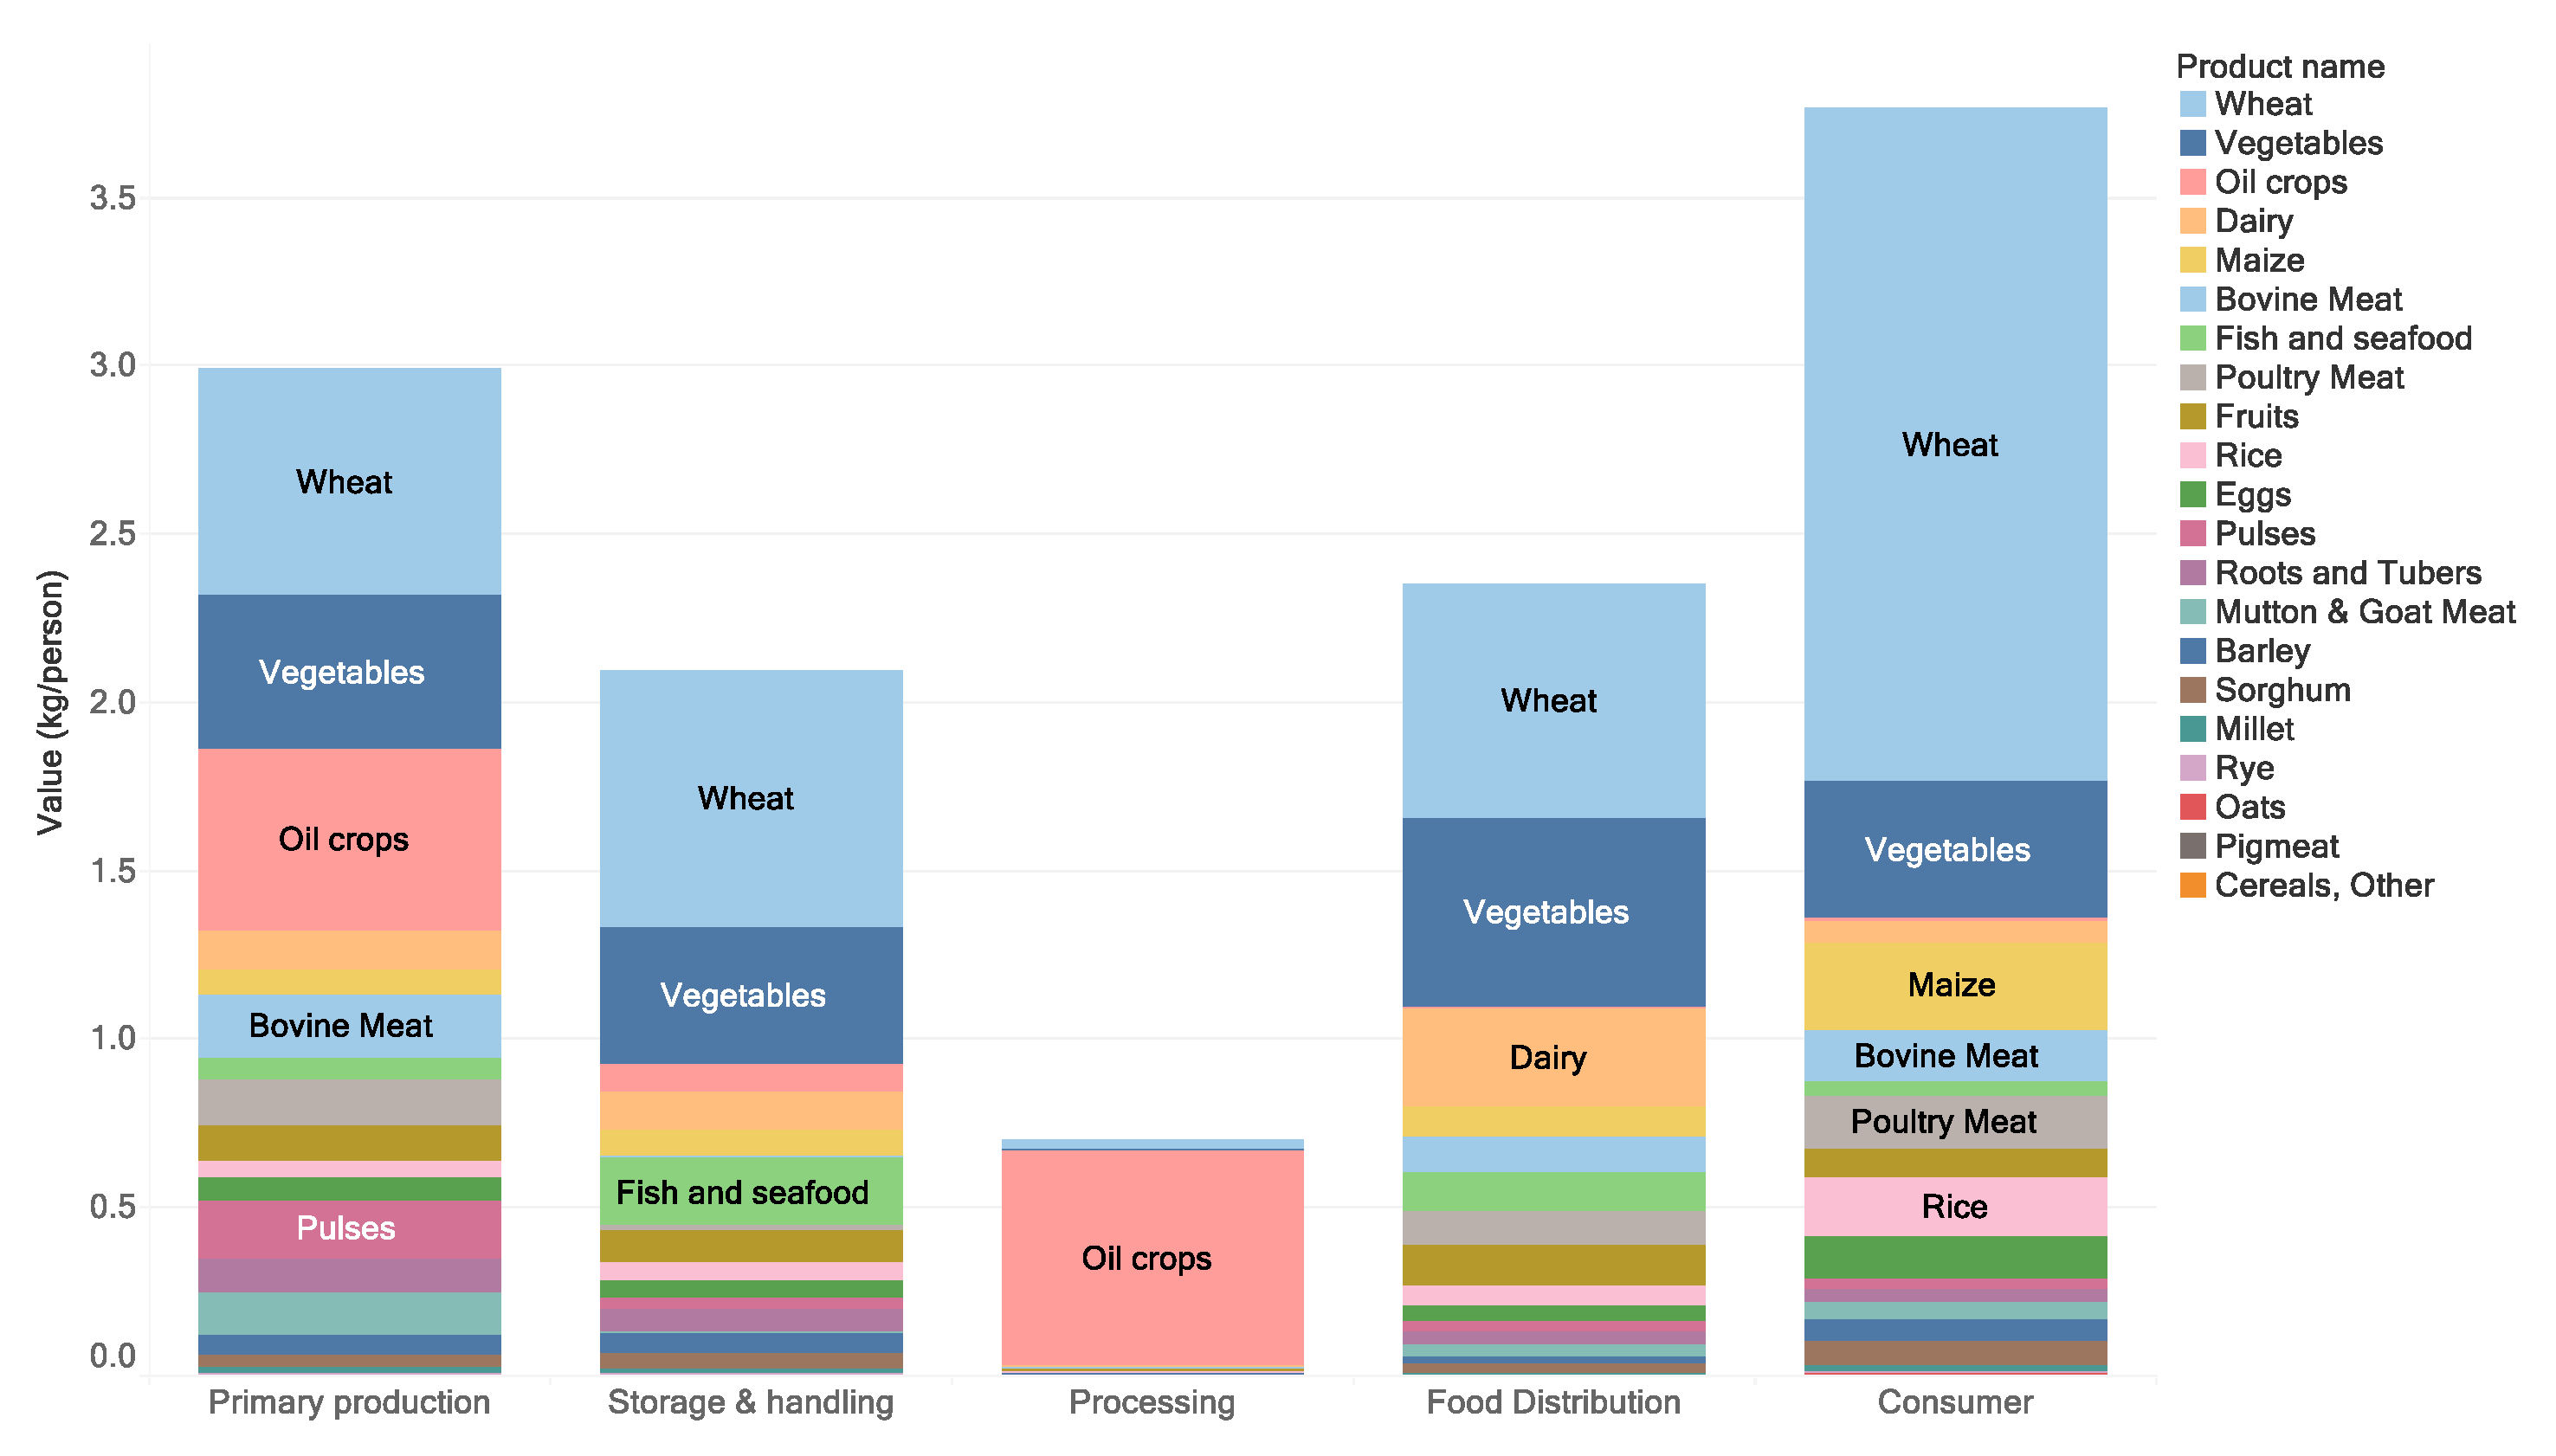
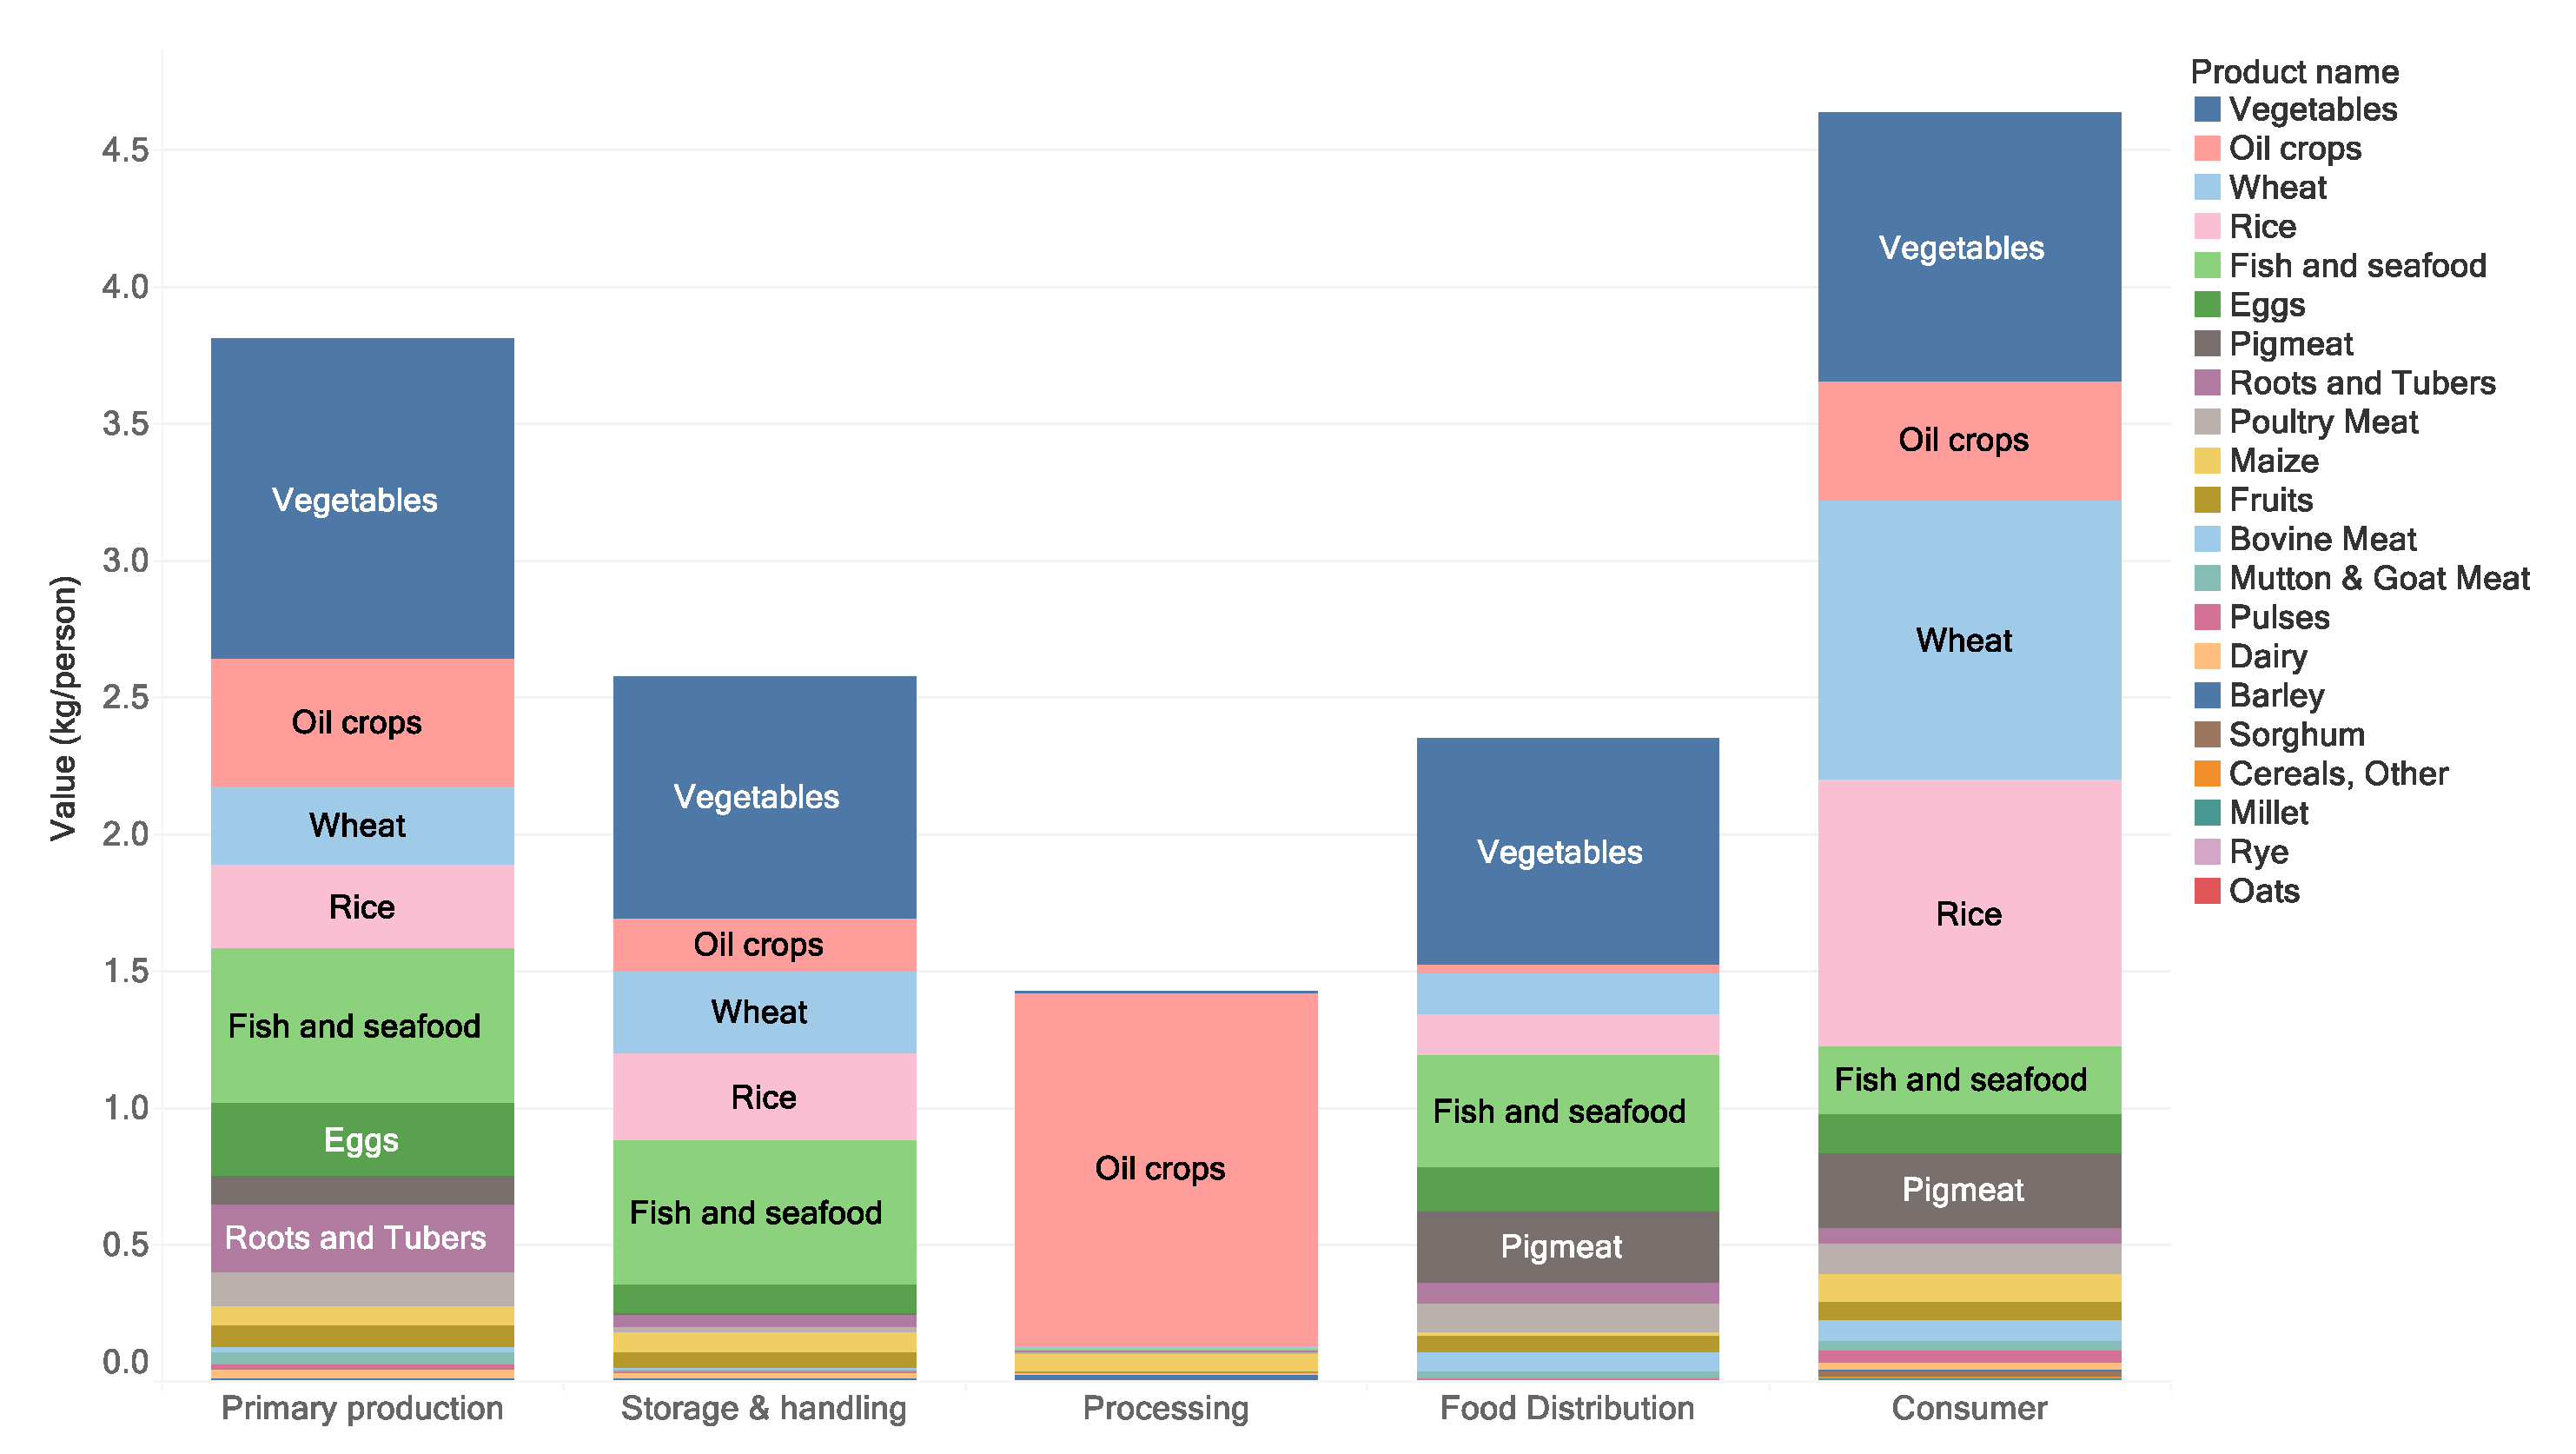
Specific to the food items, fruits and vegetables are the major contributors to global FLW. Bovine meat leads to significant FLW-associated GHG emissions, especially in the consumer stage of North America and Oceania (i.e., GHG emission footprint of the FLW at the consumer level considering the emissions from the primary production activities and international food transportation). Moreover, oil crops are the dominating source of protein losses. The different hotspots identified by different criteria underpin the importance of addressing the FLW issues from various aspects of sustainability. Namely, from the point of view of reducing GHG emissions, policymakers should focus on designing intervention strategies to reduce beef consumption; however, from a nutrient perspective, it is more sensible to put more resources in reducing the losses for oil crops. The policymakers therefore should make a balanced plan considering the trade-offs between different intervention points given the intervention resources are limited.
The total GHG emissions due to international food transportation are marginal compared to the primary production-related GHG emissions. This confirms the alleged dominating role for primary production in GHG emissions of the global food system. For example, Hamerschlag and Venkat [
40] indicated that the primary-production-phase GHG emissions for meat products including beef, lamb, pork, and poultry account for 50% to 90% of the full-life GHG emissions. For the non-meat products, including milled cereals, dairy, and various types of fruits and vegetables, the percentages are between 60% to 85% [
41,
42,
43]. Scherhaufer, Lebersorger, Pertl, Obersteiner, Schneider, Falasconi, De Menna, Vittuari, Hartikainen and Katajajuuri [
39] demonstrated that for the EU countries, the primary-production-phase GHG emissions are as much as 93% of the full-life GHG emissions for beef. As to other animal products, the percentages are 78%, 75%, 64%, and 63% for milk, pork, fish, and chicken, respectively. The number is 86% for the greenhouse-grown tomatoes and 60% for bread.
In the aforementioned primarily animal-related data, the high emission factor of the agricultural production is dominant. As the opposite, in plant-based products, with much lower crop emission factors, post-harvest operations have relatively large contributions and therefore deserve close attention. However, owing to the diverse characteristics of post-harvest chains and the lack of relevant data, we have not yet included them into our calculations.
4.2. Limitations and Future Research
There are also limitations to this study. Firstly, the data used for the hotspot analysis are secondary data. They may have relatively low accuracy compared to the primary data from direct measurement. The used information from FAO Food Balance Sheets is not amazingly accurate, particularly for developing countries where data along the supply chain have limitations. Secondly, the used FLW percentages are based on FAO-defined regions because those are by far the most complete data available to conduct global and super-national studies. However, within these regions, there could be still some variations between different countries. For example, for Industrialized Asia, the same FLW percentages were applied to Japan, South Korea, and China, which should actually be deviated in reality. For example, the fruit and vegetable post-harvest losses for China (widely believed between 20% and 30%) should be much higher than those in Japan and South Korea due to the much poorer cold chain infrastructure in China. The same issue also applies to the region-based GHG emission factors. Thirdly, the FLW percentages are aggregated for some food product groups in Porter, Reay, Higgins and Bomberg [
13]. For example, all the fruits and vegetables share one set of FLW percentages. This could cause some levels of inaccuracy when there are big variations between different fruit and vegetable products (e.g., the on-farm losses for apples could be much lower than that for strawberries).
Future research should focus on generating more national-level data on FLW percentages and GHG emission factors, preferably through more frequent field surveys within individual countries. This can enable the country-specific analysis of the identification of hotspots. When the primary data are not available, smart use of the secondary data with careful validation is required. It would be desirable to have the FLW percentages and GHG emission factors at the specific product level instead of the aggregated product group level. Moreover, to have the GHG emission factors for the full life cycles of products will make the calculation on FLW-associated GHG emissions more complete. It should, therefore, be a future research direction to go as well.


