An Economic Comparison between Alternative Rice Farming Systems in Tanzania Using a Monte Carlo Simulation Approach

 ,
, 

Abstract
:1. Introduction
2. Materials and Methods
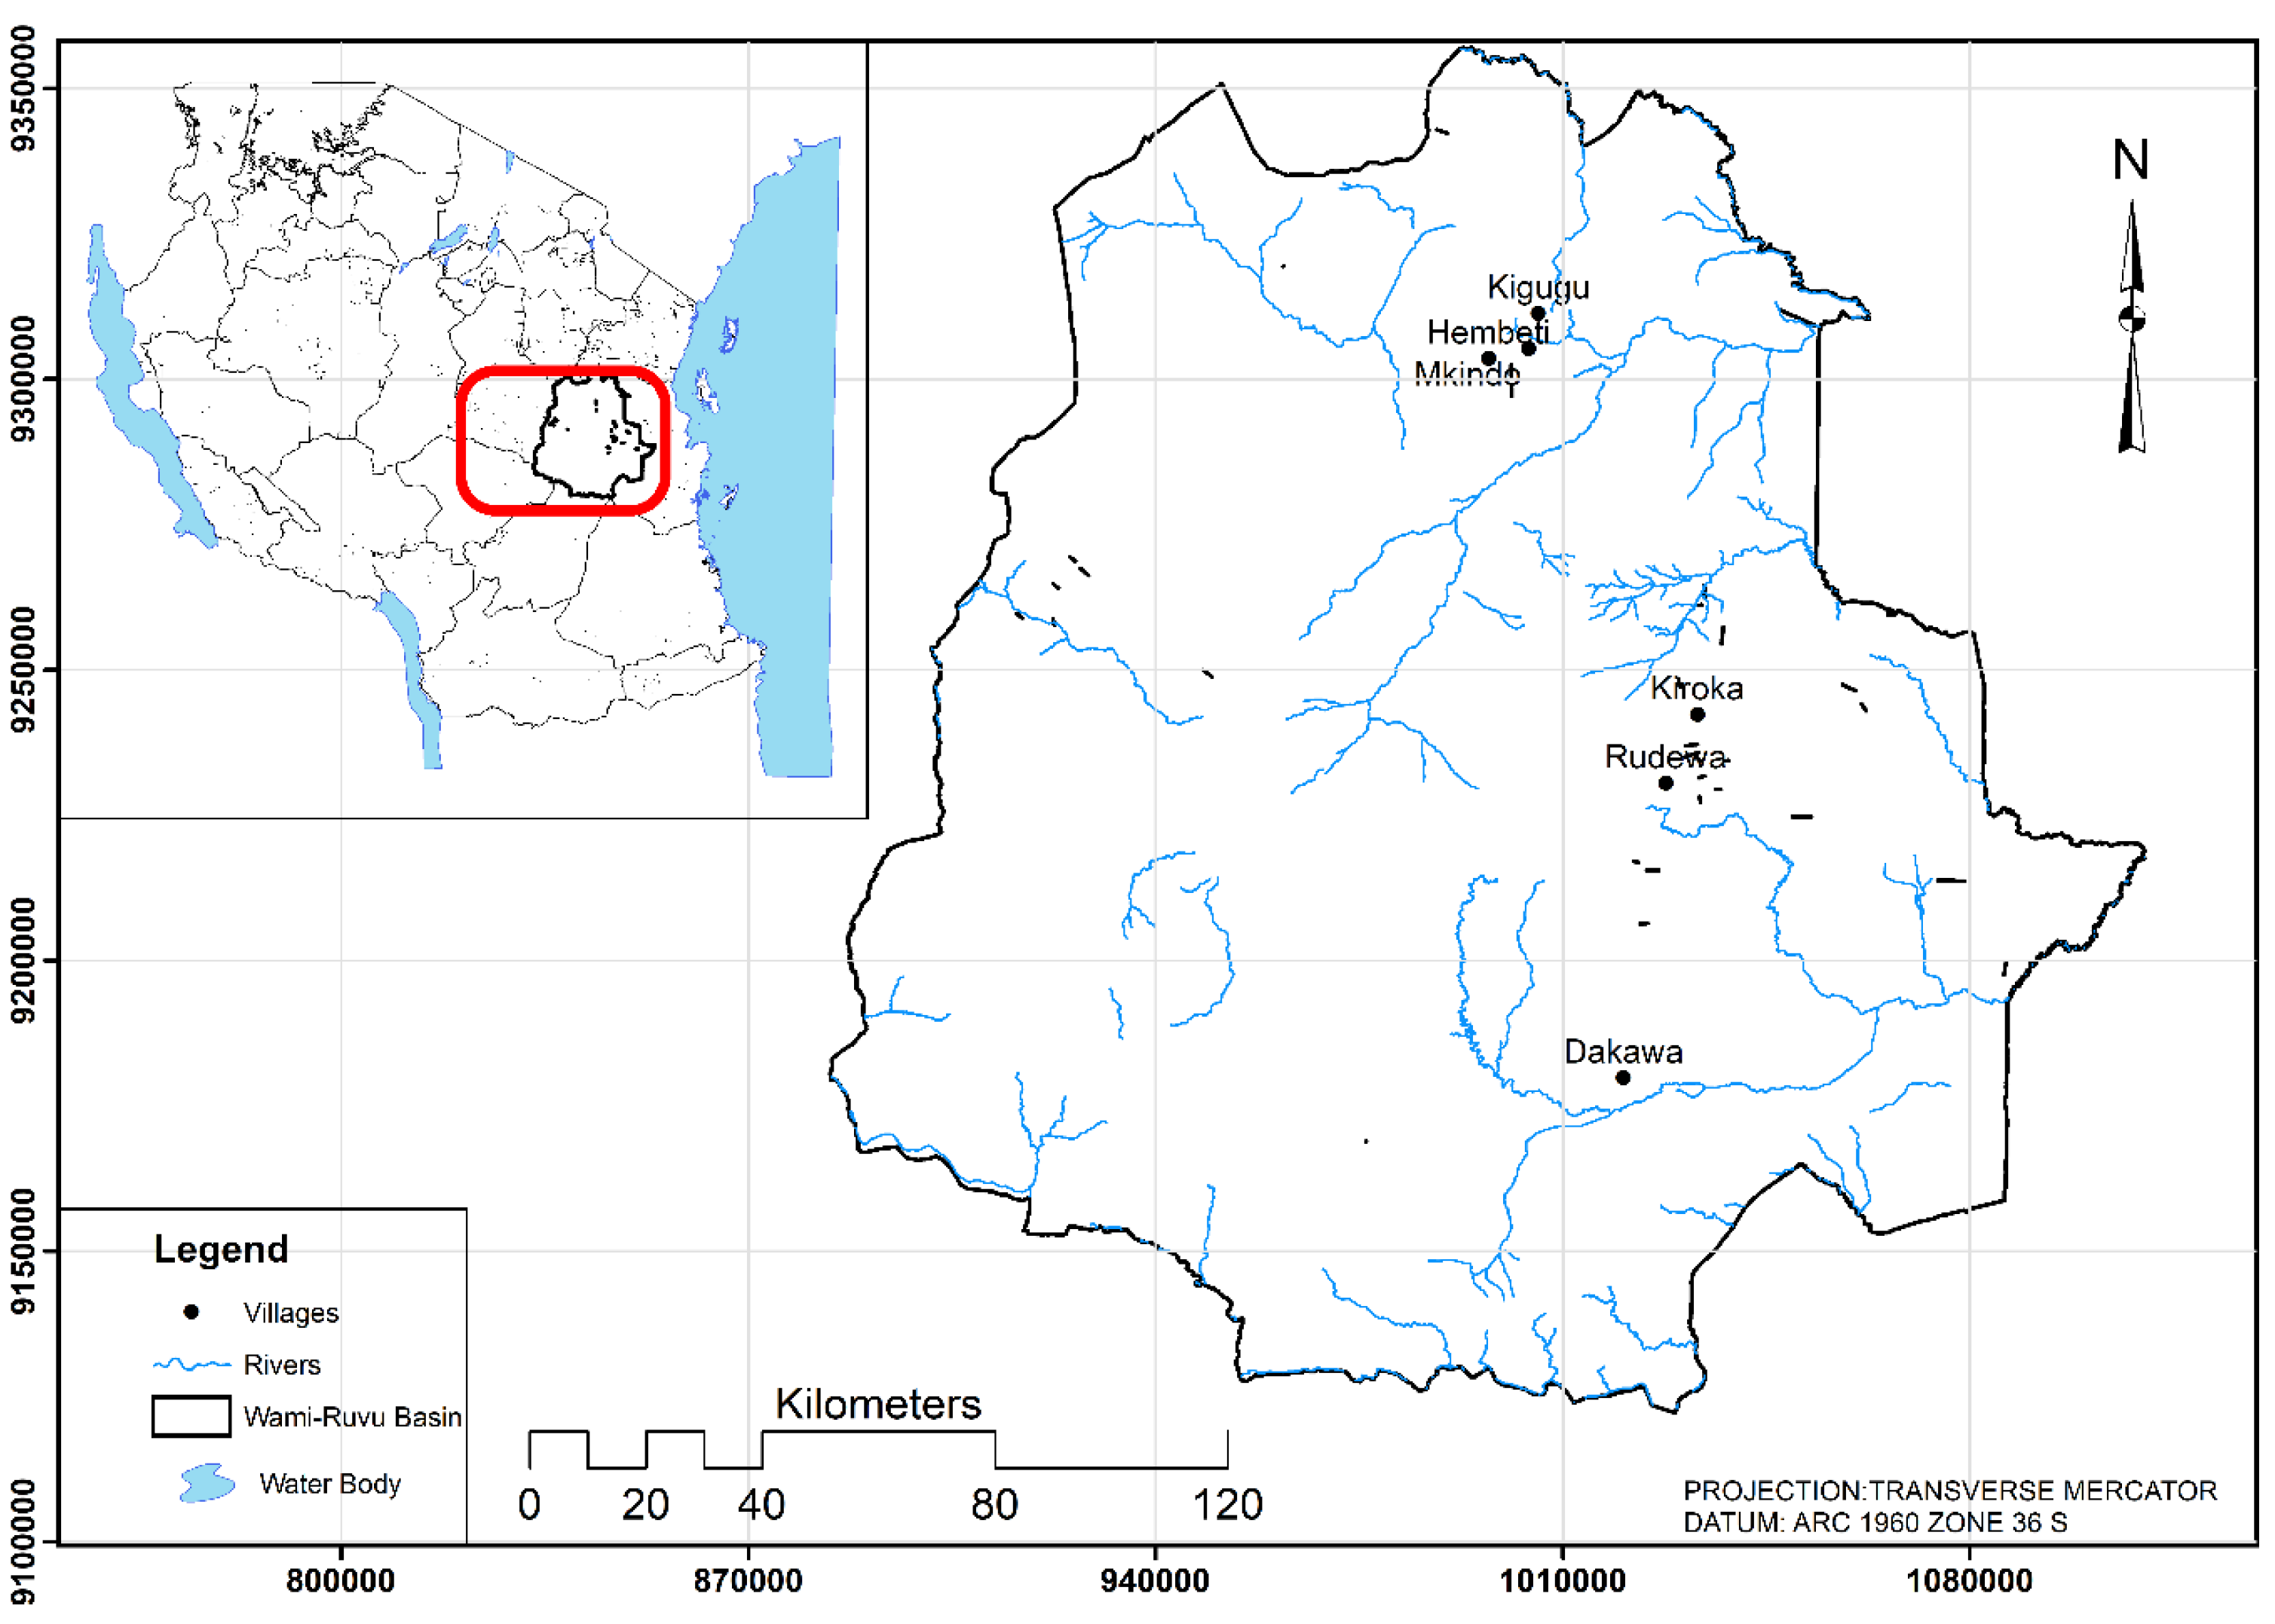
2.1. Location of the Study Area
2.2. Data Type and Characteristics
- Baseline—farms using traditional methods comprising application of saved local seed varieties (supa shinyanga, mbawa mbili, supa pamba, Kabangala, tule na bwana; kisegese; mwarabu, rangi mbili; ngome, zambia), no fertilizer and higher seed rate between 75–100 kg/ha is used as farmers prefer broadcast planting method. Weeding is done manually and typically done twice before harvest, and no specific spacing is applied. Continuous flooding is dominant with neither irrigation nor water control.
- Alt.1—applying the traditional practices (Baseline), but farmers use improved varieties (mainly SARO5 and IR64) instead of local varieties. Farmers in this group prefer transplanting of seedlings instead of broadcasting, which is done between 21–35 days with limited fertilizer application, and no specific spacing is applied.
- Alt.2—farms supplemented with improved varieties, transplanting of seedlings (no specific spacing is applied), and application of fertilizer at the rate of 50 kg bags per ha. The main types of fertilizers used are Urea and NPK, and occasionally, farmers use organic fertilizers.
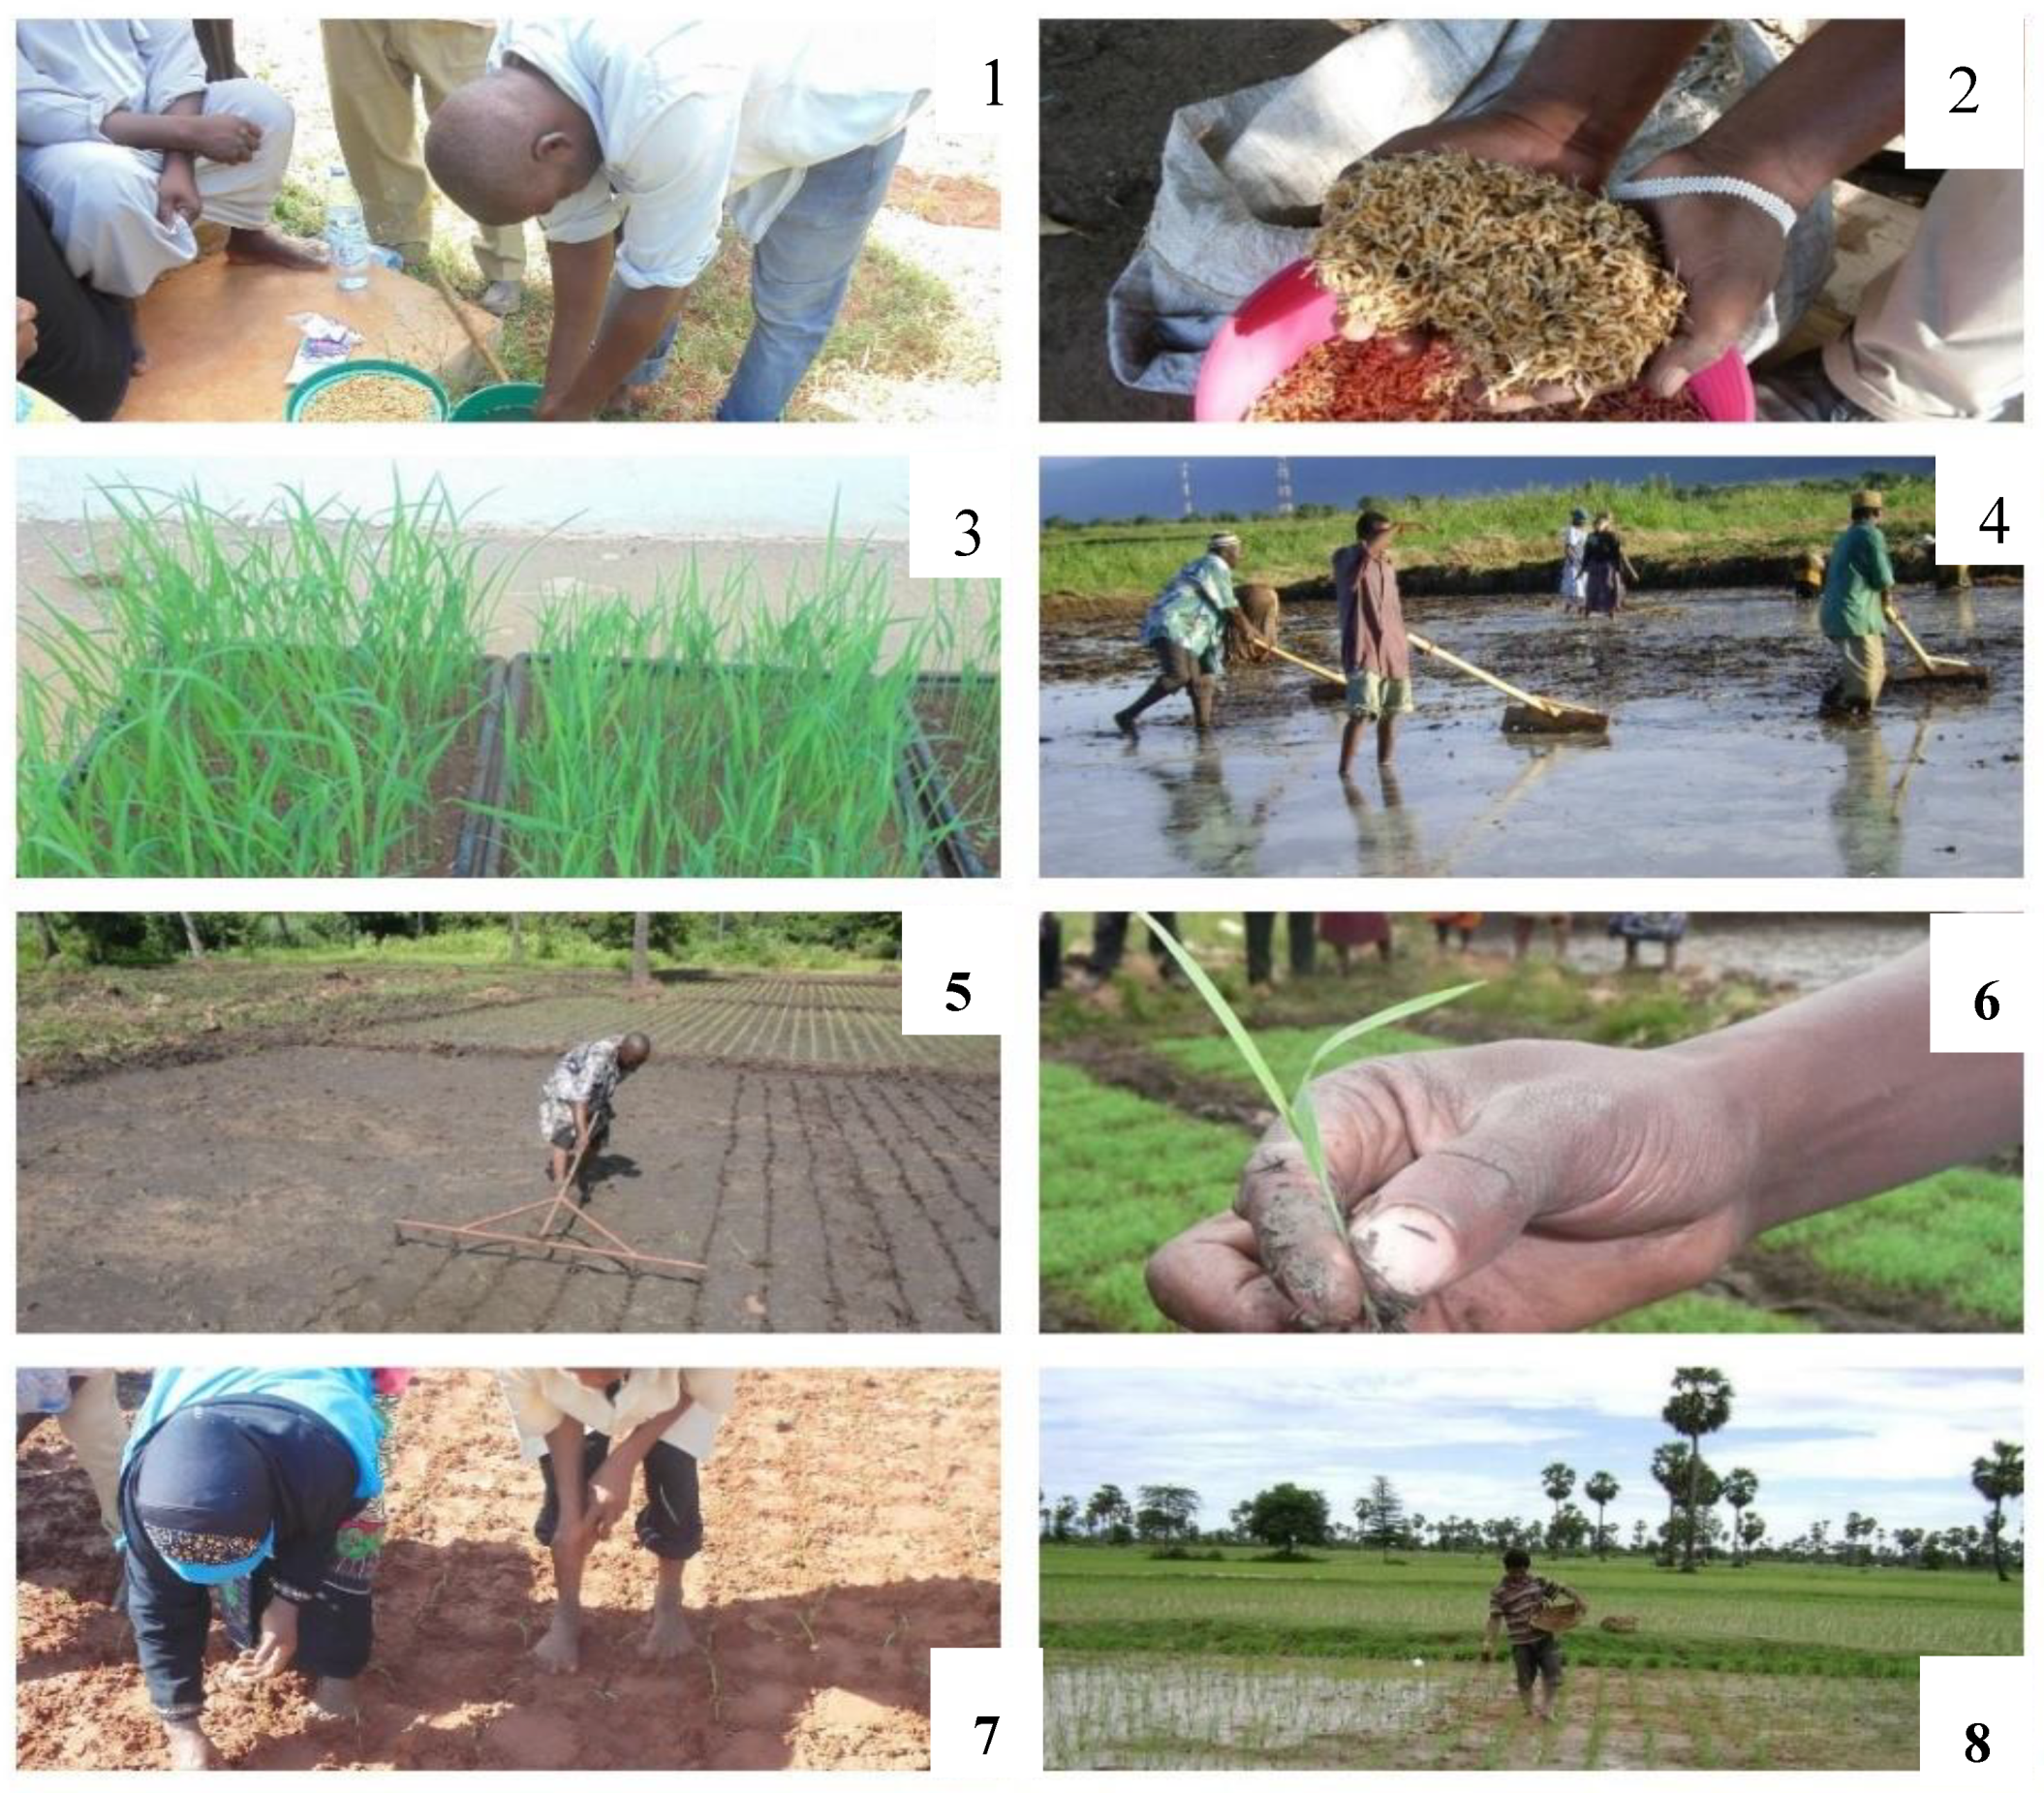
- Alt.3 and Alt.4—this dedicated group of farmers apply some but not all the SRI practices, i.e., SRI partial adopters (Alt.3) and those claiming to use all the specified SRI practices (Alt.4). The specific practices under SRI in Tanzania involve (1) stepwise selection and preparation of quality viable seeds; (2) nursery plot development and careful management; (3) land/field leveling for easy infield water management; (4) transplanting one young seedling (at two leaves) per hill while using 25 cm × 25 cm or 25 cm × 30 cm spacing; (5) quickly transplanting within 30 min of gently removing seedlings from their nursery and not inverting the seedlings; (6) wetting and drying of the field (water control) to improve soil aeration and promote root elongation; (7) timely weeding done every 10–12 days after transplanting and repeated in the same interval until harvest; and (8) intensive application of fertilizer, especially one which is rich in nitrogen and phosphorus. A pictorial demonstration of some necessary steps involved in SRI practices in Tanzania is shown in Appendix A. Also, it should be noted that rice production under SRI is done twice a year. Therefore, yield under SRI scenarios included harvests for both rain and dry seasons as the farmers under SRI have gone a step further to use the water from rivers for irrigation during the dry season.
2.3. Yield Data
2.4. Price Data
2.5. Cost of Production Per Scenario
2.6. Monte Carlo Simulation for Economic Comparison between Rice Farming Systems
2.7. Scenario Ranking
3. Results
4. Discussion
5. Conclusions
Author Contributions
Funding
Acknowledgments
Conflicts of Interest
Appendix A. Important Steps in SRI Farming System

Appendix B

| Variable Cost | Baseline | Alt.1 | Alt.2 | Alt.3 | Alt.4 | |||||
|---|---|---|---|---|---|---|---|---|---|---|
| Min | Max | Min | Max | Min | Max | Min | Max | Min | Max | |
| Seed: Traditional | 13.3 | 21.3 | ||||||||
| Seed: Improved *** | 8.9 | 17.8 | 8.9 | 17.8 | 8.9 | 17.8 | 17.8 | 35.6 | ||
| Nursery preparation | 35.6 | 44.4 | ||||||||
| Ploughing | 17.8 | 22.2 | 17.8 | 22.2 | 17.8 | 22.2 | 17.8 | 22.2 | 17.8 | 22.2 |
| Harrowing | 17.8 | 22.2 | 17.8 | 22.2 | 17.8 | 22.2 | 17.8 | 22.2 | 17.8 | 22.2 |
| Leveling and puddling | 31.1 | 44.4 | 31.1 | 44.4 | ||||||
| Marking transplanting grids | 22.2 | 35.6 | 22.2 | 35.6 | ||||||
| Planting: broadcasting | 17.8 | 22.2 | ||||||||
| Seedling: transplanting | 31.1 | 44.4 | 31.1 | 44.4 | 44.4 | 71.1 | 80.0 | 111.1 | ||
| Weeding: 1st round | 44.4 | 111.1 | 44.4 | 111.1 | 44.4 | 111.1 | 66.7 | 133.3 | 66.7 | 133.3 |
| Weeding: 2nd round | 35.6 | 44.4 | 35.6 | 44.4 | 35.6 | 44.4 | 44.4 | 66.7 | 44.4 | 66.7 |
| Weeding: 3rd round | 35.6 | 44.4 | 44.4 | 66.7 | 44.4 | 66.7 | ||||
| Bird scaring | 22.2 | 35.6 | 22.2 | 35.6 | 22.2 | 35.6 | 22.2 | 35.6 | 22.2 | 35.6 |
| Post-emergence pesticides | 4.4 | 6.7 | 4.4 | 6.7 | 4.4 | 6.7 | 13.3 | 22.2 | ||
| Field wetting and drying (water control) | 35.6 | 53.3 | ||||||||
| Fertilizer: 1st round DAP | 26.7 | 48.9 | 26.7 | 48.9 | 44.4 | 57.8 | ||||
| Fertilizer: 2nd round UREA | 26.7 | 48.9 | 26.7 | 48.9 | 44.4 | 57.8 | ||||
| Fertilizer: 3rd round UREA | 26.7 | 48.9 | 26.7 | 48.9 | 44.4 | 57.8 | ||||
| Harvesting/threshing | 44.4 | 88.9 | 48.9 | 111.1 | 66.7 | 133.3 | 88.9 | 155.6 | 133.3 | 177.8 |
| Postharvest handling | 13.3 | 26.7 | 13.3 | 31.1 | 26.7 | 44.4 | 35.6 | 80.0 | 57.8 | 88.9 |
| Storage | 8.9 | 22.2 | 17.8 | 26.7 | 26.7 | 44.4 | 35.6 | 57.8 | 44.4 | 80.0 |
| Total | 235.6 | 416.9 | 262.2 | 473.3 | 417.8 | 717.8 | 564.4 | 962.2 | 817.8 | 1213.3 |
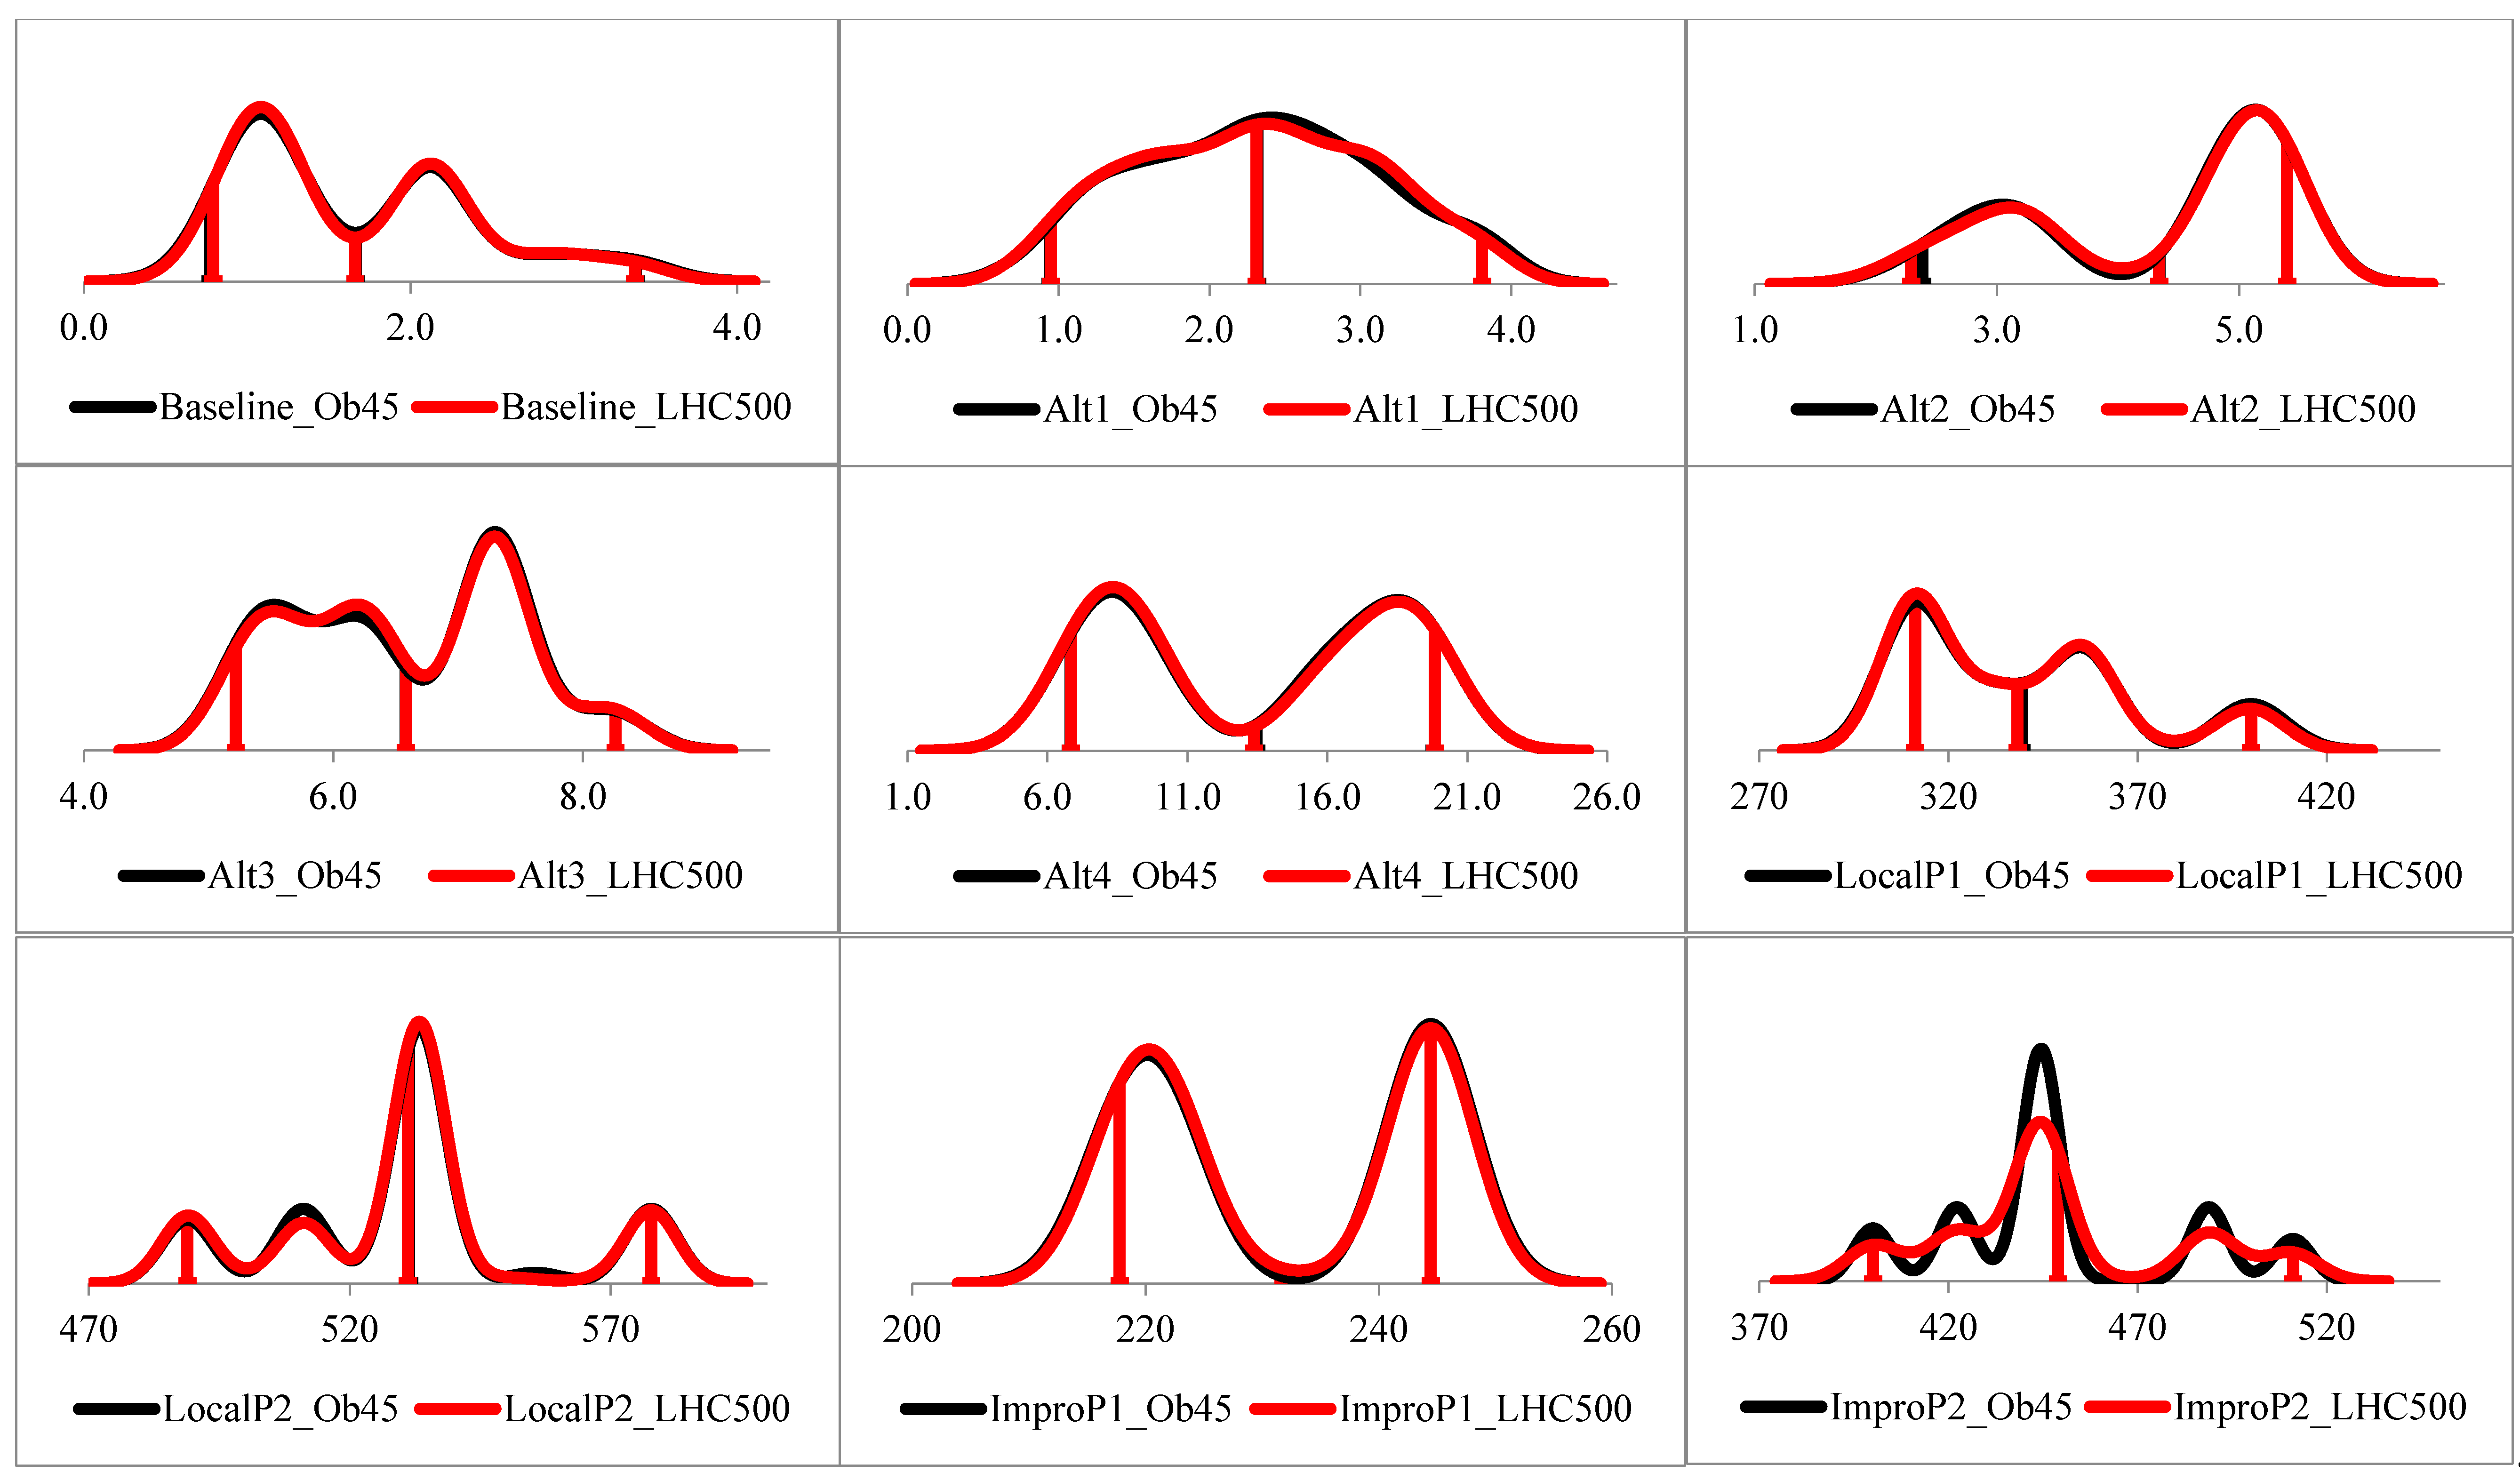
Appendix C. Probability Distribution Functions (PDF) Charts for the Simulated Sample (in Red) vs. Observed Yields and Prices Sampled (in Black)

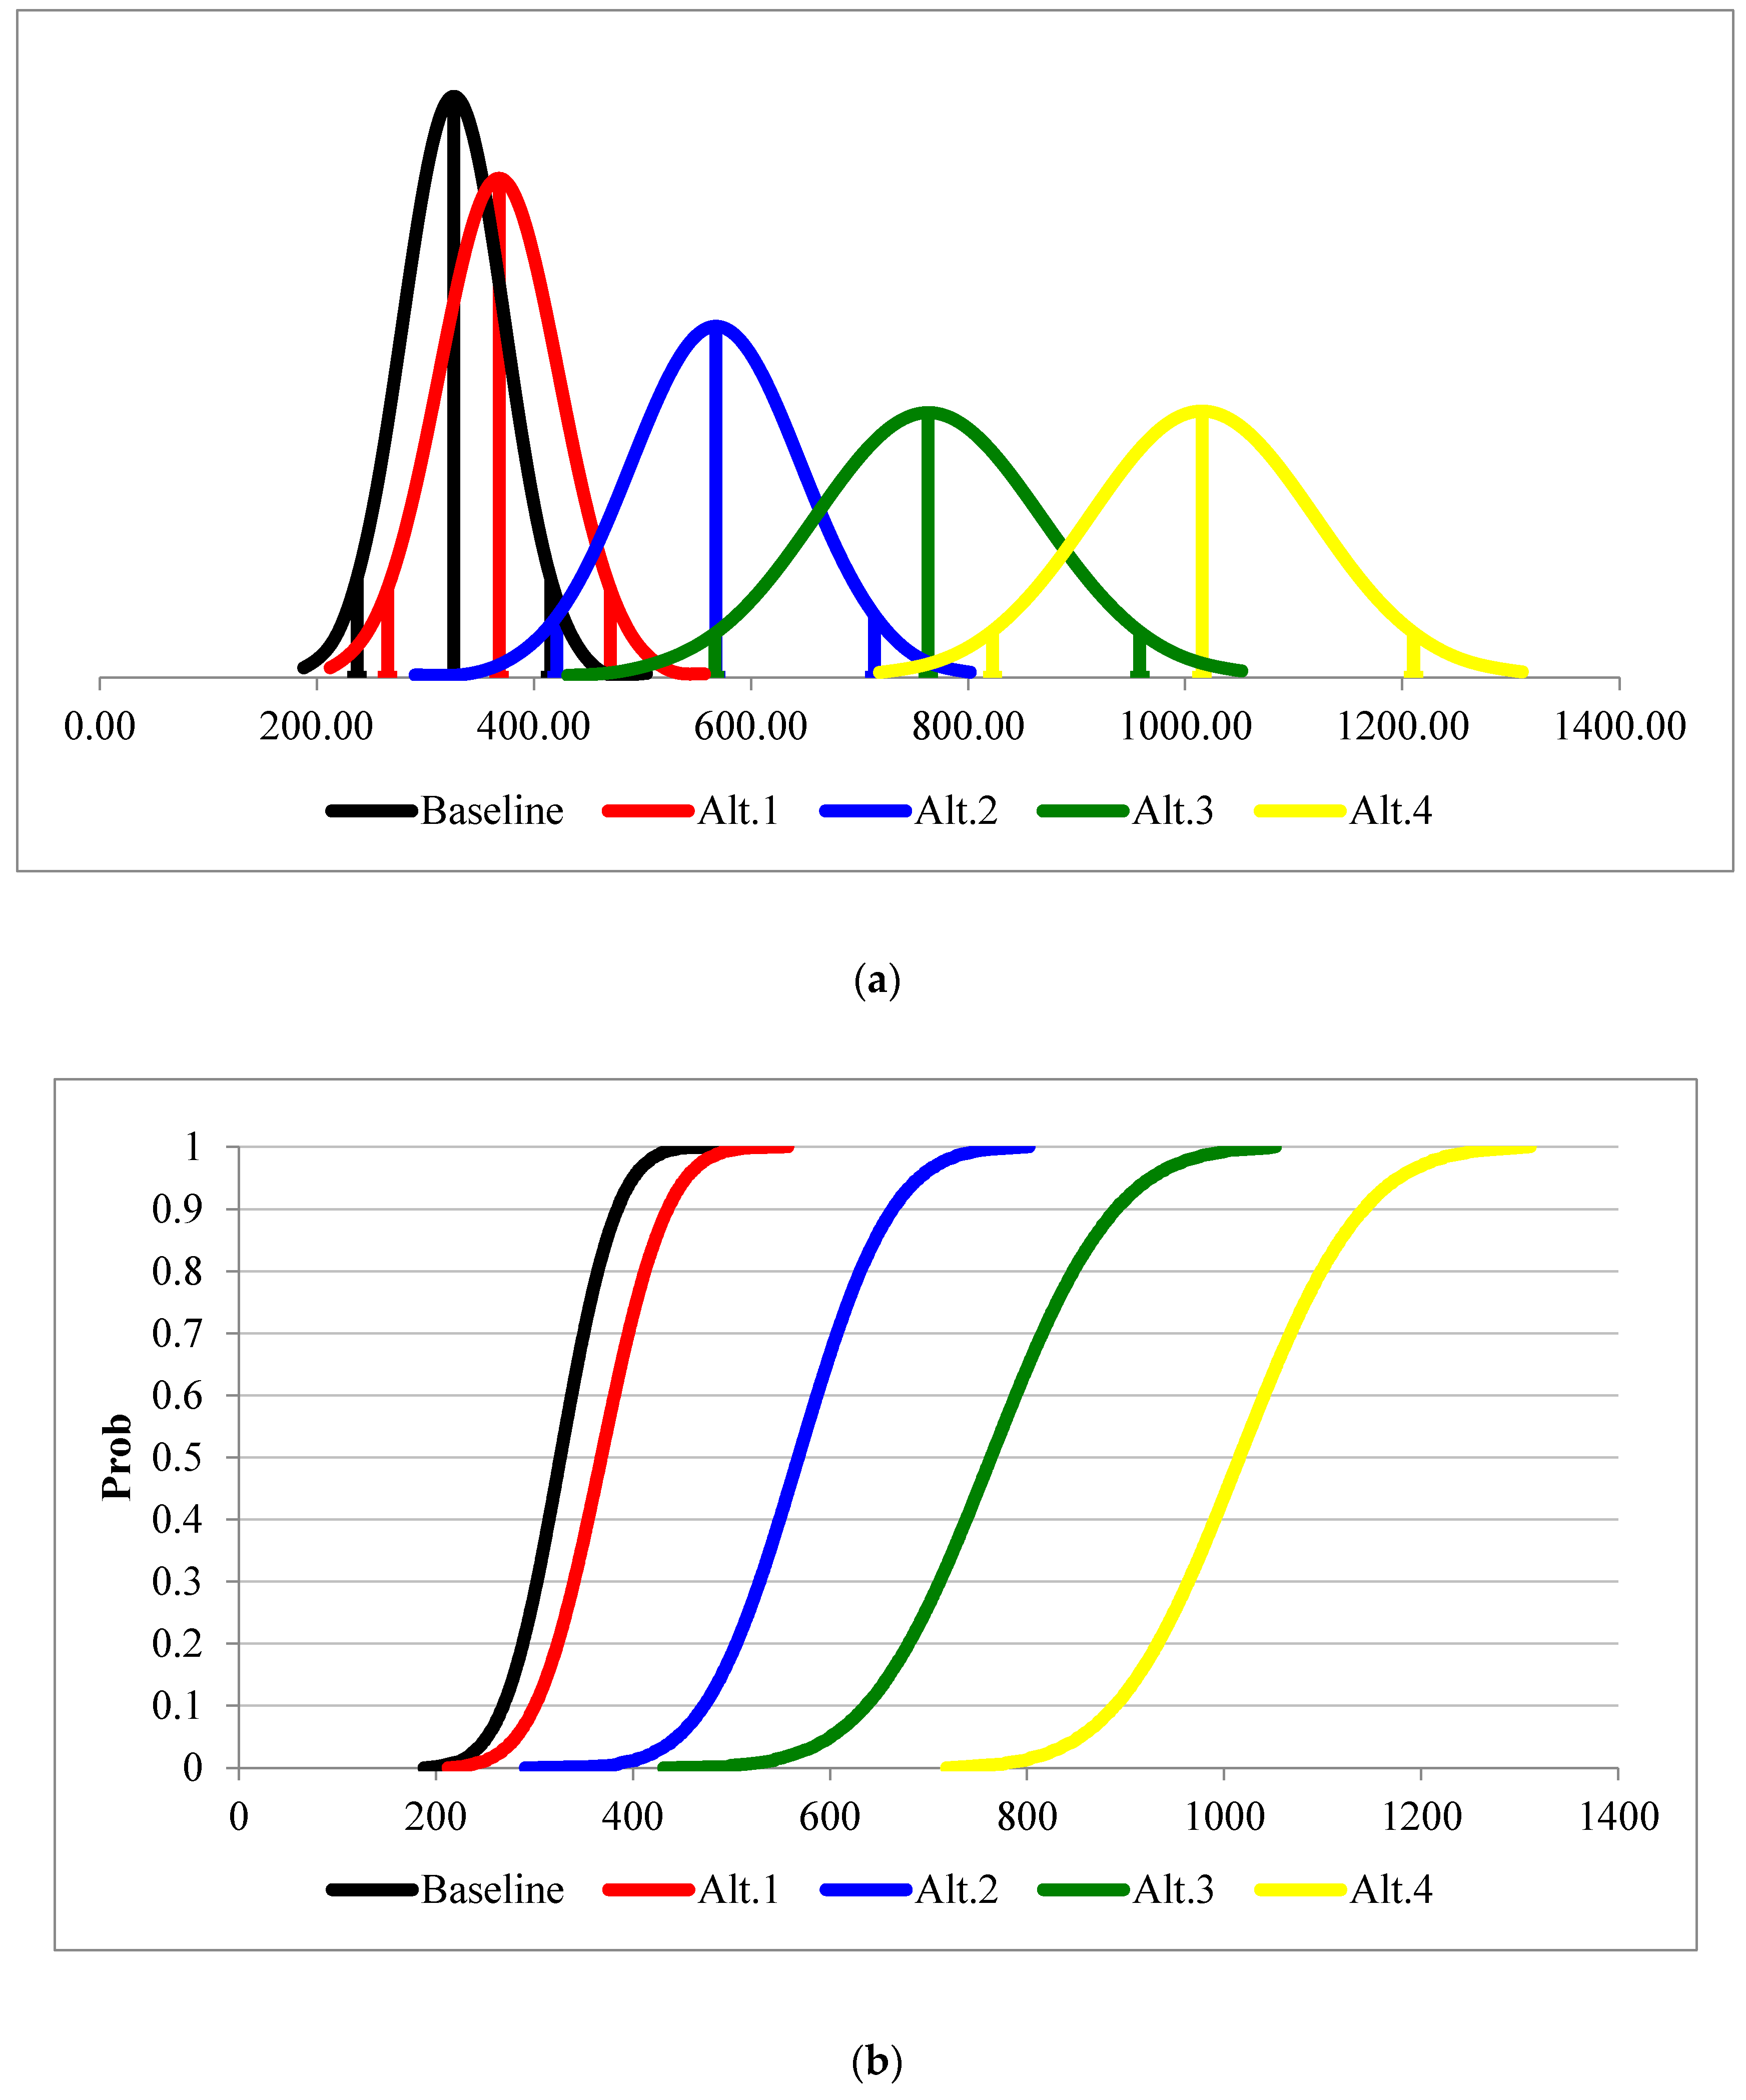
Appendix D. PDFs and CDFs of Production Cost per ha (US$/ha) for Rice under Different Farming Systems (Alt.0–4) in Tanzania

Appendix E. SRI Success Story of Mwanaidi H. Hussen Who Is One of the First Farmers to Adopt the Technology
- In the year 2015, I was awarded a prize of 5,500,000 TZS by Morogoro agricultural Authority as the best farmer of the year.
- In terms of food security my family has never suffered from food shortage anymore.
- I am now capable of sending my kids to English medium schools and afford the costs.
- I have renovated my house and installed with electricity plus tap water.
- I also conduct SRI pieces of training to my fellow farmers. Taking care of one young orphan boy.
- I built a small fish pond and a vegetable garden around my house, which gives me a small amount of money for my family …”

References
- Patra, P.S.; Haque, S. Effect of seedling age on tillering pattern and yield of rice (Oryza sativa L.) under system of rice intensification. ARPN J. Agric. Biol. Sci. 2011, 6, 33–35. [Google Scholar]
- Katambara, Z.; Kahimba, F.C.; Mahoo, H.F.; Mbungu, W.B.; Mhenga, F.; Reuben, P.; Maugo, M.; Nyarubamba, A. Adopting the system of rice intensification (SRI) in Tanzania: A review. Agric. Sci. 2013, 4, 369–375. [Google Scholar] [CrossRef] [Green Version]
- Maliondo, S.M.; Mpeta, E.J.; Olson, J. Climate Change and Food Security in Tanzania: An Analysis of Current Knowledge and Research Gaps and Recommendations for a Research Agenda; Ohio State University and Sokoine University of Agriculture: Columbus, OH, USA, 2012. [Google Scholar]
- Bouman, B.A.; Barker, R.; Humphreys, E.; Tuong, T.P.; Atlin, G.; Bennett, J.; Dawe, D.; Dittert, K.; Dobermann, A.; Façon, T.; et al. Rice: Feeding the Billions; IWMI: Colombo, Sri Lanka, 2007. [Google Scholar]
- Ali, R.M. Evaluation of the Performance of System of Rice Intensification (SRI) in Bumbwisudi Rice Irrigation Scheme. Ph.D. Thesis, Sokoine University of Agriculture, Zanzibar, Tanzania, 2015. [Google Scholar]
- Stoop, W.A.; Uphoff, N.; Kassam, A. A review of agricultural research issues raised by the system of rice intensification (SRI) from Madagascar: Opportunities for improving farming systems for resource-poor farmers. Agric. Syst. 2002, 71, 249–274. [Google Scholar] [CrossRef]
- Uphoff, N. Agroecological Implications of the System of Rice Intensification (SRI) in Madagascar. Environ. Dev. Sustain. 1999, 1, 297–313. [Google Scholar] [CrossRef]
- Uphoff, N. Higher Yields with Fewer External Inputs? The System of Rice Intensification and Potential Contributions to Agricultural Sustainability. Int. J. Agric. Sustain. 2003, 1, 38–50. [Google Scholar] [CrossRef]
- Uphoff, N. The development of the System of Rice Intensification. Particip. Res. Dev. Sustain. Agric. Rural. Dev. 2005, 3, 119–125. [Google Scholar]
- Uphoff, N. The System of Rice Intensification: Using alternative cultural practices to increase rice production and profitability from existing yield potentials. Pref. Préface Pref. 2006, 55, 103–113. [Google Scholar]
- Uphoff, N. Reducing the Vulnerability of Rural Households through Agroecological Practice: Considering the System of Rice Intensification (SRI). Mondes Dev. 2007, 4, 85. [Google Scholar] [CrossRef]
- Upboff, N. The system of rice intensification (sri) as a system of agricultural innovation. J. Soil Environ. Sci. 2008, 10, 27–40. [Google Scholar] [CrossRef]
- Randriamiharisoa, R.; Barison, J.; Uphoff, N. Soil Biological Contributions to the System of Rice Intensification. Biol. Approaches Sustain. Soil Syst. 2006, 113, 409–424. [Google Scholar]
- Mishra, A.; Whitten, M.; Ketelaar, J.W.; Salokhe, V.M. The System of Rice Intensification (SRI): A challenge for science, and an opportunity for farmer empowerment towards sustainable agriculture. Int. J. Agric. Sustain. 2006, 4, 193–212. [Google Scholar] [CrossRef]
- Furahisha, E.H. Farmers Adoption of Selected Recommended Rice Production Practices: A Case of Kilombero District of Morogoro Region. Ph.D. Thesis, Sokoine University of Agriculture, Morogoro, Tanzania, 2013. [Google Scholar]
- GRiSP (Global Rice Science Partnership). Rice Almanac, 3rd ed.; Ram, P.C., Maclean, J.L., Dawe, D.C., Hardy, B., Hettel, G.P., Eds.; International Rice Research Institute: Los Baños, Philippines, 2003. [Google Scholar]
- Bell, P. Sustainable Intensification for Food Security and Climate Change Adaptation in Tanzania. Ph.D. Thesis, The Ohio State University, Columbus, OH, USA, 2016. [Google Scholar]
- The United Republic of Tanzania. System of Rice Intensification Training Manual for Extension Staff and Farmers. 2015. Available online: https://sriwestafrica.files.wordpress.com/2014/05/kilimo-booklet-final-sri.pdf (accessed on 20 February 2018).
- Ronald, B.; Dulle, F.; Honesta, N. Assessment of the information needs of rice farmers in Tanzania: A Case Study of Kilombero district. Morogoro. Lib. Philos. Pract. 2014, 1071. Available online: http://41.73.194.142:8080/xmlui/handle/123456789/1164 (accessed on 23 February 2018).
- The United Republic of Tanzania. The United Republic of Tanzania. National Adaptation Programme of Action (NAPA), Prospects; Vice President’s Office, Division of Environment: Dar Es Salaam, Tanzania, 2007.
- Paavola, J. Livelihoods, vulnerability and adaptation to climate change in Morogoro, Tanzania. Environ. Sci. Policy 2008, 11, 642–654. [Google Scholar] [CrossRef]
- FAO. COVID-19 and Smallholder Producers’ Access to Markets. Rome, 2020. Available online: https://doi.org/10.4060/ca8657en (accessed on 10 July 2020).
- United Nations. Policy Brief: The Impact of COVID-19 on Food Security and Nutrition. 2020. Available online: https://in.one.un.org/wp-content/uploads/2020/06/SG-Policy-Brief-on-COVID-Impact-on-Food-Security.pdf (accessed on 10 July 2020).
- Wilson, R.T.; Lewis, I. The Rice Value Chain in Tanzania. A Report from the Southern Highlands Food Systems Programme; FAO: Rome, Italy, 2015. [Google Scholar]
- Kahimba, F.C.; Kombe, E.E.; Mahoo, H.F. The potential of system of rice intensification (SRI) to increase rice water productivity: A case of Mkindo irrigation scheme in Morogoro region, Tanzania. Tanzan. J. Agric. Sci. 2013, 12, 10–19. [Google Scholar]
- Tusekelege, H.K.; Kangile, R.J.; Ng’elenge, H.S.; Busindi, I.M.; Nyambo, D.B.; Nyiti, E. Option for increasing rice yields, profitability, and water saving; a comparative analysis of system of rice intensification in morogoro, Tanzania. Int. J. Rec. Biotech. 2014, 2, 4–10. [Google Scholar]
- Diagne, A.; Glover, S.; Groom, B.; Phillips, J. Africa’s Green Revolution? The Determinants of the Adoption of NERICAs in West Africa; Department of Economics, SOAS, University of London: London, UK, 2012. [Google Scholar]
- Doss, C.R. Analyzing technology adoption using microstudies: Limitations, challenges, and opportunities for improvement. Agric. Econ. 2006, 34, 207–219. [Google Scholar] [CrossRef]
- Ribera, L.A.; Hons, F.M.; Richardson, J.W. An economic comparison between conventional and no-tillage farming systems in Burleson County, Texas. Agron. J. 2004, 96, 415–424. [Google Scholar] [CrossRef]
- Richardson, J.W.; Herbst, B.K.; Outlaw, J.L.; Gill, R.C. Including risk in economic feasibility analyses: The case of ethanol production in Texas. J. Agribus. 2007, 25, 115–132. [Google Scholar]
- Rezende, M.L.; Richardson, J.W. Economic feasibility of sugar and ethanol production in Brazil under alternative future prices outlook. Agric. Syst. 2015, 138, 77–87. [Google Scholar] [CrossRef]
- Mwinuka, L.; Mutabazi, K.D.; Sieber, S.; Makindara, J.; Bizimana, J.-C. An economic risk analysis of fertiliser microdosing and rainwater harvesting in a semi-arid farming system in Tanzania. Agrekon 2017, 56, 274–289. [Google Scholar] [CrossRef]
- Mwinuka, L.; Mutabazi, K.D.; Makindara, J.; Sieber, S. Reckoning the risks and rewards of fertilizer micro-dosing in a sub-humid farming system in Tanzania. Afr. J. Sci. Technol. Innov. Dev. 2016, 8, 497–508. [Google Scholar] [CrossRef]
- Ndomba, P.M. Streamflow Data Needs for Water Resources Management and Monitoring Challenges: A Case Study of Wami River Subbasin in Tanzania. In Nile River Basin; Springer Science and Business Media LLC: Berlin, Germany, 2014; pp. 23–49. [Google Scholar]
- Gulacha, M.M.; Mulungu, D.M. Generation of climate change scenarios for precipitation and temperature at local scales using SDSM in Wami-Ruvu River Basin Tanzania. Phys. Chem. Earth 2017, 100, 62–72. [Google Scholar] [CrossRef]
- Wambura, F.J.; Ndomba, P.M.; Kongo, V.; Tumbo, S.D. Uncertainty of runoff projections under changing climate in Wami River sub-basin. J. Hydrol. Reg. Stud. 2015, 4, 333–348. [Google Scholar] [CrossRef] [Green Version]
- Mahoo, H.; Simukanga, L.; Kashaga, R.A. Water resources management in Tanzania: Identifying research gaps and needs and recommendations for a research agenda. Tanzan. J. Agric. Sci. 2015, 14, 57–77. [Google Scholar]
- Atkinson, R.; Flint, J. Accessing hidden and hard-to-reach populations: Snowball research strategies. Soc. Res. Update 2001, 33, 1–4. [Google Scholar]
- Browne, K. Snowball sampling: Using social networks to research non-heterosexual women. Int. J. Soc. Res. Methodol. 2005, 8, 47–60. [Google Scholar] [CrossRef]
- Sedgwick, P. Snowball sampling. BMJ 2013, 347, f7511. [Google Scholar] [CrossRef]
- Naderifar, M.; Goli, H.; Ghaljaei, F. Snowball Sampling: A Purposeful Method of Sampling in Qualitative Research. Strides Dev. Med Educ. 2017, 14. [Google Scholar] [CrossRef] [Green Version]
- Richardson, J.W.; Schumann, K.D.; Feldman, P.A. Simetar: Simulation & Econometrics to Analyze Risk. Available online: https://www.simetar.com/ (accessed on 28 January 2018).
- Richardson, J.W.; Klose, S.L.; Gray, A.W. An Applied Procedure for Estimating and Simulating Multivariate Empirical (MVE) Probability Distributions In Farm-Level Risk Assessment and Policy Analysis. J. Agric. Appl. Econ. 2000, 32, 299–315. [Google Scholar] [CrossRef] [Green Version]
- Hardaker, J.B.; Richardson, J.W.; Lien, G.; Schumann, K.D. Stochastic efficiency analysis with risk aversion bounds: A simplified approach. Aust. J. Agric. Resour. Econ. 2004, 48, 253–270. [Google Scholar] [CrossRef] [Green Version]
- Bizimana, J.-C.; Richardson, J.W. Agricultural technology assessment for smallholder farms: An analysis using a farm simulation model (FARMSIM). Comput. Electron. Agric. 2019, 156, 406–425. [Google Scholar] [CrossRef]
- Anderson, J.R.; John, L. Dillon. In Risk Analysis in Dryland Farming Systems; No. 2; Food & Agriculture Org.: Rome, Italy, 1992. [Google Scholar]
- Llanto, G.P.; Castro, A.P.; Bordey, F.H.; Barroga, K.E.; Cruz, R.T.; Sebastian, L.S.; Redono, E.D. PalayCheck: The Philippines’ rice integrated crop management system. Philipp. J. Crop Sci. 2005. Available online: http://agris.fao.org/agris-search/search.do?recordID=PH2005000596 (accessed on 14 March 2018).
- Cruz, R.T.; Llanto, G.P.; Castro, A.P.; Barroga, K.E.; Bordey, F.; Redoña, E.D.; Sebastian, L.S. PalayCheck: The Philippines rice integrated crop management system. IRC Newsl. 2005, 20, 83–91. [Google Scholar]
- Namara, R.E.; Weligamage, P.; Barker, R. Prospects for Adopting System of Rice Intensification in Sri Lanka: A Socioeconomic Assessment; IWMI: Colombo, Sri Lanka, 2003. [Google Scholar]
- Pham, T.S.; Trinh, K.Q.; Tran, D.V. Integrated crop management for intensive irrigated rice in the Mekong Delta of Viet Nam. IRC Newsl. 2005, 20, 91–96. [Google Scholar]
- Satyanarayana, A.; Thiyagarajan, T.M.; Uphoff, N. Opportunities for water saving with higher yield from the system of rice intensification. Irrig. Sci. 2006, 25, 99–115. [Google Scholar] [CrossRef]
- Balasubramanian, V.; Rajendran, R.; Ravi, V.; Chellaiah, N.; Castro, E.; Chandrasekaran, B.; Jayaraj, T.; Ramanathan, S. Integrated crop management for enhancing yield, factor productivity and profitability in Asian rice farms. Int. Rice Comm. Newsl. 2005, 54, 63–72. [Google Scholar]
- Abdulrachman, S.; Las, I.; Yuliardi, I. Development and dissemination of integrated crop management for productive and efficient rice production in Indonesia. IRC Newsl. 2005, 54, 73–82. [Google Scholar]
- Anthofer, J. The potential of the System of Rice Intensification (SRI) for poverty reduction in Cambodia. In Deutscher Tropentag 2004; Humboldt-Universität zu Berlin: Berlin, Germany, 2004; pp. 5–7. [Google Scholar]
- Glover, D. Science, practice and the System of Rice Intensification in Indian agriculture. Food Policy 2011, 36, 749–755. [Google Scholar] [CrossRef]
- The United Republic of Tanzania. Agriculture Climate Resilience Plan 2014–2019. Available online: http://www.fao.org/climatechange/42077-07d3c561d911f22c7a7d12d0bdf123dc0.pdf (accessed on 20 February 2018).
- Nkuba, J.; Ndunguru, A.; Madulu, R.; Lwezaura, D.; Kajiru, G.; Babu, A.; Chalamila, B.; Ley, G. Rice value chain analysis in Tanzania: Identification of constraints, opportunities and upgrading strategies. Afr. Crop. Sci. J. 2016, 24, 73. [Google Scholar] [CrossRef] [Green Version]


| 2015/16 | 2016/17 | 2017/18 | |||||||
|---|---|---|---|---|---|---|---|---|---|
| Mean | Min | Max | Mean | Min | Max | Mean | Min | Max | |
| Baseline | 1.66 | 0.71 | 3.42 | 1.52 | 0.55 | 4.05 | 1.64 | 0.60 | 3.77 |
| Alt.1 | 2.32 | 0.78 | 3.81 | 2.11 | 0.7 | 3.8 | 1.99 | 0.47 | 3.07 |
| Alt.2 | 4.34 | 2.15 | 5.42 | 3.98 | 1.83 | 3.67 | 3.03 | 2.31 | 5.00 |
| Alt.3 * | 6.58 | 5.22 | 8.34 | 5.78 | 5.26 | 7.5 | 6.72 | 4.00 | 8.43 |
| Alt.4 * | 13.47 | 6.78 | 19.86 | 13.34 | 5.92 | 20.04 | 13.47 | 6.1 | 19.10 |
| Statistics | Low Supply | High Supply | ||
|---|---|---|---|---|
| Local_P1 | Improved_P1 | Local_P2 | Improved_P2 | |
| Average (US$/t) | 339.3 | 531.4 | 232.0 | 448.9 |
| Minimum (US$/t) | 311.1 | 488.9 | 217.8 | 400.0 |
| Maximum (US$/t) | 400.0 | 577.8 | 244.4 | 511.1 |
| No. of observations | 45 | 45 | 45 | 45 |
| Symbols | Definitions |
|---|---|
| ~ | A tilde represents the stochastic variable |
| i | Rice farming alternatives (Baseline, Alt.1, Alt.2, Alt.3, Alt.4) |
| ai | Hectares (ha) allocated for each alternative i |
| Stochastic rice yield per ha for alternative i | |
| Stochastic production for alternative i which is the product of hectares and yield | |
| ω | Rice variety (local and improved) |
| Stochastic rice price influenced by seasonal volatility for variety ω (Local_P1, Local_P2, Improved_P1, Improved_P2) | |
| Stochastic receipt/revenue which is a product of stochastic production and price | |
| Variable cost (US$/ha) given by the summation of all costs included in rice production per each scenario in a range of Min and Max [including seed, plow, harrow, planting, weeding, bird scaring, fertilizer, post-emergence herbicides, harvesting/threshing, postharvest handling, and storage] | |
| The fixed cost equated to zero for this analysis [F = 0] | |
| Stochastic Total production cost for each rice farming system computed as | |
| Net income which is calculated as the receipt minus total cost | |
| Sy | Fraction deviations from a mean or sorted array of random yields for scenario i |
| Sp | Fraction deviations from a mean or sorted array of the random price for variety ω |
| P(Sy) | Cumulative probability function for the Sy values |
| P(Sp) | Cumulative probability function for the Sp values |
| CUSDyp | Simetar function to simulate correlated uniform standard deviates of random variables. |
| EMP() | Simetar function used to simulate an MVE distribution. |
| Scenarios | Mean | SD | CV | Min | Max | Probability (NCI < 0) |
|---|---|---|---|---|---|---|
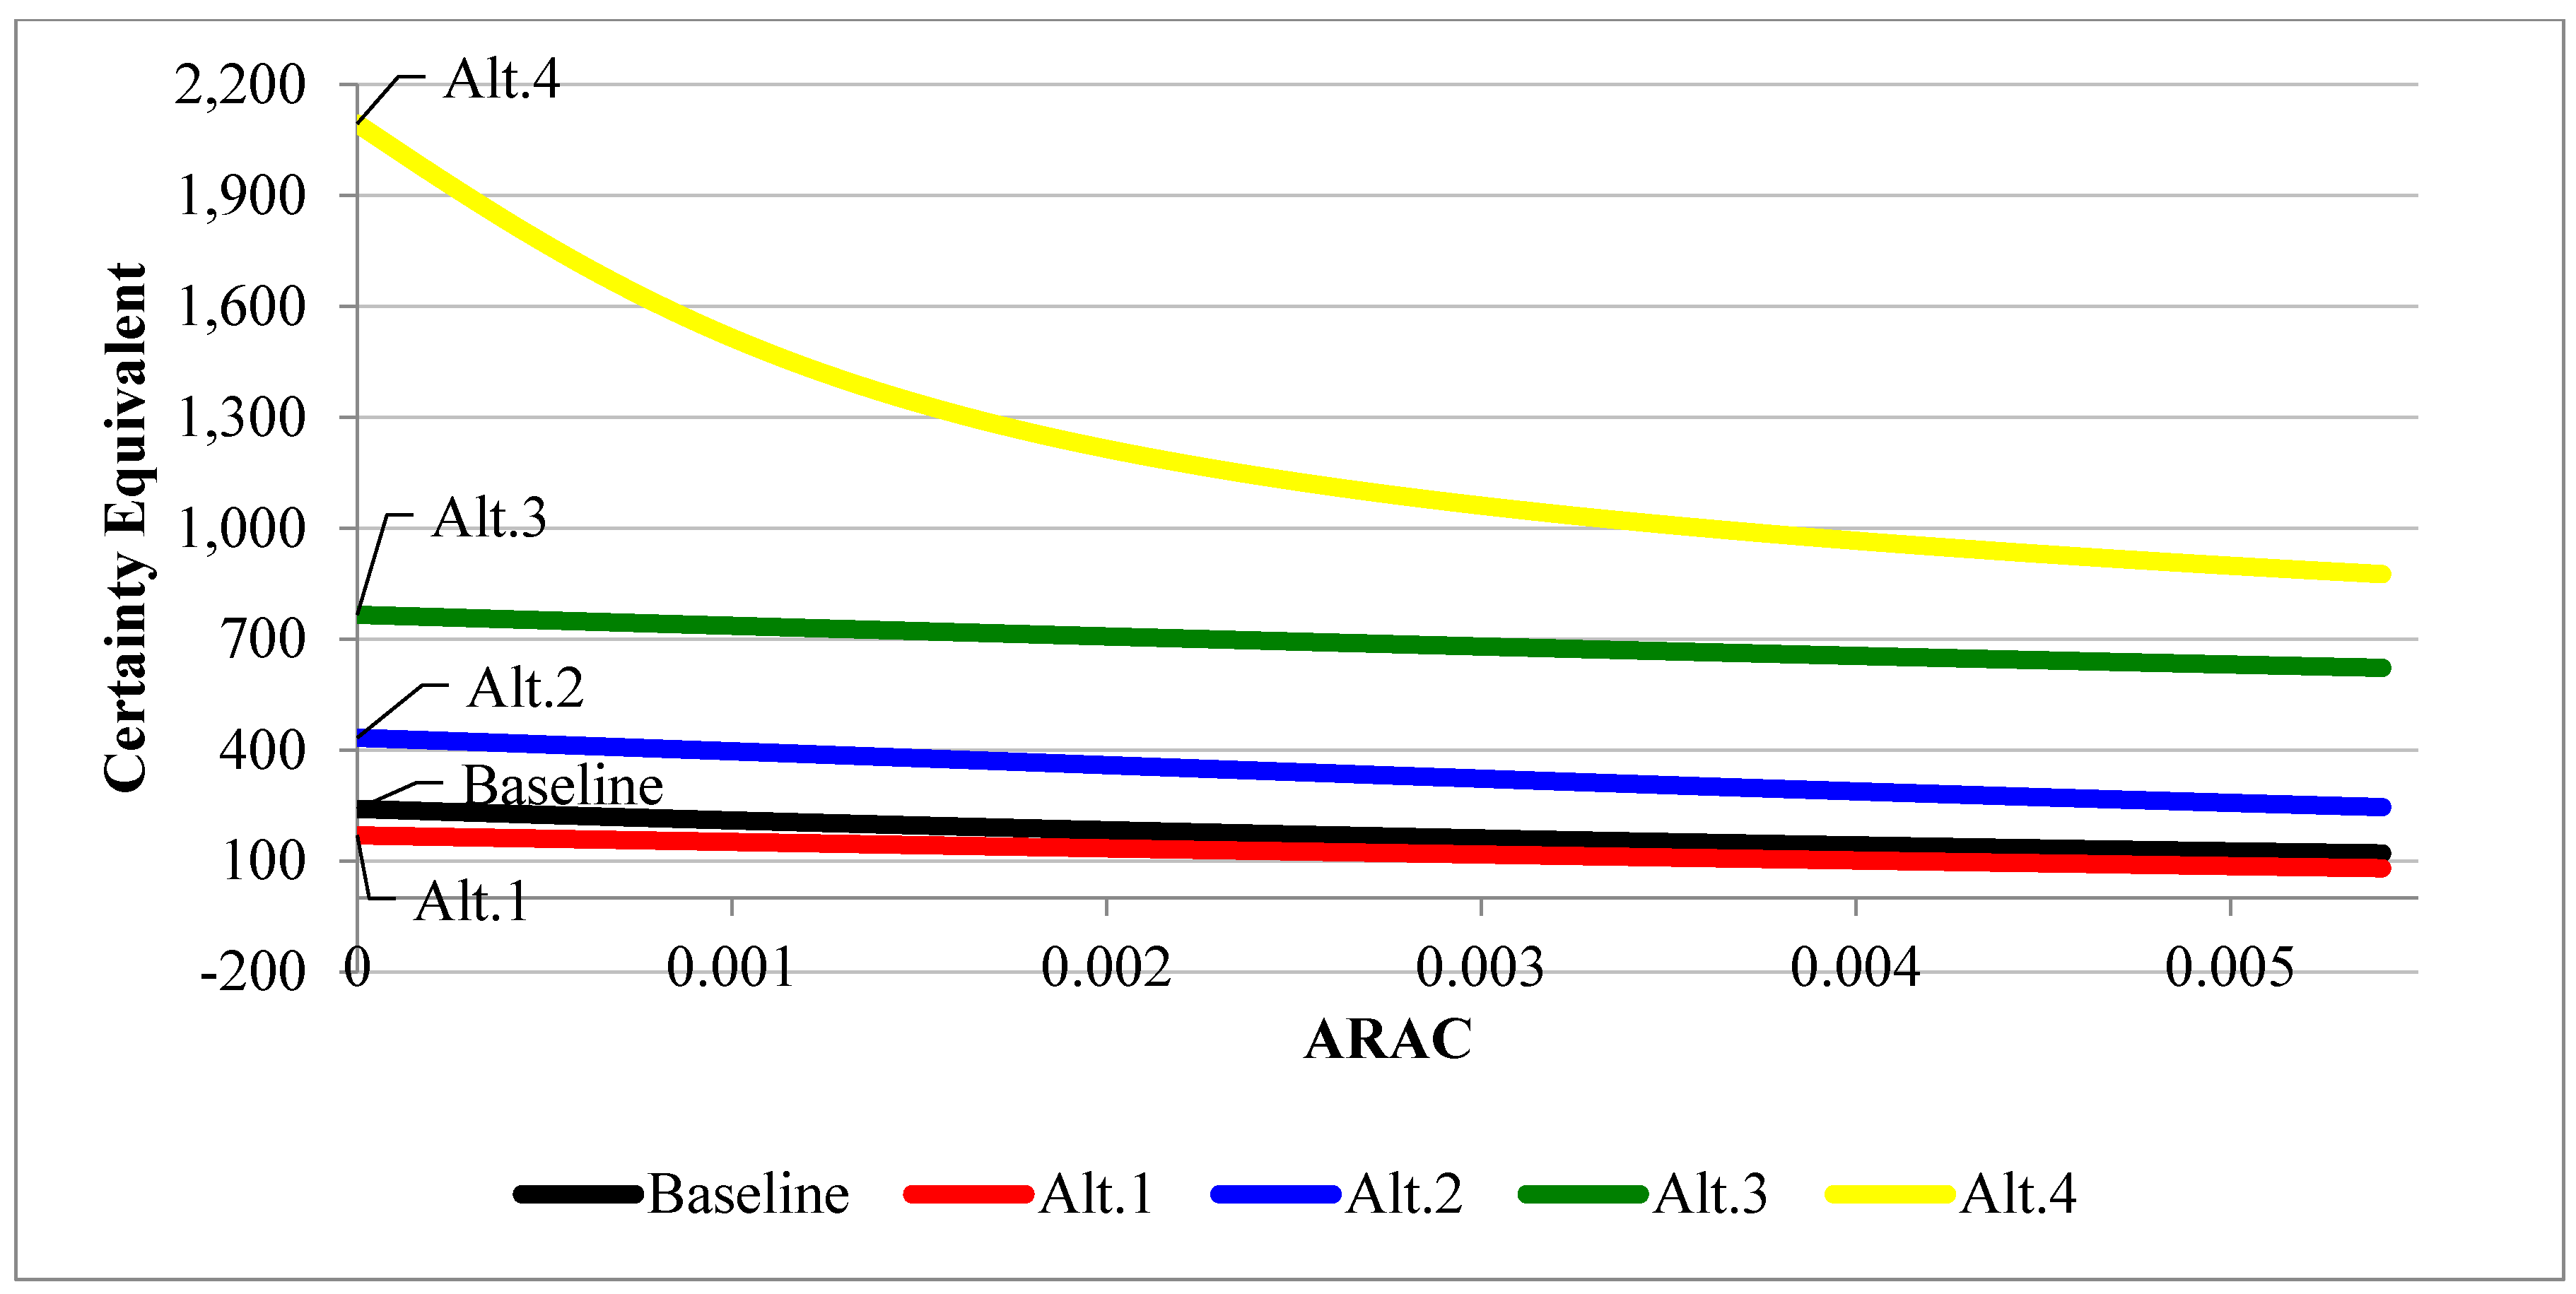
| Income during harvesting season (April–September) | ||||||
| Baseline | 240.2 | 259.8 | 108.1 | −140.9 | 1073.7 | 17.9 |
| Alt.1 | 168.6 | 188.1 | 111.6 | −289.4 | 645.0 | 21.6 |
| Alt.2 | 432.8 | 266.4 | 61.5 | −203.1 | 904.6 | 6.9 |
| Alt.3 | 765.9 | 245.3 | 32.0 | 227.8 | 1401.0 | 0.0 |
| Alt.4 | 2094.5 | 1166.3 | 55.7 | 283.4 | 4016.3 | 0.0 |
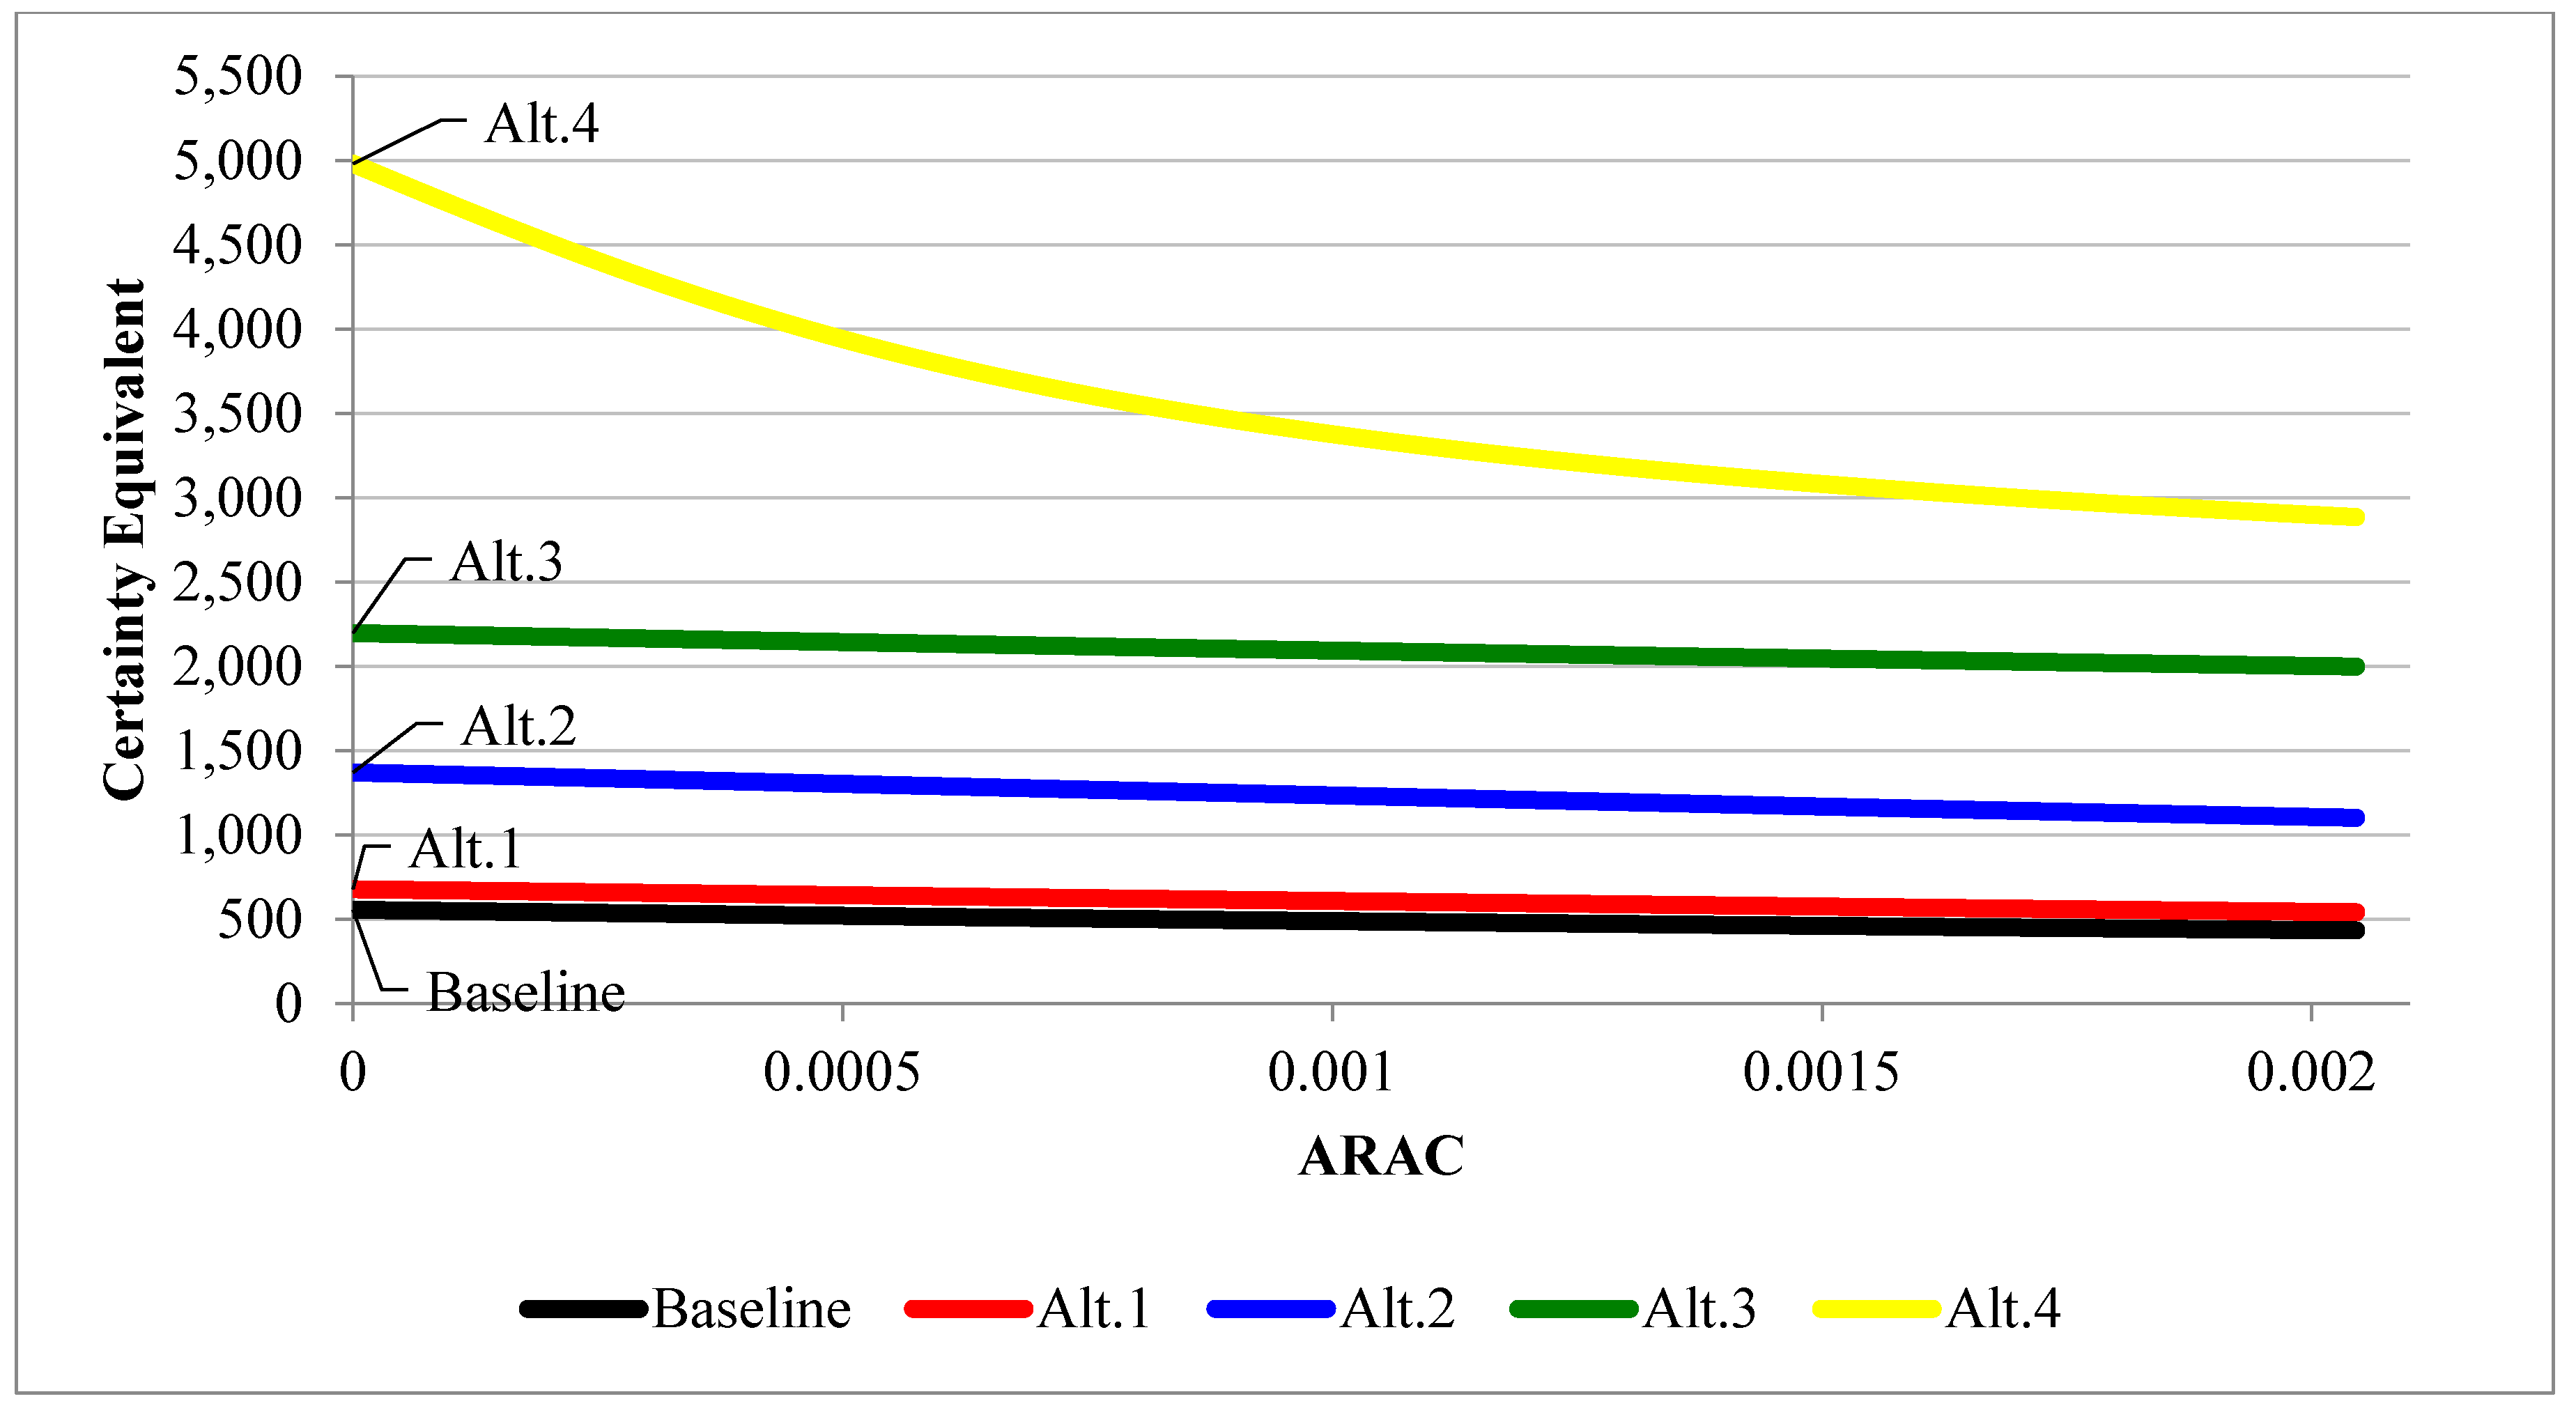
| Income during low supply season (October–March) | ||||||
| Baseline | 558.0 | 386.8 | 69.3 | −14.9 | 1705.4 | 0.43 |
| Alt.1 | 677.8 | 376.3 | 55.5 | −77.3 | 1600.4 | 1.41 |
| Alt.2 | 1370.2 | 513.6 | 37.5 | 221.8 | 2274.3 | 0.00 |
| Alt.3 | 2197.2 | 463.9 | 21.1 | 1178.1 | 3496.1 | 0.00 |
| Alt.4 | 4979.7 | 2199.7 | 44.2 | 1665.6 | 8851.5 | 0.00 |
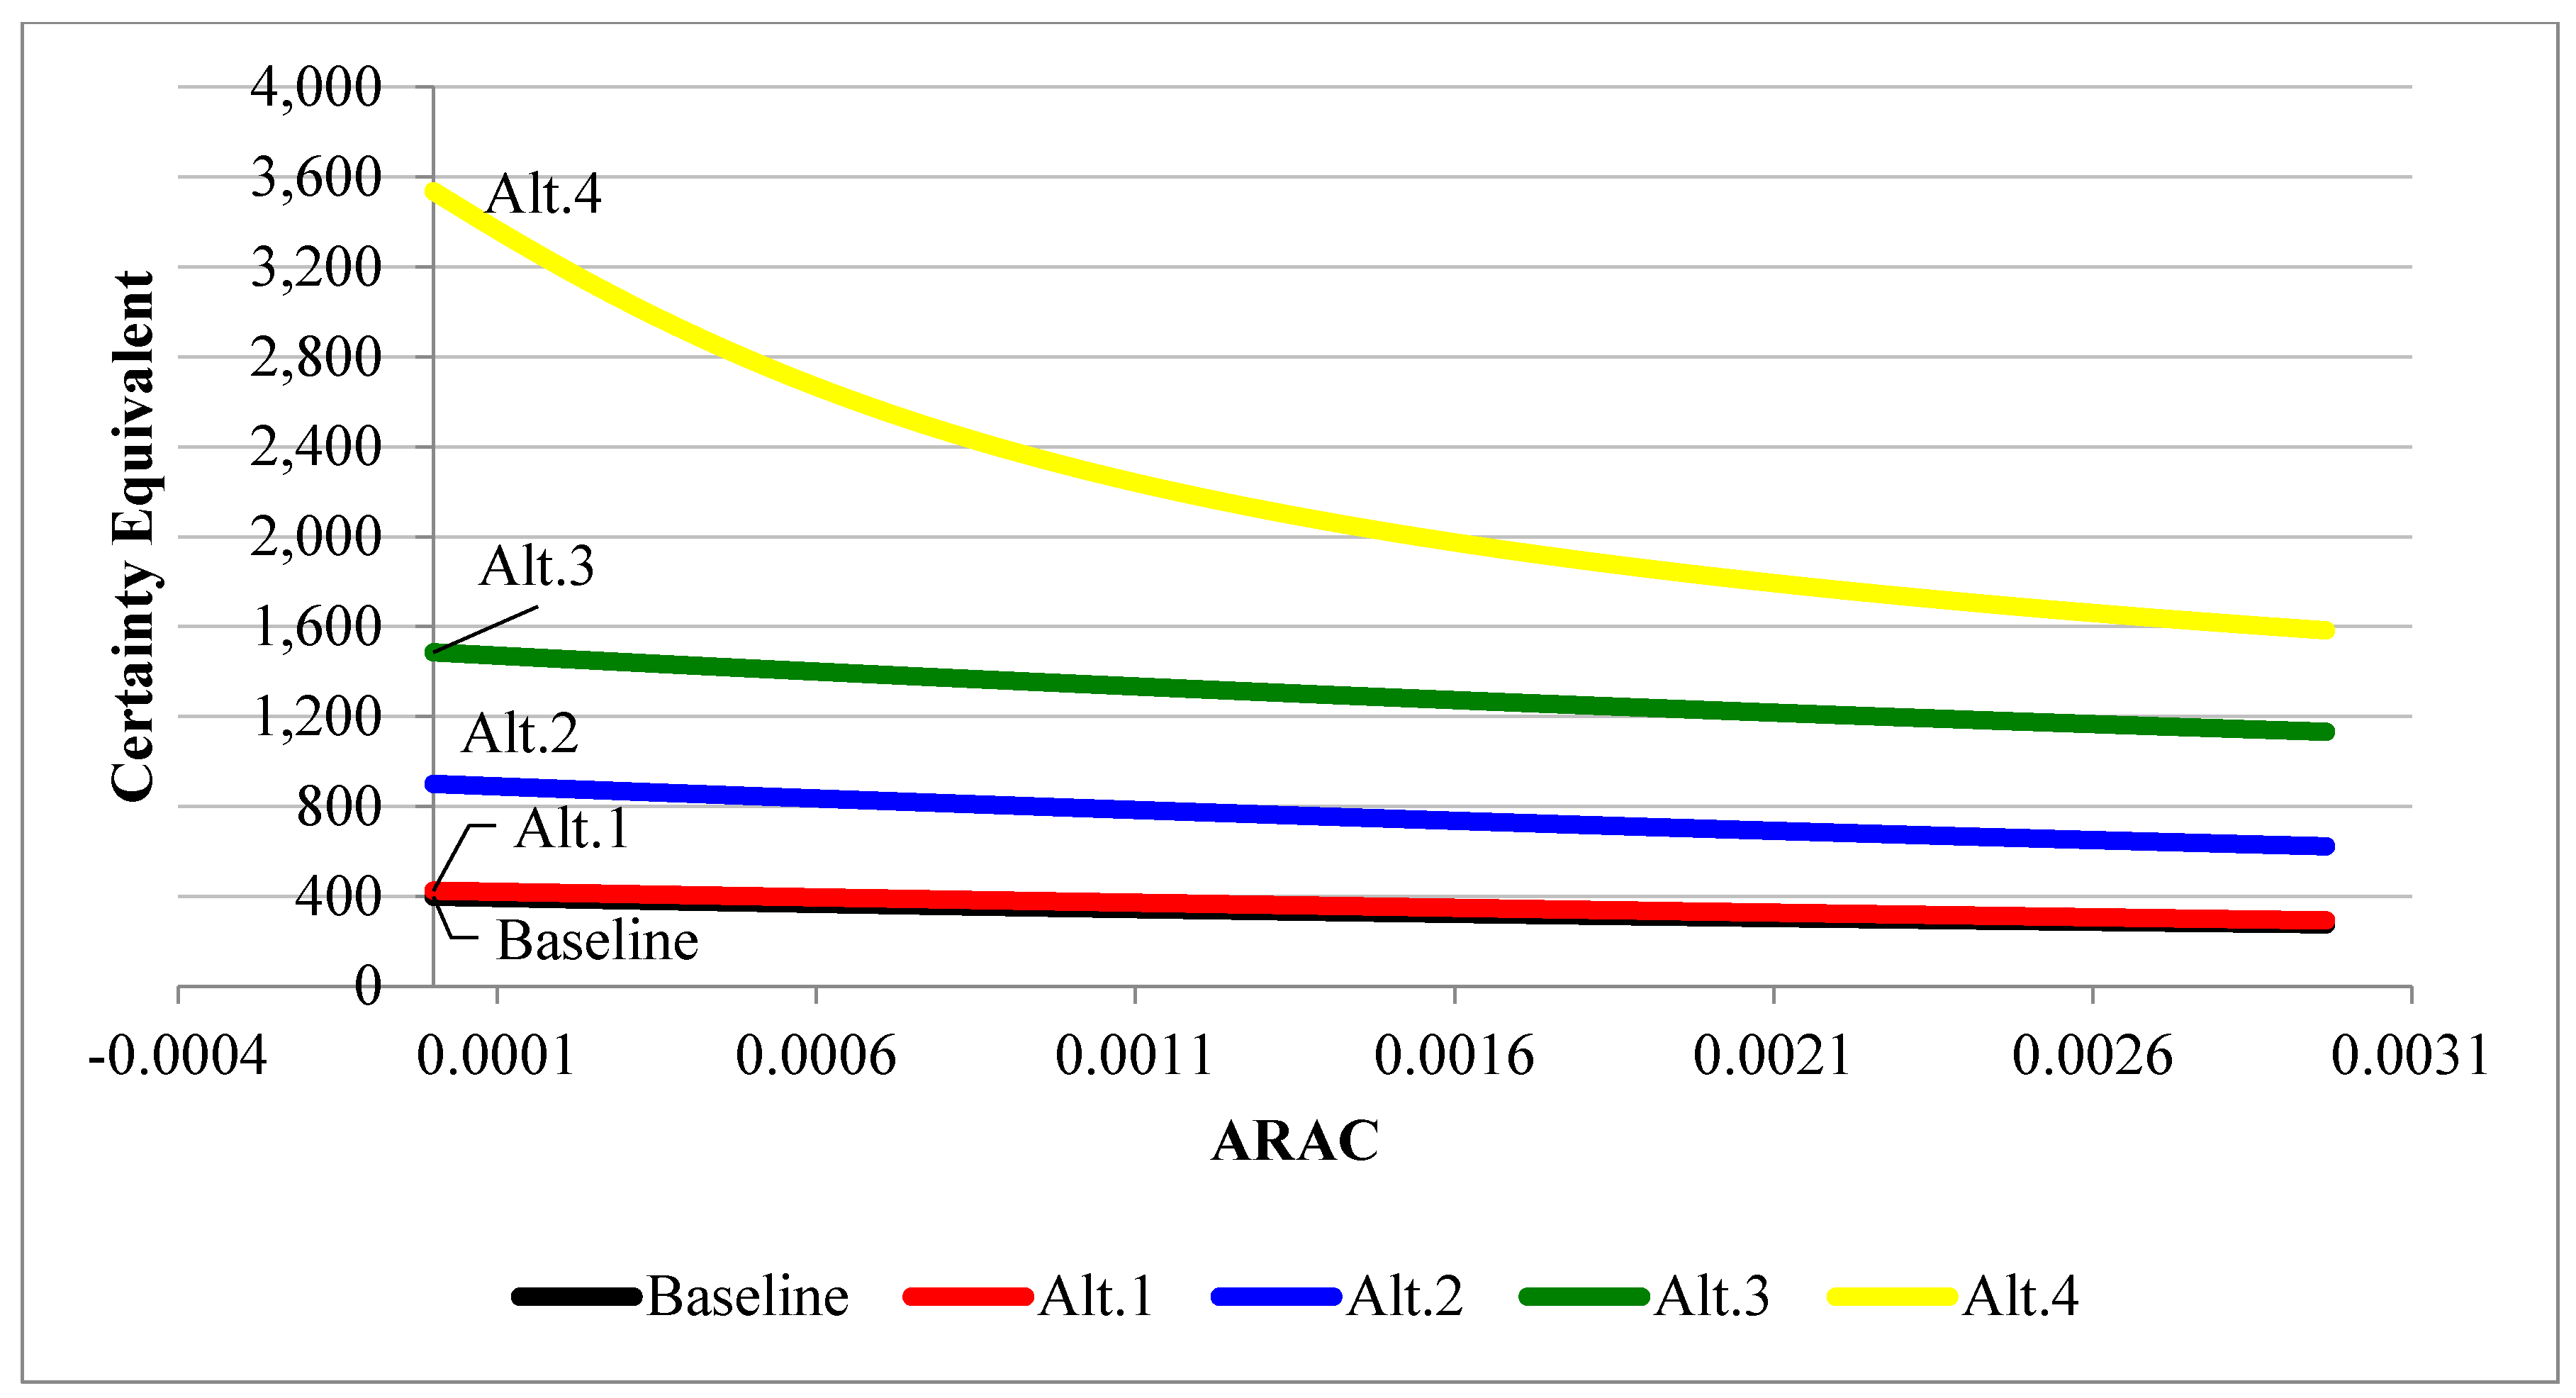
| Annual net income | ||||||
| Baseline | 399.2 | 338.4 | 84.8 | −126.2 | 1516.6 | 3.59 |
| Alt.1 | 424.9 | 318.5 | 75.0 | −213.9 | 1348.6 | 9.62 |
| Alt.2 | 899.7 | 470.0 | 52.2 | −75.3 | 2227.9 | 0.57 |
| Alt.3 | 1485.7 | 545.2 | 36.7 | 308.6 | 3147.2 | 0.00 |
| Alt.4 | 3537.2 | 1885.9 | 53.3 | 527.7 | 8312.9 | 0.00 |
© 2020 by the authors. Licensee MDPI, Basel, Switzerland. This article is an open access article distributed under the terms and conditions of the Creative Commons Attribution (CC BY) license (http://creativecommons.org/licenses/by/4.0/).
Share and Cite
Kadigi, I.L.; Mutabazi, K.D.; Philip, D.; Richardson, J.W.; Bizimana, J.-C.; Mbungu, W.; Mahoo, H.F.; Sieber, S. An Economic Comparison between Alternative Rice Farming Systems in Tanzania Using a Monte Carlo Simulation Approach. Sustainability 2020, 12, 6528. https://doi.org/10.3390/su12166528
Kadigi IL, Mutabazi KD, Philip D, Richardson JW, Bizimana J-C, Mbungu W, Mahoo HF, Sieber S. An Economic Comparison between Alternative Rice Farming Systems in Tanzania Using a Monte Carlo Simulation Approach. Sustainability. 2020; 12(16):6528. https://doi.org/10.3390/su12166528
Chicago/Turabian StyleKadigi, Ibrahim L., Khamaldin D. Mutabazi, Damas Philip, James W. Richardson, Jean-Claude Bizimana, Winfred Mbungu, Henry F. Mahoo, and Stefan Sieber. 2020. "An Economic Comparison between Alternative Rice Farming Systems in Tanzania Using a Monte Carlo Simulation Approach" Sustainability 12, no. 16: 6528. https://doi.org/10.3390/su12166528