1. Introduction
The World Bank Group database and the International Energy Agency (IEA) statistics show that the overall global energy consumption is continuously increasing [
1,
2]. Jordan is experiencing a large increase in consumption, which comprises an enormous quantity related to Jordan’s population, area, industry, and GDP.
It was projected in the 2019 International Energy Outlook issued by the IEA [
1] that the transportation sector’s energy consumption will increase by 1.4% annually, from 104 quadrillion British thermal units (Btu) in 2012 to a forecasted 155 quadrillion Btu in 2040. Most of the transportation energy demand growth occurs in regions outside of the Organization for Economic Cooperation and Development (non-OECD), including Jordan. The transportation demand is roughly flat in OECD regions—largely reflecting different expectations for economic growth in developing regions compared with developed regions. The non-OECD demand for transportation fuels continues to outpace the OECD demand, and in 2040 the non-OECD regions are expected to account for 61% of global transportation energy consumption.
As for the transportation sector, the IEA has released data showing that the transportation of people and goods accounts for 25% of the global energy consumption. Passenger transportation accounts for most of the transportation energy consumption. Light-duty vehicles alone consume more than all freight transportation, such as heavy trucks, marine, and rails [
3]. As diesel and gasoline are the most used transportation fuels, the greenhouse gas (GHG) emissions are sized proportionally. Particularly in Jordan, the numbers and percentages are greater. The Jordan Ministry of Transportation indicates that 49% of the energy consumption in Jordan is used for transportation. As Jordan imports most of its energy needs, the transportation sector has a high effect on the economy and trade deficit [
4]. Therefore, establishing reputable transportation systems is necessary, and using clean energy instead of fossil fuels within the nominated system is of extreme importance.
An Electric Vehicle (EV) can be defined as a vehicle that deploys one or multiple motors, either electric or traction, in order to achieve propulsion [
5]. The many economic and environmental benefits have led to the increased utilization of EVs in many countries. EVs are considered as an environmentally friendly form of transportation. Furthermore, EVs have become an affordable transportation mean, as initial investment has decreased. Manufacturers have received tremendous governmental support through credits and incentives that have contributed to reduced prices and increased popularity. This, in turn, reduces national dependence on fossil fuels, and diminishes harmful emissions.
The charging process of a plug-in EV (PEV) battery may have power quality consequences on power distribution systems, as excessive harmonic currents may occur and high voltage distortion levels are expected. In [
6], the harmonic distortion and its effects on distribution transformers are discussed. To analyze the effects of the penetration levels of EV charging on a test grid, a study has been conducted in [
7], where the impacts on the voltage levels and thermal loading were studied. The authors in [
8] proposed coordinated charging for plug-in hybrid electric vehicles (PHEVs) which are charged at home. The main reason behind this approach is to reduce the power losses and increase the load factor of the grid. The optimal charging profile can be determined through diminishing the value of power losses.
During the day, EVs may park several times for long periods. As a result, EVs can be utilized as a power source for grid support, especially during peak load periods [
9]. In addition, auxiliary services such as the frequency control, the power reserve supply, and load-shedding can be supported [
10,
11]. The concept of Vehicle to Grid (V2G) utilizes grid-connected EVs by injecting or drawing electric energy from the grid for grid stability support. However, the large penetration of V2G technology can influence the grid operation as well. Specific attention was paid to harmonic power ancillary service [
12], voltage unbalance [
13], system reliability [
14], and integration with renewable energy sources [
15].
A comparison has been made between the PHEVs and the traditional hybrid electric vehicles (HEVs), particularly in the United States. The results found that PHEVs can reduce CO
2 emissions by (25–50)%, within short-term and long-term operation [
16]. Different charging technologies have considerable impacts on the performance of public EV transportation fleets. Several research efforts have considered the optimization and tradeoffs between the charging time and health of the EV battery [
17,
18]. In [
19], a detailed analysis and optimization approach to compare the service capacities and earnings of EV charging and battery swapping for taxi and bus fleets was presented. A comparable effort were also carried out to present the optimal deployment of battery swapping systems [
20], PV utilization for battery charging stations [
21], and the impact of battery chargers on grid connection [
22].
Charging scheme and technology plays a major role in coordinating the operations of EV fleets. However, that is true for public fleets that run continuously with limited time to spare for recharging. In such a case, the selection of the best charging technology would influence the feasibility of the whole operation. In the case that is discussed in this manuscript, the EV fleet belongs to a private campus where the entire load demand, schedule, and exact operation are predictable. Thus, the selection of the charging technology is relaxed, as plenty of time can be made available for recharge without influencing the commute schedule.
The depletion of non-renewable energy sources such as fossil fuels is not the only problem associated with using such fuels for vehicles. The production of staggering amounts of dreadful emissions that hurt the environment and inhabitants’ health is as significant. The transportation sector, particularly in developing countries, plays a critical role in global energy consumption and greenhouse gas (GHG) emission reduction strategies. Without pre-emptive action in developing countries, transport sector emissions may increase rapidly, and the costs of future retroactive mitigation activities may be prohibitive [
23]. Thirty percent of CO
2 emissions in Jordan are caused by fuel burnt for transportation. The World Bank collection of development indicators reported 26,450 kt of CO
2 emissions in Jordan in 2014 [
2]. However, transportation produced 7935 kt of CO
2 emissions in Jordan in 2014.
Large quantities of carbon emissions have an unpleasant impact on the environment, such as through climate change, air pollution, citizens’ health, water reservoir quality, and food quality and quantity. Therefore, adopting low emissions with clean energy transportation systems becomes an imperative matter. Transforming conventional transportation systems into fully electric systems may harvest the environmental and economic benefits available. If EVs are supplied using renewable energy sources, then tremendous reductions in CO2 emissions can be achieved. Existing renewable energy infrastructures can be further utilized to meet the electrical energy deficit needed to supply EVs, which is the aim of this manuscript. This manuscript proposes a coordinated methodology for large transportation fleet campuses, such as universities and governmental institutes, to utilize existing renewable energy infrastructures and EVs. Large energy consumers have been investing in on-grid PV systems to cover their energy needs, as such systems have become economically feasible. Thus, tweaking existing on-grid PV systems to sustain the transformation to EV adaptation is the main interest of this work. GJU as a case study is considered to validate the methodology, which is scalable and repeatable.
This paper introduces a new integrated electrical transportation system which is utilized by a university campus with a large fleet of buses that are needed for the daily commute of students and staff. The campus houses an on-grid PV system that meets the annual energy demand. The proposed transformation in transportation will utilize this system to cover the energy needed for converting the campus buses fleet into an electrical fleet. Variables such as the daily routes, distances traveled, schedule, number of passengers, and required electrical energy are determined and used to design the complete system. It should be noted that the GJU is selected as a case study, and several modifications have been proposed to increase the efficiency and yield of the existing solar system. The main contribution of this work can be summarized in the following points:
- -
Proposing the concept of the energy auditing of existing renewable energy projects and PV plants is main focus of this work. The reason is that current regulations and conventional design methodologies do not necessarily allow for the full exploitation of the invested capacities.
- -
Transforming conventional transport systems into fully electric fleets with a demand totally covered by renewable energy sources to mitigate any additional stresses on the grid.
- -
Minimizing the interaction with the grid to secure the energy demand to power the EV fleet through well-designed fleet schedules, exploiting peak sun-hours to secure maximum charge for EV batteries, and the utilization of self-consumption PV systems to cover any deficit in energy demand during peak hours without adding extra stress to the grid.
2. Baseline, Proposed Measures, and Methodology
In the present study, a renewable energy-powered transportation system for a university campus with large fleet is proposed. The methodology proposed is replicable to any predictable commute fleet services, such as those in universities and governmental institutes.
First, the current university transportation system is investigated to quantify the size and demand of the transportation service. Then, an assessment will be carried out on the existing university energy demand in addition to an educated estimation of the additional electrical energy required to supply electric buses instead of conventional diesel buses that meet the same transportation demand. Then, a set of measures are proposed to optimize the energy harvested from the existing PV system and to increase the energy generation to meet the additional load demand. The economic feasibility and environmental impact of the proposed measures are assessed as part of the proposed methodology.
To facilitate the transition to an electric-powered transportation system, the corresponding energy demand is foreseen from the existing renewable energy infrastructure that serves as a backbone for implementing such an ambitious transformation. The actual energy generated from the existing PV system is calculated and taken into consideration to cover the total projected load demand, including the campus and the EV fleet. Several measures are proposed to enhance the energy generation form the existing PV system.
The first proposed improvement is to increase the power factor, which would increase the yield from the existing PV system. Reactive power compensation is utilized to help enhancing the power factor. In grid-connected PV systems, the utility operator usually sets the power factor at which the inverters will operate to leave a margin for reactive power support and to reduce the stress imposed on the grid. Usually, for non-industrial plants, the reactive power demand is not billed and is supported by the utility grid. For this reason, the electric distribution company compels consumers to install power factor correction (PFC) equipment in order to provide this reactive power to their local loads thus diminishing the grid support requirements. In the GJU campus for instance, there are six capacitor banks (reactive power compensators) that are installed with a total value of 1200 kVAR, which is considered quite large compared to the total energy and power demand of the campus, as detailed in later sections.
Limiting the power factor will limit the amount of harvested energy from the PV system. If reactive power compensation is utilized, then an important energy gain can be achieved without compounding stresses on the utility grid. Thus, to facilitate renewable energy supply for EV fleets, it is essential to implement reactive power compensation systems.
The second proposed measure to enhance the energy generation from the existing PV system is by increasing the DC/AC ratio to the allowed limits recommended by the inverter manufacturer. In this case, the peak generation hours will be expanded without losing the manufacturer’s warranty and will increase the energy generation potential.
Enhancing the power factor and maximizing the DC/AC ratio will partially cover the projected load demand of the electric bus fleet, and the remaining energy deficit is covered by expanding the PV system using a self-consumption solar PV system. Such a system will not in fact increase the size the of the on-grid PV system. Rather, it constitutes an off-grid PV system that is utilized during peak load demand hours to cover the internal consumption. During the times when the generation is more than the consumption, this system is automatically disconnected and is not interfaced with the utility grid directly. In this case, the overall PV system will not violate the grid connection regulations. To implement the aforementioned procedures to the case study in hand, the existing load demand, installed PV system, and transportation scheme are described in detail.
Environmentally, an impact assessment is necessary to quantify the consequences of a project’s development on the environment, natural resources, and public health [
24]. The outstanding benefit that can obtained from using EVs is the elimination of emissions generated from vehicle tailpipes. The CO
2 emissions from an EV are based on the fuel pathway to generate electricity. EVs that derive their power from the grid will contribute to CO
2 emissions through the use of fossil fuels, which are still the primary source of energy for grid power. Hence, the use of an alternative clean source, such as wind or solar energy, to generate the electricity is highly recommended and will cut the EV charging-based CO
2 emissions.
Emissions related to the manufacturing and production process of EVs are not considered in this study. Those specific emissions do account for a substantial portion of the total lifetime emissions associated with EVs [
25,
26,
27]. However, those emissions do vary very widely in the literature, from 17% of the total EV-associated emissions in [
28] to 50% in [
26]. Due to the high uncertainty in the manufacturing and production-related emission calculations in the literature, the focus in this study is on those emissions related to the fuel pathways, as the change in energy source is the major driver here. CO
2 emission reduction as a result of the utilization of a solar-powered EV fleet can be estimated by the daily travel schedule and covered distance with the aid of the data found in [
29]. To facilitate the GHG emission calculations, the emission factors for the diesel fuel are utilized along with the average fuel consumption rate of the conventional and currently used diesel buses, utilizing the same technique as in [
30].
Financially, the validation of the proposed system is based on many factors and uses simple return calculation. The infrastructure upgrade along with all modifications to the existing system are taken into consideration at the current market prices. The operation and maintenance cost is estimated at 5% of the total system cost, according to the general approach in the Jordanian market. The commuter paid tariff can be easily estimated following the transportation schedule proposed for the fleet.
4. Results and Discussion
4.1. Proposed Transportation Fleet Schedule
In order to apply the proposed measures to convert the operating fleet into EV technology and at the same time meet the expected increase in electrical energy demand using the available renewable energy resources, a new trips schedule is proposed and shown in
Table 5. The assumption is that all the EVs are fully charged in the morning and thus the entire fleet is deployed. Depending on the load demand (class schedule and number of students), a second batch is deployed and the reminder of the fleet is in V2G mode.
The proposed schedule consists of 8 tours, with 61 daily trips. The number of buses which are used per tour corresponds to the number of passengers that are expected in that tour. The morning tours are the most important, since most passengers commute to campus. Thus, 26 buses are deployed in this tour. The proposed schedule assumes that each trip has only two loading points (starting and ending points) to minimize the waiting times and hence the wasted energy.
Trips 1 and 2 are the morning tours. The total energy consumed during this period is 1886 kWh. Moreover, the number of served passengers in these trips is 936. Based on this distribution of trips throughout the day, it can be noted that the rest of the day tours utilize a lower number of vehicles compared with the morning tours, which in turn increases the ability to regulate the charging/discharging of electric buses to commensurate with the electrical energy that is stored in the batteries of those buses. In addition, in the proposed schedule, the EVs are distributed on different routes according to a pre-scheduled charging plan. For example, less charged buses are used for the shortest trips, whereas the most charged buses may go more than one tour and for longer distances. The daily electric storage capacity of the proposed fleet is 8372 kWh. Based on the total distances of trips and the rate of energy consumption, the entire fleet consumes 4658 kWh during a working day.
4.2. Proposed Solar System for Electric Transportation System
As previously mentioned, the electric transportation system consumes 4658 kWh/day, whereas the expected consumption rate of the proposed system is expected to reach 921.3 MWh/year. To fully meet this energy demand using the existing PV system, the following energy calculations are carried out, starting with the total energy available to the gird
as in (2):
where
and
refer to the inverter efficiency and the array energy respectively. To determine the number of PV modules required, it is proposed to use Jinko Solar JKM315P-72 PV modules, and an ABB inverter that has an efficiency equal to 98% and a grid absorption rate equal to 99%. In addition to the previous factors, which have an impact on the number of PV modules that should be used in the proposed system, there are other factors that have a major role in choosing the number of PV modules. This includes the temperature coefficient, ambient temperature, solar radiation, and losses in cables. Equation (3) is used to calculate the energy injected into the utility grid.
where
is the total energy injected into the utility grid and the
parameter refers to the grid absorption rate. Equation (4) is utilized to compute the number of PV modules that are needed.
Where the
parameter can be calculated using the following equation:
where the
and
indicate the maximum load demand and the power produced per module, respectively. Equation (6) represents the power generated from each module per day.
where
is the temperature losses coefficient;
is the module loss coefficient;
refer the cable losses coefficients, module peak power, and peak sun hours, respectively.
Based on the previous analysis, the number of modules needed for the proposed system is found to be 1614, with a plant size of 508.41 kWp. This is the size of the PV system needed to cover the load of the proposed EV fleet.
To enable the construction of an electrical transportation system which is able to serve the passengers of the GJU campus, a fleet of 26 electric buses is needed and is projected to consume about per day to meet the proposed schedule demand. Furthermore, it has been determined that a 508.41 kWp PV system is required to meet the proposed transportation system demand, which in turn compels us to expand the solar system of GJU to yield this amount of energy.
Rather than expanding the existing PV system to cover the additional load demand, some improvements on the current solar system are proposed to optimize the energy yield. In this context, correcting the power factor and increasing the DC/AC ratio of the current PV system are proposed. Furthermore, a self-consumption system (off-grid system) is utilized to diminish the energy cost of this system and to ameliorate the production of the existing solar system.
4.3. Power Factor Correction
The inverters have been programmed with 0.9 PF (leading). This indicates that the PV power plant loses 10% of the potential energy that is produced from the solar system during the year. However, the PF value can be varied up to a 100%. In cases where the percentage reaches 100%, it is called a unity PF and all available power will be delivered as active power. If a consumer installs a solar PV system, the utility company requires the users to generate their own reactive power. This power is usually produced through adjusting the inverters, which in turn reduces the amount of active power produced from the solar system. Installing capacitor banks to correct the power factor (PFC) contributes to producing the reactive power needed on campus. Equations (7)–(9) can be utilized in calculating the size of PFC as follows [
33]:
where
P is the real power in
,
is the apparent power in
, and
Q is the reactive power in
. The power factor correction (PFC) required to change the PF is calculated using the following equation:
where
.
and
indicate the initial and final
, respectively. It is proposed to change the inverters’
from 0.9 to 0.98. This change is compensated by using a PFC size that equals
. This value will be distributed among the distribution transformers throughout the campus in proportion to the solar system value for each transformer. Based on (1), the extra potential energy that can be generated from the existing PV system at GJU by enhancing the power factor value is 344.87
, an energy that represents about 37.5% of the required energy to meet the needs of the proposed EV fleet.
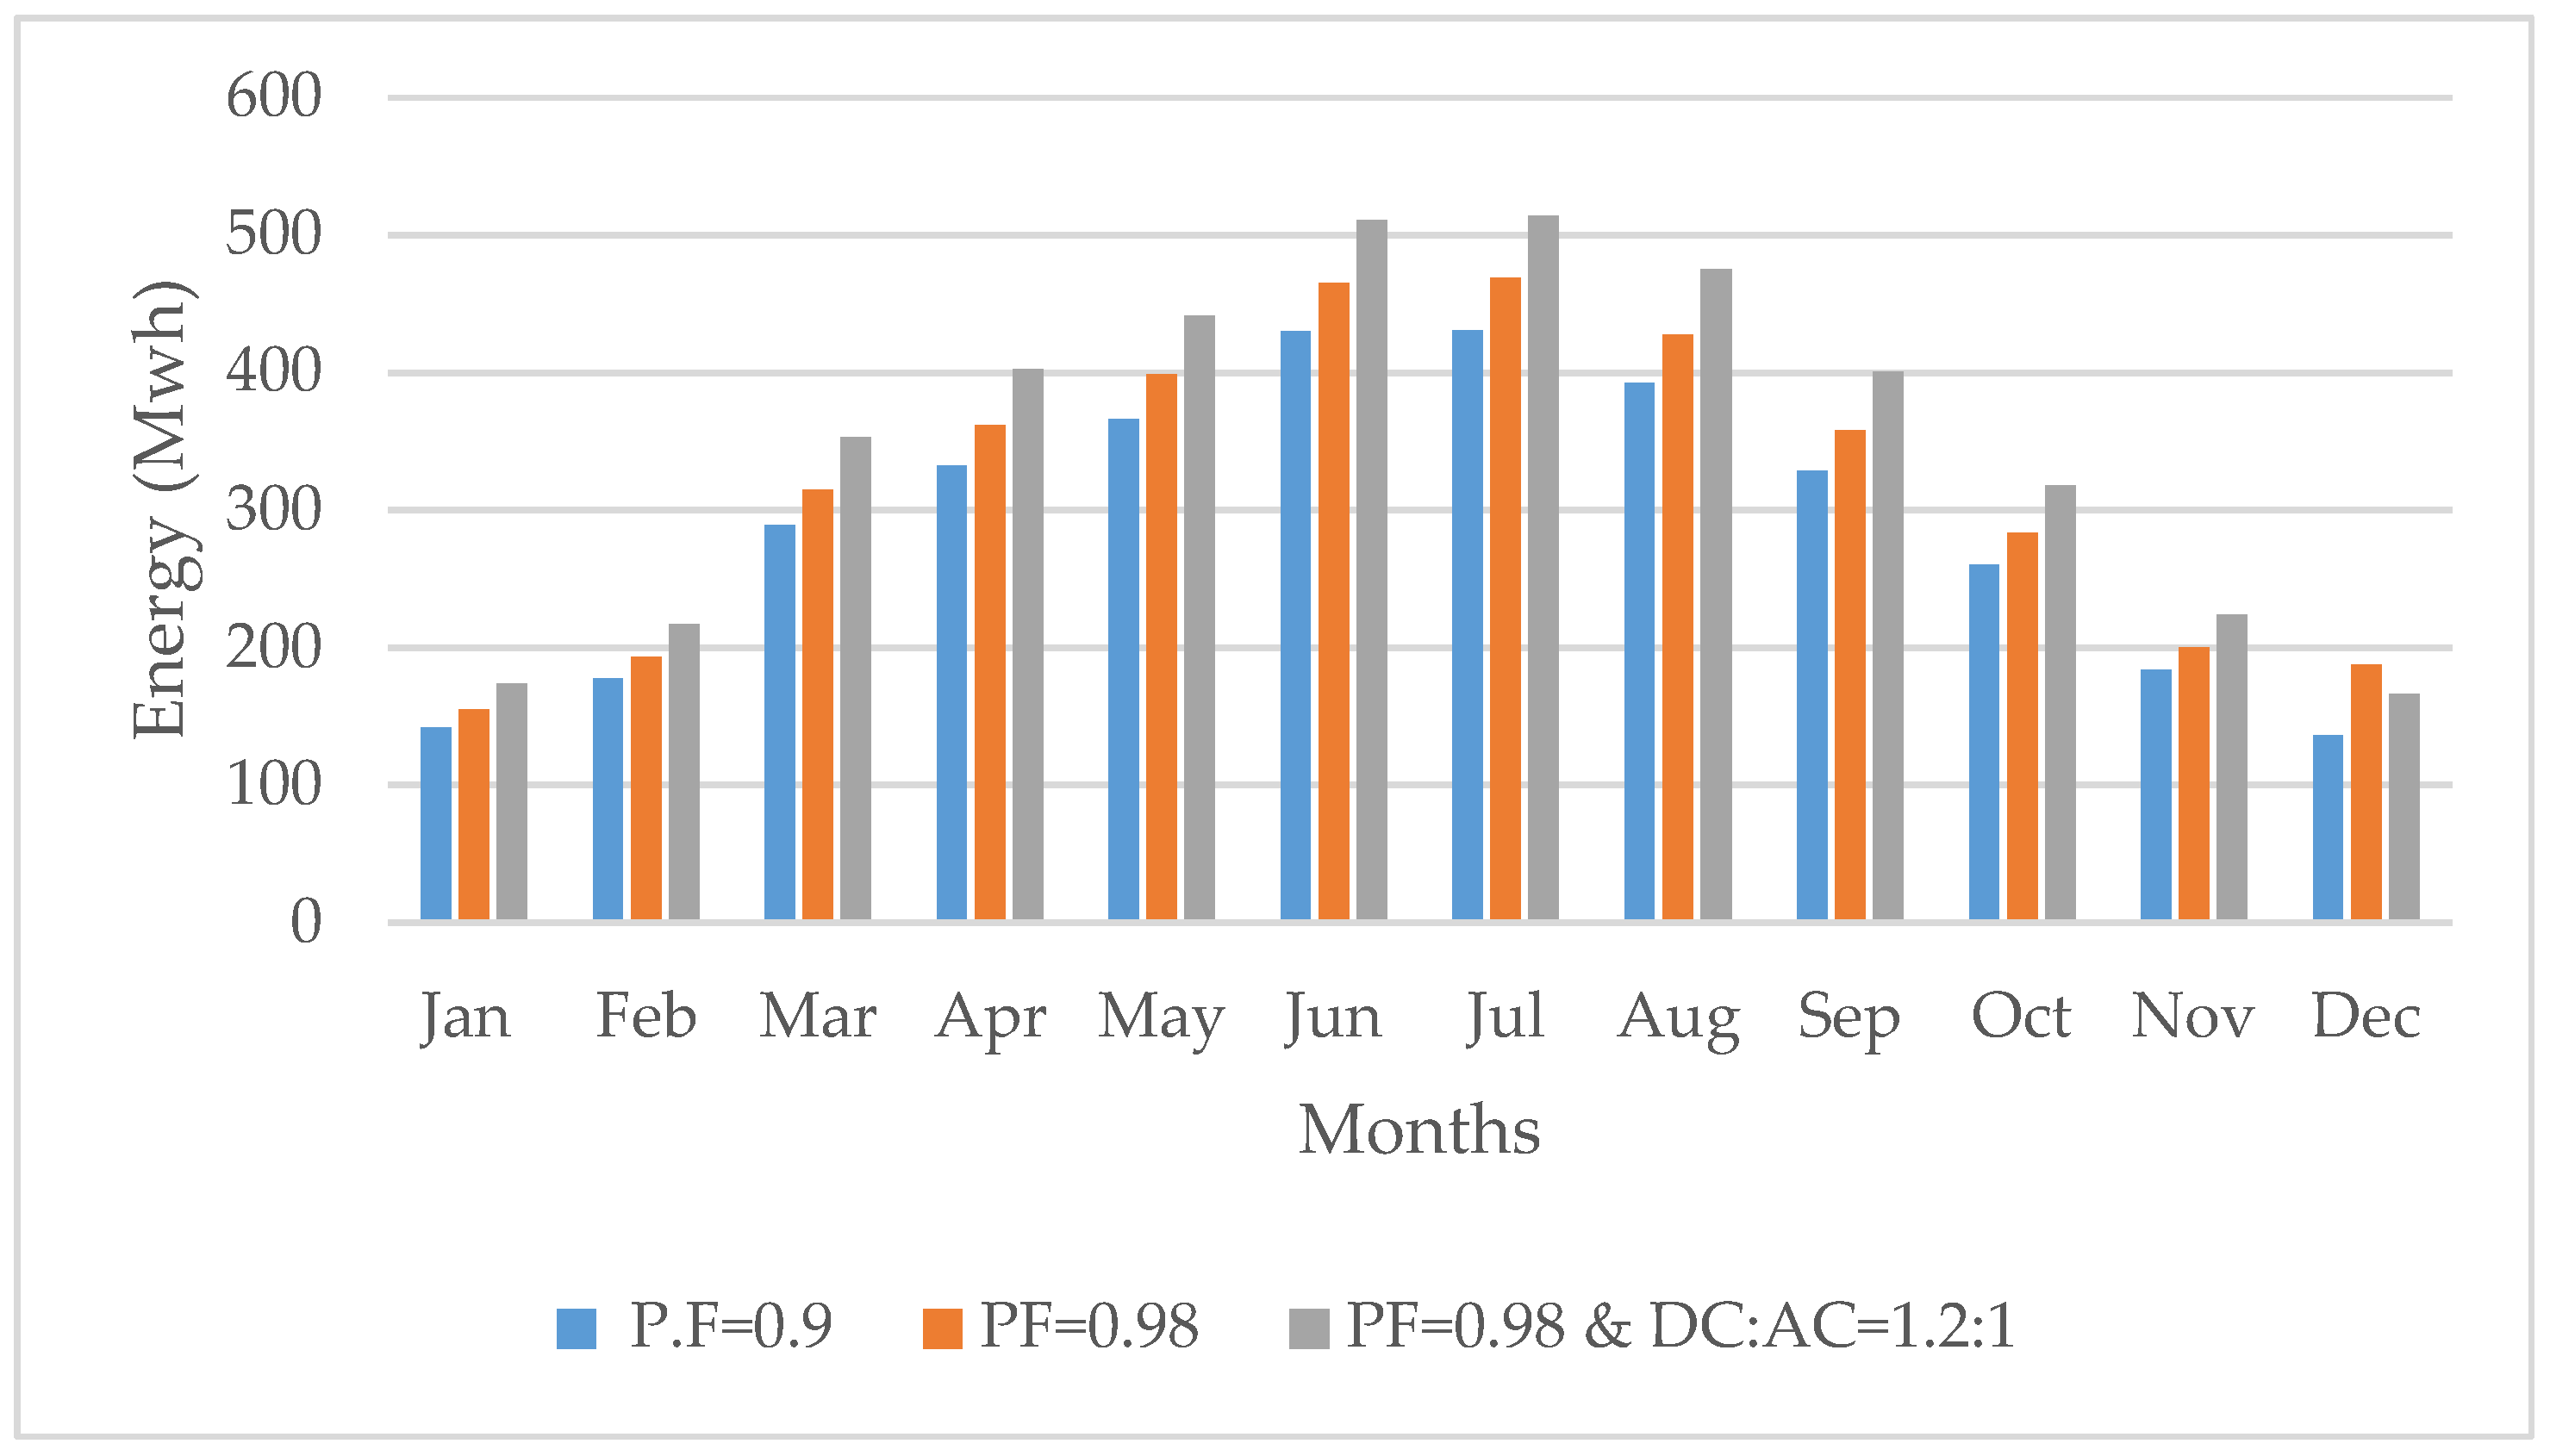
Figure 4 shows the effect of PFC on the energy production per year.
4.4. DC/AC Ratio
The DC to AC ratio is one of the most important parameters that should be considered when designing a solar PV system. The key driver is the “clipping loss”; when the DC power feeding the inverter is more than what the inverter is rated for, the resulting power is “clipped” and lost. Many designers set the ideal DC/AC ratio as a rule of thumb to 1.1:1, with 1.2 being slightly aggressive. Using a 1.25:1 or 1.3:1 ratio is often used to improve the project economics, when the project size is constrained by the AC capacity. The GJU campus PV energy system contains 79 inverters with 1965.7 kW rated power, while the number of PV modules is 6697, which brings the total DC capacity to 2109.5
DC. Accordingly, the DC/AC ratio is 1: 1.073 in the existing system. This means that the system has not reached the maximum ratio allowed by the inverters. Referring to the inverter’s data sheet, it is possible to increase the DC ratio to 1.2, resulting in 2358.84
, without affecting the performance of the inverters or violating the warranty. Based on (1), the amount of energy that can be produced by taking both measures, increasing the DC/AC ratio, and correcting the PF is 726.74 MWh/Year, which represents 79% of the energy needed for the electrical transportation system per year, as estimated in
Section 3.2.
Figure 5 shows the monthly energy production of the solar system per year with different the energy enhancement measures proposed.
4.5. Self-Consumption Solar PV System
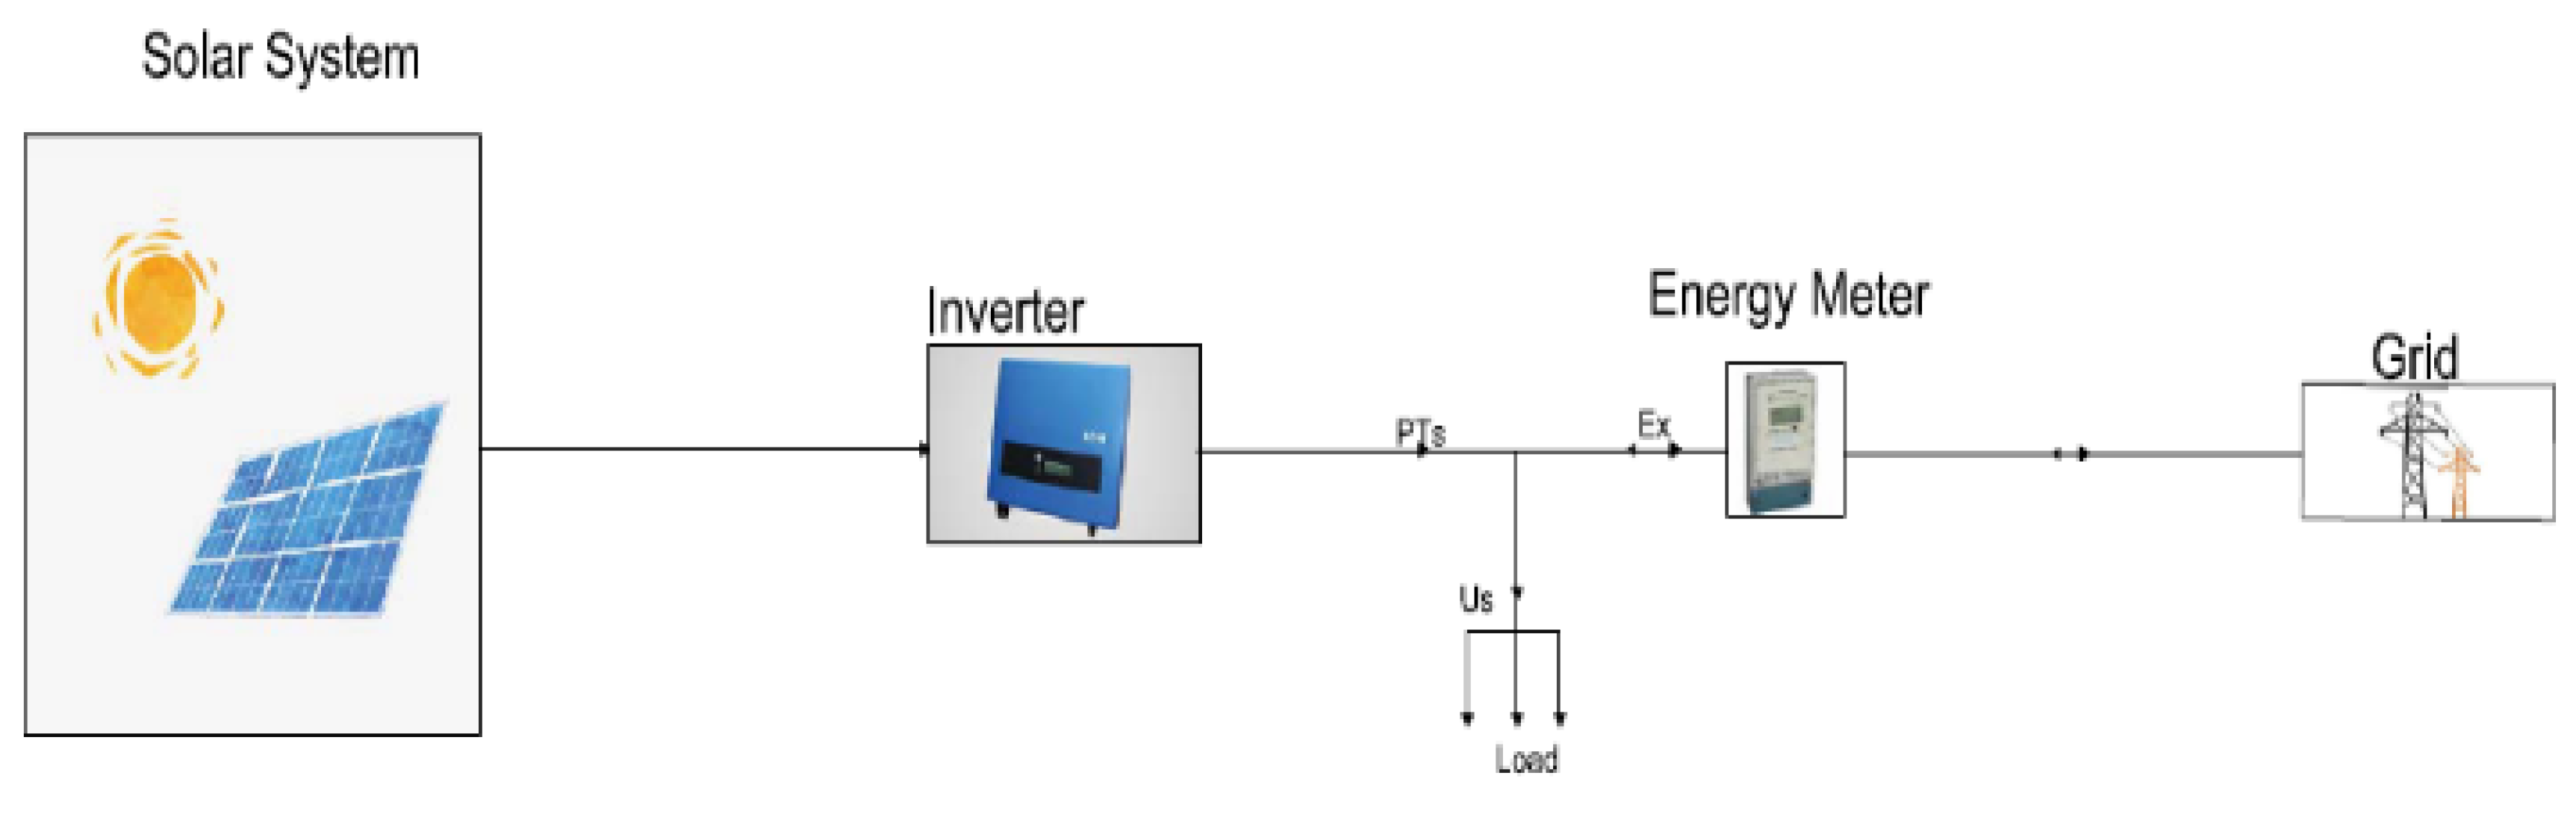
A self-consumption solar PV system produces electrical energy that is used to meet the demand of the local loads, thus not injecting power into the utility grid. Such a system is utilized to compensate the energy deficit needed to meet the proposed electric bus fleet demand without increasing the size of the on-grid PV plant.
Figure 6 shows the configuration of the self-consumption solar PV system.
is the total photovoltaic production,
refers to the self-consumption or useful production,
represents the excess of produced energy to be injected into the grid, and
indicates the consumer need with all sources included.
The self-consumption is based on energy management and load control during peak energy production. In the case where the user consumes the electricity at the time of production, the utility grid will not interact with the load, and no power demand is registered. On the other hand, if the produced energy is not consumed, then it is injected into the grid, and the user should manage the system, such that energy produced is consumed at a different time, in which the load interaction with the grid is amplified. Thus, the self-consumption system does mitigate this issue, by generating just enough energy to cover the internal load consumption during the peak load hours, and remains idle if the load demand falls below the generation capacity of the on-grid PV system.
The proposed self-consumption system should be sized to generate 109 MWh/year, representing 21% of the EV fleet projected demand. Buses are charged every day. Hence, the load must be distributed along the year. Therefore, the energy that is required to be generated on a daily basis, in accordance with the self-consumption solar system, is 534 kWh/day. Based on Equation (4), the self-consumption solar system that is able to produce this amount is 189 kWDC.
Implementing all the proposed measures to enhance the energy generation of the existing PV system has contributed to meeting 79% of the energy needs of the EV fleet, and the remaining 21% can be covered by means of a self-consumption PV system. It is worth mentioning that these measures and proposed actions do not reflect any stress on the point of common coupling with the utility grid and hence, enhancing the energy independence of the campus and fully supporting the EV fleet with a renewable electrical energy source.
To validate the effects of the PFC and increasing the DC/AC ratio measures, the PVSyst simulation package is utilized to simulate part of the existing PV system at the GJU campus. The specific zone has three inverters rated at 27.6 kWAC each and 276 PV modules rated at 315 Wp each. The inverters are calibrated at power factor of 0.9, and the resulting DC/AC ratio is 1.05:1. The estimated annual energy production is 156.2 MWh/year. If the layout is modified and 324 PV modules are used, the resulting DC/AC ratio will be 1.232:1. The power factor is calibrated at 0.98. Then, the new predicted energy yield will be 182.9 MWh/year, which indicates an around 17% energy yield gain. Of course, the intervention at each part of the installed PV system will be constrained by the structure of the system, the layout of the PV modules, the inverters configuration, and the physical space constraints. Thus, the gain will vary depending on the nature of the site.
4.6. Environmental and Finacial Impact
The amount of CO
2 which is produced from the conventional transportation system at GJU depends on the number of trips, distances per day, and number of passengers. According to the U.S. Environmental Protection Agency (EPA) [
29], the amount of CO
2 emitted due to the traditional transportation system may be calculated using the emission factor for the diesel fuel consumption, traveled distance, and consumption rate for the diesel buses.
Table 3 details this information which can be utilized to estimate the amount of emitted emissions, where the consumption rate for the buses is estimated at 30 L/100 km.
Table 6 shows the CO
2 emissions per tour, and the total per day is calculated to be 2544.8 kg.CO
2. As the university has 200 working days per year, the total CO
2 emissions were calculated to be 508.96 kt·CO
2 per year. Using PV-supplied electric buses would eliminate all these emissions.
The financial study of the proposed electrical transportation system is based on a number of factors, which are: the electric bus prices, the required system infrastructure upgrades, the modification costs of the current solar system (PFC), and the cost of raising the solar system production (increasing the DC/AC ratio).
Figure 7 shows the expected cost breakdown for all these factors.
The expected total cost which is required for constructing the proposed transportation system and doing the required modifications is 2.25 million USD. In addition, the operating and annual maintenance costs are expected to be 5% of the project cost. In the fifth year, an overall maintenance will be required for all the project parts. The expected cost for this maintenance may reach 25% of the initial project cost.
Figure 8 shows the total costs and the financial returns of this system. Based on the previous analysis, the payback period for the investment is about 30 months. The huge incentive programs initiated towards renewable energy projects and the working net-metering regulations in the country drive the short payback period and motivate the investment analysis.
5. Conclusions
Converting the conventional transportation system into a full electric fleet possesses several advantages, including environmental gains, economic advantages and advanced technology deployment. Electrification through renewable energy sources such as PV cuts the cost of investment and reduces the payback periods. Moreover, it eliminates the upstream GHG emissions. Capacity limitations of integrating more EVs into the grid require special measures to mitigate these hindrances. Isolating the EVs chargers from the grid is favorable and is only possible through micro grids and V2G technologies. This manuscript proposed an electric transportation system that is fully powered by a renewable PV system utilizing the existing infrastructure for large-fleet campuses. The presented work details a full methodology to conduct an energy audit for the PV plant and to optimize the energy generation to meet the projected demand increase due the EV fleet. As a case study, the GJU campus was selected to apply the proposed system. Thus, a number of issues were considered to establish this system, such as the required number of electrical buses, the number of pick-up locations, the number of tours, and the number of passengers. To secure the energy demand required for the proposed system, an energy audit of the current PV plant at GJU is carried out, and several measures are proposed to enhance the energy generation. The measures proposed included power factor correction and increasing the DC/AC ratio. In addition to that, and to mitigate the grid connection capacity limitations as a result of connecting more EVs chargers, a self-consumption solar system was utilized. The proposed measures are enough to meet the projected load demand without increasing the ratings of the AC side of the PV plant, which indeed reduces the stress on the grid and enables the applicability of the proposed methodology without limitation to similar campuses with transportation fleets. Economically, the payback period is less than three years, utilizing the advantages of the incentive programs offered for renewable energy systems and EVs. Environmentally, CO2 emission reduction is considerable, knowing that all upstream emissions are eliminated; as such, the electrification of the entire EVs fleet is decarbonized.
The methodology presented can be further extended to support the electrification of bigger transport systems that are centrally powered, such as city transit. The proposed measures to enhance the energy generation capacity of existing PV plants significantly incentivize the transition towards fully electric fleets. The coordinated operation of transport vehicles is necessary to make this transition possible and to fully use the advantages of centralized PV plants. The presented case study in this manuscript possesses similar profiles in energy demand, transit requirements, and capacity limitations to a broad sector of campuses and city-operated fleets. The results and impact analysis show an intuitive approach to applying the same concept to different transit systems.


