Attitudes towards Statistics among Business Students: Do Gender, Mathematical Skills and Personal Traits Matter?


Abstract
:1. Introduction
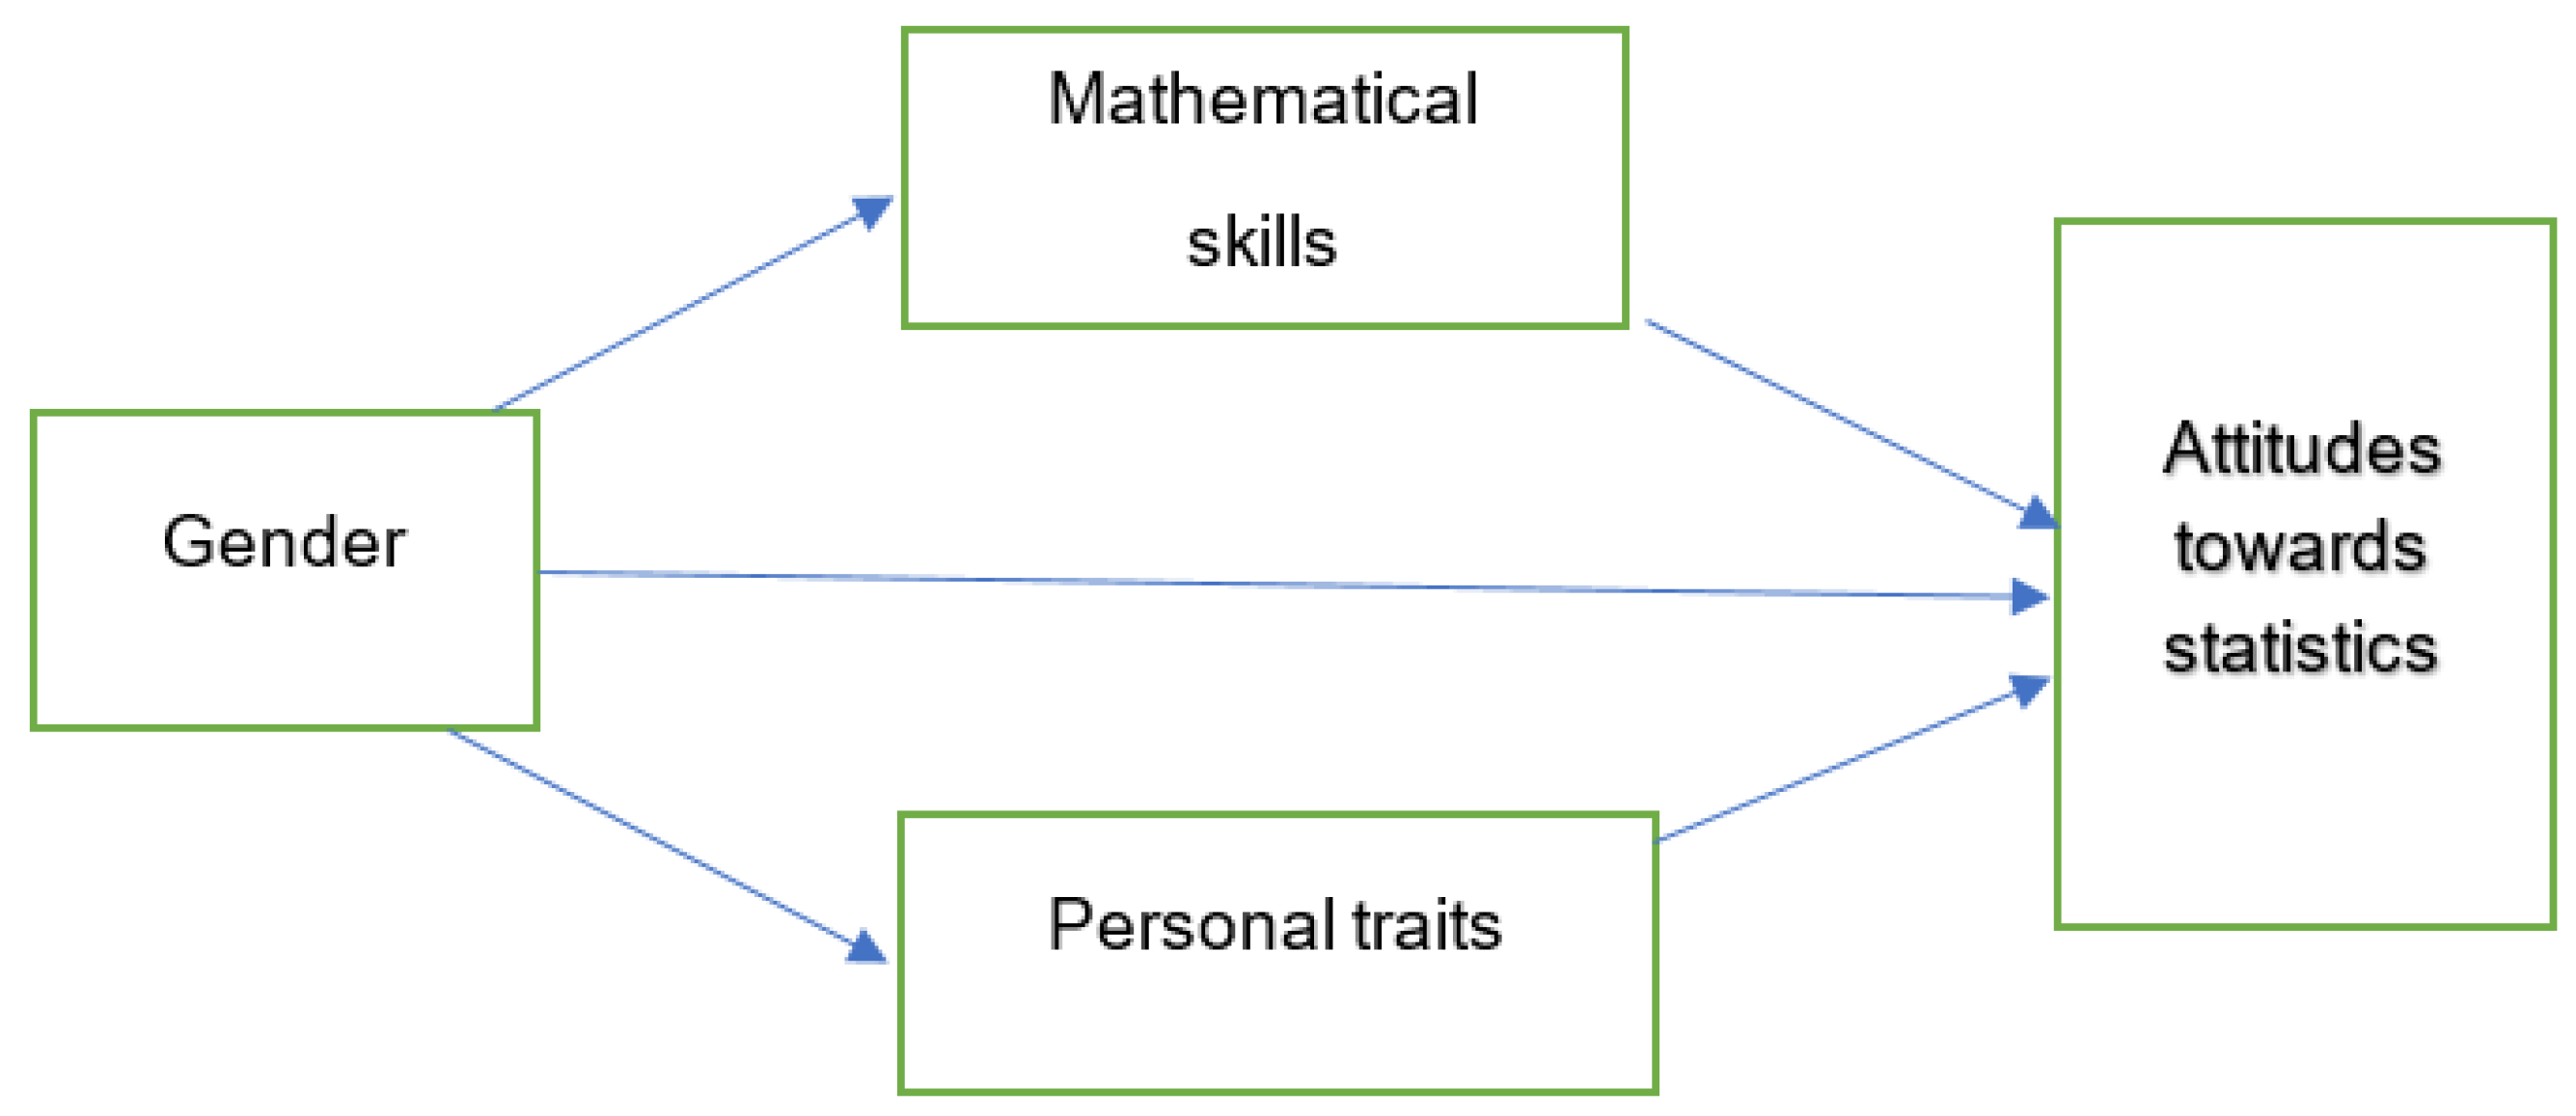
2. Theory and Research Model
2.1. Attitudes towards Statistics
2.2. Gender and Attitudes towards Statistics
2.3. Mathematical Skills and Attitudes towards Statistics
2.4. The Big Five Personality Traits
2.5. Big Five Model and Gender Difference
2.6. Hypotheses
3. Sample and Research Methodology
3.1. Sample
3.2. The Model
- Yi: Factor i attitudes towards statistics, i = Affect, Value, Difficulty, Interest, Cognitive Competence or Effort (Likert scale 1 to 7)
- α0: Constant
- X1: Gender (0:F, 1:M)
- X2: Dummy variable for N-mathematics (0: Non N-maths, 1: N-maths)
- X3: Dummy variable for S-mathematics (0: Non S-maths, 1: S-maths)
- X4: Agreeableness (Likert scale 1 to 5)
- X5: Conscientiousness (Likert scale 1 to 5)
- X6: Extraversion (Likert scale 1 to 5)
- X7: Neuroticism (Likert scale 1 to 5)
- ε: stochastic error
3.3. The Data
4. Finding
4.1. Descriptive Gender Differences and Pairwise Comparison Using T-Test
4.2. Result from the Regression Model
5. Discussion
6. Limitations
7. Conclusions
Funding
Conflicts of Interest
Appendix A

| N | Min | Max | Mean | Std. Deviation | Skewness | Std. Error | Kurtosis | Std. Error | Scale Reliability Cronbach’s Alfa | |
|---|---|---|---|---|---|---|---|---|---|---|
| Affect | 131 | 1.00 | 7.00 | 4.5941 | 1.24911 | −0.460 | 0.212 | 0.151 | 0.420 | 0.837 |
| Cog. Competence | 131 | 1.83 | 7.00 | 5.1883 | 1.07934 | −0.516 | 0.212 | −0.053 | 0.420 | 0.840 |
| Value | 131 | 1.33 | 6.67 | 4.4448 | 0.99616 | −0.220 | 0.212 | −0.015 | 0.420 | 0.851 |
| Difficulty | 131 | 1.14 | 5.29 | 3.5217 | 0.75128 | 0.065 | 0.212 | 0.189 | 0.420 | 0.649 |
| Interest | 131 | 1.00 | 7.00 | 4.4994 | 1.29114 | −0.222 | 0.212 | −0.192 | 0.420 | 0.854 |
| Effort | 131 | 1.50 | 7.00 | 5.6698 | 1.08577 | −1.250 | 0.212 | 1.847 | 0.420 | 0.700 |
| Extraversion | 130 | 1.75 | 5.00 | 3.6404 | 0.78305 | −0.211 | 0.212 | −0.483 | 0.422 | 0.835 |
| Agreeableness | 130 | 2.25 | 5.00 | 3.9103 | 0.56933 | −0.574 | 0.212 | 0.110 | 0.422 | 0.486 |
| Conscientiousness | 130 | 1.50 | 5.00 | 3.6679 | 0.70245 | −0.569 | 0.212 | 0.223 | 0.422 | 0.711 |
| Neuroticism | 130 | 1.00 | 4.50 | 2.7013 | 0.79110 | 0.041 | 0.212 | −0.471 | 0.422 | 0.737 |
| Openness | 130 | 1.50 | 5.00 | 3.3295 | 0.72655 | −0.120 | 0.212 | −0.482 | 0.422 | 0.589 |
| Valid N (listwise) | 130 |
| 1 | 2 | 3 | 4 | 5 | 6 | 7 | 8 | 9 | 10 | 11 | 12 | 13 | |
|---|---|---|---|---|---|---|---|---|---|---|---|---|---|
| 1 | - | 0.035 | −0.002 | −0.108 | 0.069 | 0.160 | −0.037 | −0.072 | −0.040 | 0.064 | −0.040 | 0.645 | −0.026 |
| 2 | 0.035 | - | 0.170 | 0.063 | 0.225 | 0.037 | −0.343 | 0.241 | 0.052 | 0.229 | −0.289 | −0.041 | −0.013 |
| 3 | −0.002 | 0.170 | - | 0.048 | 0.222 | 0.099 | 0.054 | 0.123 | −0.215 | 0.425 | −0.187 | −0.070 | −0.103 |
| 4 | −0.108 | 0.063 | 0.048 | - | −0.075 | −0.159 | −0.158 | −0.212 | 0.099 | 0.030 | 0.005 | −0.091 | 0.118 |
| 5 | 0.069 | 0.225 | 0.222 | −0.075 | - | −0.021 | −0.091 | −0.040 | −0.439 | 0.218 | −0.327 | −0.079 | −0.336 |
| 6 | 0.160 | 0.037 | 0.099 | −0.159 | −0.021 | − | −0.107 | −0.318 | 0.167 | −0.177 | −0.001 | 0.156 | −0.173 |
| 7 | −0.037 | −0.343 | 0.054 | −0.158 | −0.091 | −0.107 | - | 0.041 | −0.093 | 0.227 | 0.128 | 0.092 | 0.022 |
| 8 | −0.072 | 0.241 | 0.123 | −0.212 | −0.040 | −0.318 | 0.041 | − | −0.067 | 0.092 | −0.090 | −0.062 | 0.014 |
| 9 | −0.040 | 0.052 | −0.215 | 0.099 | −0.439 | 0.167 | −0.093 | −0.067 | − | −0.074 | 0.094 | −0.046 | 0.037 |
| 10 | 0.064 | 0.229 | 0.425 | 0.030 | 0.218 | −0.177 | 0.227 | 0.092 | −0.074 | - | −0.055 | 0.043 | −0.002 |
| 11 | −0.040 | −0.289 | −0.187 | 0.005 | −0.327 | −0.001 | 0.128 | −0.090 | 0.094 | −0.055 | - | 0.057 | −0.454 |
| 12 | 0.645 | −0.041 | −0.070 | −0.091 | −0.079 | 0.156 | 0.092 | −0.062 | −0.046 | 0.043 | 0.057 | - | −0.131 |
| 13 | −0.026 | −0.013 | −0.103 | 0.118 | −0.336 | −0.173 | 0.022 | 0.014 | 0.037 | −0.002 | −0.454 | −0.131 | - |
References
- Suanpang, P.; Petocz, P.; Reid, A. Relationship between learning outcomes and online accesses. Australas. J. Educ. Technol. 2004, 20, 9–20. [Google Scholar] [CrossRef] [Green Version]
- Martell, K. Assessing Student Learning: Are Business Schools Making the Grade? J. Educ. Bus. 2007, 82, 189–195. [Google Scholar] [CrossRef]
- Sebastianelli, R. Multiple student learning objectives in basic business statistics: Strategies, assessment, and recommendations. J. Educ. Bus. 2018, 93, 341–352. [Google Scholar] [CrossRef]
- Gal, I.; Garfield, J.B. Assessment Challenge in Statistics Education; IOS Press: Amsterdam, The Netherlands, 1997. [Google Scholar]
- Reilly, D.; Neumann, D.L.; Andrews, G. Investigating Gender Differences in Mathematics and Science: Results from the 2011 Trends in Mathematics and Science Survey. Res. Sci. Educ. 2017, 49, 25–50. [Google Scholar] [CrossRef]
- Worthington, A.; Higgs, H. Factors explaining the choice of an economics major. Int. J. Soc. Econ. 2004, 31, 593–613. [Google Scholar] [CrossRef] [Green Version]
- Griffith, J.D.; Adams, L.T.; Gu, L.L.; Hart, C.L.; Nichols-Whitehead, P. Students’ attitudes toward statistics across the disciplines. A mixed-methods approach. Stat. Educ. Res. J. 2012, 11, 45–56. [Google Scholar]
- Johnson, M.; Robson, D.; Taengnoi, S. A Meta-analysis of the Gender Gap in Performance in Collegiate Economics Courses. Rev. Soc. Econ. 2014, 72, 436–459. [Google Scholar] [CrossRef]
- Opstad, L.; Årethun, T. Factors that explain undergraduate business students’ performance in their chosen field. Does gender matter? Glob. Conf. Bus. Financ. Proc. 2020, 15, 2–21. [Google Scholar]
- Pritchard, R.E.; Potter, G.C.; Saccucci, M.S. The Selection of a Business Major: Elements Influencing Student Choice and Implications for Outcomes Assessment. J. Educ. Bus. 2004, 79, 152–156. [Google Scholar] [CrossRef]
- Opstad, L.; Årethun, T. Attitude towards mathematics among economics and business students in Norway. Is there any gender difference? In Proceedings of the 16th International Conference on Enterprises, Systems, Accounting, Logistics and Management (16th ICESALM 2019), Chania, Greece, 1–3 July 2019. [Google Scholar]
- Chiesi, F.; Primi, C. Gender differences in attitudes toward statistics: Is there a case for a confidencgap? In Proceedings of the 9th Conference of the European Society for Research in Mathematics Education (CERME9), Prague, Czech Republic, 4–8 February 2015; Krainer, K., Vondrova, N., Eds.; Charles University: Prague, Czech Republic, 2015. [Google Scholar]
- Stoet, G.; Geary, D.C. The Gender-Equality Paradox in Science, Technology, Engineering, and Mathematics Education. Psychol. Sci. 2018, 29, 581–593. [Google Scholar] [CrossRef] [Green Version]
- Opstad, L. Success in business studies and mathematical background: The case of Norway. J. Appl. Res. High. Educ. 2018, 10, 399–408. [Google Scholar] [CrossRef] [Green Version]
- Primi, C.; Bacherini, A.; Beccari, C.; Donati, M.A. Assessing math attitude through the Attitude Toward Mathematics Inventory – Short form in introductory statistics course students. Stud. Educ. Eval. 2020, 64, 100838. [Google Scholar] [CrossRef]
- Salazar, L.R. Examining the Relationship between Math Self-Efficacy and Statistics Motivation in the Introductory Business Statistics Course: Self-Compassion as a Mediator. Decis. Sci. J. Innov. Educ. 2018, 16, 140–160. [Google Scholar] [CrossRef]
- Peters, P.; Smith, A.; Middledorp, J.; Karpin, A.; Sin, S.; Kilgore, A. Learning essential terms and concepts in Statistics and Accounting. High. Educ. Res. Dev. 2013, 33, 742–756. [Google Scholar] [CrossRef]
- Vecchione, M.; Alessandri, G.; Barbaranelli, C.; Caprara, G. Gender differences in the Big Five personality development: A longitudinal investigation from late adolescence to emerging adulthood. Personal. Individ. Differ. 2012, 53, 740–746. [Google Scholar] [CrossRef]
- Parker, R.S.; Pettijohn, C.E.; Keillor, B.D. The Nature and Role of Statistics in the Business School Curriculum. J. Educ. Bus. 1999, 75, 51–54. [Google Scholar] [CrossRef]
- Einbinder, S.D. Reducing Research Anxiety among MSW Students. J. Teach. Soc. Work 2014, 34, 2–16. [Google Scholar] [CrossRef]
- Nilsson, J.; Hauff, J.C. Reducing statistics anxiety using limited teaching resources. J. Int. Educ. Bus. 2018, 11, 312–323. [Google Scholar] [CrossRef]
- Ramirez, C.; Schau, C.; Emmioglu, E. The importance of attitudes in statistics education. Stat. Educ. Res. J. 2012, 11, 57–71. [Google Scholar]
- Schau, C.; Stevens, J.; Dauphinee, T.L.; Del Vecchio, A. The Development and Validation of the Survey of Antitudes toward Statistics. Educ. Psychol. Meas. 1995, 55, 868–875. [Google Scholar] [CrossRef]
- Persson, I.; Kraus, K.; Hansson, L.; Wallentin, F.Y. Confirming the structure of the survey of attitudes toward statistics (SATS-36) by Swedish Students. Stat. Educ. Res. J. 2019, 18, 83–93. [Google Scholar]
- Smith, T. Gamified Modules for an Introductory Statistics Course and Their Impact on Attitudes and Learning. Simul. Gaming 2017, 48, 832–854. [Google Scholar] [CrossRef]
- Vanhoof, S.; Sotos, A.E.C.; Onghena, P.; Verschaffel, L.; Van Dooren, W.; Noortgate, W.V.D. Attitudes Toward Statistics and Their Relationship with Short- and Long-Term Exam Results. J. Stat. Educ. 2006, 14, 35–51. [Google Scholar] [CrossRef] [Green Version]
- Hommik, C.; Luik, P. Adapting the Survey of Attitudes towards Statistics (SATS-36) for Estonian Secondary School Students. Stat. Educ. Res. J. 2017, 16, 228–239. [Google Scholar]
- Rejón-Guardia, F.; Vich-I-Martorell, G.A.; Juaneda, C.; Cladera, M. Genfder differenced in attitudes towards statistics in social science degrees. In EDULEARN19 Proceedings; IATED: Palma, Mallorca, Spain, 2019; pp. 2933–2941. [Google Scholar]
- Hannigan, A.; Hegarty, A.; Mc Grath, D. Attitudes towards statistics of graduate entry medical students: The role of prior learning experiences. BMC Med. Educ. 2014, 14, 70. [Google Scholar] [CrossRef] [PubMed] [Green Version]
- Fullerton, J.A.; Umphrey, D. An Analysis of Attitudes toward Statistics: Gender Differences among Advertising Majors; Annual Meeting of the Association for Education in Journalism and Mass Communication; AEJMC: Washington, DC, USA, 2001; ERIC Document Reproduction Service No. ED456479. [Google Scholar]
- Auzmendi, E. Factors related to statistics: A study with a Spanish sample. In Proceedings of the annual meeting of the American Educational Research Association, Chicago, IL, USA, 3–7 April 1991. [Google Scholar]
- Tempelaar, D.; Nijhuis, J. Commonalities in attitudes and beliefs toward different academic subjects. Chall. Educ. People Lead Challenging World 2007, 10, 225–249. [Google Scholar] [CrossRef]
- Sarikaya, E.E.; Ok, A.; Aydin, Y.C.; Schau, C. Turkish version of the Survey of Attitudes toward Statistics: Factorial Structure Invariance by Gender. Int. J. High. Educ. 2018, 7, 121. [Google Scholar]
- Wisenbaker, J.M.; Scott, J.S. Modeling aspects of students’ attitudes and achievement in introductory statistics courses. In Proceedings of the Annual Meeting of the American Educational Research Association, Chicago, IL, USA, 24–28 March 1997. [Google Scholar]
- Mahmud, Z.; Zainol, M.S. Examining postgraduate students’ perceived competency in statistical data analysis and their attitudes toward statistics. Int. J. Edu. Inf. Technol. 2008, 2, 1, 79–86. [Google Scholar]
- Carmona, J. Mathematical background and attitudes toward statistics in a sample of undergraduate students. Psychol. Rep. 2005, 97, 53–62. [Google Scholar] [CrossRef]
- Costa, P.T., Jr.; McCrae, R.R. Revised NEO Personality Inventory (NEO-PI-R); Sage Publications, Inc.: New York, NY, USA, 2008. [Google Scholar]
- O’Connor, M.C.; Paunonen, S.V. Big Five personality predictors of post-secondary academic performance. Personal. Individ. Differ. 2007, 43, 971–990. [Google Scholar] [CrossRef]
- Schmitt, D.P.; Realo, A.; Voracek, M.; Allik, J. Why can’t a man be more like a woman? Sex differences in Big Five personality traits across 55 cultures. J. Personal. Soc. Psychol. 2008, 94, 168–182. [Google Scholar] [CrossRef] [PubMed]
- Costa, P.T.; Terracciano, A.; McCrae, R.R.; Paul, J.C. Gender differences in personality traits across cultures: Robust and surprising findings. J. Personal. Soc. Psychol. 2001, 81, 322–331. [Google Scholar] [CrossRef] [PubMed]
- Feingold, A. Gender differences in personality: A meta-analysis. Psychol. Bullutin 1994, 116, 429–456. [Google Scholar] [CrossRef]
- Weisberg, Y.J.; Deyoung, C.G.; Hirsh, J.B. Gender Differences in Personality across the Ten Aspects of the Big Five. Front. Psychol. 2011, 2, 178. [Google Scholar] [CrossRef] [Green Version]
- Chapman, B.P.; Duberstein, P.; Sörensen, S.; Lyness, J.M. Gender differences in Five Factor Model personality traits in an elderly cohort. Personal. Individ. Differ. 2007, 43, 1594–1603. [Google Scholar] [CrossRef] [Green Version]
- Baloğlu, M. The relationship between statistics anxiety and attitudes toward statistics. Ankara Üniversitesi Eğitim Bilimleri Fakültesi Dergisi 2007, 40, 23–39. [Google Scholar] [CrossRef]
- Sin, Y.C.; Rosli, R. Validity and reliability of the survey of attitudes toward statistics (SATS) instrument (Kesahan dan Kebolehpercayaan Instrumen Survey of Attitudes Toward Statistics (SATS). J. Pendidik. Malays. 2020, 45, 17–24. [Google Scholar]
- Engvik, H.; Clausen, S.E. Norsk kortversjon av Big Five inventory (BFI-20). Tidsskr. Norsk Psykologforening 2011, 48, 869–872. (In Norwegian) [Google Scholar]
- Kane, L.; Ashbaugh, A.R. Simple and parallel mediation: {A} tutorial exploring anxiety sensitivity, sensation seeking, and gender. Quant. Methods Psychol. 2017, 13, 148–165. [Google Scholar] [CrossRef]
- Park, H.; Oh, H.; Boo, S. The Role of Occupational Stress in the Association between Emotional Labor and Mental Health: A Moderated Mediation Model. Sustainability 2019, 11, 1886. [Google Scholar] [CrossRef] [Green Version]
- Baldry, A.C. The impact of direct and indirect bullying on the mental and physical health of Italian youngsters. Aggress. Behav. 2004, 30, 343–355. [Google Scholar] [CrossRef]
- Shi, J.; Wu, C.; Qian, X. The Effects of Multiple Factors on Elderly Pedestrians’ Speed Perception and Stopping Distance Estimation of Approaching Vehicles. Sustainability 2020, 12, 5308. [Google Scholar] [CrossRef]
- Dai, Y.; Byun, G.; Ding, F. The Direct and Indirect Impact of Gender Diversity in New Venture Teams on Innovation Performance. Entrep. Theory Pract. 2018, 43, 505–528. [Google Scholar] [CrossRef]
- Noser, T.C.; Tanner, J.R.; Shah, S. Have Basic Mathematical Skills Grown Obsolete In The Computer Age: Assessing Basic Mathematical Skills And Forecasting Performance In A Business Statistics Course. J. Coll. Teach. Learn. 2008, 5, 1–6. [Google Scholar] [CrossRef]
- Chamorro-Premuzic, T.; Furnham, A. Personality predicts academic performance: Evidence from two longitudinal university samples. J. Res. Personal. 2003, 37, 319–338. [Google Scholar] [CrossRef]
- Furnham, A.; Chamorro-Premuzic, T. Personality and intelligence as predictors of statistics examination grades. Personal. Individ. Differ. 2004, 37, 943–955. [Google Scholar] [CrossRef]
- Mustam, A.A.; Adnan, M.; Johnny, J.; Setambah, M.A.B. Attitude towards statistics among pre-service teachers of institute of teacher education. J. Phys. Conf. Ser. 2020, 1521, 032011. [Google Scholar] [CrossRef]
- Parnis, A.J.; Petocz, P. Secondary school students’ attitudes towards numeracy: An Australian investigation based on the National Assessment Program—Literacy and Numeracy (NAPLAN). Aust. Educ. Res. 2016, 43, 551–566. [Google Scholar] [CrossRef]
- Walker, E.R.; Brakke, K.E. Undergraduate psychology students’ efficacy and attitudes across introductory and advanced statistics courses. Scholarsh. Teach. Learn. Psychol. 2017, 3, 132–140. [Google Scholar] [CrossRef]

| Trait | Definition |
|---|---|
| Openness to experience | People who have fantasies are open to new experiences and ideas. Example item: I have a lively imagination |
| Conscientiousness | Conscientious people have these personal characteristics: organized, responsible, self-disciplined, effective, and/or goal oriented. Example item: I am always prepared. |
| Extraversion | Extraverts are social and oriented toward the outer world Example item: I am interested in people. |
| Agreeableness | Agreeable people act cooperatively, show trust, and have unselfish manners. Example item: I like to cooperate with others. |
| Neuroticism (inverse of emotional stability) | Neurotic people tend to be emotionally unstable, often have anxiety and/or are depressed. Example item: I get nervous easily. |
| a. Data from the Big Five Model, Personal Traits (N = 130). | ||||
| Factor | Mean | Min | Max | Std. Deviation |
| Agreeableness | 3.91 | 225 | 5.0 | 0.57 |
| Conscientiousness | 3.67 | 1.50 | 5.0 | 0.70 |
| Extraversion | 3.64 | 1.75 | 5.0 | 0.78 |
| Openness | 3.33 | 1.50 | 5.0 | 0.73 |
| Neuroticism | 2.70 | 1.0 | 4.50 | 0.79 |
| b. Data from Attitudes Toward Statistics (N = 139, 1 year, 2019). | ||||
| Factor | Mean | Min | Max | SD * |
| Affect | 4.60 | 1.0 | 7.0 | 1.25 |
| Value | 4.45 | 1.33 | 6.67 | 1.00 |
| Difficulty (find statistics easy) | 3.52 | 1.14 | 5.29 | 0.75 |
| Interest | 4.51 | 1.0 | 7.0 | 1.29 |
| Cognitive Competence | 5.19 | 1.83 | 7.0 | 1.08 |
| Effort | 5.67 | 1.50 | 7.0 | 1.09 |
| c. Mathematics Skills. The business students’ choice of mathematical pathway at the Secondary-Upper School (N = 129). | ||||
| Mathematics | Women | Men | All | |
| Practical mathematics (P-maths) | 13 (59.1%) | 9 (40.9%) | 22(100%) | |
| Mathematics for business and social science (S-maths) | 35 (53.8%) | 30 (46.5%) | 65 (100%) | |
| Mathematics for natural science (N-maths) | 14 (36.8%) | 24 (63.2%) | 38 (100%) | |
| Others | 4 (100%) | 0 (0%) | 4 (100%) | |
| All | 66(51.4%) | 63 (48.6%) | 129 (100%) | |
| a. Independent Sample t-Test, Big Five, Personal Traits (Assume Equal Variance). | |||||
| Factor | Women | Men | Difference | t-Value | Significance Level (2-tailed) |
| Agreeableness | 4.00 | 3.81 | 0.19 (0.10) | 1.91 | 0.058 |
| Conscientiousness | 3.79 | 3.59 | 0.20 (0.10) | 1.71 | 0.09 |
| Extraversion | 3.64 | 3.62 | 0.02 (0.14) | 0.064 | 0.95 |
| Openness | 3.30 | 3.36 | −0.06 (0.13) | −0.44 | 0.66 |
| Neuroticism | 3.05 | 2.33 | 0.72 (0.12) | 5.81 | 0.000 |
| b. Independent Sample t-Test, Gender and Attitudes Towards Statistics (Assume Equal Variance). | |||||
| Factor | Women | Men | Difference | t-Value | Significance Level (2-tailed) |
| Affect | 4.43 | 4.81 | −0.39 (0.22) | −1.76 | 0.081 |
| Value | 4.22 | 4.70 | −0.49 (0.17) | −2.83 | 0.005 |
| Difficulty (find statistics easy) | 3.32 | 3.75 | −0.43 (0.13) | −3.32 | 0.001 |
| Interest | 4.19 | 4.87 | −0.67 (0.22) | −3.10 | 0.002 |
| Cognitive Competence | 5.05 | 5.38 | −0.33 (0.19) | −1.73 | 0.086 |
| Effort | 5.97 | 5.38 | 0.59 (0.19) | 3.16 | 0.0028 |
| a. Results of the Regression Model: Attitudes towards Statistics. (Unstandardized Coefficients, β). | ||||||||
| Affect | Value | Difficulty (Easy) | Cognitive Competence | |||||
| Coefficient β | Significance Level | Coefficient β | Significance Level | Coefficient β | Significance Level | Coefficient β | Significance Level | |
| Step 1 | ||||||||
| Constant | 4.41 | 4.22 | 3.32 | 5.04 | ||||
| Gender | 0.41 (0.22) | 0.066 | 0.49 | 0.005 | 0.43 (0.13) | 0.001 | 0.34 (0.19) | 0.074 |
| N = 127 Adj. R2 = 0.019 | N = 127 Adj. R2 = 0.052 | N = 127 Adj. R2 = 0.073 | N = 127 Adj. R2 = 0.017 | |||||
| Step 2 | ||||||||
| Constant | 5.01 | 4.05 | 4.00 | 6.45 | ||||
| Gender | 0.15 (0.25) | 0.58 | 0.40 (0.20) | 0.045 | 0.36 (0.15) | 0.019 | 0.059 (0.21) | 0.29 |
| Agreeableness | −0.08 (0.20) | 0.78 | −0.17 (0.16) | 0.30 | −0.16 (0.12) | 0.20 | −0.28 (0.17) | 0.10 |
| Conscientiousness | 0.40 (0.17) | 0.022 | 0.32 (0.14) | 0.021 | 0.11 (0.10) | 0.30 | 0.40 (0.14) | 0.006 |
| Extraversion | 0.042 (0,15) | 0.78 | −0.08 (0.12) | 0.50 | 0.10 (0.09) | 0.29 | 0.071 (0.13) | 0.58 |
| Openness | −0.19 (0.17) | 0.26 | 0.12 (0.14) | 0.38 | −0.15 (0.10) | 0.13 | −0.22 (0.14) | 0.12 |
| Neuroticism | −0.45 (0.17) | 0.009 | −0.16 (0.14) | 0.25 | −0.10 (0.10) | −0.44 (0.14) | 0.002 | |
| N = 127 Adj. R2 = 0.094 | N = 127 Adj. R2 = 0.073 | N = 127 Adj. R2 = 0.081 | N = 127 Adj. R2 = 0.137 | |||||
| Step 3 | ||||||||
| Constant | 4.76 | 3.80 | 3.82 | 6.32 | ||||
| Gender | 0.056 (0.24) | 0.82 | 0.34 (0.20) | 0.089 | 0.32 (0.15) | 0.035 | 0.002 (0.20) | 0.99 |
| N-maths | 0.67 (0.31) | 0.03 | 0.51 (0.25) | 0.044 | 0.32 (0.19) | 0.097 | 0.36 (0.26) | 0.17 |
| S -maths | −0.12 (027) | 0.66 | −0.04 (0.22) | 0.87 | 0.07 (0.17) | 0.68 | −0.20 (0.23) | 0.39 |
| Agreeableness | −0.07 (0.19) | 0.72 | −0.16 (0.16) | 0.30 | −0.16 (012) | 0.19 | −0.26 (0.16) | 0.11 |
| Conscientiousness | 0.37 (0.17) | 0.03 | 0.30 (0.16) | 0.028 | 0.10 (0.10) | 0.35 | 0.38 (0.14) | 0.008 |
| Extraversion | 0.11 (0.15) | 0.45 | −0.04 (0.12) | 0.78 | 0.12 (0.09) | 0.19 | 0.12 (0.16) | 0.77 |
| Openness | −0.21 (0.16) | 0.19 | 0.10 (0.13) | 0.44 | −0.16 (0.10) | 0.12 | −0.26 (0.14) | 0.087 |
| Neuroticism | −0.41 (0.16) | 0.01 | −0.13 (0.13) | 0.35 | −0.08 (0.10) | 0.42 | −0.42 (0.14) | 0.003 |
| N = 127 Adj. R2 = 0.16 | N = 127 Adj. R2 = 0.12 | N = 127 Adj. R2 = 0.09 | N = 127 Adj. R2 = 0.18 | |||||
| b. Results of the Regression Model: Attitudes towards Statistics. (Unstandardized Coefficients β). | ||||||||
| Dependent Variable | ||||||||
| Effort | Interest | |||||||
| Coefficient β | Significance Level | Coefficient β | Significance Level | |||||
| Step 1 | ||||||||
| Constant | 5.97 | 4.17 | ||||||
| Gender | −0.59 (0.19) | 0.002 | 0.70 | 0.002 | ||||
| N = 127 Adj. R2 = 0.066 | N = 127 Adj. R2 = 0.117 | |||||||
| Step 2 | ||||||||
| Constant | 1.66 | 2.71 | ||||||
| Gender | −0.24 (0.20) | 0.23 | 0.61 (0.25) | 0.015 | ||||
| Agreeableness | 0.25 (0.16) | 0.13 | −0.11 (020) | 0.59 | ||||
| Conscientiousness | 0.55 (0.14) | 0.00 | 0.44 (0.17) | 0.011 | ||||
| Extraversion | 0.11 (0.12) | 0.39 | −0.18 (0.15) | 0.23 | ||||
| Openness | 0.006 (0.14) | 0.96 | 0.42 (0.17) | 0.014 | ||||
| Neuroticism | 0.27 (0.14) | 0.052 | −0.15 (0.17) | 0.36 | ||||
| N = 127 Adj. R2 = 0.22 | N = 127 Adj. R2 = 0.094 | |||||||
| Step 3 | ||||||||
| Constant | 1.93 | 2.53 | ||||||
| Gender | −0.21 (0.20) | 0.29 | 0.56 (0.25) | 0.025 | ||||
| N-maths | −0.37 (0.26) | 0.15 | 0.35 (0.32) | 0.27 | ||||
| S-maths | −0.42 (0.23) | 0.07 | 0.02 (0.29) | 0.96 | ||||
| Agreeableness | 0.27 (0.16) | 0.09 | −0.11 (0.20) | 0.59 | ||||
| Conscientiousness | 0.56 (0.14) | 0.00 | 0.43 (0.17) | 0.01 | ||||
| Extraversion | 0.11 (0.12) | 0.40 | −0.15 (0.16) | 0.33 | ||||
| Openness | 0.004 (0.14) | 0.98 | 0.41 (0.17) | 0.02 | ||||
| Neuroticism | 0.24 (0.14) | 0.08 | −0.13 (0.17) | 0.43 | ||||
| N = 127 Adj. R2 = 0.27 | N = 127 Adj. R2 = 0.12 | |||||||
| Direct (Step 3 β-Value, Table 4a,b) | Indirect (Difference between Step 1 and 3) | Total (Step 1, β-Value, Table 4a,b) | Significance Level, Change from Direct to Total | |
|---|---|---|---|---|
| Affect | 0.41 | 0.354 | 0.056 | 6.6% to 8.2% |
| Value | 0.49 | 0.15 | 0.34 | 0.5% to 8.9% |
| Difficulty | 0.43 | 0.11 | 0.32 | 0.1% to 3.5% |
| Interest | 0.70 | 0.09 | 0.61 | 0.2% to 1.5% |
| Cognitive Competence | 0.34 | 0.338 | 0.002 | 7.4% to 99.0% |
| Effort | −0.59 | 0.38 | −0.21 | 0.2% to 29.0% |
© 2020 by the author. Licensee MDPI, Basel, Switzerland. This article is an open access article distributed under the terms and conditions of the Creative Commons Attribution (CC BY) license (http://creativecommons.org/licenses/by/4.0/).
Share and Cite
Opstad, L. Attitudes towards Statistics among Business Students: Do Gender, Mathematical Skills and Personal Traits Matter? Sustainability 2020, 12, 6104. https://doi.org/10.3390/su12156104
Opstad L. Attitudes towards Statistics among Business Students: Do Gender, Mathematical Skills and Personal Traits Matter? Sustainability. 2020; 12(15):6104. https://doi.org/10.3390/su12156104
Chicago/Turabian StyleOpstad, Leiv. 2020. "Attitudes towards Statistics among Business Students: Do Gender, Mathematical Skills and Personal Traits Matter?" Sustainability 12, no. 15: 6104. https://doi.org/10.3390/su12156104