Article

Bioresource Utilization of Djulis (Chenopodium formosanum) Biomass as Natural Antioxidants

1
Department of Medicinal Botanical and Health Applications, Da-Yeh University, Changhua 51591, Taiwan
2
College of Life Science and Food Engineering, Huaiyin Institute of Technology, Huaian 223003, China
3
College of Biotechnology and Bioresources, Da-Yeh University, Changhua 51591, Taiwan
4
Department of Food and Beverage Management, Chung-Jen Junior College of Nursing, Health Sciences and Management, Chia-Yi City 60077, Taiwan
5
Department of Biotechnology and Food Technology, Southern Taiwan University of Science and Technology, Tainan City 710, Taiwan
6
Department of Food Science, China University of Science and Technology, Taipei City 115, Taiwan
7
Department of Basic Medical Sciences, Jiangsu College of Nursing, Huaian 223001, China
*
Authors to whom correspondence should be addressed.
Sustainability 2020, 12(15), 5926; https://doi.org/10.3390/su12155926
Submission received: 8 July 2020 / Revised: 16 July 2020 / Accepted: 17 July 2020 / Published: 23 July 2020
(This article belongs to the Collection Food Additives and Sustainability)

Abstract

:
Djulis (Chenopodium formosanum) is a yearly, fast-growing, under-utilized pseudo-cereal with a high proportion of biomass content. We used the hulls, which are usually removed from djulis as crop residue, to evaluate the free-radical scavenging and antioxidant capacity of djulis. We studied the antioxidant capacity of ethanol- and water-extracted hulls and roots by using various in vitro methods. Ascorbic acid was the reference sample. The extract samples were used at 200, 400, 600, 800, and 1000 µg/mL. Total sugar content, total phenolic content, and total flavonoid content were assessed. Antioxidant activity was assessed by using the Trolox equivalent antioxidant capacity, ferric reducing antioxidant power, cupric ion reducing antioxidant capacity, 2,2-diphenyl-1-picrylhydrazyl radical scavenging activity, and N, N-dimethyl-ρ-phenylenediamine. Ethanol- and water-extracted red djulis hulls showed high amounts of total sugar, total phenolic content, total flavonoid content, and antioxidant capacity. Moreover, ethanol- and water-extracted red djulis roots showed moderate antioxidant capacity. However, ethanol- and water-extracted yellow djulis hulls showed limited antioxidant activities. Utilization of the biomass of djulis hulls and roots as natural antioxidant resources may be environmentally friendly and foreseeable.

1. Introduction

Djulis (Chenopodium formosanum Koidz.) has its place in the class Dicotyledoneae, family Amaranthaceae, subfamily Chenopodiaceae, and genus Chenopodium, which includes more than 100 species of perennial and annual herbaceous flowering plants. It is also a pseudo-cereal grain that is native to Taiwan [1,2]. Djulis is typically cultivated in some aboriginal inhabited areas. It has been cultivated by Taiwan’s aborigines for more than 100 years. Djulis is subdivided into two kinds by color: kapulapula (yellow-colored djulis) and odidile (red-colored djulis).
Recently, djulis has attracted many researchers’ interests because of its intense color and its functional and nutritional composition, as well as its bioactive components [3]. Furthermore, in waste utilization, the focus has been on the subsidiary products of djulis to further develop enriched functional commodities [4]. To enhance the sustainability of the food cycle, the valorization of food biomass waste and by-products has become a main concern [5]. Moreover, by-products from the food and agricultural industries, such as hulls and shells of nuts and cereals, citrus peels and seeds, and fish viscera extracts, have been established as having additional use in solving waste problems, reducing environmental impacts, and increasing commercial value [6,7,8,9].
The study by Chen et al. (2019) [10] clarified that gold nanoparticles with djulis shell extract as a reducing and stabilizing agent have a great antibacterial activity against Escherichia coli and Staphylococcus aureus. An extensive study conducted by Huang et al. (2019) [4] summarized that the extraction, detection, identification, and separation of six phytosterols and six triterpenes (unsaponifiable components) of different inbred lines of djulis hulls might contribute to phytosterol and/or triterpene enriched functional food development. Meanwhile, high-pressure-assisted extraction of djulis hulls using 70% ethanol as an extraction solvent revealed higher total phenolic and flavonoid concentrations as compared with conventional oscillation extraction [4]. In brief, the commercial value of djulis hulls and roots could be increased by determining their antioxidant capacity, but we still have limited understanding of the antioxidant activities of hulls and roots of djulis. Total phenol content (TPC) and total flavonoid content (TFC) are among the crucial parameters of total antioxidant capacity and are extensively used for valuation of antioxidant extracts from herbs, spices, plants, and cereals [11]. Hence, the aim of this study was to investigate and compare the antioxidant capacity of red- and yellow-colored C. formosanum (djulis) hulls and roots obtained by different methods including trolox equivalent antioxidant capacity (TEAC), ferric reducing antioxidant power (FRAP), cupric reducing antioxidant capacity (CUPRAC), DPPH radical scavenging activity, and DMPD. We evaluated the total sugar content, TPC, and TFC of ethanol and water extracts of djulis hulls and roots to evaluate their role in free radical scavenging and antioxidant capacity effects.

2. Materials and Methods

2.1. Materials

Fresh grains of djulis (Chenopodium formosanum) were cultivated at a local farm at Pingtung, Taiwan. At the mature stage, the grains of djulis were indiscriminately harvested. All the samples were transferred into transparent low-density polyethylene (LDPE) zipper bags to prevent any external contamination and stored in a cooler box to be transferred back to Dayeh University. All chemicals compounds used in this study were obtained from Sigma-Aldrich Co. (St. Louis, MO, USA), and analytical materials were above 95% purity.

2.2. Sample Preparation

The outer shells of red-colored and yellow-colored djulis (djulis hulls) and roots acted as the research materials. All the samples were oven dried before experimental analysis. After drying, the djulis was crushed by a specially designed shell kernel separator then sieved to separate the djulis ovaries from the outer shells. The djulis ovaries and outer shells were collected separately and dried in an oven at 40 °C. After drying, the djulis shells were grinded into powder form and sieved through a 100 mesh siever. The djulis hull powder and root powder was stored in hermetic zipper plastic packaging bags and placed in a dry box until further analysis. The extractant was prepared by immersing 1 g of djulis hulls and root powder in 100 mL of water at room temperature for 12 h, and solvent was filtered with Whatman filter paper. The filtrate was evaporated under a vacuum drier, and the brown mass residue obtained was stored at −4 °C for further use. The sample used in this study comprised ethanol extracted yellow-colored djulis hulls (YE), water extracted yellow-colored djulis hulls (YW), ethanol extracted red-colored djulis hulls (RE), water extracted red-colored djulis hulls (RW), ethanol extracted djulis roots (ROE), and water extracted djulis roots (ROW).

2.3. Total Sugar Content

The investigation of total sugar content was carried out in triplicate by using the anthrone method, as described by Datir et al. (2019) [12] and Scaramboni et al. (2015) [13] with modifications. Firstly, 40 mg of anthrone (97%) was added to 1.0 mL of ultrapure water and 20 mL of concentrated sulfuric acid (95%) as the anthrone reagent in an icy cold bath. The anthrone reagent was freshly prepared at the time of use under safe conditions. Sugars were extracted from a test tube containing 0.1 g of sample and 5 mL 2.5 N HCl, followed by boiling for 3 h. After cooling down the test tube, the sample solutions were neutralized with sodium carbonate until the effervescences ceased. The final volume was made up to 100 mL with deionized water and was centrifuged at 7000 rpm for 15 min. The assay contained 0.5 mL supernatant, 0.5 mL deionized water, and 4 mL anthrone reagent. Test tubes were boiled for 10 min in boiling water and cooled at room temperature. The absorbance was measured at 630 nm on a UV spectrophotometer. Standard solutions (glucose solution) were prepared at varying concentrations, while the analytical curve (y = 0.1522x −0.17, R2 = 0.99) was constructed prior to the analyses. Total sugar content was expressed as mg GLU g−1 D.W.

2.4. Total Phenolic Content

The total phenolic content was examined by the Folin–Ciocalteu method [14]. Initially, 1 mL of diluted 80% methanol extracts were added to 9 mL distilled water in a 25 mL volumetric flask. Double distilled water (ddH2O) was used as a blank reagent. The 0.5 mL of Folin–Ciocalteu phenol reagent was added into the mixture and shaken vigorously. Then, 5 mL of 5% sodium carbonate (Na2CO3) solution was added, followed by dilutions with distilled water to 25 mL. The solution was then mixed thoroughly and allowed to stand for 60 min. The absorbance was measured at 750 nm versus the blank reagent. Total polyphenol content was calculated by comparing with a standard curve of gallic acid, and results were expressed as milligrams of gallic acid equivalents (GAE) per g dry weight (mg GAE g−1 D.W.).

2.5. Total Flavonoid Content

Total flavonoid content of the sample was determined as described by Wang et al. (2008) [15] with modifications. A total of 2.5 g of sample was allocated in a Soxhlet extractor and refluxed with methanol for 12 h at 85 °C. The extractant was evaporated to dryness by using a rotary evaporator at 35 °C and then dissolved with methanol for the following analysis. One mL of the extractant was added to 0.3 mL of 5% sodium nitrite (NaNO2) in a 10 mL volumetric flask, and the mixture was allowed to stand at room temperature for 6 min. Then, 0.3 mL of 10% aluminum nitrate was added to the mixture and left to stand at room temperature for 6 min. This was followed by addition of 4 mL of 1 N sodium hydroxide (NaOH) and methanol, up to the volume. After incubation for color development at room temperature for 15 min, the absorbance was measured at 510 nm. Total flavonoid content was expressed as quercetin equivalent (mg QE g−1 D.W.).

2.6. Trolox Equivalent Antioxidant Capacity (TEAC)

The TEAC assay was used to measure the antioxidant activities of the sample and was performed fundamentally as described by Arts et al. (2004) [16]. TEAC value analysis was based on the ability of the sample to scavenge the blue-green-colored stable ABTS radicals (ABTS·) in 6 min. Then, 7 mM ABTS and 2.45 mM potassium sulphate in water was used to trigger the blue-green ABTS·production. The prepared solution was stored in the dark before use. The ABTS· solution was diluted with phosphate buffered saline (PBS) at pH 7.4 to the final ABTS· concentration of approximately 47 µm (absorbance of 0.70 ± 0.02 at 734 nm, 37 °C). Trolox stock solution was prepared in ethanol at different concentrations. Ten µL of sample solution was added to 990 µL ABTS· solution, and the absorbance at 734 nm was measured in time. Blank reagent was prepared by adding 10 µL distilled water to 990 µL ABTS· solution. The control sample was prepared by adding 10 µL sample solvent to 990 µL distilled water. The reduction in absorbance measured at 6 min after addition of the sample represented the ABTS·radical cation scavenging capacity and was plotted against the different concentrations of the different samples tested. The total antioxidant capacity (%) was calculated using the following formula:
Total   antioxidant   capacity   ( % ) = ( 1 A   s a m p l e A   c o n t r o l A   b l a n k ) × 100

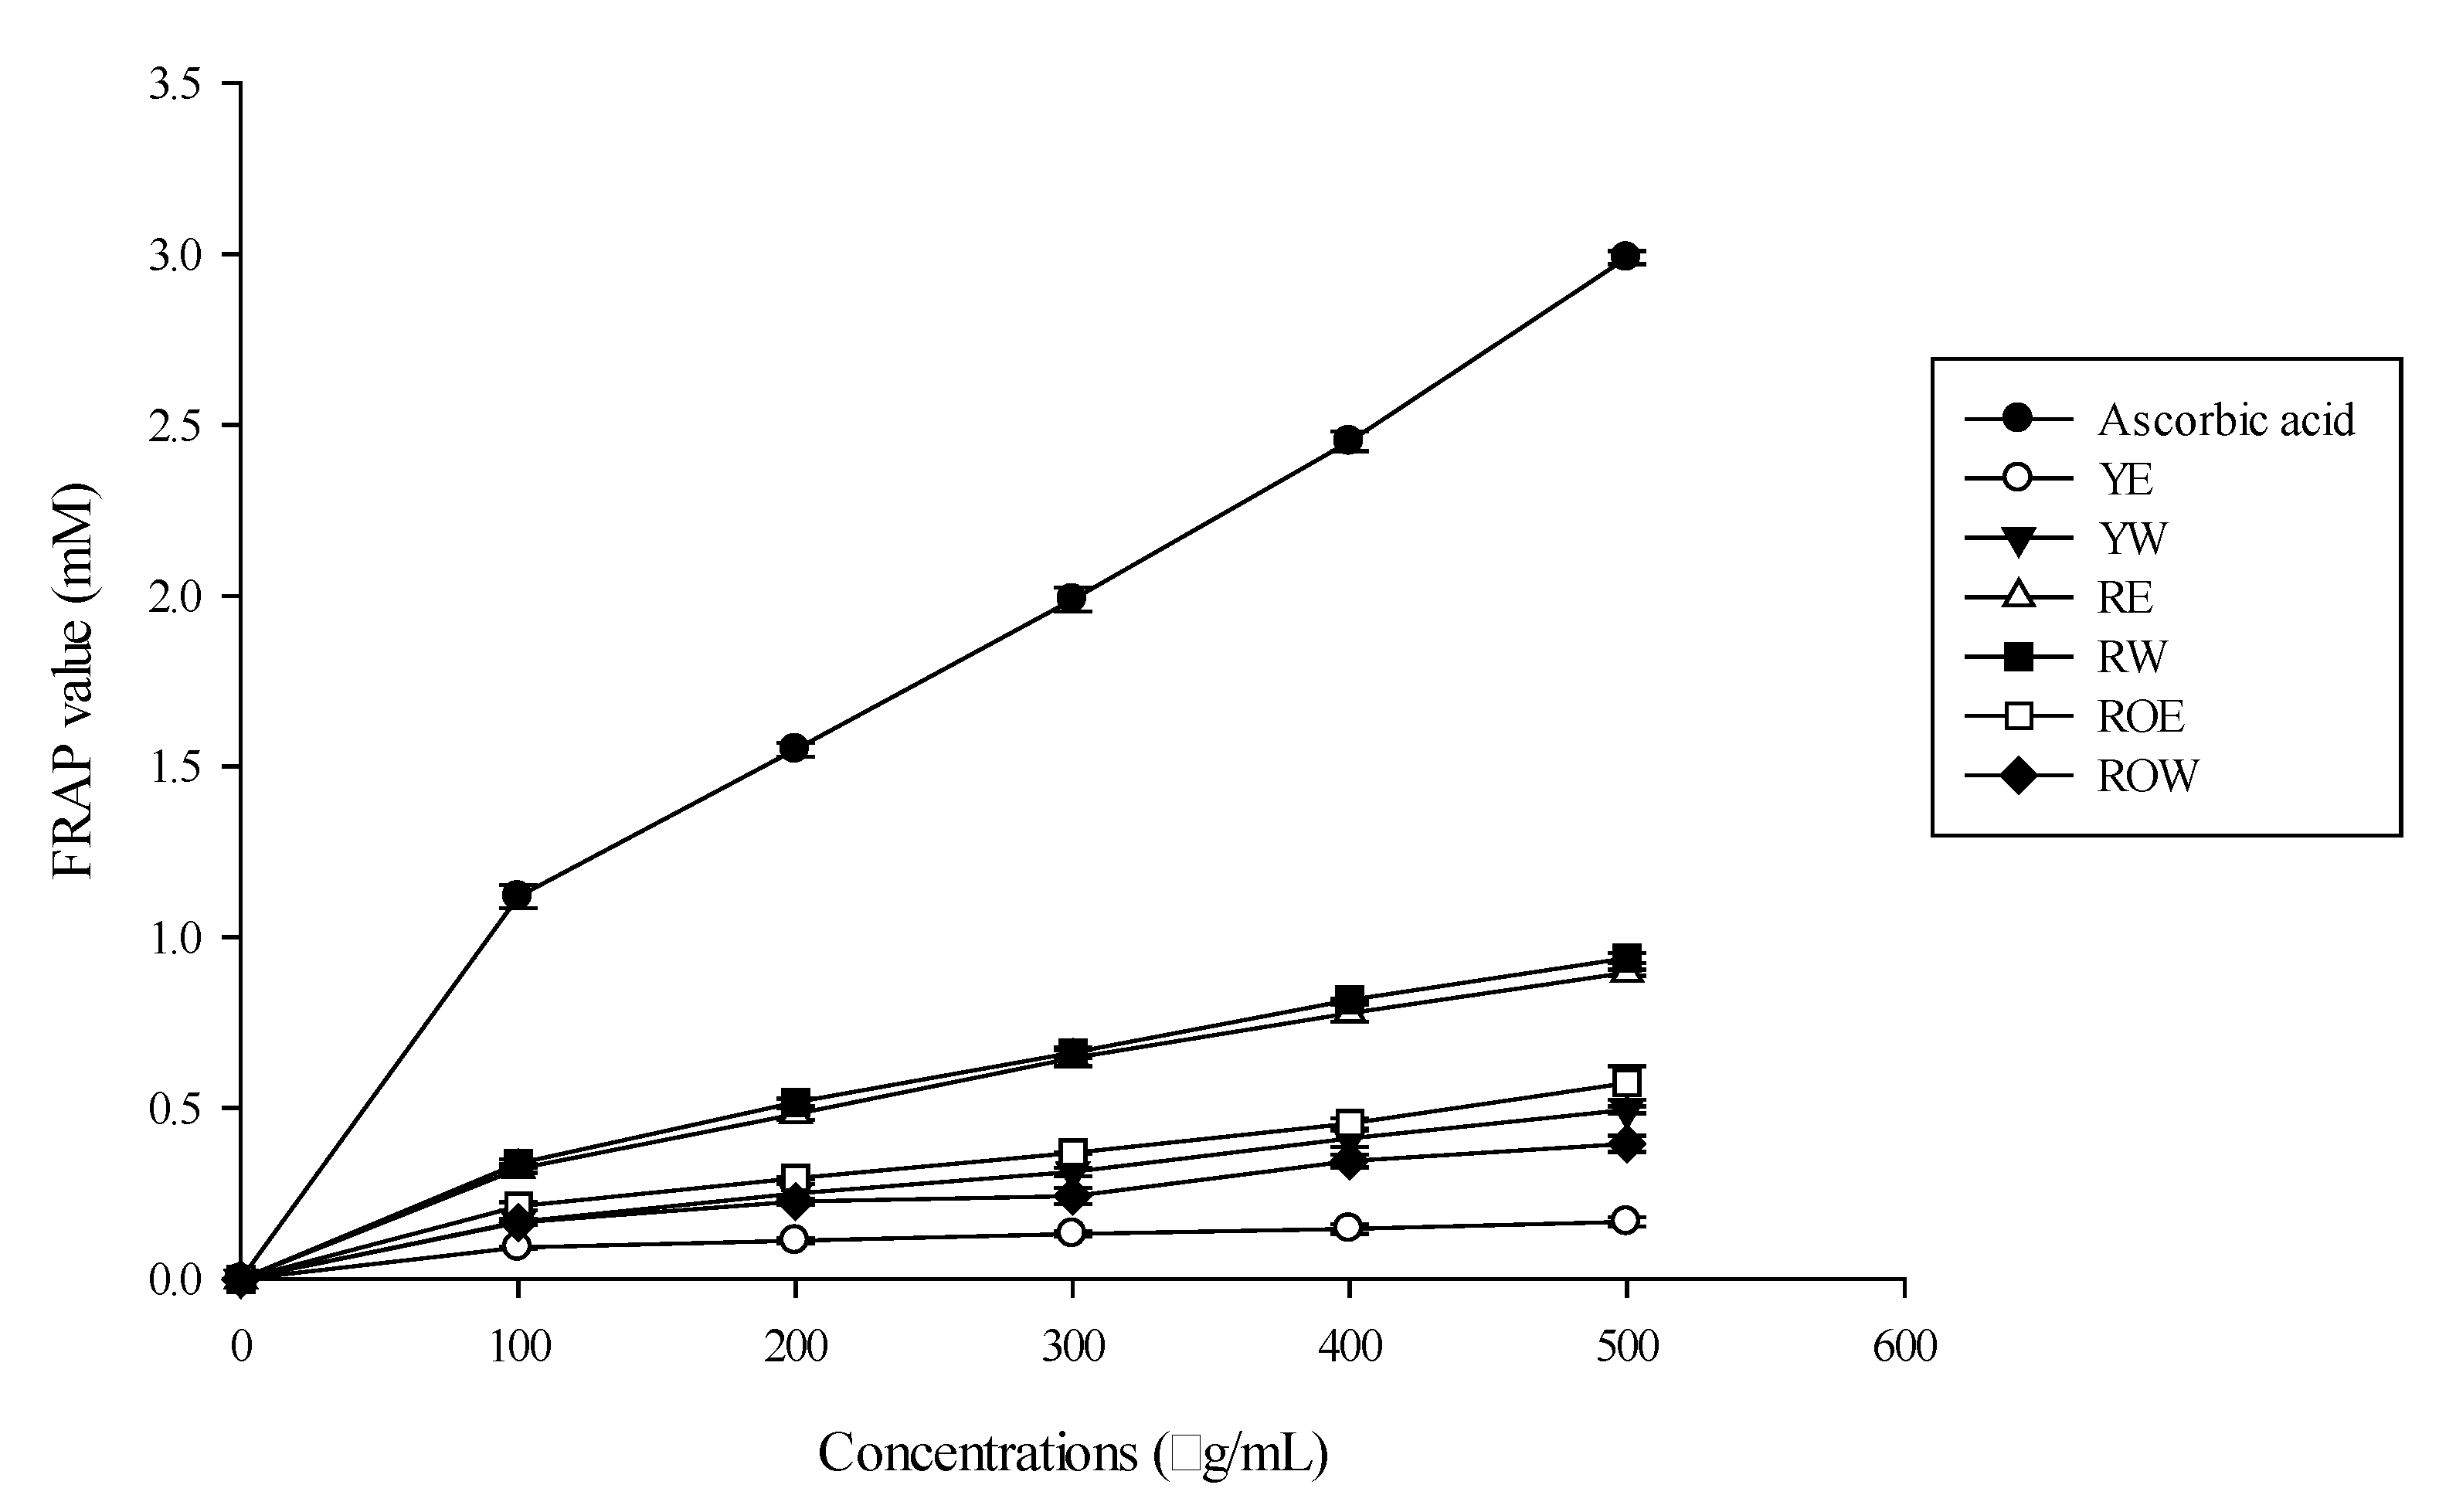
2.7. Ferric Reducing Antioxidant Power (FRAP)

Ferric reducing power of each sample and standard solutions was measured according to a modified protocol by Xu et al. (2008) [14]. A mixture of 0.1 M acetate buffer (pH 3.6), 10 mM TPTZ, and 20 mM ferric acid (10:1:1 v/v/v) was prepared as FRAP reagent. Next, 0.1 mL of extractant sample was added to 1.9 mL of FRAP reagent. The reaction was monitored for 10 min and the absorbance was read at the absorption maximum (593 nm). Ascorbic acid solution was used for the calibration curves. The result was expressed as relative percentage of reducing power.

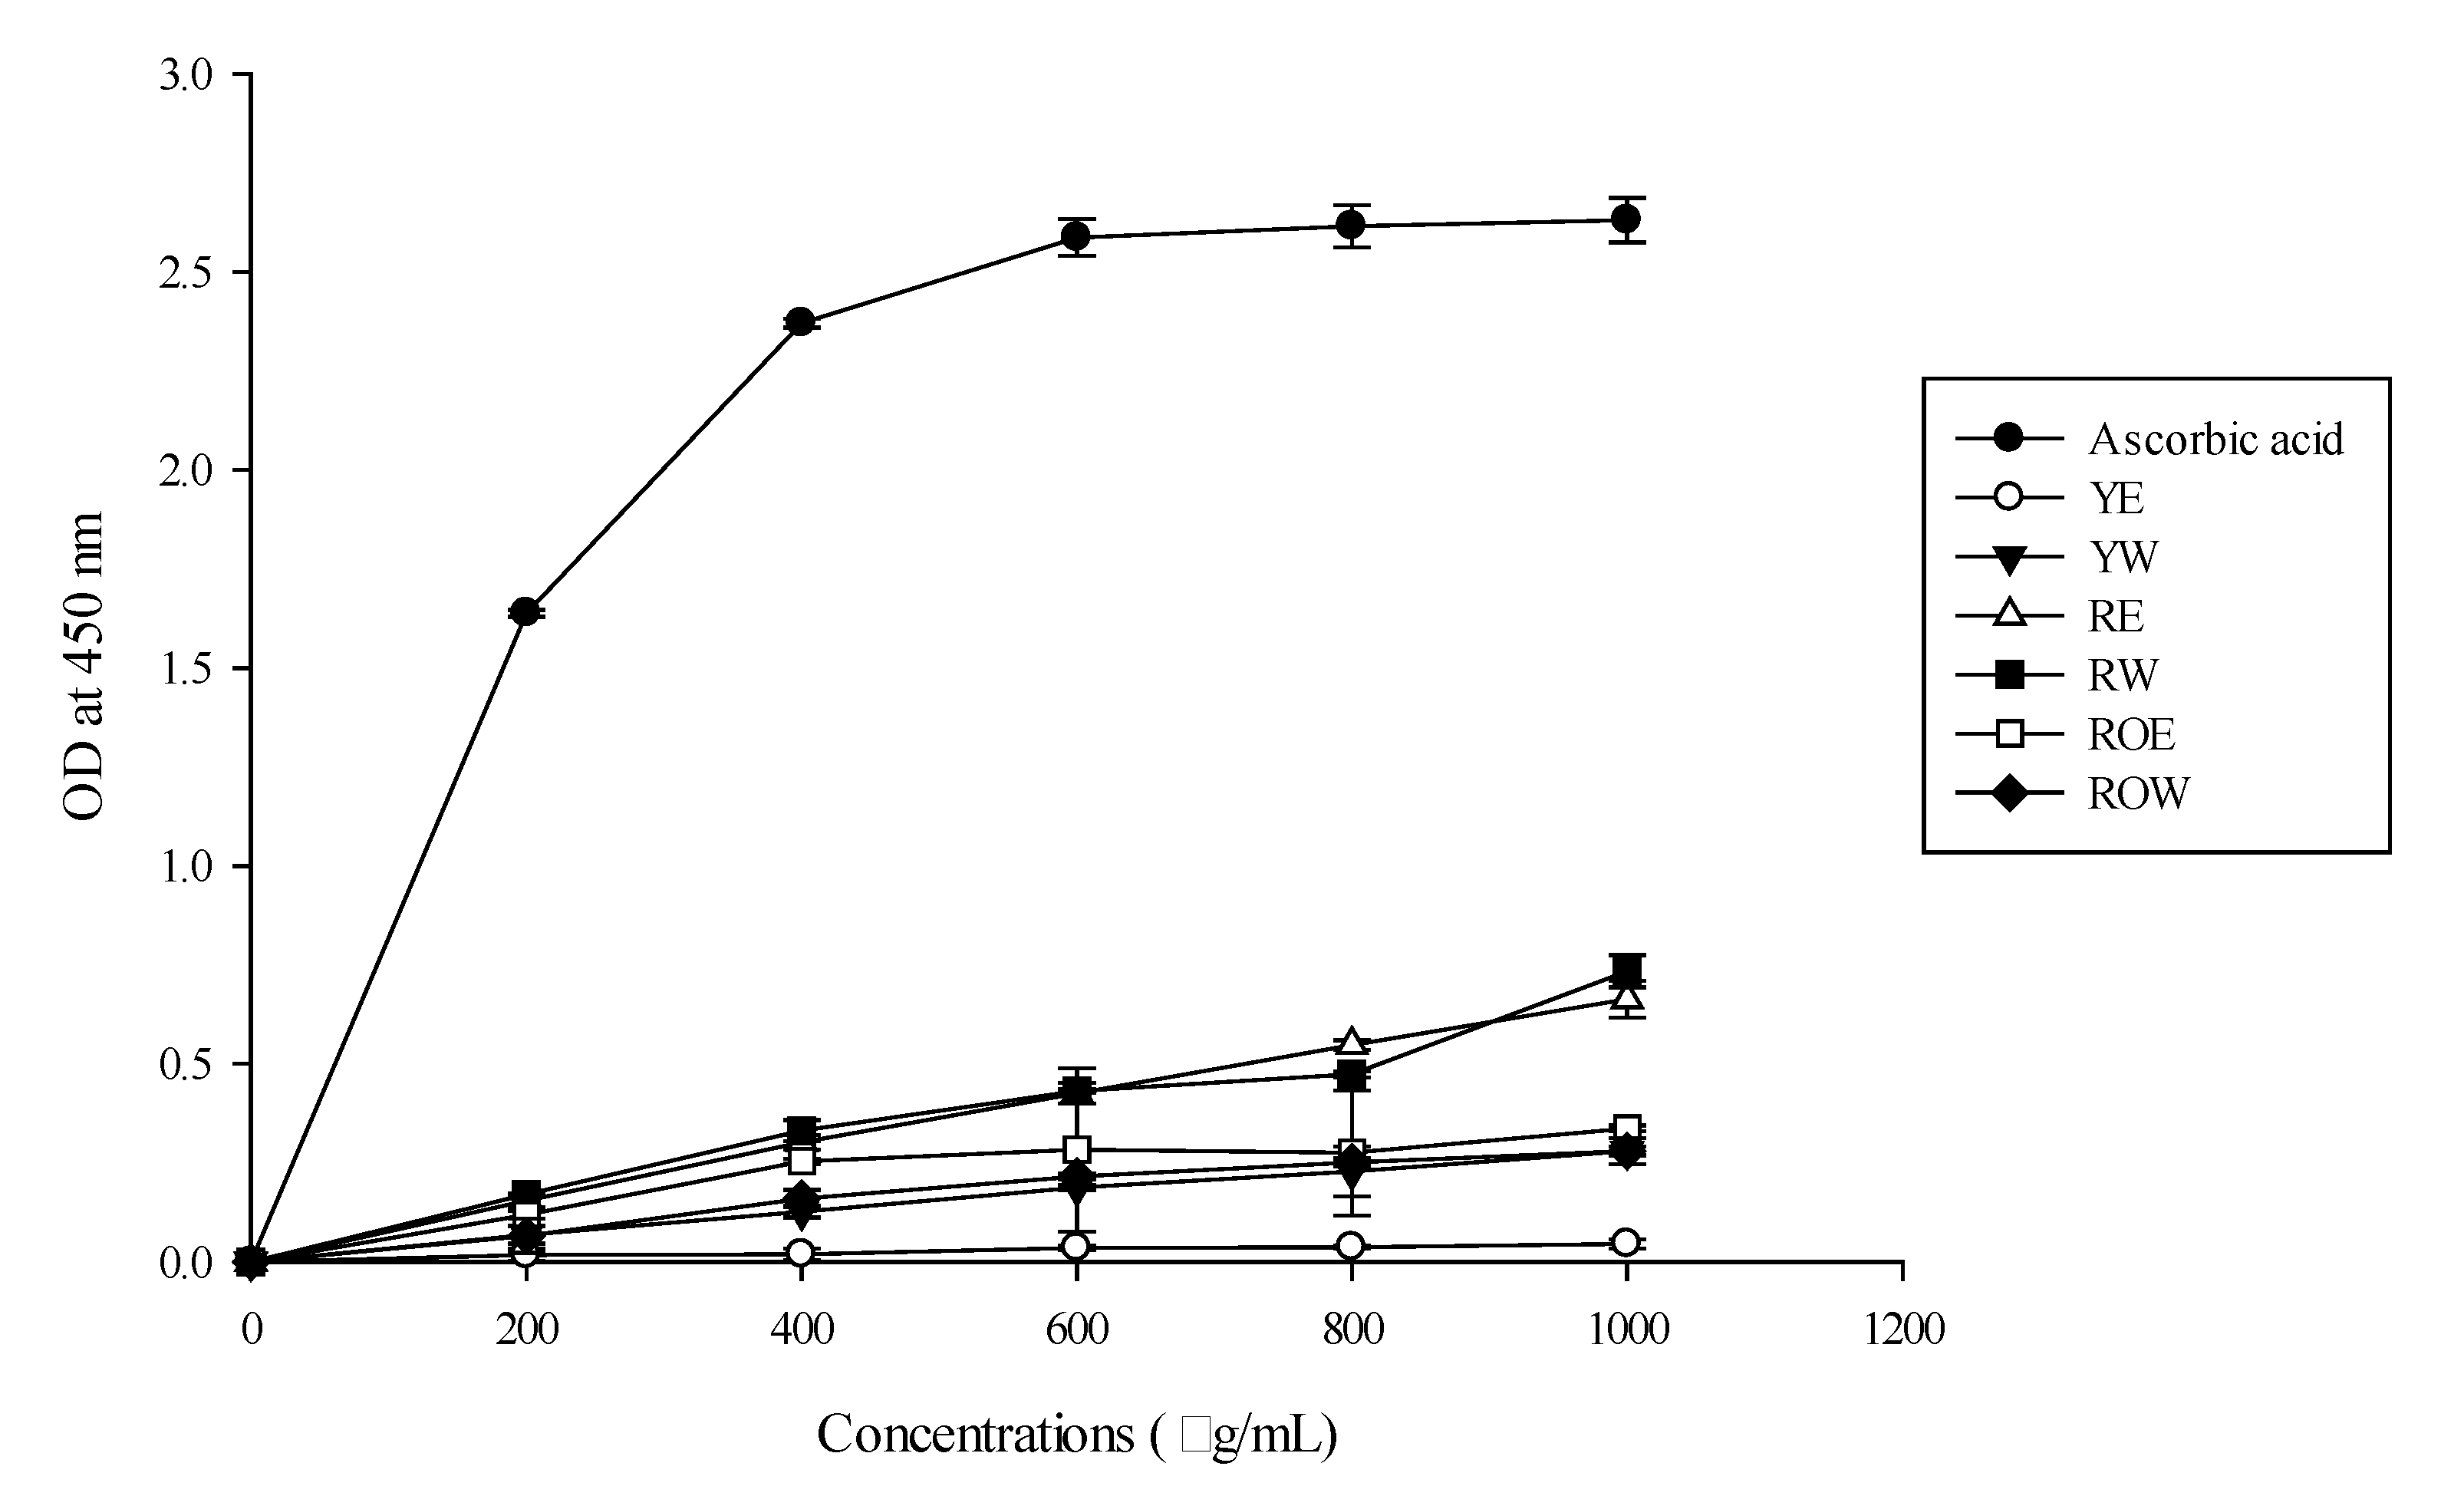
2.8. Cupric Reducing Antioxidant Capacity (CUPRAC)

The CUPRAC assay was performed according to method of Ozdal et al. (2019) [17] with modifications. First, 0.4262 g of copper (II) chloride dihydrate (CuCl2·2H2O) was dissolved in distilled water to 250 mL to prepare the 10-2 mM CuCl2 solution. The 1.0 M ammonium acetate buffer at pH 7.0 was prepared by dissolving 19.27 g ammonium acetate (NH4Ac) in distilled water and diluting to 250 mL. Then, 0.078 g of neocuproine (Nc) was dissolved in 96% ethanol and diluted to 50 mL with ethanol to prepare the 7.5 × 10⁻³ M Nc solution. Next, 100 µL of the sample solution was mixed with 1 mL of CuCl2 solution, 1 mL of Nc solution, 1 mL of ammonium acetate buffer, and 1 mL of distilled water. The absorbance was measured at 450 nm against a blank reagent after 30 min.

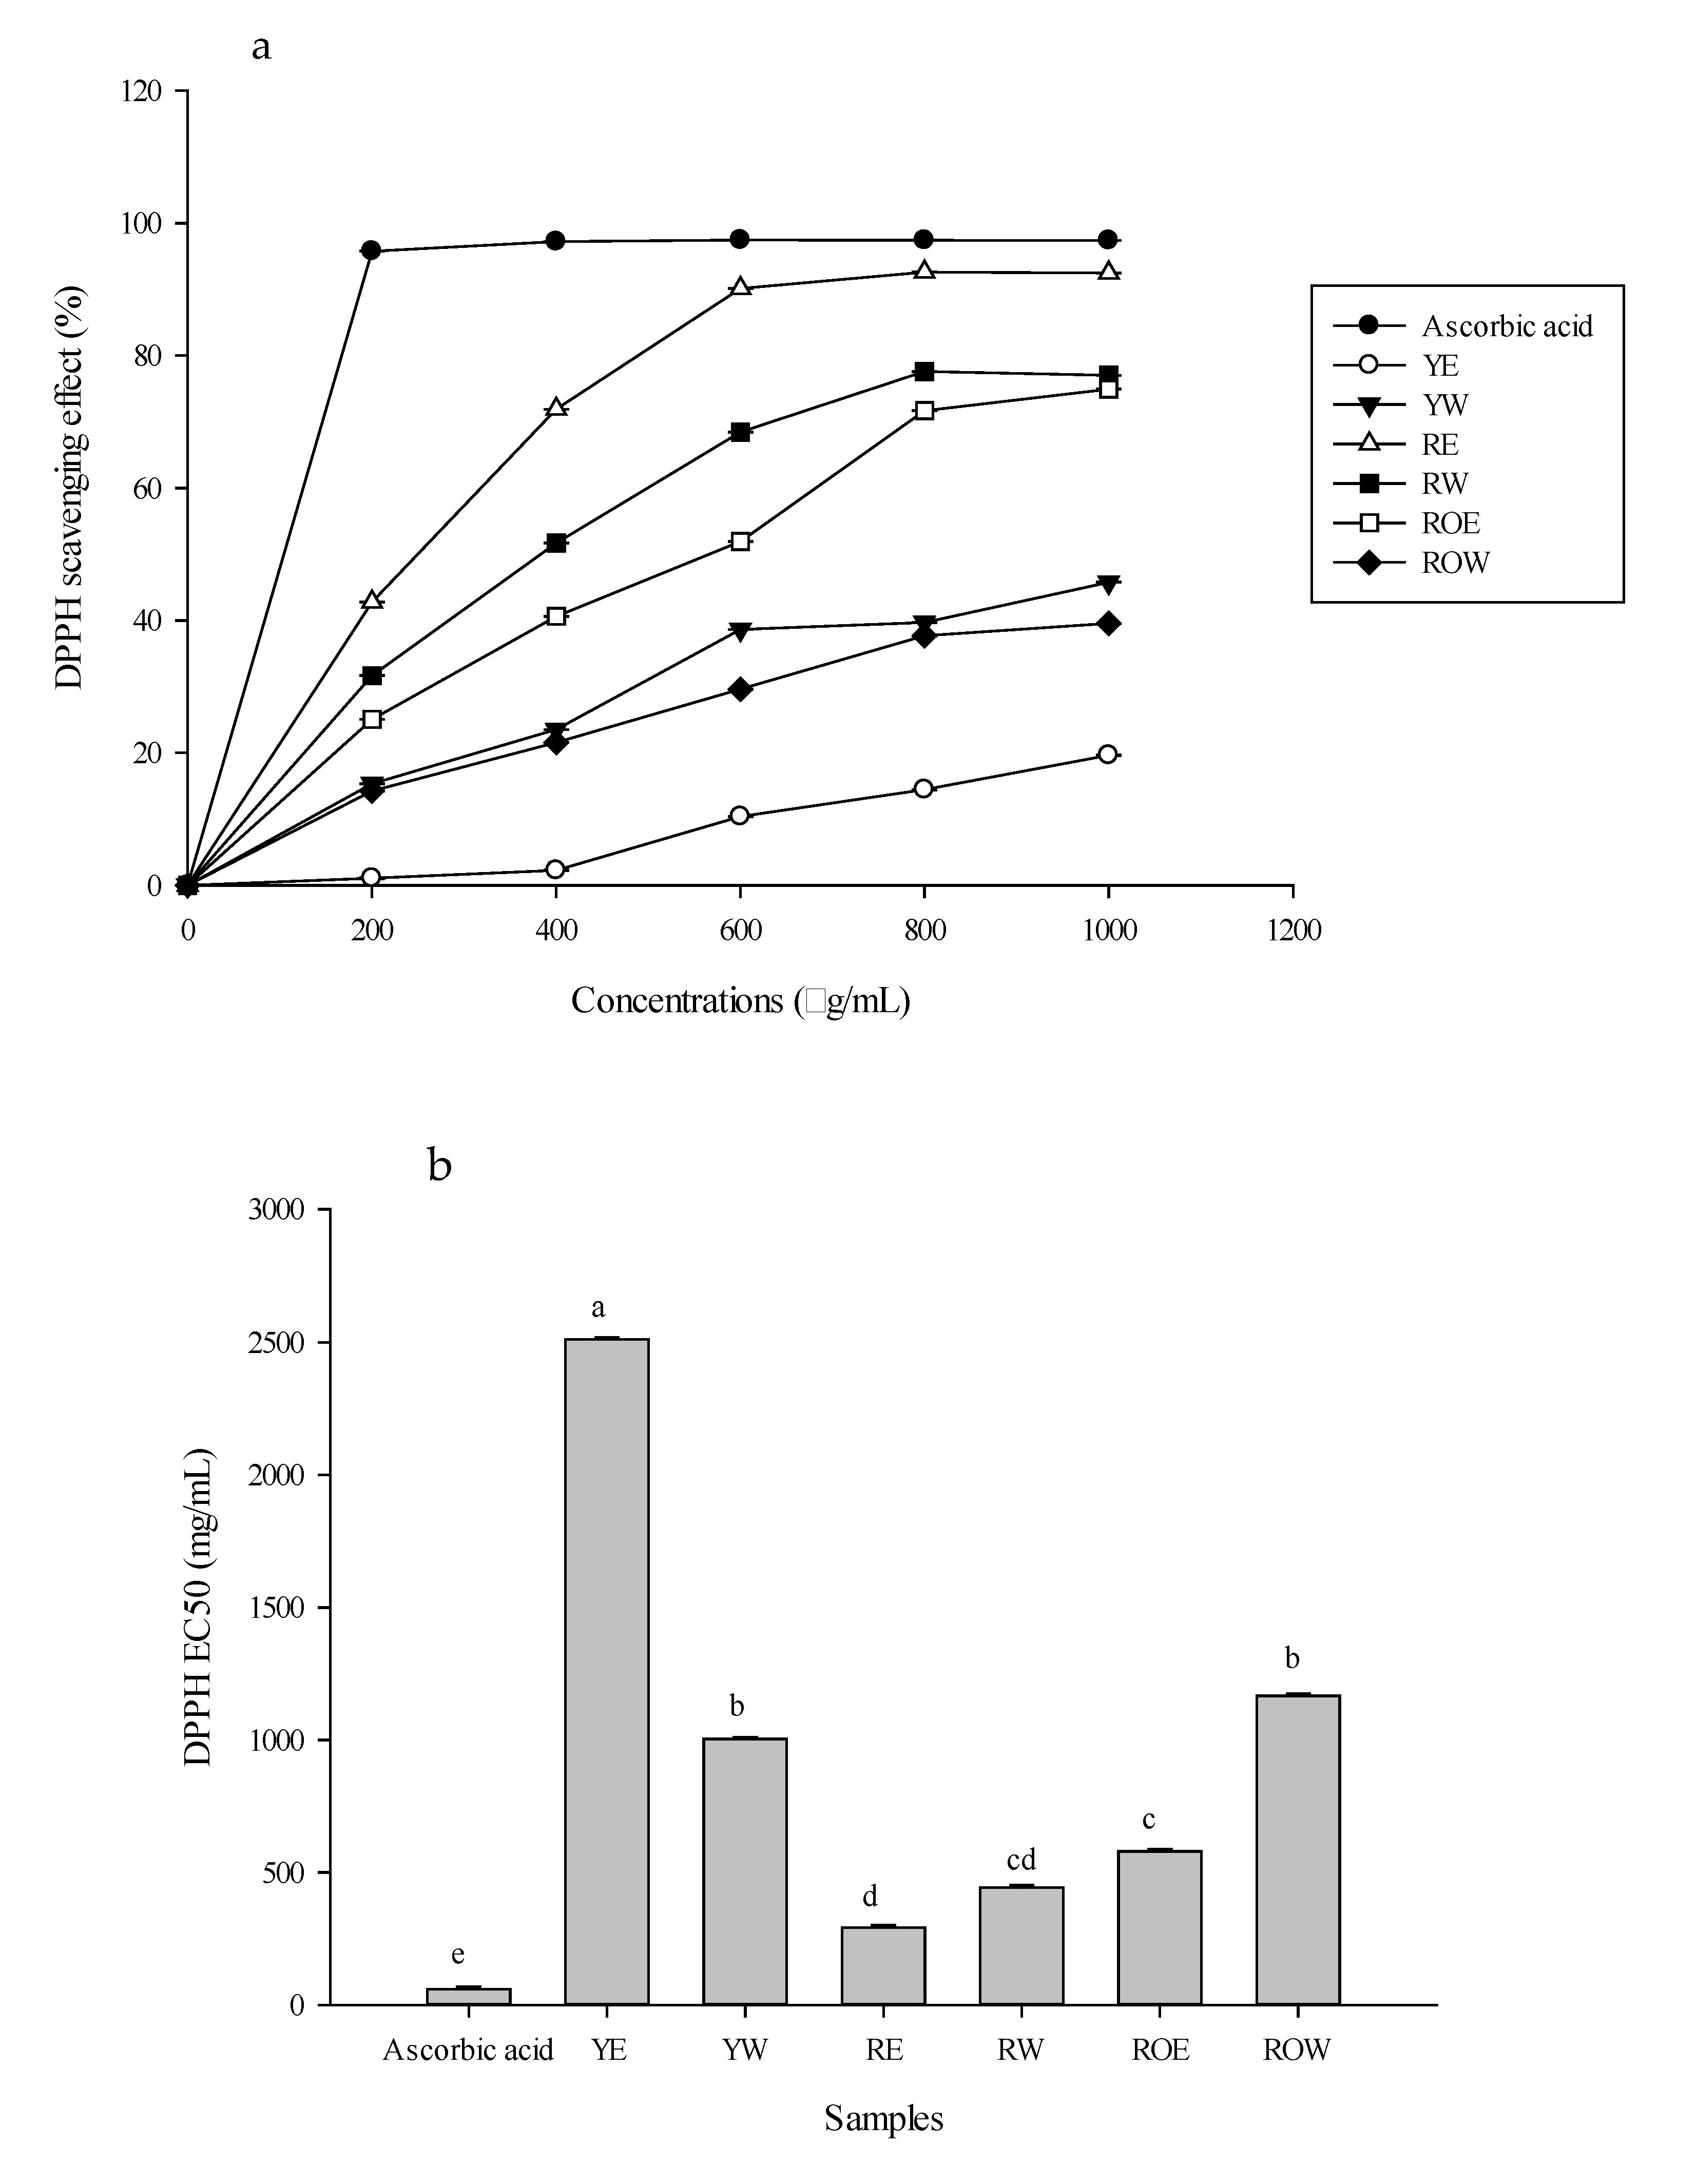
2.9. 2,2-Diphenyl-1-Picrylhydrazyl (DPPH) Radical Scavenging Assay

The free radical scavenging activity by plant extract was done according to the method reported by Ozdal et al. (2019) [17]. The antioxidant activity of the sample extracts and the standard was assessed based on the radical scavenging effect of the stable 2,2-diphenyl-1-picrylhydrazyl (DPPH) free radical activity. The diluted working solutions of the test extracts were prepared in methanol. Ascorbic acid, Vitamin E, and gallic acid were used as standard solutions. Then, 0.1mM of DPPH was prepared in methanol, and 2 mL of this solution was mixed with 1 mL of sample solution and standard solution separately. These solution mixtures were kept in the dark for 30 min, and optical density was measured at 518 nm using a UV spectrophotometer. Methanol (1 mL) with DPPH solution (0.1 mM, 2 mL) was used as blank reagent. The optical density was recorded, and percentage of inhibition (% of inhibition) was calculated using formula (2) given below:
DPPH   free   radical   scavenging   activity   ( % ) = ( A o A C A C ) × 100
where Ao = absorbance of control; Ac = absorbance of sample.

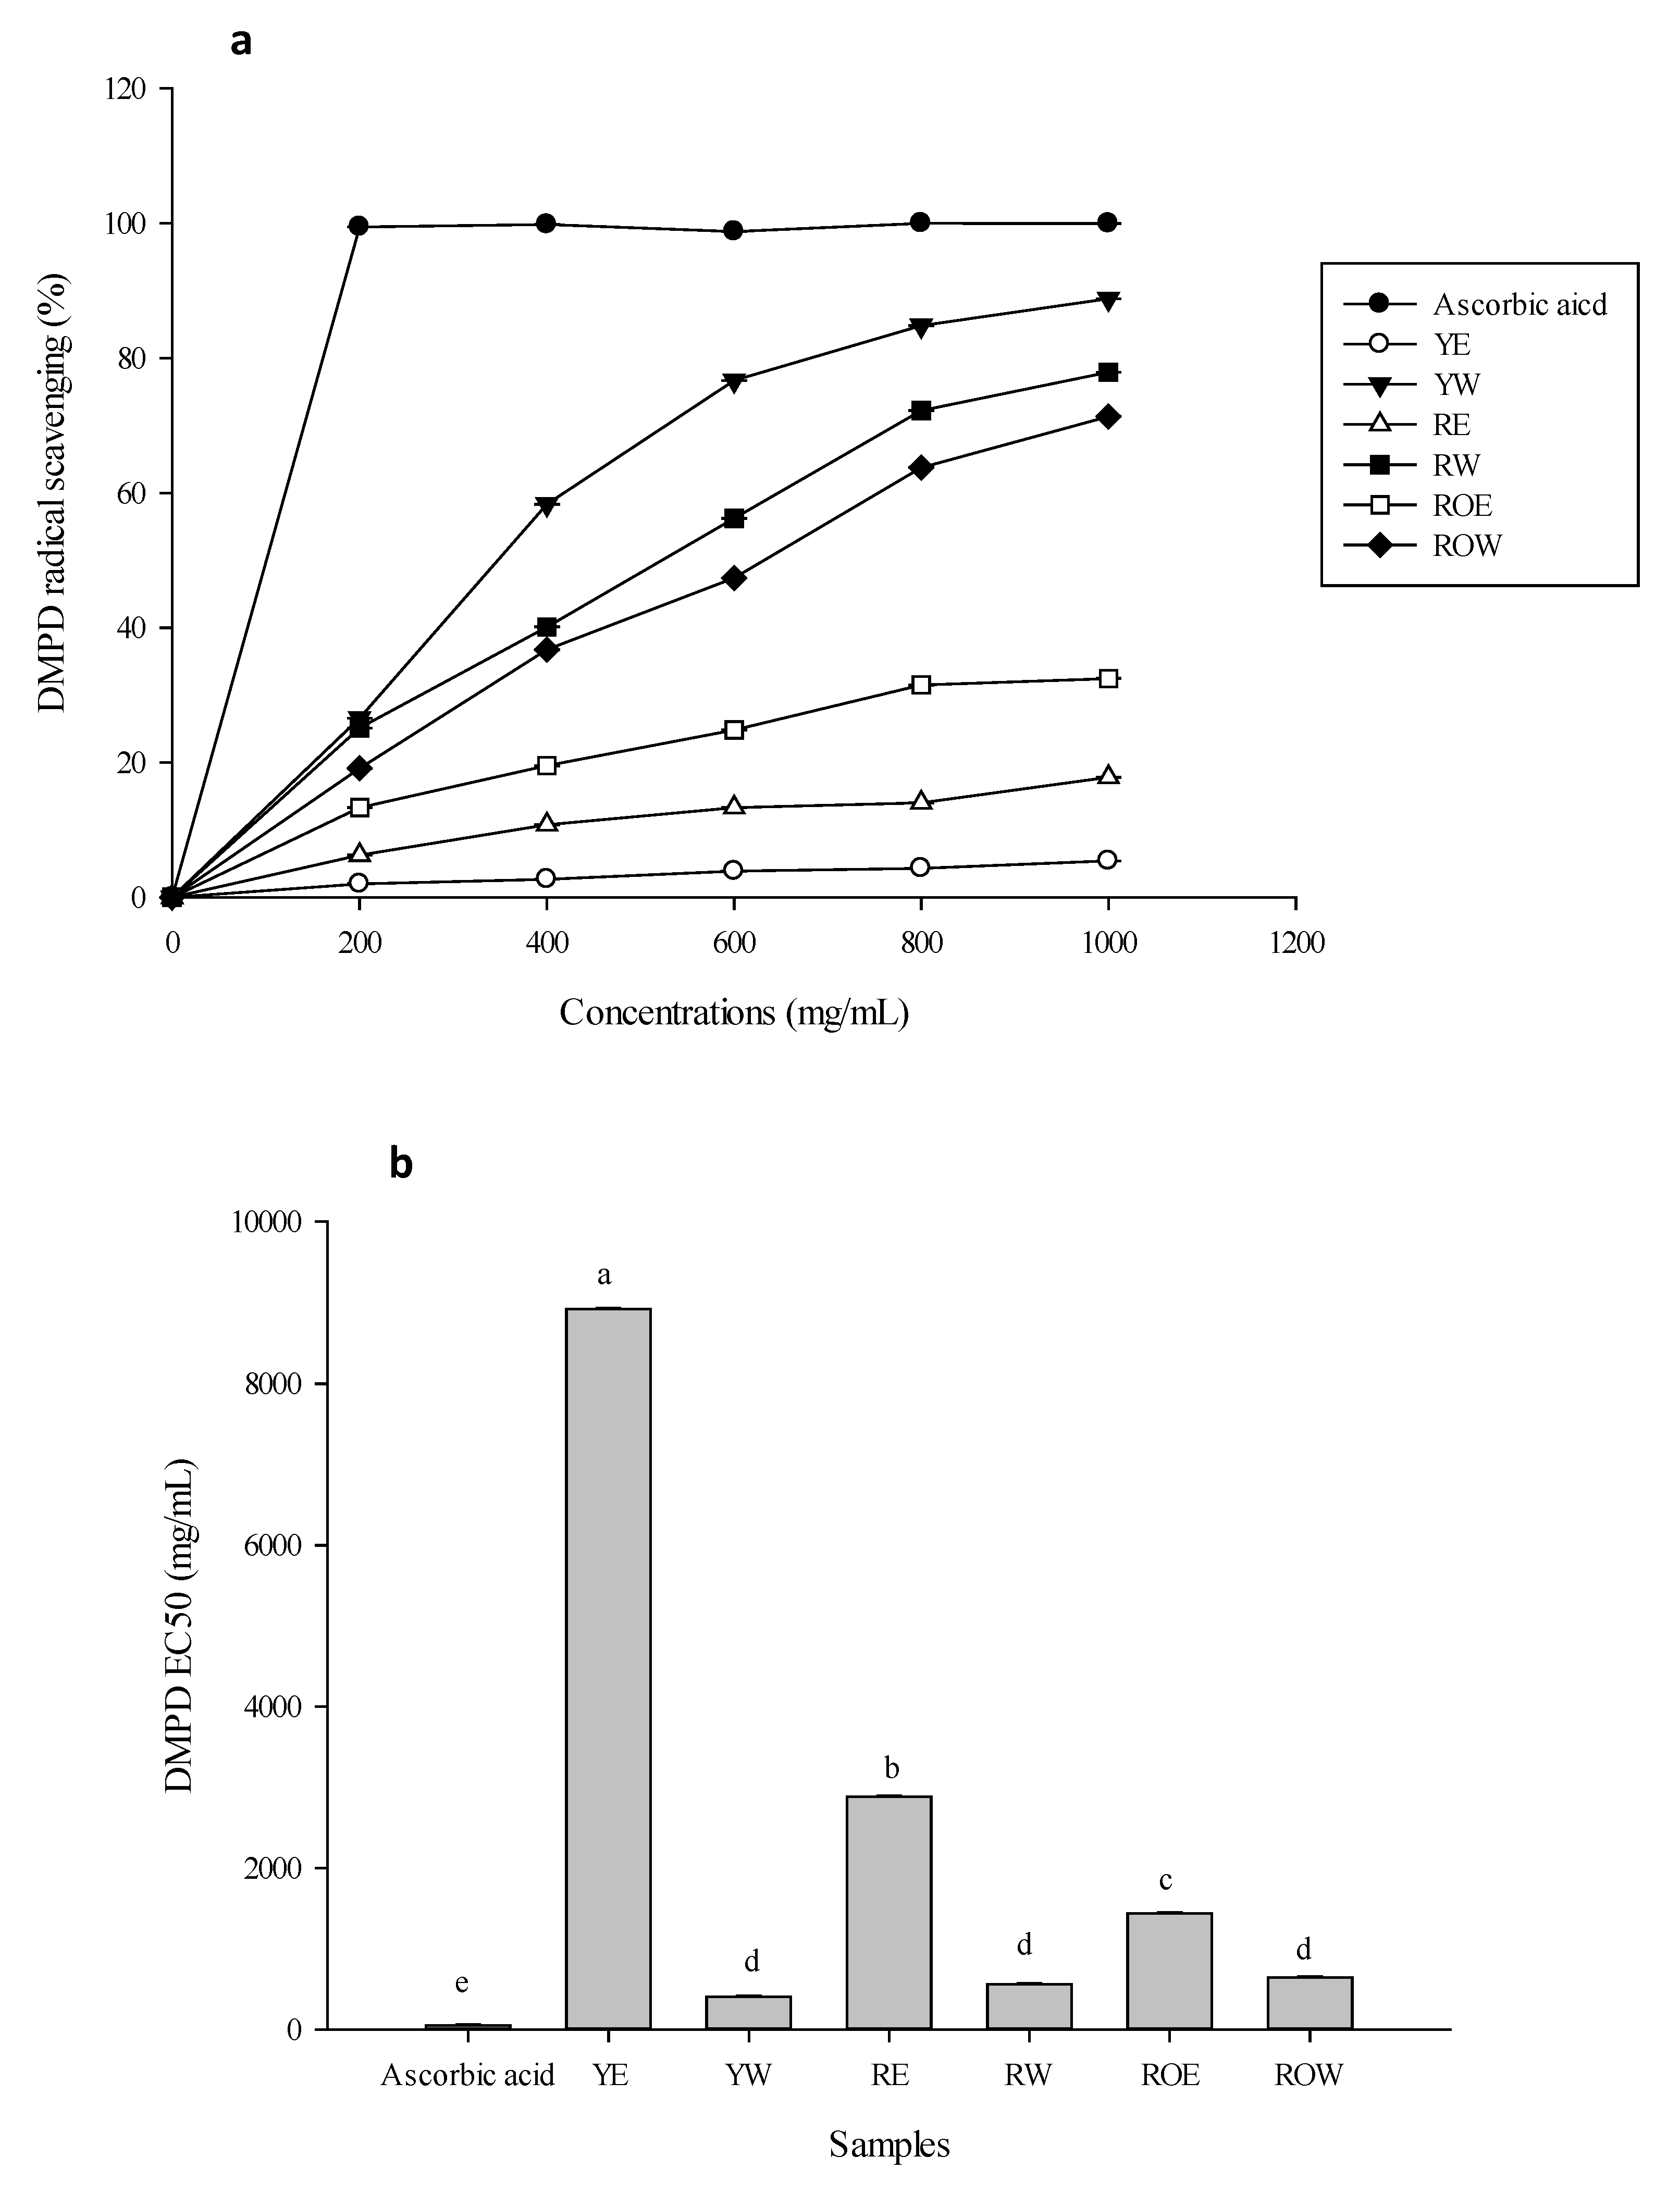
2.10. N,N-Dimethyl-P-Phenylenediamine (DMPD)

The DMPD method was carried out as described by Rodríguez-Nogales et al. (2011) [18] with modifications. The sample solution (0.075–2.5 mL) was added to 50 mL of DMPD·+ radical solution then filled to a final volume of 52.5 mL with 0.1 M buffer acetate at pH 5.3. The solution was kept under agitation in an orbital agitator at 200 rpm for 6 min at 25 °C. The absorbance was measured at 505 nm with spectrophotometer. The scavenging degree of the radical was determined with formula (3) below:
Degree   of   scavenging   of   the   radical   ( % ) = ( 1 A f A O ) × 100
where Af is the absorbance of the non-scavenged radical, and Ao is the absorbance of the cation after 6 min of incubation with the antioxidant.

2.11. Statistical Analysis

The mean (SD) of each analysis is reported. In the statistical analysis of these experiments, all data were evaluated by using single factor of ANOVA. The F-value was significant if p < 0.05 on the analysis of variance (ANOVA). Duncan’s new multiple range tests were then used to correlate treatment means.

3. Results and discussions

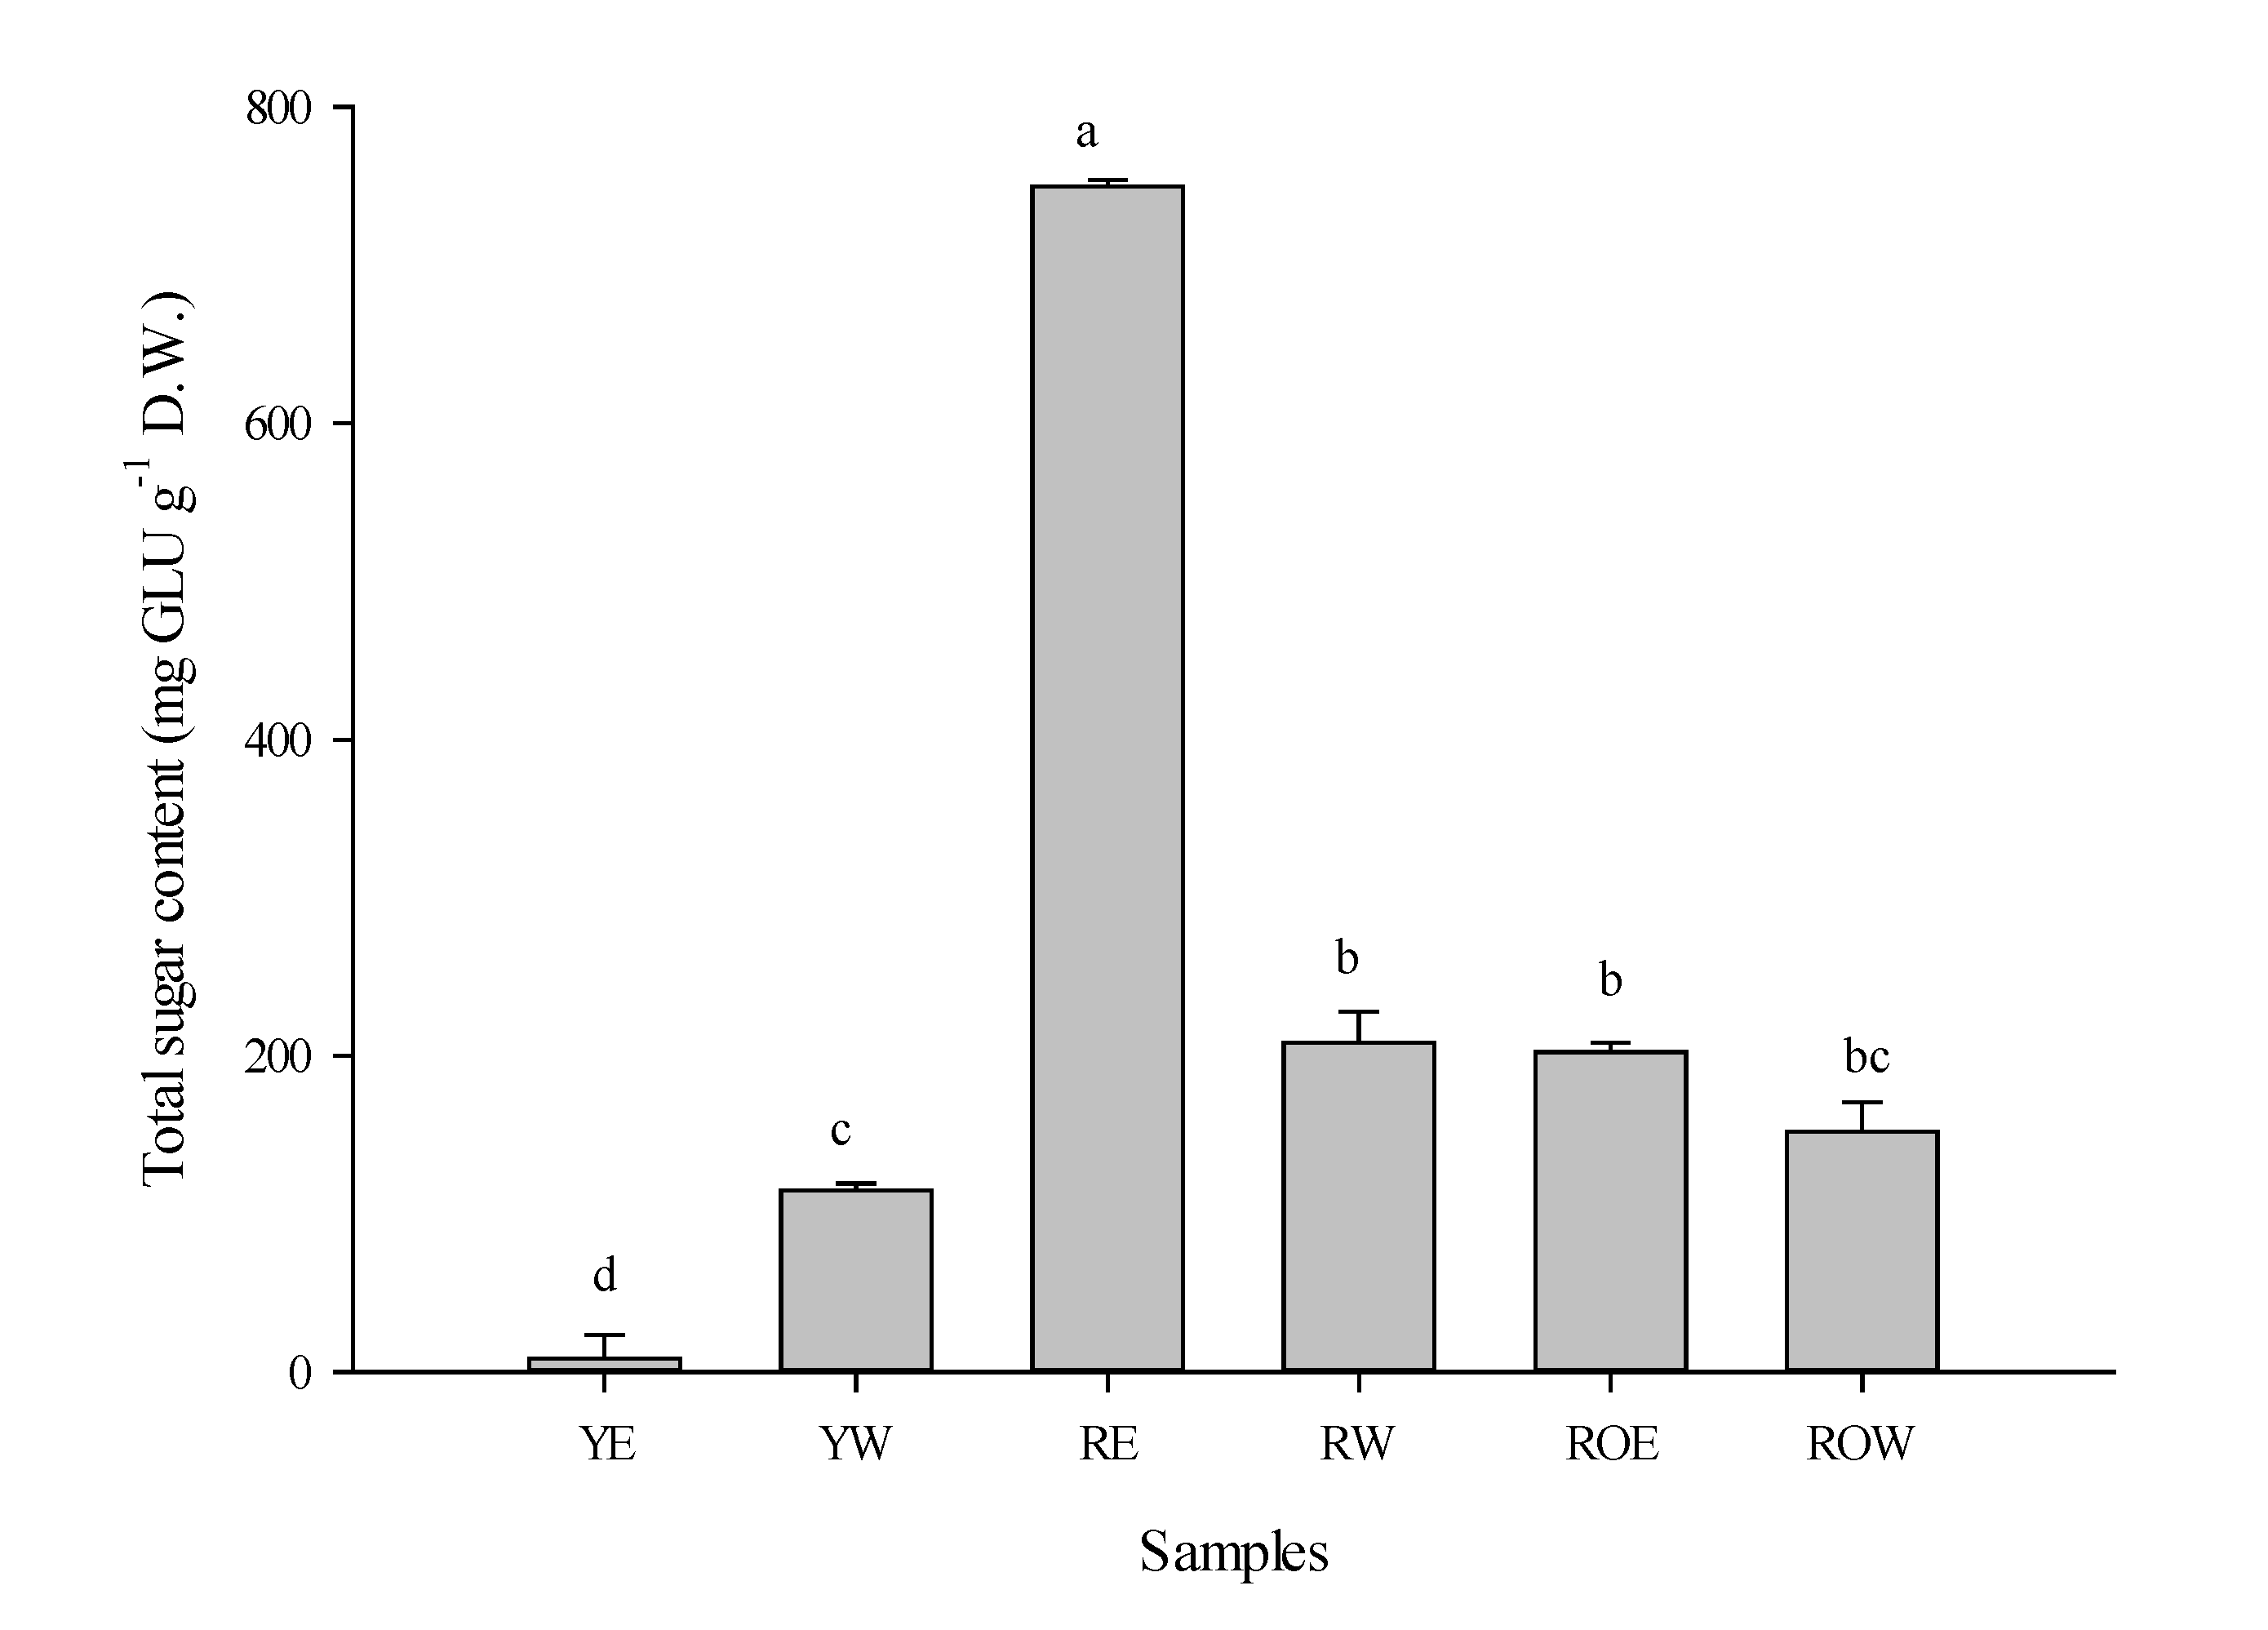
3.1. Total Sugar Content

The sample used in this study consisted of ethanol extracted yellow-colored djulis hulls (YE), water extracted yellow-colored djulis hulls (YW), ethanol extracted red-colored djulis hulls (RE), water extracted red-colored djulis hulls (RW), ethanol extracted djulis roots (ROE), and water extracted djulis roots (ROW). The total sugar content of the djulis hull and root ethanolic and water extracts is presented in Figure 1. The highest amount of total sugar was for RE (794.70 ± 4.18 mg GLU g−1 D.W.) compared to the other samples. The total sugar content for RW, ROE, ROW, and YW was 208.30 ± 19.60, 202.30 ± 6.07, 151.80 ± 18.60, and 114.90 ± 4.18 mg GLU g−1 D.W., respectively. YE (8.43 ± 15.00 mg GLU g−1 D.W.) contained the lowest total sugar content among the sampled hulls and roots. A previous scientific study indicated that the sugars arabinose, fructose, glucose, and sucrose are found in the species belonging to Chenopodiaceae [19]. Sugar analysis forms part of quality control in the food industry in assuring the optimal sugar intake. Among all sugars, sugars originating from starch hydrolysis occurring in cereals are significantly important in the baking and brewing industry. Sugars play a vital role in the process of confectionary baking, since caramelization occurs at high temperatures, resulting in a brown color and affecting the properties, appearance, and flavor of the final products [20]. During fermentation, sugars are used as substrate, which the yeast ferments and frees into carbon oxide and alcohol. Starch (consisting of glucose units linked by α-1,4 and α-1,6 bonds) is the main component of cereal crops, and their transformation processes can lead to starch hydrolysis sugars like glucose, maltose, and other glucose oligosaccharides [21]. Di Mauro et al. (2017) [22] verified that agronomical by-products containing high amounts of biologically active ingredients, such as glucose, mannose, and fructose, have recently attracted considerable attention in the cosmetic field.

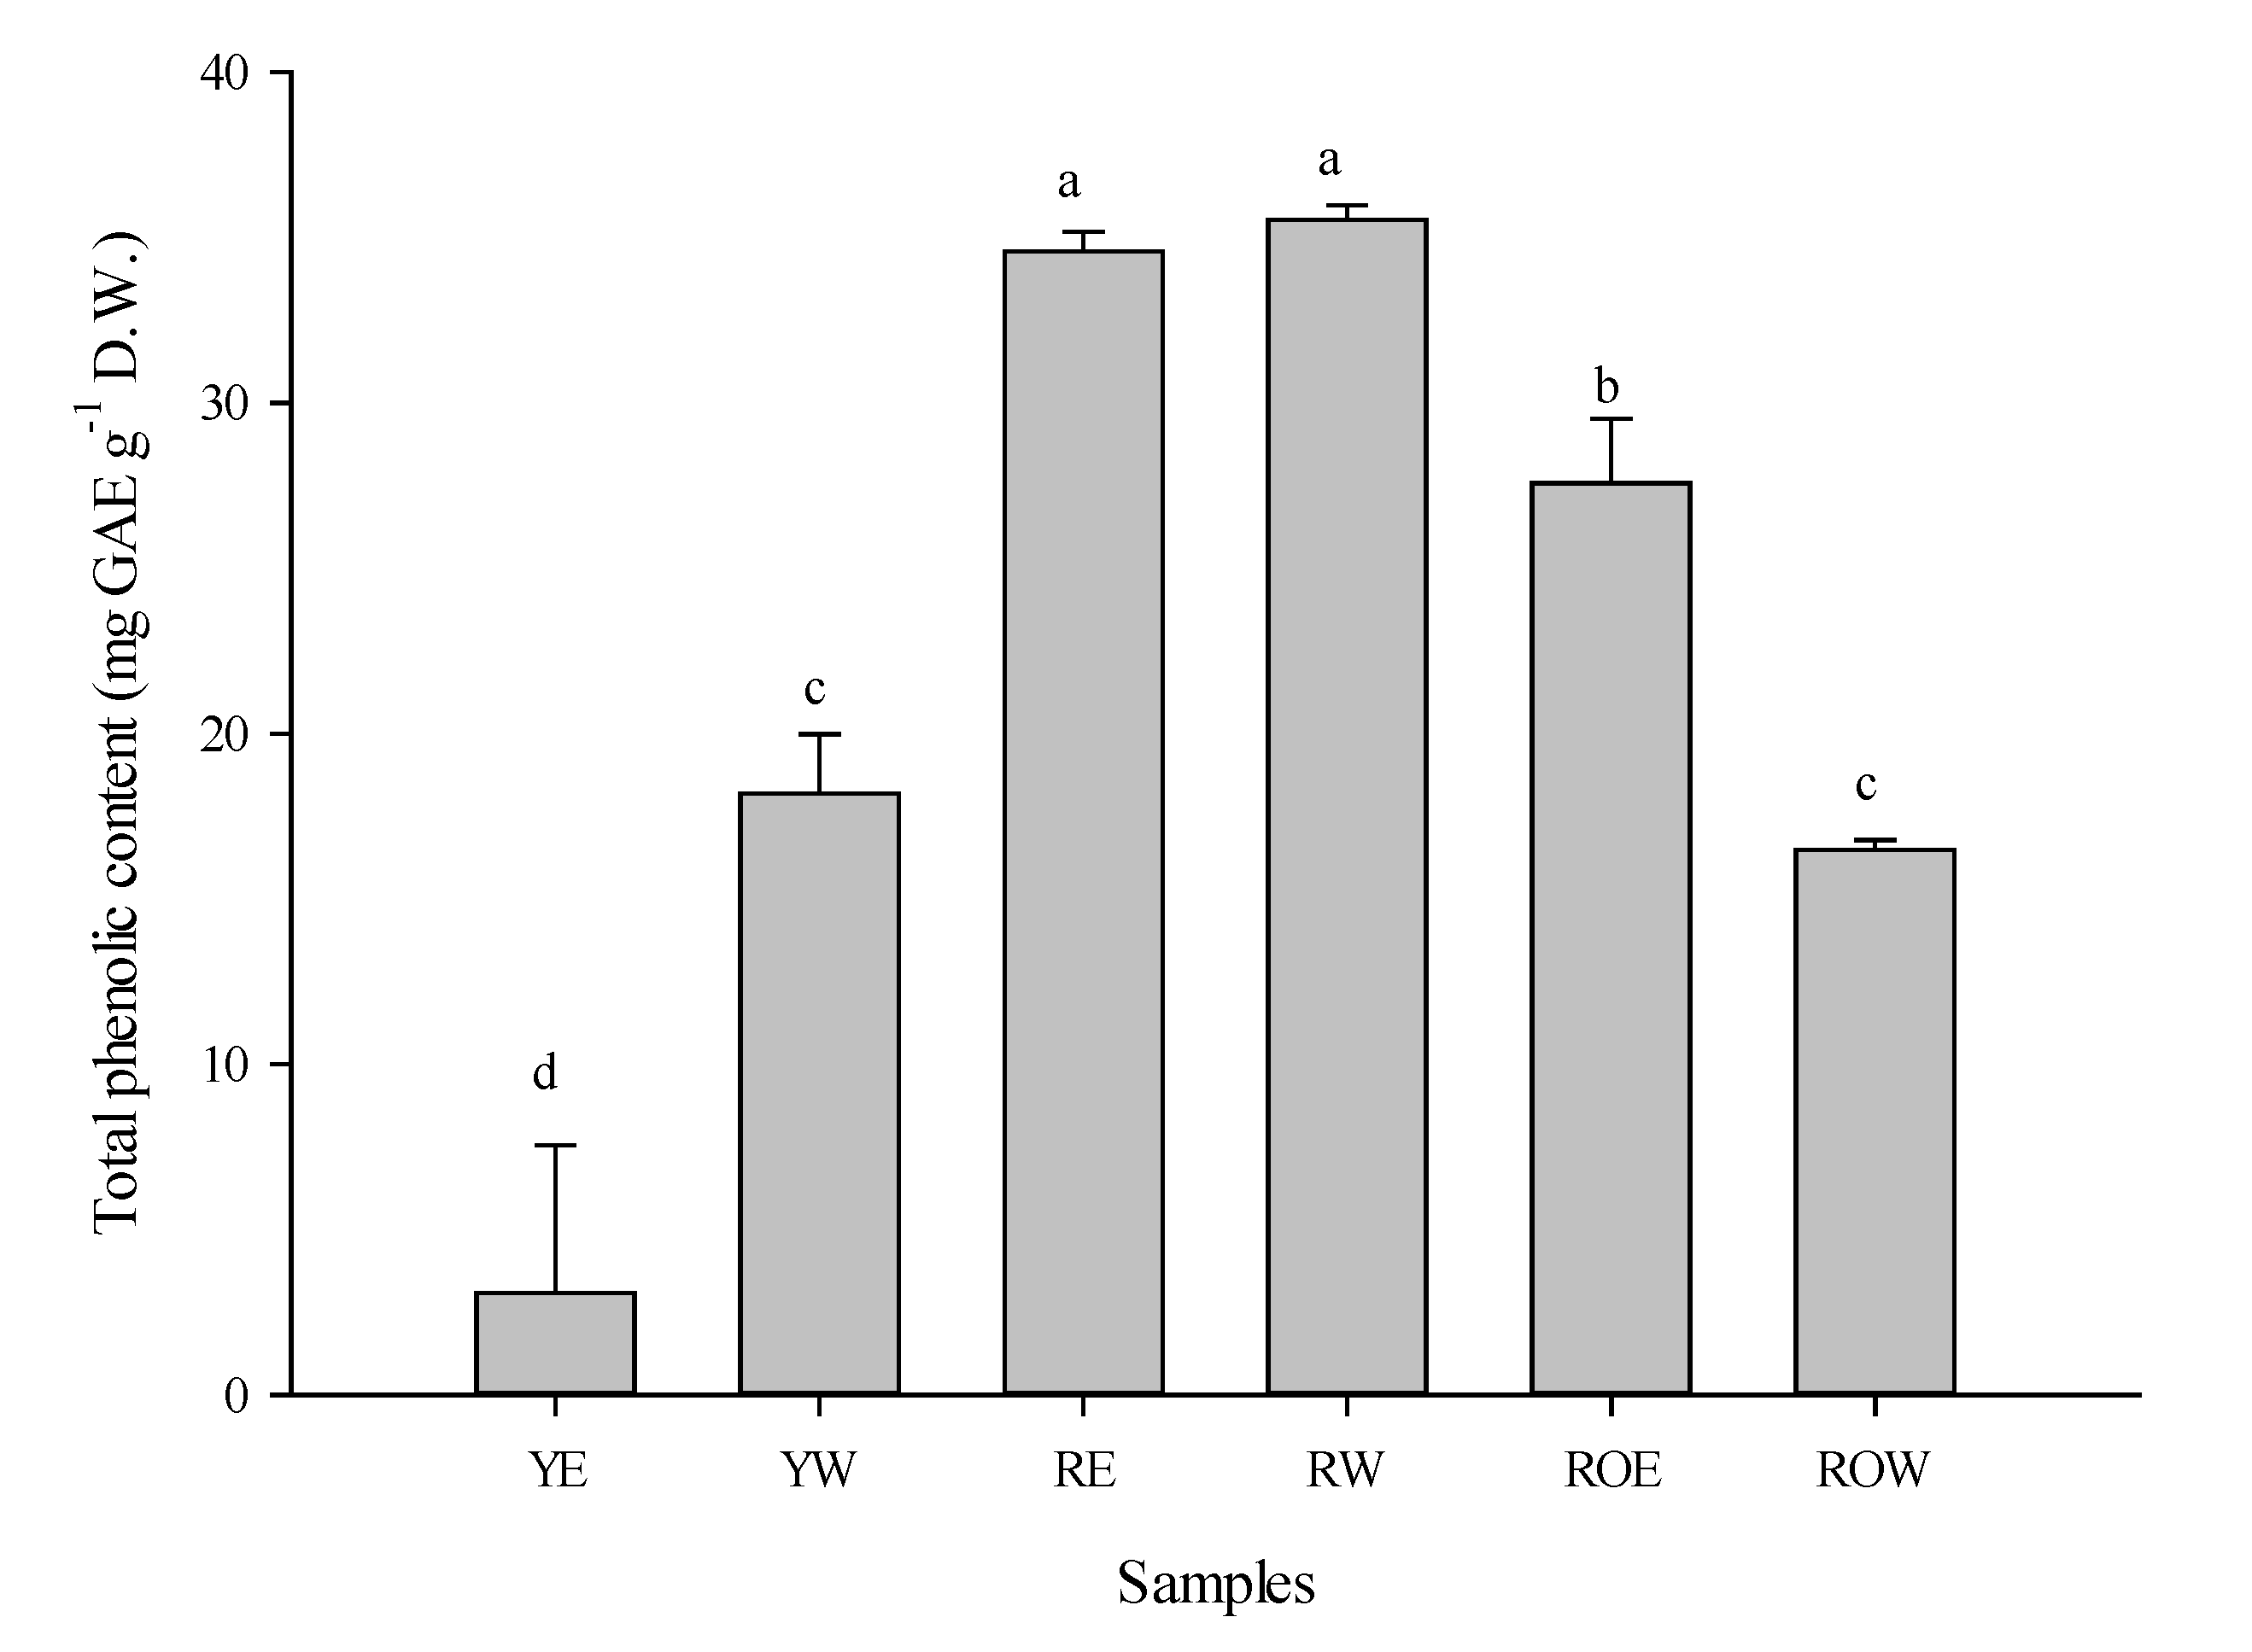
3.2. Total Phenolic Content

Figure 2 illustrates the total phenolic content of djulis hulls and roots as determined by the Folin–Ciocalteu assay. RW [35.53 ± 0.44 mg gallic acid equivalents (GAE) g−1 D.W.] contained the highest total phenolic content (TPC), followed by RE (34.59 ± 0.58 mg GAE g−1 D.W.). There is no significant difference between the TPC of RE and RW. Moreover, the TPC of ROE, ROW, and YW was 27.57 ± 1.96, 16.48 ± 0.29, and 18.19 ± 1.80 mg GAE g−1 D.W., respectively. YE only contained 3.09 ± 4.46 mg GAE g−1 D.W. of TPC. In short, the total phenolic level of the djulis hulls and roots was in the order of RW > RE > ROE > YW > ROW > YE. Antioxidants were also identified as reductants, which act as reducing agents or hydrogen donors in redox reaction. The antioxidant activity of phenolic compounds usually depends on their redox properties. In this study, a significantly high level of TPC was observed in the RE and RW samples, and this may elucidate the widespread traditional use of the plant. Based on the studies available in the literature, high-pressure treated djulis hulls (2114.94 mg GAE/100 g) contained the highest phenolic content as compared to djulis whole grain (804.67 mg GAE/100 g) and de-hulled seeds (352.87 mg GAE/100 g) [23]. Plants naturally contained various groups of phenolic compounds, such as simple phenolics, phenolic acids, anthocyanins, hydroxycinnamic acid derivatives, and flavonoids. All these compounds, well known for their health effects due to their antioxidant, anti-inflammatory, anticancer, and antimicrobial properties, are nowadays recognized as valuable molecules in the nutraceutical field, and in such a context, djulis represents a promising bioresource [4].

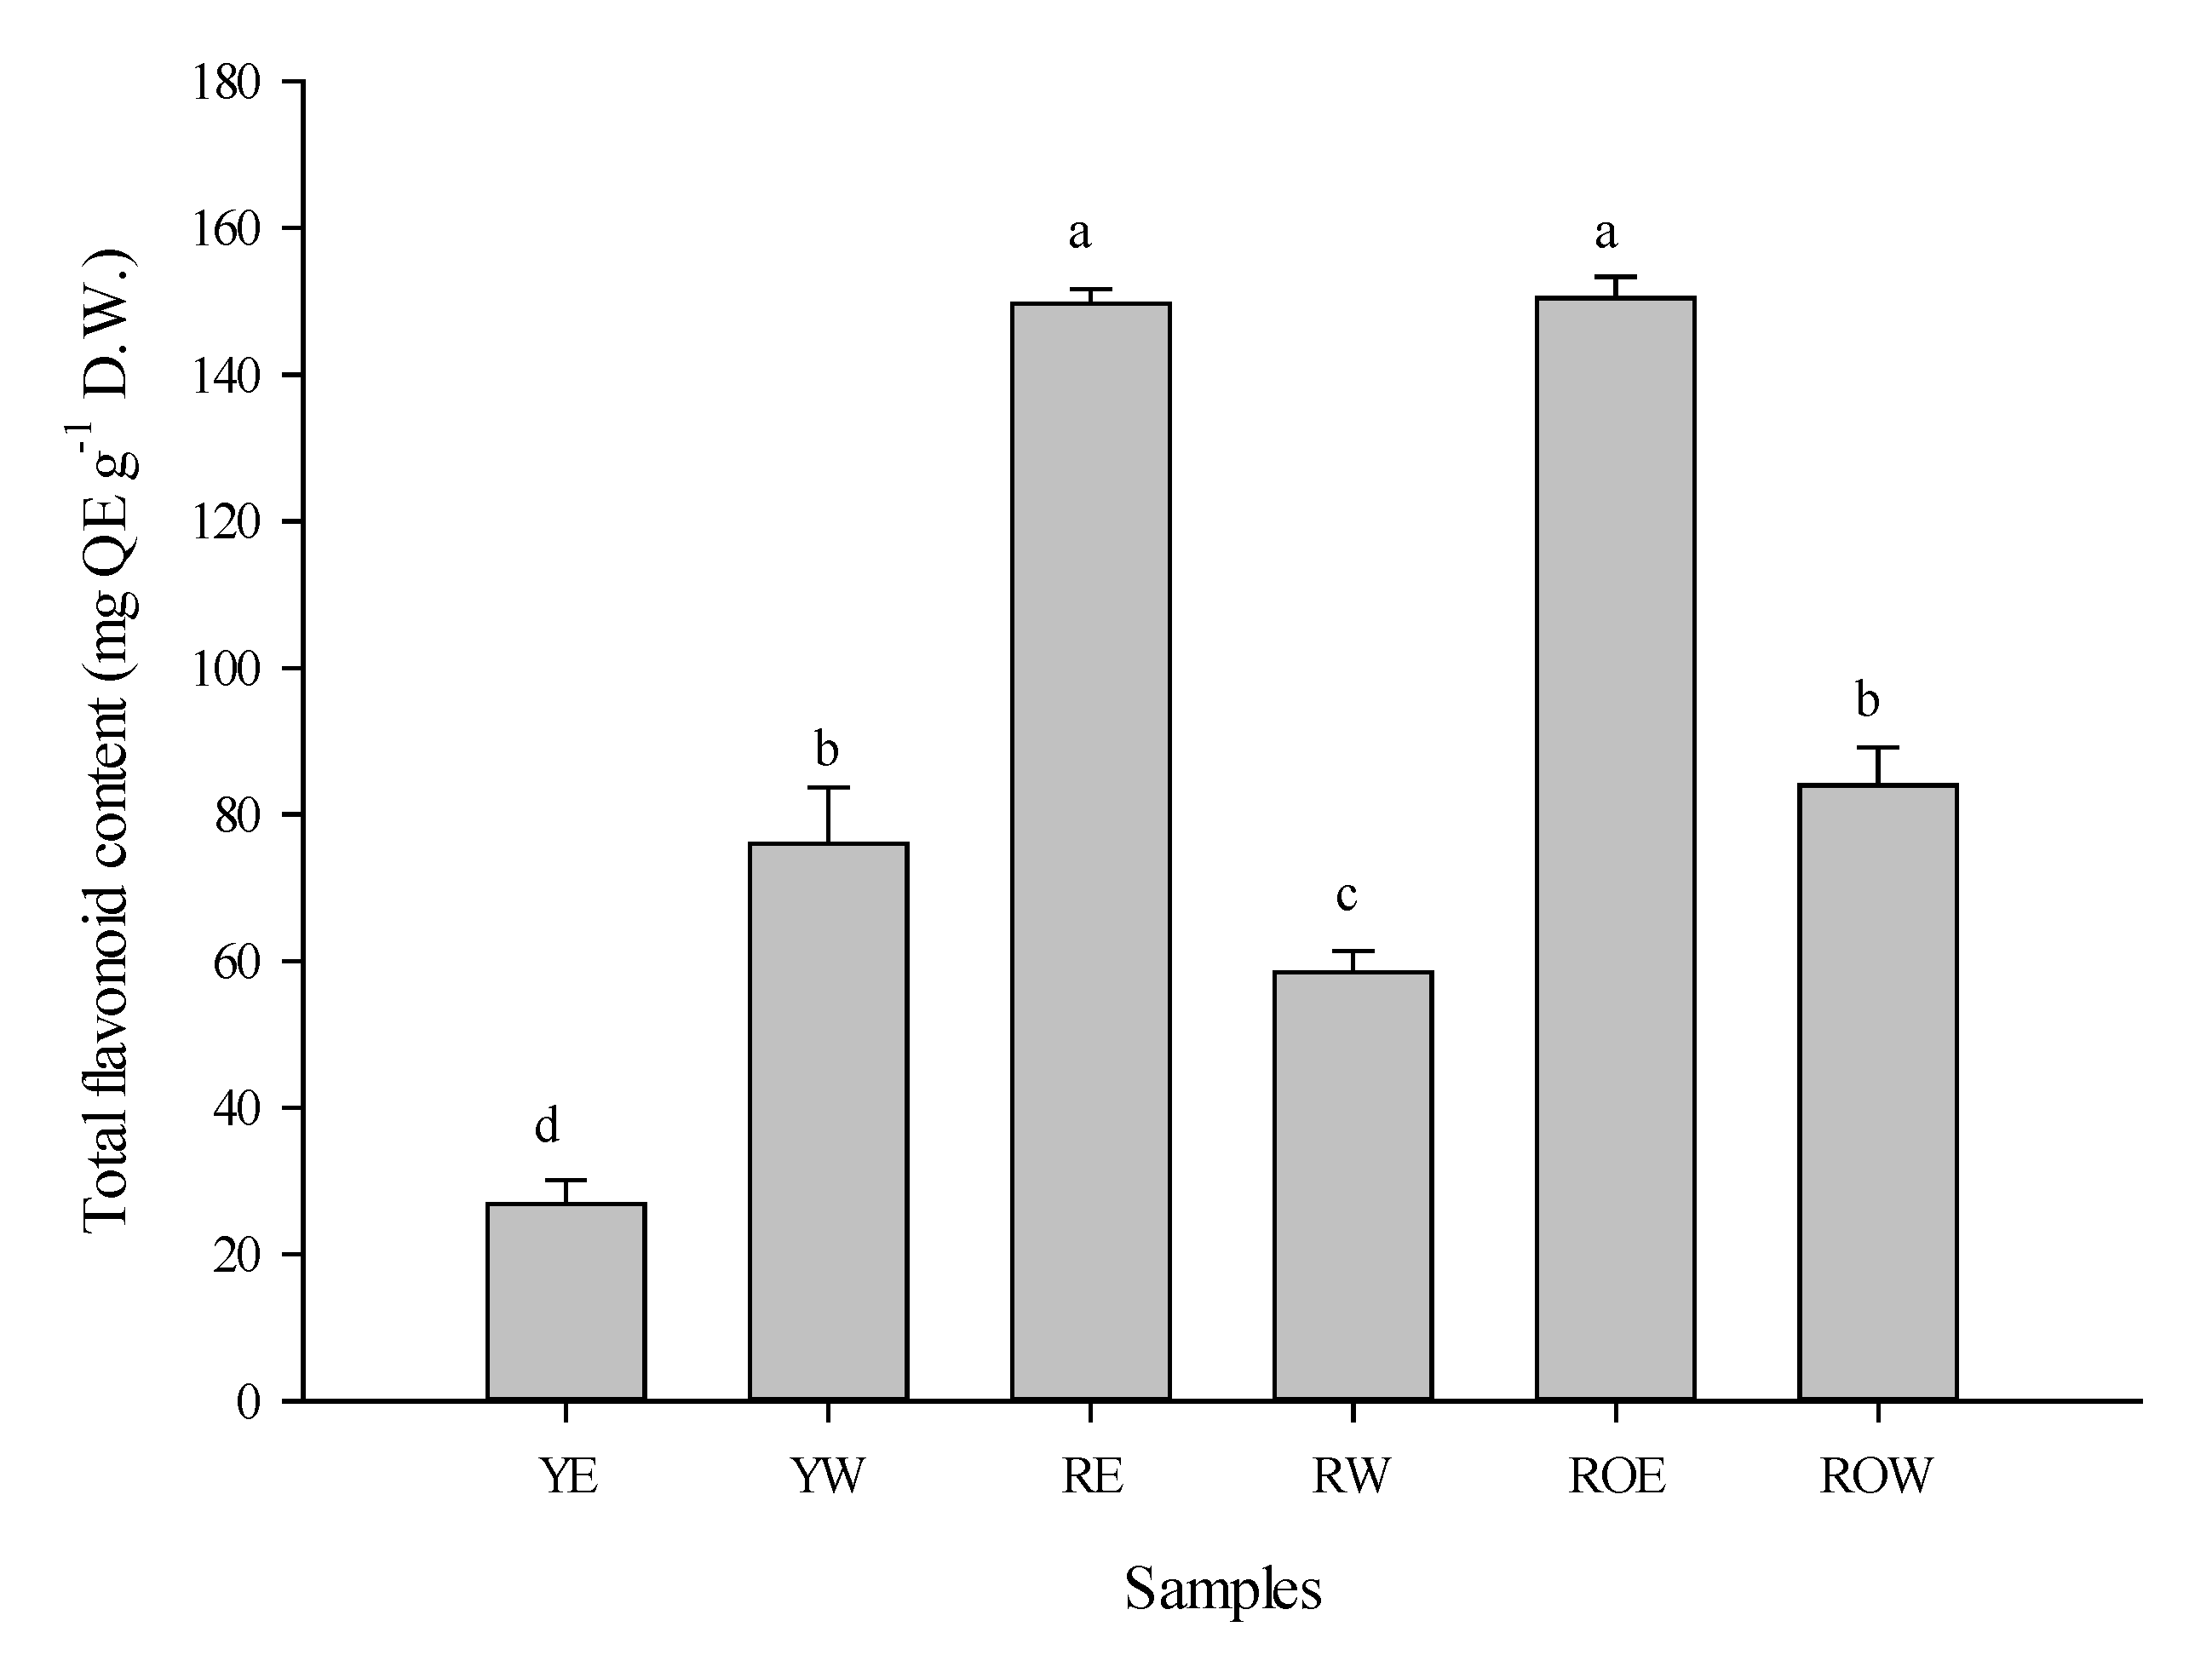
3.3. Total Flavonoid Content

Figure 3 depicts the total flavonoid content (TFC) of djulis hulls and roots, which were extracted by using ethanol and water. ROE and RE consisted of 150.50 ± 2.87 and 149.70 ± 1.96 mg QE g−1 D.W., respectively. There is no significant difference between the TFC value for ROE and RE. The TFC for ROW, YW, RW, and YE was 84.03 ± 5.17, 76.03 ± 7.66, 58.48 ± 2.94, and 26.92 ± 3.22 mg QE g−1 D.W., respectively. Apparently, the total flavonoid level of the djulis hulls and roots was in the order of ROE > RE > ROW > YW > RW > YE. The result validated the evidence from previous studies by Pang et al. (2018) [24] and Vaher et al. (2010) [25], who illustrated that grains contain an abundance of polyphenol compounds, broadly in the bran of grain (or hulls). A study by Walter et al. (2013) [26] clarified that grains with red and black pericarp colors obtained higher values of total phenolic content, total flavonoid content, and antioxidant activity and that there were positive and significant correlations between these parameters. Furthermore, a very high positive association was found between total phenolics and total flavonoids (r = 0.91, p < 0.0001) in the study of Abderrahim et al. (2015) [27]. Research on high-pressure treated djulis hull samples verified that the highest flavonoid content (910.27–1011.73 mg QE/100 g) is found in hulls prepared by traditional thermal methods (cooking in boiling water for 20 min and pasteurization at 65 °C for 30 min) [23]. Flavonoids are important in overturning reactive oxygen formation, chelating trace elements involved in free-radical production, scavenging reactive species and up-regulating and protecting antioxidant defenses [28,29].

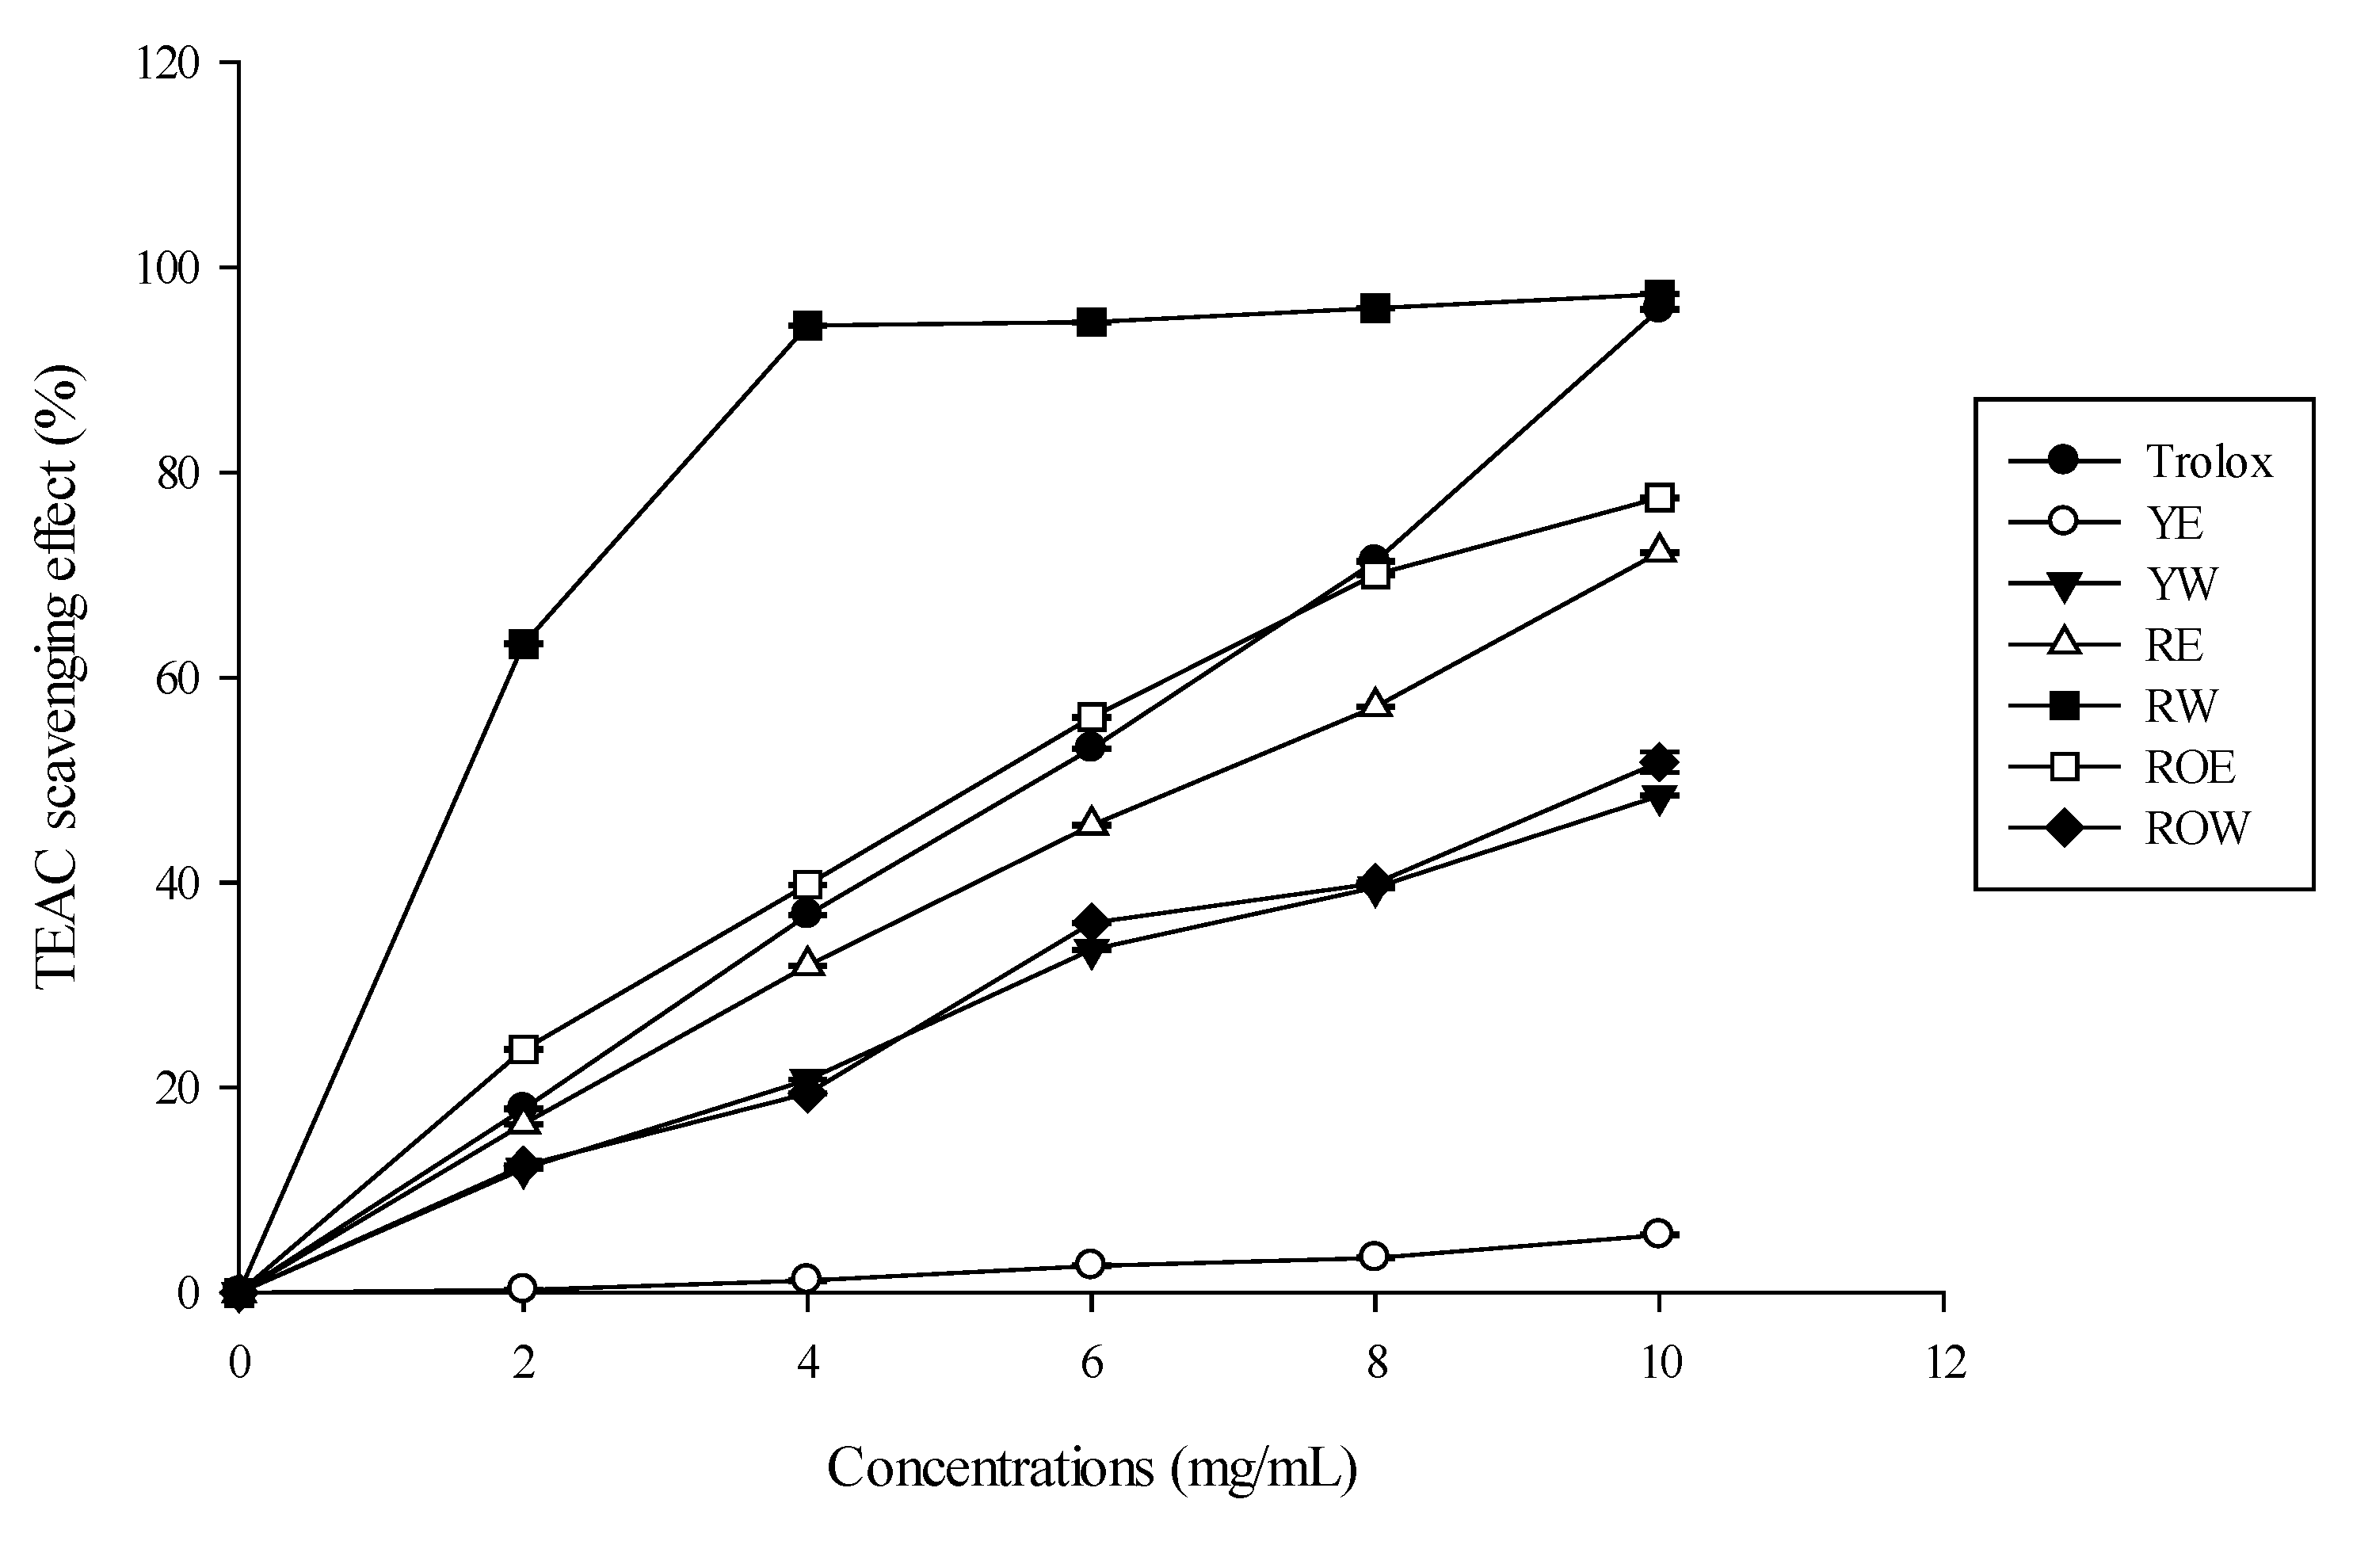
3.4. Trolox Equivalent Antioxidant Capacity (TEAC)

Trolox equivalent antioxidant capacity (TEAC) of the ethanol and water extract of djulis hulls and roots can be seen in in Figure 4. As shown in Figure 4, RW presented the highest TEAC scavenging effect as compared to the other samples. At the concentration of 10 mg/mL, the scavenging effect of RW (94.67%) had no significant difference with the 0.5 mg/mL standard Trolox (95.92%). The scavenging effect of the sample tested rose up gradually as the concentration increased. Surprisingly, as the concentration of ROE increased from 6 to 10 mg/mL, the scavenging effect increased from 56.13% to 77.54%. Red djulis ethanol extract (RE) also a scavenging effect of 72.23% at a concentration of 10 mg/mL. Abderrahim et al. (2015) [27] clarified the positive correlation between the total phenolic and total flavonoid content with the antioxidant capacity in Chenopodium quinoa Willd. From the studies above, YE with lowest total sugar content, total phenolic content, and total flavonoid content contained the lowest TEAC scavenging effect, which was only 5.62% at the concentration of 10 mg/mL. On the contrary, YW showed a scavenging effect of 48.46% at the same concentration. Betacyanin (reddish purple color) and betaxanthins (yellowish orange color), the major pigments contributing to color of djulis, also play a significant role in the antioxidant capacity of djulis [23]. Hence, this may cause TEAC scavenging effect of red djulis to be apparently higher than yellow djulis.

3.5. Ferric Reducing Antioxidant Power (FRAP)

Antioxidant activities of the ethanol and water extract of djulis hulls and roots as determined by FRAP assay are presented in Figure 5. The FRAP assay was used to measure the antioxidant capacity of tested samples to reduce the Fe3+ (ferric ion) to blue color Fe2+ (ferrous ion), and the higher absorbance at 593 nm depicted the higher antioxidant capacity [30]. From the data analysis, as the concentration of the test samples increases, the FRAP value also climbs up steadily. Rising with the concentration tested, the FRAP value for RW and RE showed no significant difference, while the ROE, ROW, and YW demonstrated moderate FRAP values as compared to the other samples. YE presented the lowest FRAP value. In short, among the treated samples using the FRAP assay, at the concentration of 500 µg/mL, RW exhibited the highest FRAP values (0.939 ± 0.01 mM), followed by RE (0.897 ± 0.09 mM), ROE (0.574 ± 0.05 mM), YW (0.495 ± 0.01 mM), ROW (0.396 ± 0.02 mM), and YE (0.167 ± 0.01 mM). Tsai et al. 2011 [31] stated that the major constituent of polyphenols in djulis is rutin, followed by chlorogenic acid and catechin. Chenopodium spp. seeds with different colors contain different phenolic contents and compositions; the darker the seeds, the higher the level of phenolic contents and antioxidant activities [32]. Thus, red-colored djulis has a higher antioxidant activity than yellow-colored djulis. Commonly, the reducing properties are connected to the existence of composites, which apply their action by breaking free radical chains by donating a hydrogen atom [33].

3.6. Cupric Reducing Antioxidant Capacity (CUPRAC)

Cupric reducing antioxidant capacity (CUPRAC) of djulis hulls and roots is shown in Figure 6. Noticeably, the optical density (OD) at 450 nm climbed up as the concentrations increased. Similar to the results obtained from the FRAP assay, the RW and RE consisted of the highest antioxidant capacity with 0.733 ± 0.04 and 0.663 ± 0.05 OD at a concentration of 1000 µg/mL. ROE, YW, and ROW presented moderate antioxidant capacity with 0.337 ± 0.07, 0.280 ± 0.01, and 0.279 ± 0.03 OD, respectively, at a concentration of 1000 µg/mL. Still, ethanol extracted yellow djulis hulls (YE) exhibited the lowest antioxidant capacity of only 0.018 ± 0.02, 0.019 ± 0.01, 0.035 ± 0.06, 0.037 ± 0.03 and 0.045 ± 0.01 OD at the concentrations of 200, 400, 600, 800, and 1000 µg/mL, respectively. Although both reddish purple color betacyanin and yellowish orange color betaxanthins contributed to the antioxidant capacity of the djulis, different concentrations of the pigment fractions may significantly affect the scavenging ability of the djulis [23]. For instance, betanin was the major contributor to the antioxidant capacity of djulis, followed by isobetanin, amaranthine, and isoamarnathine. Because betanin contains twice the amount of concentrations compared to isobetanin, it showed a 3.6-fold higher antioxidant capacity than that of isobetanin [30]. Thus, the test samples must be capable of donating electrons to the free radicals to stabilize the oxidation in the actual biological and food system to prevent deterioration.

3.7. 2,2-Diphenyl-1-Picrylhydrazyl (DPPH) Radical Scavenging Assay

The results of the 2,2-diphenyl-1-picrylhydrazyl (DPPH) radical scavenging assay are summarized in Figure 7a, while the DPPH EC50 results are illustrated in Figure 7b. IC50 is commonly used to define the concentration of an inhibitor that results in a half-maximal inhibition of a response (the concentration that reduces a response to 50% of its maximum). Meanwhile, EC50 is the concentration that results in a 50% change in response, or half-maximal response [34]. Apparently, DPPH free radical scavenging activities of the djulis hulls and roots were in the order of RE > RW > ROE > YW > ROW > YE. At the concentration of 1000 µg/mL, ascorbic acid, RE, RW, ROE, YW, ROW, and YE exhibited 97.38 ± 0.04, 92.48 ± 0.01, 77.02 ± 0.01, 74.94 ± 0.01, 45.76 ± 0.01, 39.53 ± 0.01, 19.62 ± 0.04%, respectively. No significant difference for the scavenging activities were observed for the RW and ROE at the concentration of 1000 µg/mL. The EC50 of the DPPH assay of red-colored and yellow-colored djulis hulls and roots was 291.9 ± 9.89 µg/mL (RE), 443.0 ± 8.98 µg/mL (RW), 579.6 ± 8.28 µg/mL (ROE), 1004.1 ± 6.22 µg/mL (YW), 1166.1 ± 8.77 µg/mL (ROW), and 2511.5 ± 7.42 µg/mL (YE). Recent studies reported that djulis that contains a high amount of phenolic and flavonoid compounds shows potential use in the development of enriched food products due to its ability to lower LDL-cholesterol and its high antioxidant capacities [4,31].

3.8. N,N-Dimethyl-P-Phenylendiamine (DMPD)

Figure 8a shows N,N-dimethyl-p-phenylendiamine (DMPD) radical cation decolorization in terms of the degree of scavenging of djulis hulls and roots, which were extracted by using ethanol and water. The method detailed by Rodríguez-Nogales et al. (2011) [18] consisting of an extraction of the antioxidants in the presence of acetate buffer with 0.1 M at pH 5.3 followed this assessment. DMPD radical scavenging activities of the sample increased as the concentration increased. YW, RW, and ROW obtained significantly higher radical scavenging activities as compared to ROE, RE, and YE. At the concentration of 1000 µg/mL, the radical scavenging activities were 88.84 ± 0.01% (YW), 77.92 ± 0.01% (RW), 71.36 ± 0.01% (ROW), 32.44 ± 0.02% (ROE), 17.80 ± 0.01% (RE), 5.42 ± 0.02% (YE). At the concentration of 400 µg/mL, YW showed 58.34 ± 0.01% radical scavenging activities. The DMPD EC50 of red-colored and yellow-colored djulis hulls and roots extracted by using ethanol and water is depicted in Figure 8b. The EC50 of the DMPD assay of red-colored and yellow-colored djulis hulls and roots was 406.4 ± 13.5 µg/mL (YW), 560.3 ± 10.8 µg/mL (RW), 643.8 ± 9.20 µg/mL (ROW), 1483.7 ± 8.98 µg/mL (ROE), 2883.6 ± 14.7 µg/mL (RE), and 8921.5 ± 10.2 µg/mL (YE). The DMPD EC50 for the standard used, ascorbic acid, was 50.28±14.5 µg/mL. A previous study showed that the phenolic acids and phenols soluble in acidic water medium are the main antioxidant compounds of brans and cereal flours [35]. Furthermore, Huang et al. (2019) [4] clarified that the total phytosterols and triterpenes varied according to the different inbred lines of djulis. Additionally, red-colored djulis hulls contained dramatically higher (1.5 times) amounts of triterpenes than yellow-colored djulis hulls.
As can be seen in the antioxidant activities analysis, ethanol extracted red-colored djulis hulls (RE) and water extracted red-colored djulis hulls (RW) presented high amounts of total sugar content, total phenolic content, total flavonoid content, and antioxidant activities. Ethanol extracted red-colored djulis roots (ROE) and water extracted djulis roots (ROW) exhibited moderate content for total sugar, total phenolic, total flavonoids, and antioxidant capacity. Surprisingly, ethanol extracted and water extracted yellow-colored djulis hulls (YE and YW) showed the lowest antioxidant activities as compared to the other samples. However, for the DMPD radical scavenging assay, the results obtained were significantly different from the previous antioxidant capacity analyses (TEAC, FRAP, CUPRAC, and DPPH). This may due to the different antioxidant mechanisms of the antioxidant assays, pigment fraction and concentration of the pigment compounds, and various bioactive compounds involved in the mechanisms of the antioxidant assays. Moreover, Wang et al. (1998) [36] reported that some bioactive components that have 2,2’-Azinobis-(3-ethylbenzthiazoline-6-sulphonate) (ABTS) radical scavenging activities did not exhibit DPPH scavenging activities. Hence, it is important to carry out the antioxidant determination analysis using different antioxidant assays.

4. Conclusions

In conclusion, ethanol extracted red-colored djulis hulls (RE), water extracted red-colored djulis hulls (RW), ethanol extracted yellow-colored djulis hulls (YE), water extracted yellow djulis hulls (YW), ethanol extracted djulis roots (ROE), and water extracted djulis roots (ROW) were isolated to determine the total sugar content, total phenolic content, total flavonoid content, and antioxidant capacity by TEAC, FRAP, CUPRAC, DPPH, and DMPD assays. Red djulis hull extracts exhibited significantly high amounts of total sugar (208.30 ± 19.60 and 794.70 ± 4.18 mg GLU g−1 D.W. for RW and RE, respectively), total phenolic content (35.53 ± 0.44 and 34.59 ± 0.58 mg GAE g−1 D.W. for RW and RE, respectively), total flavonoid content (58.48 ± 2.94 and 149.70 ± 1.96 mg QE g−1 D.W. for RW and RE, respectively), and antioxidant capacity as compared to yellow djulis hulls. Moreover, ROE and ROW were found to have moderate antioxidant capacity. However, limited antioxidant activities were detected in YE and YW. Hence, further investigations on the in vivo antioxidant capacity and the different antioxidant mechanisms are necessary for the djulis hulls and roots. The extracts from biomass of djulis hulls and roots can be applied as eco-friendly antioxidant additives for foods, cosmetics, and bio-products, which will not be harmful to the environment.

Author Contributions

Conceptualization, P.-H.L.; methodology, Y.-J.C.; formal analysis, W.-C.L.; investigation, D.-W.H.; data curation, T.-C.C.; writing—original draft preparation, W.-H.C.; writing—review and editing, X.-B.N.; administration, C.-X.J.; funding acquisition, X.-L.Z. All authors have read and agreed to the published version of the manuscript.

Funding

This research received no external funding.

Conflicts of Interest

The authors declare no conflict of interest.

References

  1. Lee, C.W.; Chen, H.J.; Xie, G.R.; Shih, C.K. Djulis (Chenopodium formosanum) prevents colon carcinogenesis via regulating antioxidative and apoptotic pathways in rats. Nutrients 2019, 11, 2168. [Google Scholar] [CrossRef] [Green Version]
  2. Lu, W.C.; Chan, Y.J.; Tseng, F.Y.; Chiang, P.Y.; Li, P.H. Production and physicochemical properties of starch isolated from Djulis (Chenopodium formosanum). Foods 2019, 8, 551. [Google Scholar] [CrossRef] [Green Version]
  3. Li, P.H.; Lu, W.C.; Hsieh, C.W.; Li, T.C.; Huang, D.W. Rheological properties of dough and quality of salted noodles supplemented with Djulis (Chenopodium formosanum Koidz.) Flour. J. Agric. Sci. 2015, 7, 84. [Google Scholar] [CrossRef] [Green Version]
  4. Huang, C.Y.; Chu, Y.L.; Sridhar, K.; Tsai, P.J. Analysis and determination of phytosterols and triterpenes in different inbred lines of Djulis (Chenopodium formosanum Koidz.) hull: A potential source of novel bioactive ingredients. Food Chem. 2019, 297, 124948. [Google Scholar] [CrossRef] [PubMed]
  5. Iriondo-DeHond, M.; Miguel, E.; Del Castillo, M.D. Food byproducts as sustainable ingredients for innovative and healthy dairy foods. Nutrients 2018, 10, 1358. [Google Scholar] [CrossRef] [Green Version]
  6. Arris, S.; Bencheikh Lehocine, M.; Meniai, A.H. Sorption study of chromium sorption from wastewater using cereal by-products. Int. J. Hydrog. Energy 2016, 41, 10299–10310. [Google Scholar] [CrossRef]
  7. Fava, G.; Di Mauro, M.; Spampinato, M.; Biondi, D.; Gambera, G.; Centonze, G.; Maggiore, R.; D’Antona, N. Hydroxytyrosol recovery from olive mill wastewater: Process optimization and development of a pilot plant. CLEAN—Soil Air Water 2017, 45, 1600042. [Google Scholar] [CrossRef]
  8. Shahidi, F.; Alasalvar, C.; Liyana-Pathirana, C.M. Antioxidant phytochemicals in hazelnut kernel (Corylus avellana L.) and hazelnut byproducts. J. Agric. Food Chem. 2007, 55, 1212–1220. [Google Scholar] [CrossRef] [PubMed]
  9. Slizyte, R.; Rommi, K.; Mozuraityte, R.; Eck, P.; Five, K.; Rustad, T. Bioactivities of fish protein hydrolysates from defatted salmon backbones. Biotechnol. Rep. 2016, 11, 99–109. [Google Scholar] [CrossRef] [PubMed] [Green Version]
  10. Chen, S.Y.; Chu, C.C.; Chyau, C.C.; Yang, J.W.; Duh, P.D. Djulis (Chenopodium formosanum) and its bioactive compounds affect vasodilation, angiotensin converting enzyme activity, and hypertension. Food Biosci. 2019, 32, 100469. [Google Scholar] [CrossRef]
  11. Karadag, A.; Ozcelik, B.; Saner, S. Review of methods to determine antioxidant capacities. Food Anal. Meth. 2009, 2, 41–60. [Google Scholar] [CrossRef]
  12. Datir, S.S.; Mirikar, D.; RaviKumar, A. Sequence diversity and in silico structure prediction of the vacuolar invertase inhibitor gene from potato (Solanum tuberosum L.) cultivars differing in sugar content. Food Chem. 2019, 295, 403–411. [Google Scholar] [CrossRef] [PubMed]
  13. Scaramboni, C.; Urban, R.C.; Lima-Souza, M.; Nogueira, R.F.P.; Cardoso, A.A.; Allen, A.G.; Campos, M.L.A.M. Total sugars in atmospheric aerosols: An alternative tracer for biomass burning. Atmos. Environ. 2015, 100, 185–192. [Google Scholar] [CrossRef]
  14. Xu, G.; Liu, D.; Chen, J.; Ye, X.; Ma, Y.; Shi, J. Juice components and antioxidant capacity of citrus varieties cultivated in China. Food Chem. 2008, 106, 545–551. [Google Scholar] [CrossRef]
  15. Wang, Y.C.; Chuang, Y.C.; Hsu, H.W. The flavonoid, carotenoid and pectin content in peels of citrus cultivated in Taiwan. Food Chem. 2008, 106, 277–284. [Google Scholar] [CrossRef]
  16. Arts, M.J.T.J.; Haenen, G.R.M.M.; Voss, H.-P.; Bast, A. Antioxidant capacity of reaction products limits the applicability of the Trolox Equivalent Antioxidant Capacity (TEAC) assay. Food Chem. Toxicol. 2004, 42, 45–49. [Google Scholar] [CrossRef]
  17. Ozdal, T.; Ceylan, F.D.; Eroglu, N.; Kaplan, M.; Olgun, E.O.; Capanoglu, E. Investigation of antioxidant capacity, bioaccessibility and LC-MS/MS phenolic profile of Turkish propolis. Food Res. Int. 2019, 122, 528–536. [Google Scholar] [CrossRef]
  18. Rodríguez-Nogales, J.M.; Vila-Crespo, J.; Gómez, M. Development of a rapid method for the determination of the antioxidant capacity in cereal and legume milling products using the radical cation DMPD+. Food Chem. 2011, 129, 1800–1805. [Google Scholar] [CrossRef]
  19. Pereira, E.; Encina-Zelada, C.; Barros, L.; Gonzales-Barron, U.; Cadavez, V.; Ferreira, I.C.F.R. Chemical and nutritional characterization of Chenopodium quinoa Willd (quinoa) grains: A good alternative to nutritious food. Food Chem. 2019, 280, 110–114. [Google Scholar] [CrossRef] [Green Version]
  20. Ačanski, M.M.; Vujić, D.N. Comparing sugar components of cereal and pseudocereal flour by GC–MS analysis. Food Chem. 2014, 145, 743–748. [Google Scholar] [CrossRef]
  21. Pico, J.; Martínez, M.M.; Martín, M.T.; Gómez, M. Quantification of sugars in wheat flours with an HPAEC-PAD method. Food Chem. 2015, 173, 674–681. [Google Scholar] [CrossRef]
  22. Di Mauro, M.D.; Tomasello, B.; Giardina, R.C.; Dattilo, S.; Mazzei, V.; Sinatra, F.; Caruso, M.; D’Antona, N.; Renis, M. Sugar and mineral enriched fraction from olive mill wastewater for promising cosmeceutical application: Characterization, in vitro and in vivo studies. Food Funct. 2017, 8, 4713–4722. [Google Scholar] [CrossRef] [PubMed]
  23. Sun, L.C.; Sridhar, K.; Tsai, P.J.; Chou, C.S. Effect of traditional thermal and high-pressure processing (HPP) methods on the color stability and antioxidant capacities of Djulis (Chenopodium formosanum Koidz.). LWT-Food Sci. Technol. 2019, 109, 342–349. [Google Scholar] [CrossRef]
  24. Pang, Y.; Ahmed, S.; Xu, Y.; Beta, T.; Zhu, Z.; Shao, Y.; Bao, J. Bound phenolic compounds and antioxidant properties of whole grain and bran of white, red and black rice. Food Chem. 2018, 240, 212–221. [Google Scholar] [CrossRef] [PubMed]
  25. Vaher, M.; Matso, K.; Levandi, T.; Helmja, K.; Kaljurand, M. Phenolic compounds and the antioxidant activity of the bran, flour and whole grain of different wheat varieties. Procedia Chem. 2010, 2, 76–82. [Google Scholar] [CrossRef] [Green Version]
  26. Walter, M.; Marchesan, E.; Massoni, P.F.S.; da Silva, L.P.; Sartori, G.M.S.; Ferreira, R.B. Antioxidant properties of rice grains with light brown, red and black pericarp colors and the effect of processing. Food Res. Int. 2013, 50, 698–703. [Google Scholar] [CrossRef] [Green Version]
  27. Abderrahim, F.; Huanatico, E.; Segura, R.; Arribas, S.; Gonzalez, M.C.; Condezo-Hoyos, L. Physical features, phenolic compounds, betalains and total antioxidant capacity of coloured quinoa seeds (Chenopodium quinoa Willd.) from Peruvian Altiplano. Food Chem. 2015, 183, 83–90. [Google Scholar] [CrossRef]
  28. Agati, G.; Azzarello, E.; Pollastri, S.; Tattini, M. Flavonoids as antioxidants in plants: location and functional significance. Plant Sci. 2012, 196, 67–76. [Google Scholar] [CrossRef]
  29. Tenuta, M.C.; Deguin, B.; Loizzo, M.R.; Dugay, A.; Acquaviva, R.; Malfa, G.A.; Bonesi, M.; Bouzidi, C.; Tundis, R. Contribution of flavonoids and iridoids to the hypoglycaemic, antioxidant, and nitric oxide (NO) inhibitory activities of Arbutus unedo L. Antioxidants 2020, 9, 184. [Google Scholar] [CrossRef] [Green Version]
  30. Tsai, P.J.; Sheu, C.H.; Wu, P.H.; Sun, Y.F. Thermal and pH stability of betacyanin pigment of Djulis (Chenopodium formosanum) in Taiwan and their relation to antioxidant activity. J Agric. Food Chem. 2010, 58, 1020–1025. [Google Scholar] [CrossRef]
  31. Tsai, P.J.; Chen, Y.S.; Sheu, C.H.; Chen, C.Y. Effect of Nanogrinding on the Pigment and Bioactivity of Djulis (Chenopodium formosanum Koidz.). J Agric. Food Chem. 2011, 59, 1814–1820. [Google Scholar] [CrossRef] [PubMed]
  32. Tang, Y.; Li, X.; Zhang, B.; Chen, P.X.; Liu, R.; Tsao, R. Characterisation of phenolics, betanins and antioxidant activities in seeds of three Chenopodium quinoa Willd. genotypes. Food Chem. 2015, 166, 380–388. [Google Scholar] [CrossRef] [PubMed]
  33. Duh, P.D.; Du, P.C.; Yen, G.C. Action of methanolic extract of mung bean hulls as inhibitors of lipid peroxidation and non-lipid oxidative damage. Food Chem. Toxicol. 1999, 37, 1055–1061. [Google Scholar] [CrossRef]
  34. Sridhar, K.; Charles, A.L. In vitro antioxidant activity of Kyoho grape extracts in DPPH and ABTS assays: Estimation methods for EC50 using advanced statistical programs. Food Chem. 2019, 275, 41–49. [Google Scholar] [CrossRef] [PubMed]
  35. Gökmen, V.; Serpen, A.; Fogliano, V. Direct measurement of the total antioxidant capacity of foods: The ‘QUENCHER’ approach. Trends Food Sci. Technol. 2009, 20, 278–288. [Google Scholar]
  36. Wang, M.; Li, J.; Rangarajan, M.; Shao, Y.; LaVoie, E.J.; Huang, T.C.; Ho, C.T. Antioxidative phenolic compounds from Sage (Salvia officinalis). J. Agric. Food Chem. 1998, 46, 4869–4873. [Google Scholar] [CrossRef]
Figure 1. Total sugar content of djulis hull and root samples. Data are expressed as the mean ± SD (n = 3). Different letters above the bars indicate a significant difference (p < 0.05).
Sustainability 12 05926 g001
Figure 2. Total phenolic content of djulis hull and root samples. Data are expressed as the mean ± SD (n = 3). Different letters above the bars indicate a significant difference (p < 0.05).
Sustainability 12 05926 g002
Figure 3. Total flavonoid content of djulis hull and root samples. Data are expressed as the mean ± SD (n = 3). Different letters above the bars indicate a significant difference (p < 0.05).
Sustainability 12 05926 g003
Figure 4. Trolox equivalent antioxidant capacity (TEAC) of djulis hull and root samples. Data are expressed as the mean ± SD (n = 3).
Sustainability 12 05926 g004
Figure 5. Ferric reducing antioxidant power (FRAP) of djulis hull and root samples. Data are expressed as the mean ± SD (n = 3).
Sustainability 12 05926 g005
Figure 6. Cupric reducing antioxidant capacity (CUPRAC) of djulis hull and root samples. Data are expressed as the mean ± SD (n = 3).
Sustainability 12 05926 g006
Figure 7. (a) DPPH free radical scavenging activities of djulis hull and root samples and (b) EC50 of DPPH free radical scavenging activities of djulis hull and root samples. Data are expressed as mean ± SD (n = 3). Different letters above the bars indicate a significant difference (p < 0.05).
Sustainability 12 05926 g007
Figure 8. (a) DMPD radical scavenging activities of djulis hull and root samples and (b) EC50 of DMPD radical scavenging activities of djulis hull and root samples. Data are expressed as mean ± SD (n = 3). Different letters above the bars indicate a significant difference (p < 0.05).
Sustainability 12 05926 g008

