1. Introduction
Golf has become a sport with unsuspected economic outcomes in the last decades. Despite the economic turndown, this industry went on growing at a robust pace.
According to the National Golf Foundation [
1], golf is an
$84 billion industry continuously changing due to cultural and behavioural shifts. More than one-third (36%) of the U.S. population played, watched, or read about golf in 2018.
Recent studies reported that Europe owns the second largest regional share, representing 23% of the world’s total. England is the number one golfing country in Europe with 2270 golf courses and 31,620 golf holes (25% of courses in Great Britain and Ireland are 9-hole). Germany takes the second place with 1050 golf courses, followed by France (804), Sweden (662), and Scotland (614). Spain comes sixth in the ranking, with 497 golf courses, 7071 holes, 471 facilities, and 269,853 federative licenses (71.73% men/28.26% women) [
2,
3].
More than 60 million people playing golf on a regular basis leads us to describe the sport as massive. Each year, more women and children begin to play golf, emphasising the social importance of the activity. Moreover, it constitutes a business area of rising importance, not only linked to touristic services, but also associated to a huge number of positions in different organisations [
1,
4].
In view of the above described data, a strategic marketing plan appears sensible [
5]. Nevertheless, it should take different features into consideration, such as management, promotion, keeping the loyalty of existing customers, and winning over new ones, as well as market segmentation analyses [
6,
7,
8,
9].
Customers’ orientation, continuous improvements, and determined efforts to reach quality appear as the pathway to achieve sustainability and survival. Therefore, there is a growing need for a reliable and valid feedback on the customer’s satisfaction, as well as one regarding perceived quality linked to facilities and services [
10,
11].
However, assessing perceived quality service in actual situations represents a major challenge. It implies the previous formulation of a model involving the service core dimensions. Certainly, testing its fit in the field is mandatory. That will guarantee the measures’ adequate psychometric features, such as sound validity and reliability evidence. Moreover, the former requires taking a standpoint in one of the central debates in quality management: Either picking universal measures or, conversely, using a contingency approach, developing specific scales for each service to be assessed.
In general, the ones who prefer universal assessment scales usually pick the scale by Parasuraman, Zeithaml, and Berry [
12], and Cronin and Taylor [
13], suitable to be used in different populations [
14,
15,
16]. Notwithstanding, most authors choose the contingency approach, aimed at developing highly specific scales [
17,
18,
19].
Regarding golf, measurement has become especially valued, particularly in view of the regulations and quality standards in force in the area. Despite the importance achieved by the notion of golf service quality, current literature shows a lack of scales with adequate psychometric features. Whilst a body of research was mainly focused on analysing the golf-tourist behaviour [
20,
21,
22,
23], very few studies were aimed at specifically examining golf services [
24,
25,
26]. Since both types of studies consist chiefly of exploratory methods, developing valid and reliable scales to measure the user’s perceptions arise as a matter of interest for quality management. Furthermore, the user satisfaction and the service perceived value related to other factors—such as the intention of coming back, the effect of gender, the expertise or handicap—also appear as paramount [
27,
28,
29,
30,
31]. The study of these variables, added with some new ones, will be useful to describe the users’ satisfaction and the effect of the perceived impact on the likelihood of using the service furtherly [
32].
The above mentioned suggests that the main way to achieve the users’ satisfaction might vary in a substantial way from case to case according to the target group. This study is aimed at analysing construct validity and criterion validity evidences of the QGolf scale, regarding every type of golf course: 18-hole, 9-hole, pitch and putt, Private, Mixed, Commercial, and Public—not only 9-hole courses, as in the results reported by Serrano et al. [
9]. Moreover, it is also aimed at examining potential relations between the client satisfaction and some other variables of interest (Gender, Handicap, Number of Holes in the course, and Type of Club).
Once its psychometric features are adequate, the scale will be useful for research and marketing fields as a proper assessment resource. This feedback information will lead to reach an accurate diagnosis of the current situation, in order to plan efficient marketing strategies. That will also let an efficient performance track, comparing organisations within the golf industry.
2. Materials and Methods
2.1. Participants
968 users of 13 golf courses from Galicia—north-western Spain—including private, mixed, commercial, and public clubs with golf courses of 9 and 18 holes, and pitch and putt, composed the sample (82.2% men, 17.8% women). The mean age was 47.58 (S.D. = 12.51), though more than 50% of the participants were between 41 and 60 years old (
Table 1). Players of all levels were included. However, most of them (31.8%) showed handicaps between 11.6 and 18.4. Around 59.7% of the participants in the whole sample were members of a club, and usually played with friends (66.7%), mostly weekly (87.5%). A mixed interview-questionnaire method was employed.
Participation was voluntary. A written informed consent was signed, emphasising confidentiality and anonymity guaranties. The research protocol followed the principles stated in the Declaration of Helsinki regarding research involving human subjects (64th World Medical Assembly, 2013). The study was endorsed by the management board of the golf courses as well as by the Ethics local Committee.
2.2. Procedure
Data were gathered by means of a structured interview comprising the scale here introduced, framed on a wider questionnaire. Such procedure was carried out in the facilities of the selected clubs, with prior authorisation from the managers. Respondents were selected using a convenience sample whilst they were arriving or leaving. Due to of the lack of randomisation, data were collected in different days and at different times of the day to improve the sampling quality.
Each interview lasted about 15 min and were conducted by assistant researchers, not related to the clubs in any possible way. They possessed expertise in that type of studies, and were especially trained to perform the assessment process—all of them attended training sessions in order to establish a unique procedure to be followed.
Data gathering was carried out by means of a structured scale (
Table 2) including the original 25-item/4-dimension-scale. It was developed to measure Service Quality [
25].
In this case, Service Quality was composed of four dimensions:
Staff Professionalism: Referred to productivity and proactivity, developing a professional image, being a problem solver, showing integrity.
Management: Alluding to the activities involved in organisational management (planning, managing resources to achieve certain goals accurately, leading, organising, controlling).
Facilities: Regarding physical features of the centre or building where the golf club is located.
Course: Involving the area where the golf game is played.
The response scale was a 5-point-Likert ranging from 1 (Very Bad) to 5 (Very Good).
Three extra items were added in order to analyse criterion validity evidence for the 25-item-scale. They asked about (1) the Overall Assessment on the club (ranging from (1) Very Bad to (5) Very Good); (2) confirmation of Expectations (ranging between (1) Much worse than Expected to (5) Much better than expected). Independently, (3) the customer´s Overall Satisfaction (using a Likert scale between 0 and 10) was assessed.
Additional demographic and sport-practice variables such as gender and handicap were requested to explore potential differences among target-groups.
2.3. Data Analysis
First, descriptive statistics for each item were calculated. Second, a Confirmatory Factor Analysis (CFA) was conducted to analyse construct validity evidence of the scale. Third, in order to examine the relation between the quality assigned to the dimensions referred to the service and the club global performance, a causal analysis of covariance structures was carried out. The dimensions of perceived quality were used as predictors, and the three performance indicators as criteria. Such analysis refers to criterion validity evidence on the scale’s scores. Fourth, the internal consistency of the scores were calculated for the whole scale as well as for each dimension (Cronbach’s Alpha and Composite Reliability coefficients). Finally, discriminant validity was analysed following the Fornell and Larcker criterion [
33]. IBM SPSS Statistics 24 and IBM SPSS Amos 24, IBM Corp: Armonk, NY, USA, 2016, were employed to calculate statistical analyses.
3. Results
3.1. Descriptive Analysis
Table 3 summarises descriptive statistics for the 25 initial items (means and standard deviations, standardised skewness and kurtosis values, plus corrected homogeneity indices—cHI for each item). cHI indicates the item homogeneity regarding the rest of them, since it reports the correlation between each item and the total score, leaving out that item influence. Such calculation contributes to the general evaluation of the scale´s internal consistency.
The item showing the highest mean (4.29) was Golf Teacher’s Professionalism (#5), thus obtaining the best evaluation. It was followed by #14, Kindness and Treat (4.26), and #21, Golf Course Conservation (4.22). The lowest means corresponded to #9, Management of Complaints and Suggestions (3.43), #22, Game Control (3.54), and Organisation and Management of Resources, #7, (3.56). Standard deviations moved around 1 or lower, verifying the low variability of scores. Most items exhibited a high internal consistency regarding the dimension which they hypothetically belong to (cHI over 0.50), except for item #5, (cHI = 0.32). Kurtosis values indicated a mesokurtic distribution only for 14 out of the 25 items. Such results, added to a clearly negative skewness, introduced some doubts on the normality of the distribution. Moreover, Mardia´s coefficient reached the value of 85.27, endorsing the rejection of the multivariant normality hypothesis.
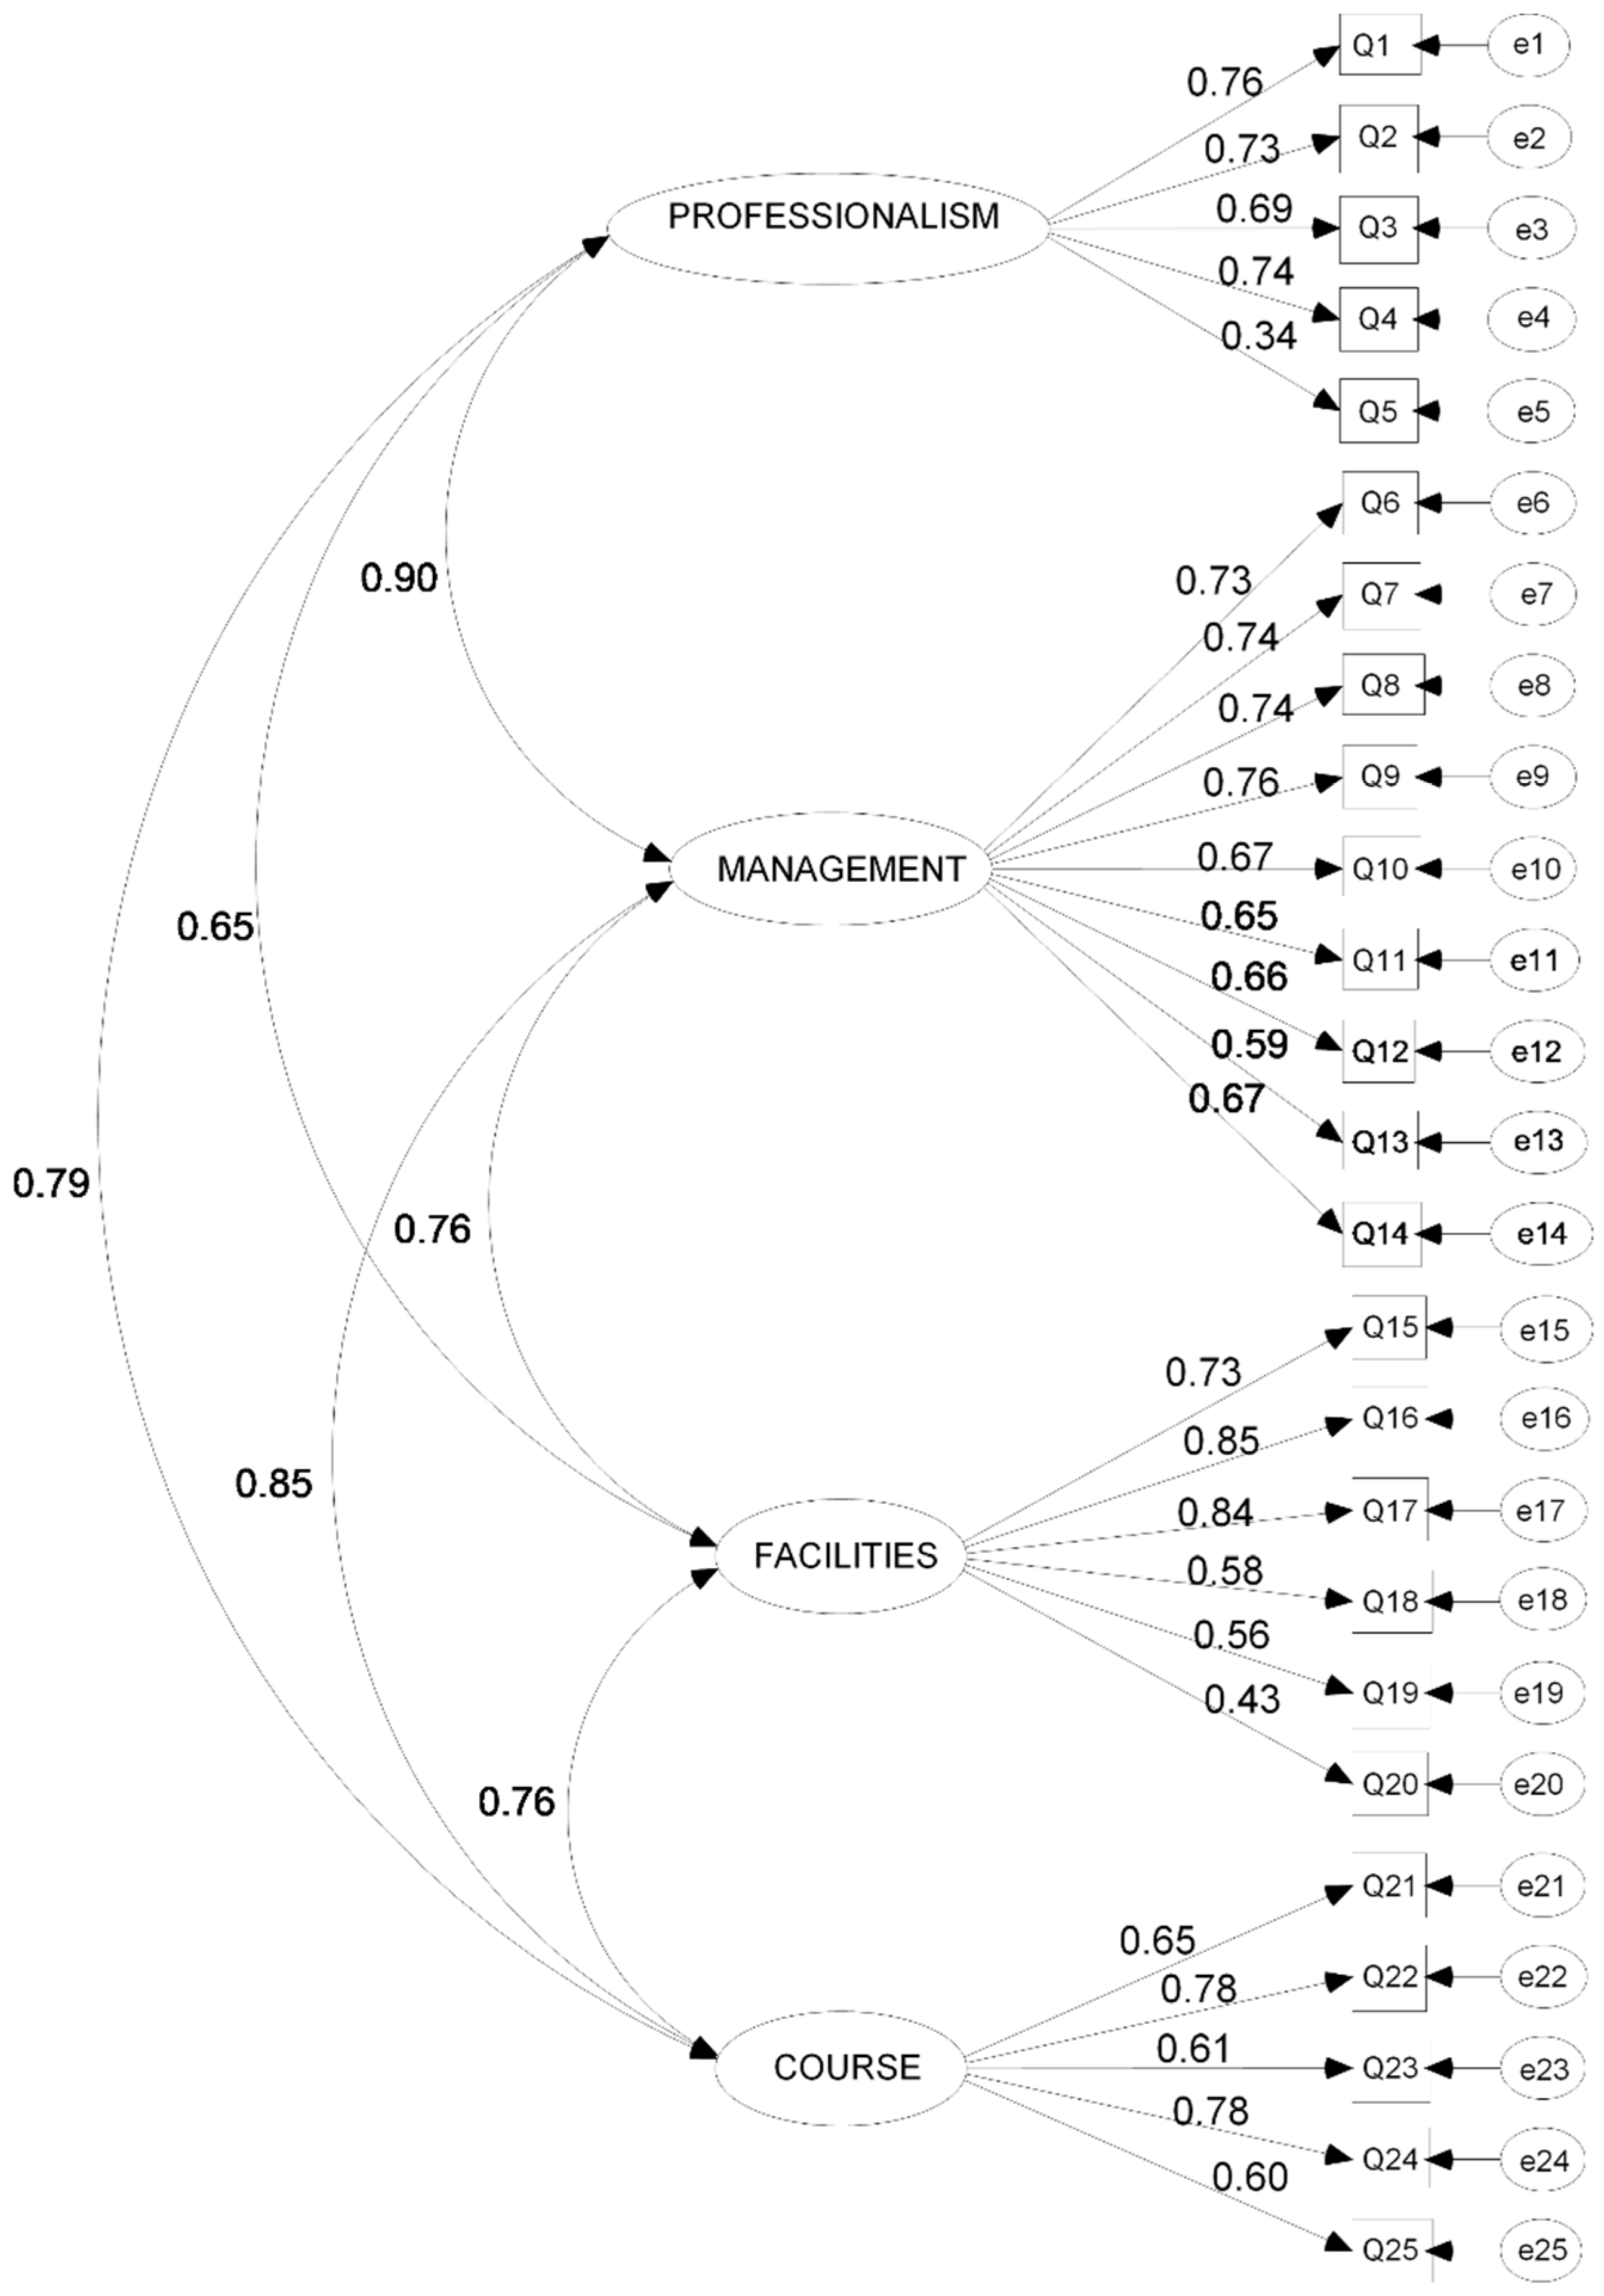
3.2. Factor Analyses
Following the 4-factor model reported by Serrano et al. [
9], a first level Confirmatory Factor Analysis (CFA) was carried out in order to analyse the internal structure of the scale. Despite the lack of normality, parameters were estimated using Maximum Likelihood method (ML)—Curran, Westn and Finch [
34], and Tomas and Oliver [
35] pointed out its reasonable robustness when the assumptions compliance is not verified in big samples. In any case, possible estimation biases might produce a worse fit compared to the real one. Anyway, other complementary estimation procedures were calculated: GLS (Generalized Least Squares), ULS
(Unweighted Least Squares), and ADF (Arbitrary/Asymptotic Distribution Free), obtaining similar results. Standardised estimated parameters are reported in
Figure 1.
All the estimated parameters were statistically significant (
p < 0.01), though in some cases factor loadings (λ) exhibited discrete values, as in item #5, assessing Golf Teacher’s Professionalism (λ = 0.35). As for the model fit, the sensitivity of the chi-square statistic regarding variations in the sample size hinders the adequate global fit when big samples are employed, as in this case. Paying regard to it, Brown [
36] and Byrne [
37] recommend the simultaneous use of several indices in order to get a more accurate evaluation of the model fit: GFI (Goodness of Fit Index), AGFI (Adjusted Goodness of Fit Index), RMSEA (Root Mean Square Error of Approximation), CFI (Comparative Fit Index), NFI (Normed Fit Index), and TLI (Tucker Lewis Index). Following Steiger [
38], for RMSEA, a 90% confidence interval was also included.
As stated in
Table 4, the global fit of the scale to the original theoretical model was poor.
That poor fit, along with modification indices obtained by means of the statistical package—reporting cross-loadings for some items—as well as a close analysis of the residuals matrix led to the re-specification of the initial model. Some items were removed: (1) Management professionalism, Receptionist professionalism, Greenkeeper’s professionalism, and Golf’s Teacher professionalism were removed from the Staff and Professionalism dimension; (2) Management involvement, Safety and risk prevention, Environmental management, Correspondence with other clubs, Kindness and treat were eliminated from the Management dimension; (3) Cleaning and general sanitation was removed from the Facilities dimension; and (4) Golf School and Course State was eliminated from the Course dimension.
Consequently, the resulting scale was reduced to 15 items, now grouped into only 3 dimensions: Staff and Management (7 items), Facilities (4 items), and Golf Course (4 items). Modification indices suggested, besides, two courses of action. On the one hand, setting free the parameters estimating standard errors associated to items #2 and #4 (δ2–δ4) and, on the other hand, doing the same with the parameters estimating the correlation between standard errors associated to items #18 and #19 (δ18–δ19). Significant values were found in both cases. Such decisions seemed to work from a theoretical standpoint: Item #2 refers to the “receptionist”, whilst #4 alludes to “master caddie”. However, in most of these facilities, particularly the low-budget ones, both roles are played by the same person. As for items #18 and #19 mentioning “the clubhouse” and “dressing rooms”, that gathering appeared as reasonable because dressing rooms habitually belong to the variety of services offered by the clubhouse. The re-specified model and the estimated parameters are summarised in
Figure 2.
As Kline [
39] recommends, all factor loadings (λ) moved above 0.60. Besides, goodness of fit indices considerably improved, reaching acceptable values [
36]. For instance, GFI, CFI, NFI and TLI were over 0.94, with an AGFI higher than 0.90. In addition, RMSEA 0.055 was below the limit of 0.06 suggested by Hu and Bentler [
40].
Two additional procedures were conducted to analyse additional evidence on the structure stability. First, an attempt of cross-validation was carried out, splitting the sample into halves by random procedures, comparing the fit achieved by each half. As
Table 4 shows, results were similar in both cases. Moreover, a Bootstrap procedure for 500 different samples was run, obtaining significant parameters in every case, with a reduced interval (
Table 5).
The high correlations between factors (0.70, 0.73, and 0.82) indicated convergent validity evidences, reinforcing the feasibility of calculating a global average value to express perceived service quality. The Fornell and Larcker criterion [
33] added evidences in line with the above, since the extracted variance (EV) for each factor (EVStaff and Management = 0.51; EVFacilities = 0.52; EVGolf Course = 0.50) was lower than the correlation between factors in each case.
3.3. Causal Covariance Structure Analysis
As for internal consistency, Cronbach’s α coefficients were calculated for the total score (α Total = 0.91) and for each dimension (α Staff = 0.88; α Facilities = 0.80; α Golf Course = 0.79). Results were adequate, especially for factors 2 and 3, which include a low number of items (4 in each case). Equal values were obtained when the Composite Reliability coefficients were calculated (Staff Management = 0.88; Facilities = 0.81; Golf Course = 0.79).
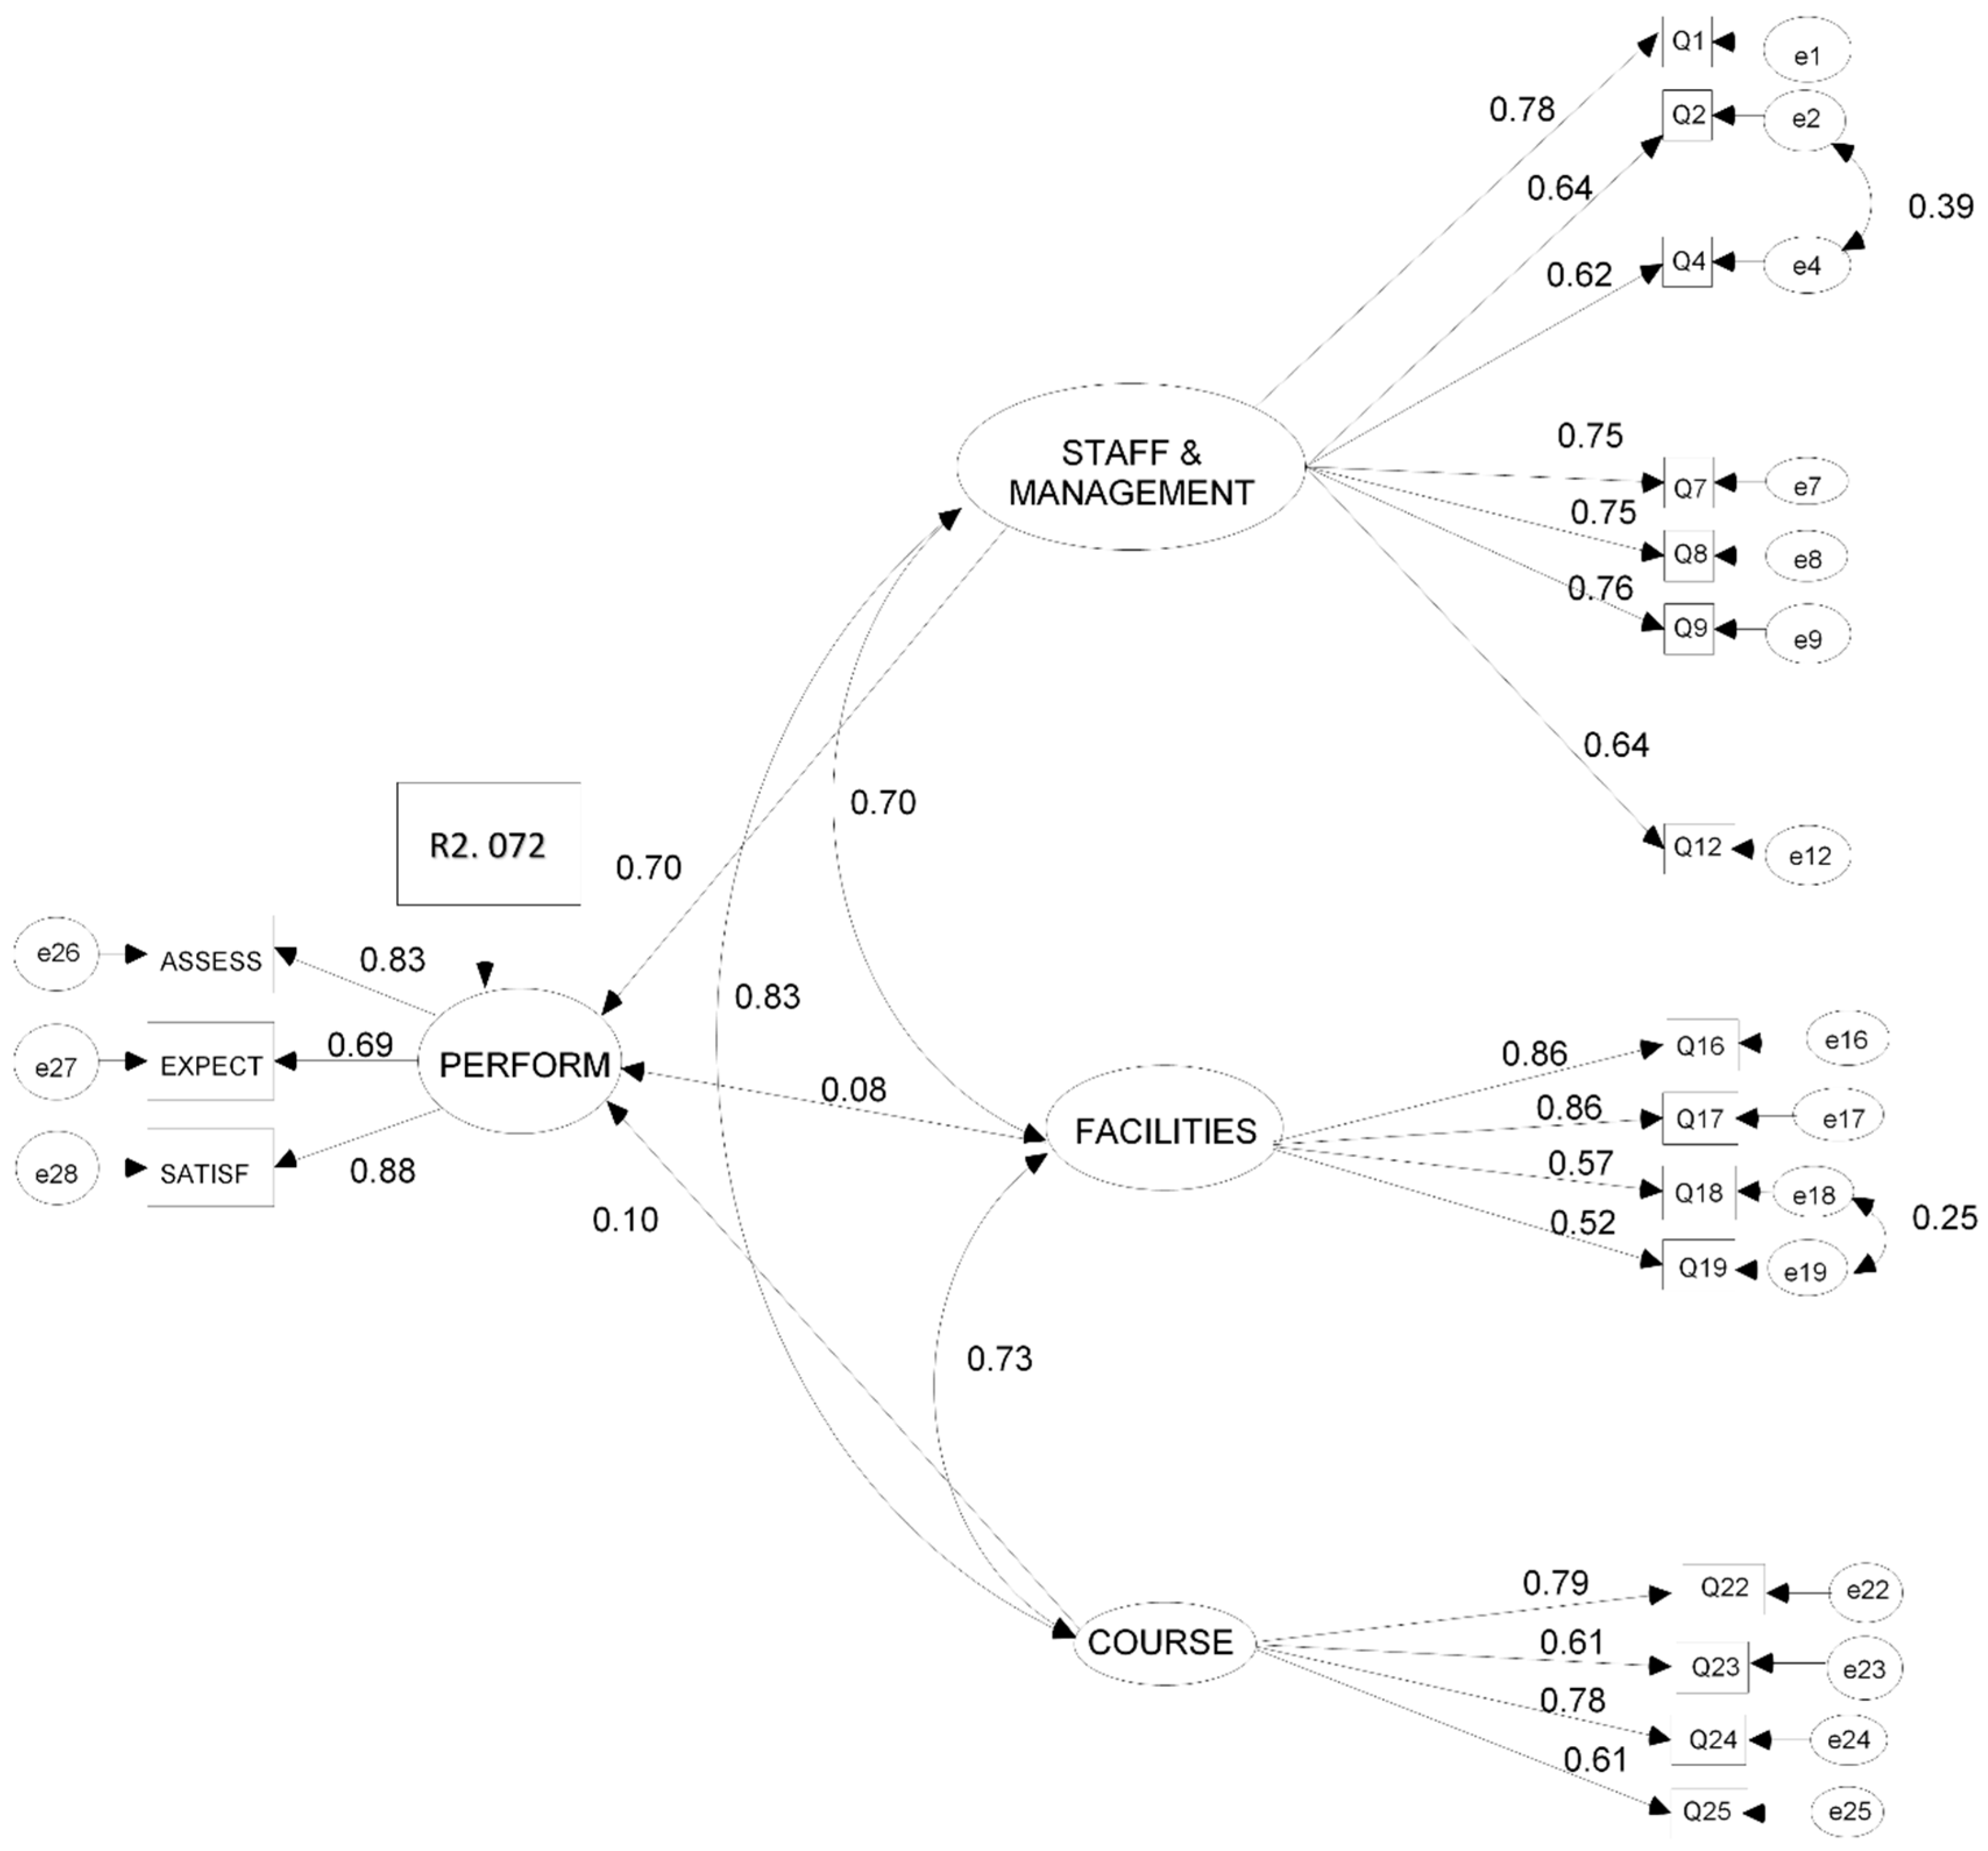
Regarding criterion validity evidence, the relation between Perceived Quality and Performance reached by the club from the user’s viewpoint was analysed. A causal covariance structure analysis was conducted. Performance was used as the criterion or Dependent Variable, represented by three indicators or observed variables (Overall Assessment, Confirmation of Expectations, and Overall Satisfaction), following previous studies, such as Alonso et al. [
17]. The three final dimensions of the scale were used as predictors or Independent Variables. The Maximum Likelihood (ML) method was employed once again. The estimated parameters are summarised in
Figure 3.
Though the model´s explanatory power was high (R
2 = 0.72), not all the parameters were statistically significant (
p < 0.05). Specifically, the weight assigned to Facilities exhibited that lack of significance (γ = 0.08; t = 1.58;
p = 0.11), hence the model re-specification arose as an imperative. The estimated parameters for this new model are shown in
Figure 4.
In this case, all the parameters were significant, and the model fit to empirical data was high, slightly improving the observed results for the initial model (
Table 6).
As a matter of fact, the suppression of one out of three dimensions (Facilities) slightly diminished the explanatory power of the model: 71% of variance in Performance has been explained (R2 = 0.71). Furthermore, the highest regression coefficient for Staff & Management (γ = 0.73) clearly revealed its higher weight, particularly higher than the one obtained by Golf Course (γ = 0.14).
The final version scale, named QGolf (revalidation of the Qgolf−9 Scale [
25], now for users of different types of golf courses), obtained adequate psychometric indices verifying satisfactory construct and criterion validity evidence as well as internal consistency results (
Table 7).
3.4. Causal Covariance Structure Analysis by Groups
Finally, in order to explore whether the way to reach the users’ satisfaction might be different depending on the target groups which they belong to, the sample was split into different groups using split variables like Gender (Men vs. Women), Handicap (<20 vs. ≥20, establishing handicap 20 as the mean of game expertise), Number of Holes in the course (9 vs. 18), and Type of Club (Social, Commercial, Public, and Mixed). Results are shown in
Table 8.
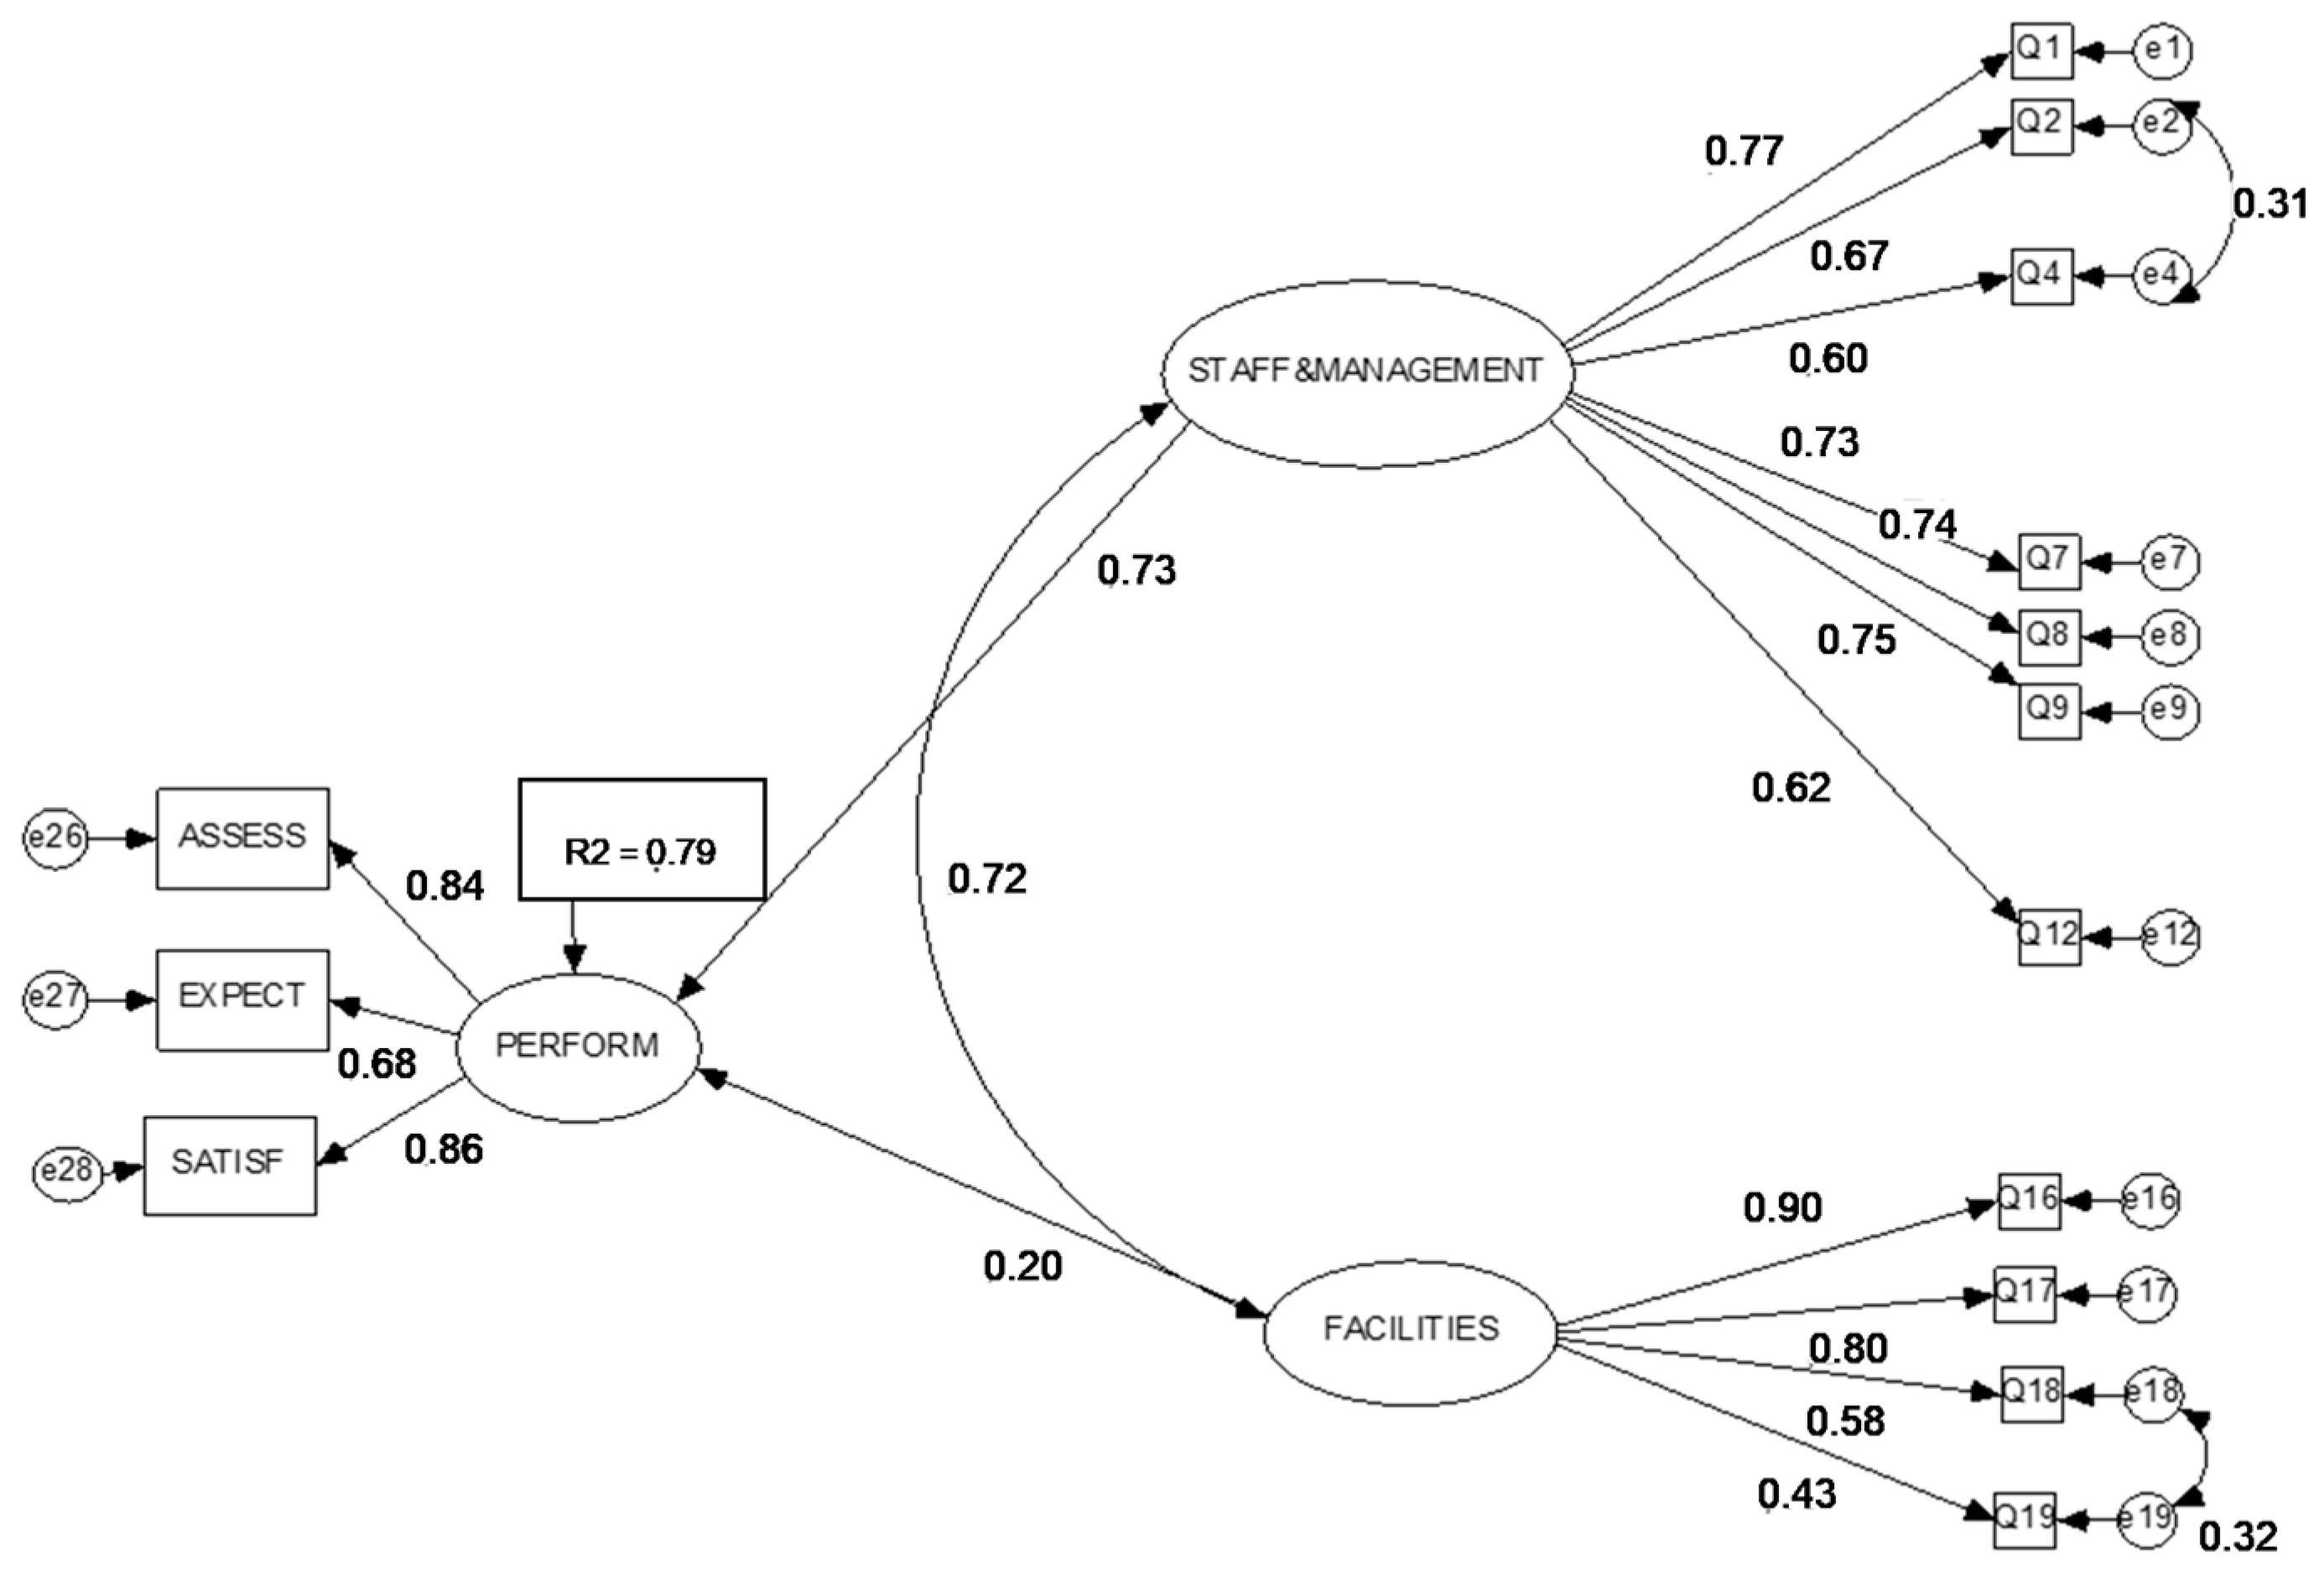
It is worth mentioning that the model global fit swings depending on the target group. This finding put forward the possibility that the pathway to get user satisfaction may vary considerably from case to case. In fact, regression coefficients (γ) associated with the scale’s dimensions differ within target groups. Results obtained according to Handicap might be used as a good example (
Figure 5 and
Figure 6).
Results are partially different for each group: Group 1 (golf players with a Handicap ≥ 20 or beginners) and Group 2 (golf players with a Handicap < 20 or advanced golf players). For beginners, the explanatory power of the model was 0.79, with two significant predictors: Staff & Management on the one hand (γ = 0.73), and Facilities (γ = 0.20) on the other. For advanced golf players, even though Staff & Management remained as the most important dimension (γ = 0.64), Golf Course was the next predictor with significance (γ = 0.22), instead of Facilities (p > 0.05) as reported for beginners. Additionally, the explanatory power of the model was lower (R2 = 0.69). Such differences could be due to different needs and expectations in each considered target group.
4. Discussion
The final version scale here introduced, QGolf (for users of different types of golf courses), obtained adequate psychometric indices encompassing construct validity evidence calculated by factorisation procedures, internal consistency analyses, and criterion validity evidence. As a result, a further regression equation verified the QGolf’s accurate power to explain the club’s performance. Such a notion is defined as a summary of the overall assessment on the club, the customer satisfaction, and the degree of expectations compliance. The scale’s briefness (only 15 items) makes it a useful resource in field marketing. Thereby, the final version scale is now available to be employed by professionals in this area, since it is a simple assessment of the club performance, and efficient for detecting areas feasible to be improved.
The causal analysis of covariance structure leads to state that the human [
26] and organisational dimension of the service (Staff and Management) becomes the main axis on which perceived quality rests, even beyond facilities or, furthermore, the golf course itself.
These results go in line with those reported by Serrano et al. [
25] in a study conducted exclusively in 9-hole golf courses. They are also consistent with other reports [
6,
11,
17], which verified that the staff plays a key role in achieving an accurate explanation of customer satisfaction.
In addition, these findings reinforce suggestions made by Hwang and Won [
30] and Won, Hwang, and Kleiber [
41]: The golf course conditions and facilities are, in general, the dimensions which better explain the user’s preferences. Results here discussed are also useful to underline the need of differentiating two dimensions involved in physical features and tangible elements: Those concerning Golf Course technical conditions and those regarding general Facilities. Thus, the golf course and their technical notes become especially valuable for advanced golf players. Consequently, they make a significant impact on the users’ final satisfaction, on the perceived impact, and on further willingness to come back [
32].
Moreover, even though the Facilities dimension did not obtain a statistically significant weight in the causal analysis, it should not be interpreted as irrelevant from the user’s viewpoint. Neglecting such an issue could lead to underestimating the overall assessment on the service [
42].
Tangibles and empathy are essential dimensions for service quality when the goal is identifying satisfaction according to the target-group—e.g., women pay more attention to physical features, cleaning, and assistance [
31]. This study found that the model´s explanatory power is higher for golf players with Handicap ≥ 20 than the one for players with Handicap < 20. Therefore, the strategy to increase the users’ satisfaction should be quite different depending on whether they are beginners or advanced players [
26,
27,
28]. For instance, neglecting technical features of the Golf Course will be riskier when dealing with advanced players (low handicap) compared to beginners: The latter would be likely more aware of the facilities general comfort than of technical details.
According to Howat et al. [
8], being flexible enough to adapt business to some specific context of service quality is essential. The nature of each sport and leisure service is, in fact, diverse. Even more, the users’ perceptions do show substantial differences.
Due to the above mentioned, managers must be aware of the competitive context they must deal with. Achieving sustainability and survival depends on paying close attention to the variety of users´ profiles, their specific needs, and the different target groups in view of the golf course’s interests.
5. Conclusions
The study introduces a psychometric and a theoretical contribution, potentially useful for the field marketing. In consistency with quality or excellence models, such as EFQM (European Foundation for The Quality Management) or TQM (Total Quality Management), the causal analysis verified that the human and managerial dimension of the service is central when assessing perceived quality in organisations. Such findings imply that a major emphasis in selection policies and continuous training, as well as on strategies to foster the staff motivation, is crucial.
The results show that strategies aimed at achieving the users’ satisfaction should vary according to the target group as well. This is a contribution to get better insights on how the users develop their judgments about quality service, adding valuable information referring to the specific requirements for each target group, such as the golf player’s expertise. The above mentioned reinforces the idea of an oriented-to-the-client strategic management as the masterplan for the growth or even the survival of the organisation. Conducting efficient communication, promotion, and loyalty policies is critical to achieve a competitive edge.
Finally, the current study underlines the need of a continuous service quality assessment. It is a dynamic and complex issue and also a key indicator of the organisation performance. The scale here introduced intends to represent a contribution for a market sector where properly analysed assessment scales are scarce. Due to sampling limitations, QGolf psychometric features were not analysed in different countries and different demographic target groups. Further research should be carried out to address these matters.


 ,
, 


