Spatiotemporal Variation of Vegetation Coverage and Its Response to Climate Factors and Human Activities in Arid and Semi-Arid Areas: Case Study of the Otindag Sandy Land in China


Abstract
:1. Introduction
2. Data and Methods
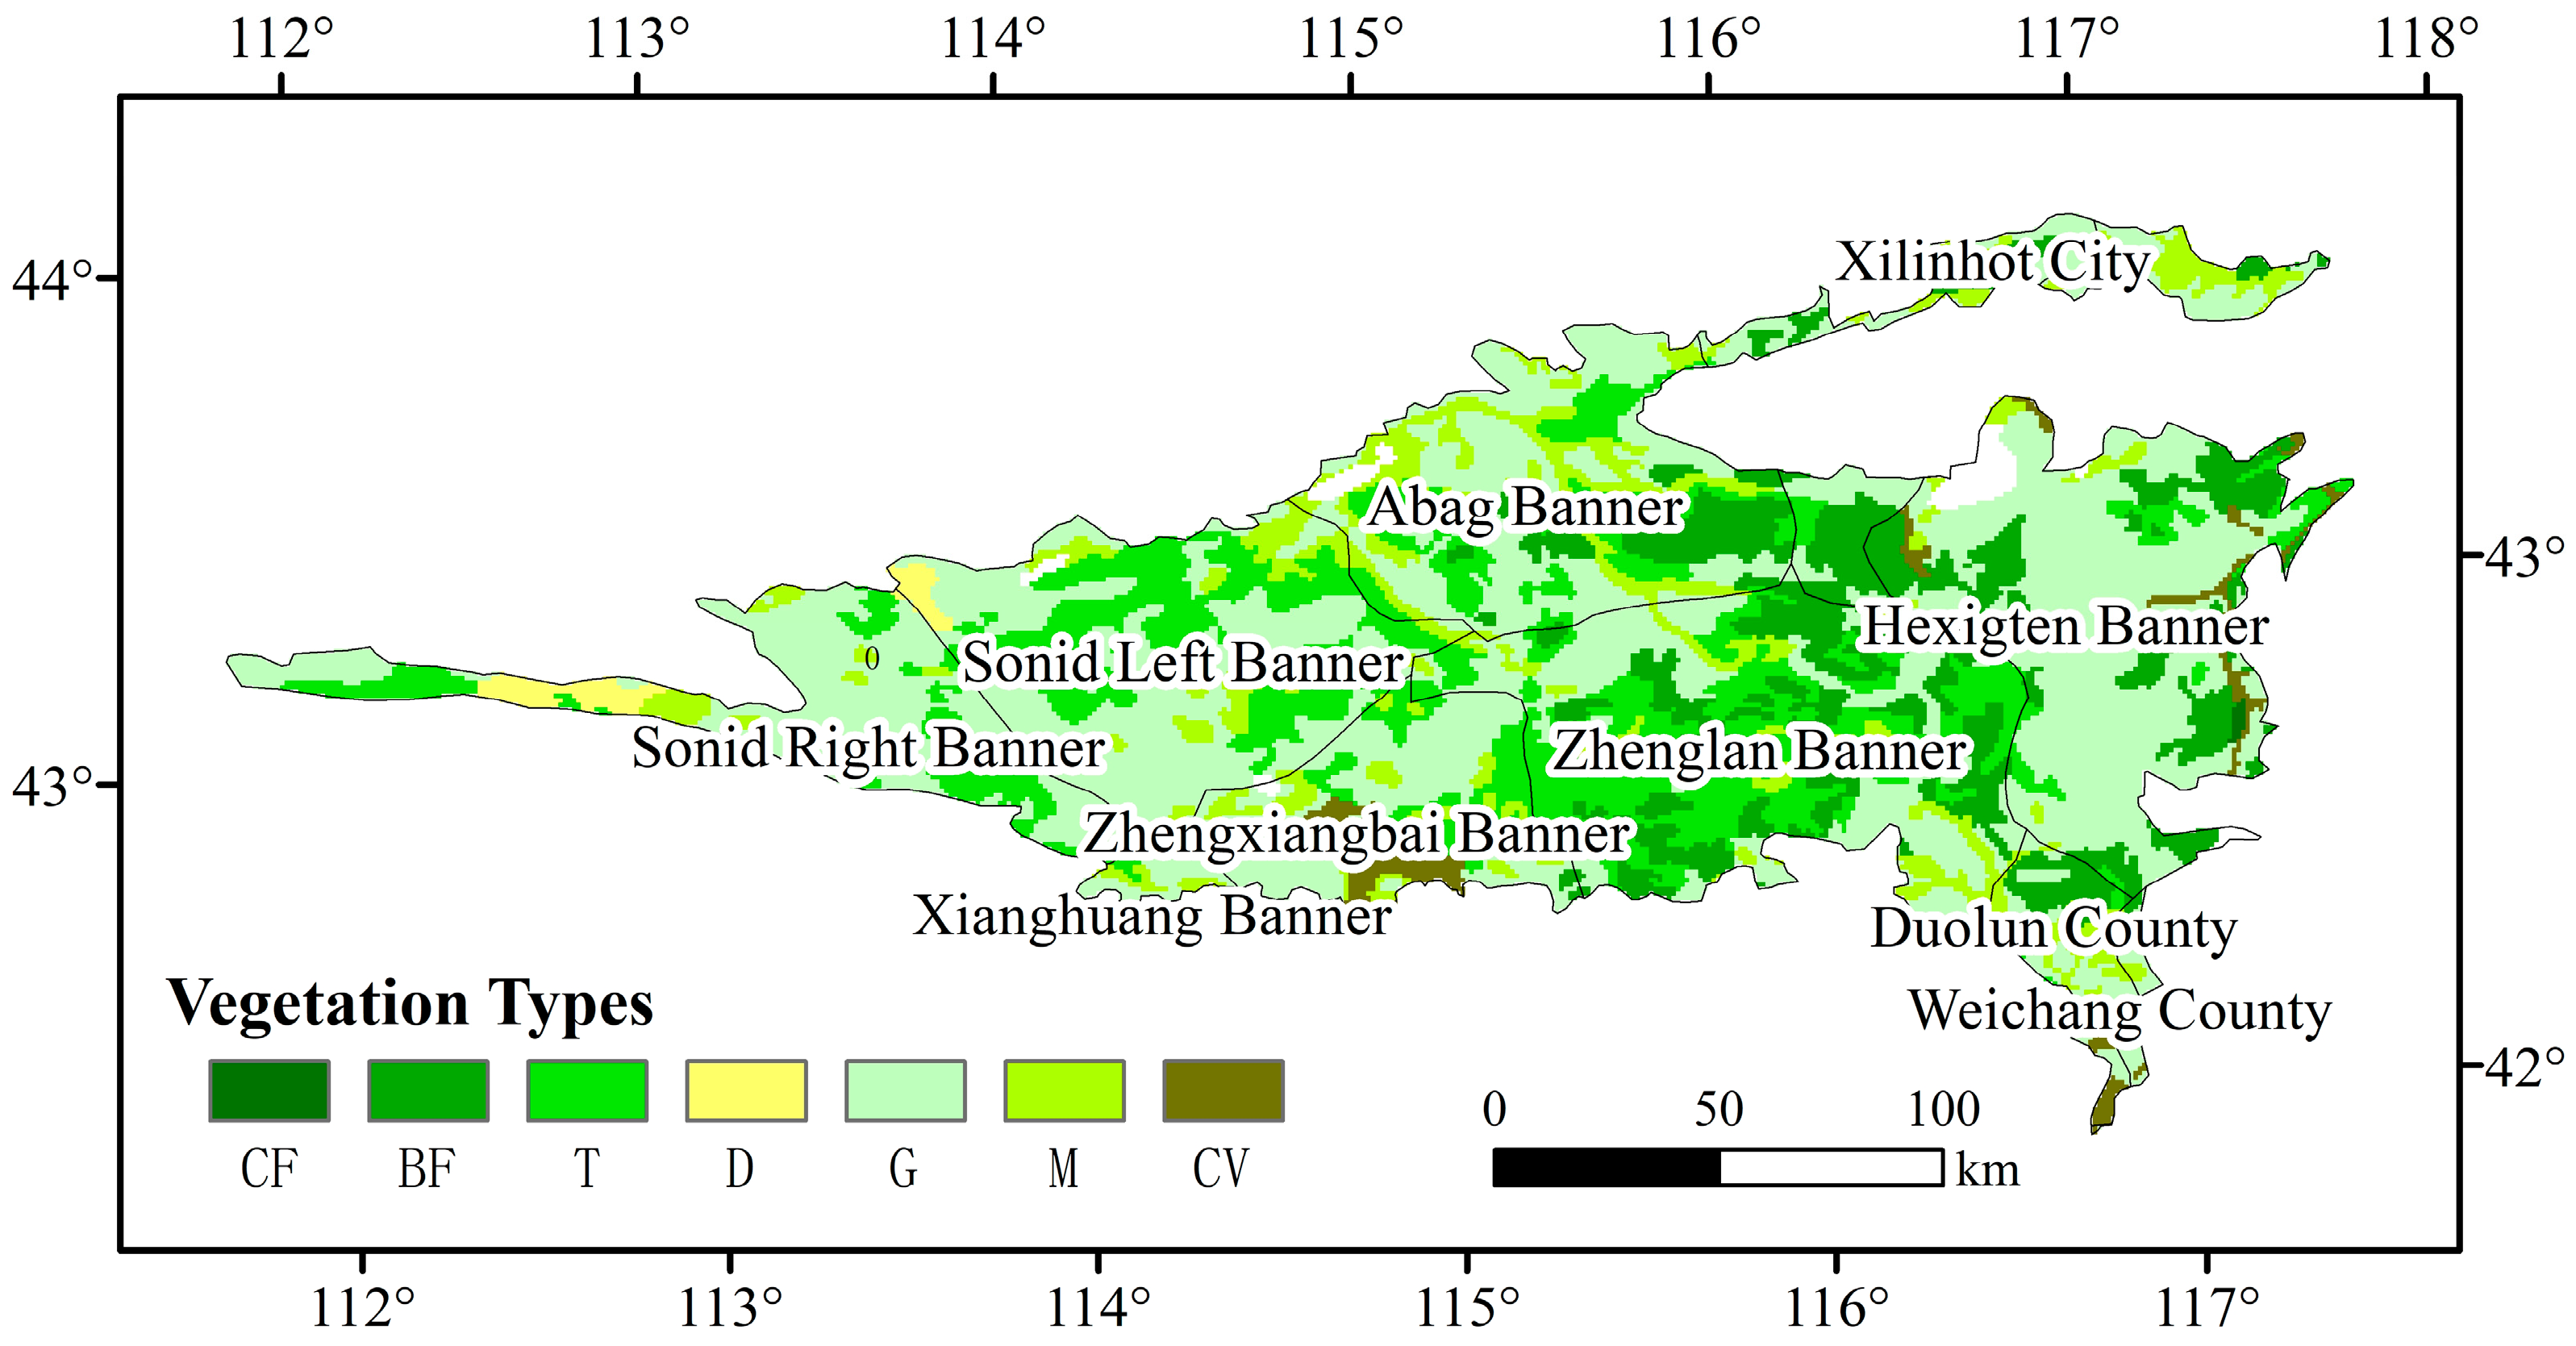
2.1. Study Area
2.2. Data Source and Pretreatment
2.3. Research Methods
2.3.1. Trend Analysis of Vegetation Coverage
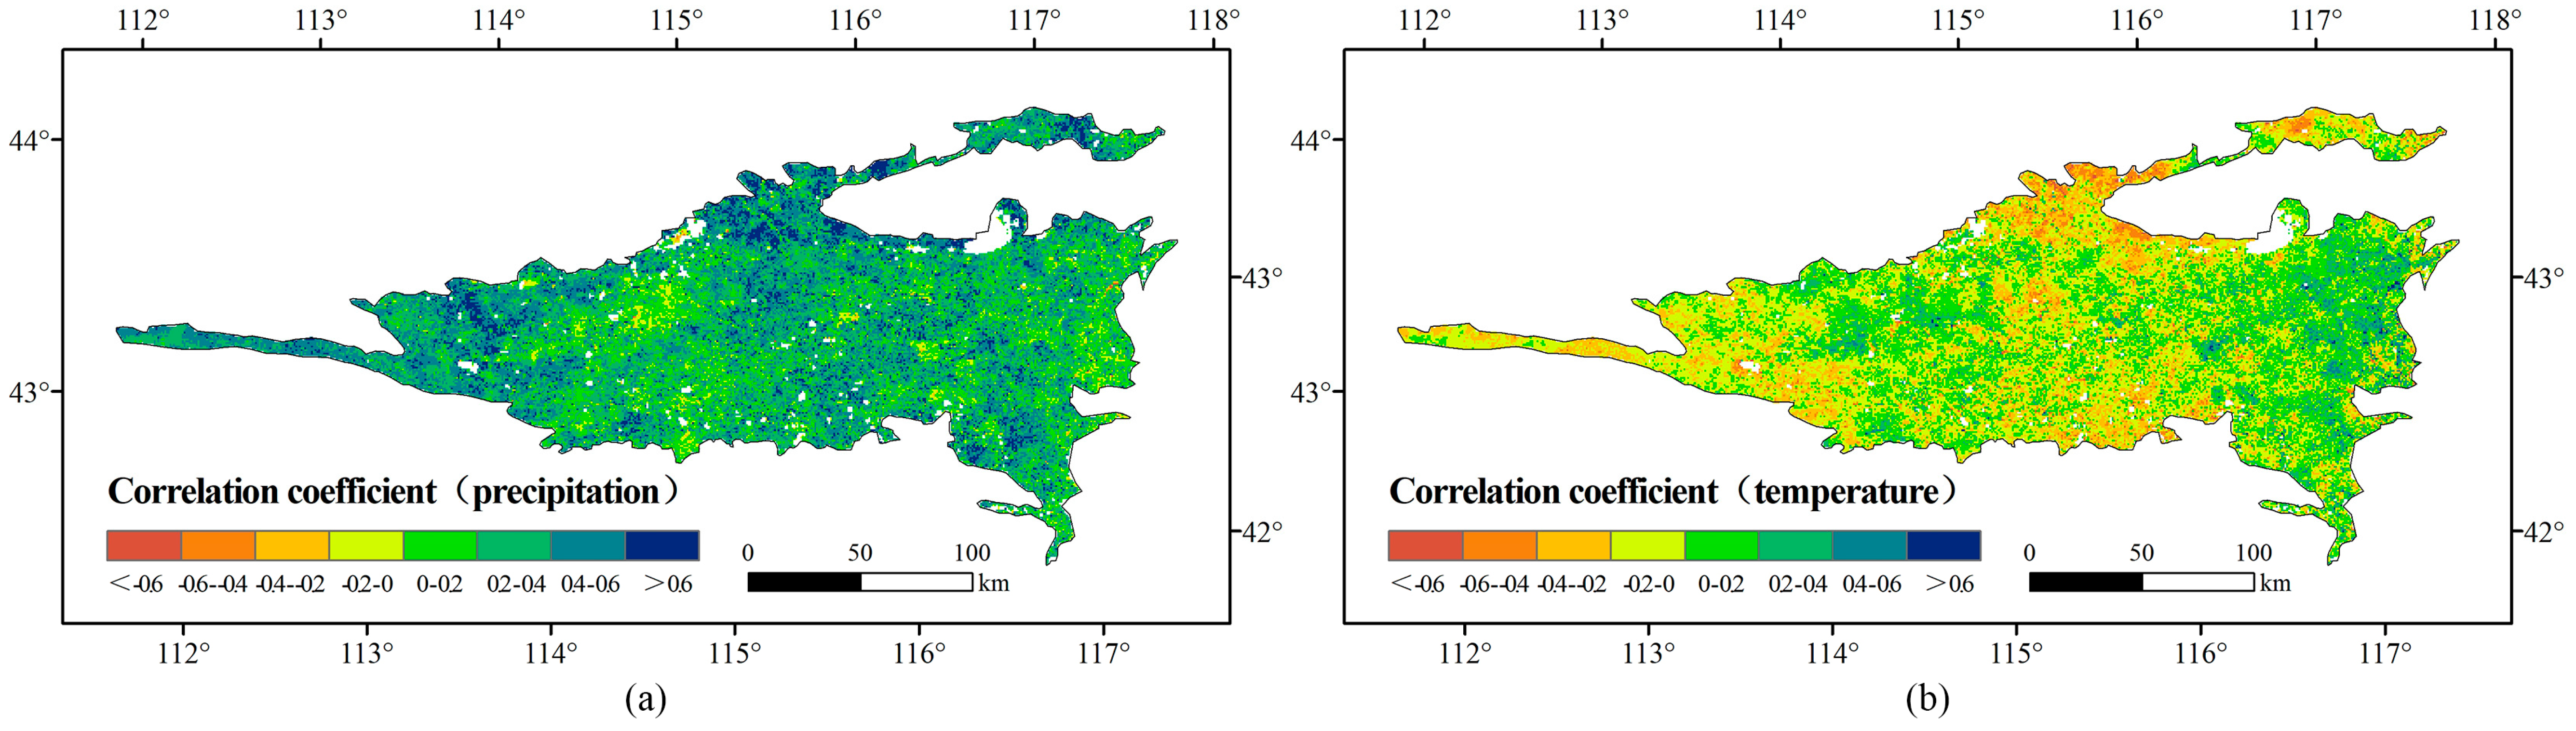
2.3.2. Correlation Analysis between Vegetation Coverage and Climate Factors
2.3.3. Contribution of Each Driving Factor to the Inter-Annual Variability of FVC
3. Results
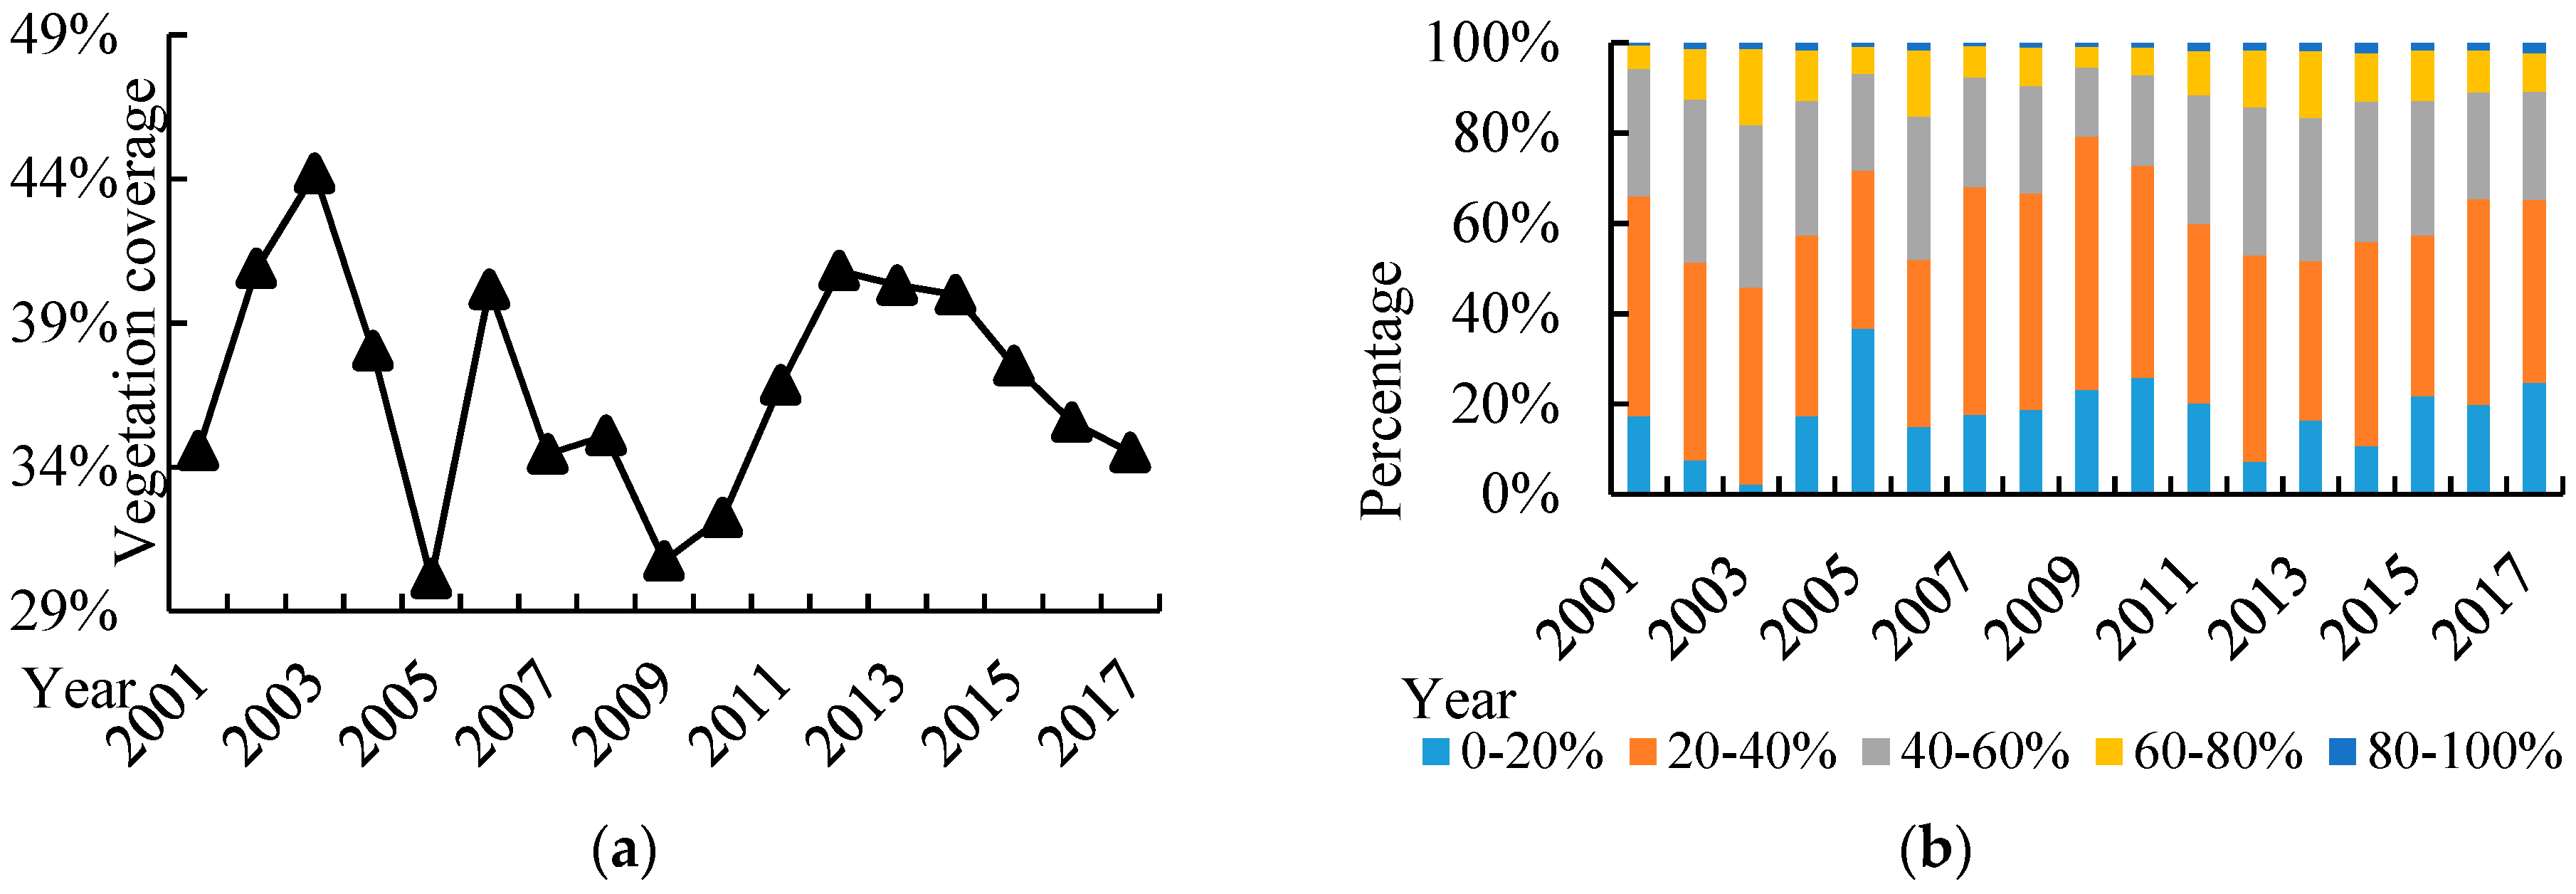
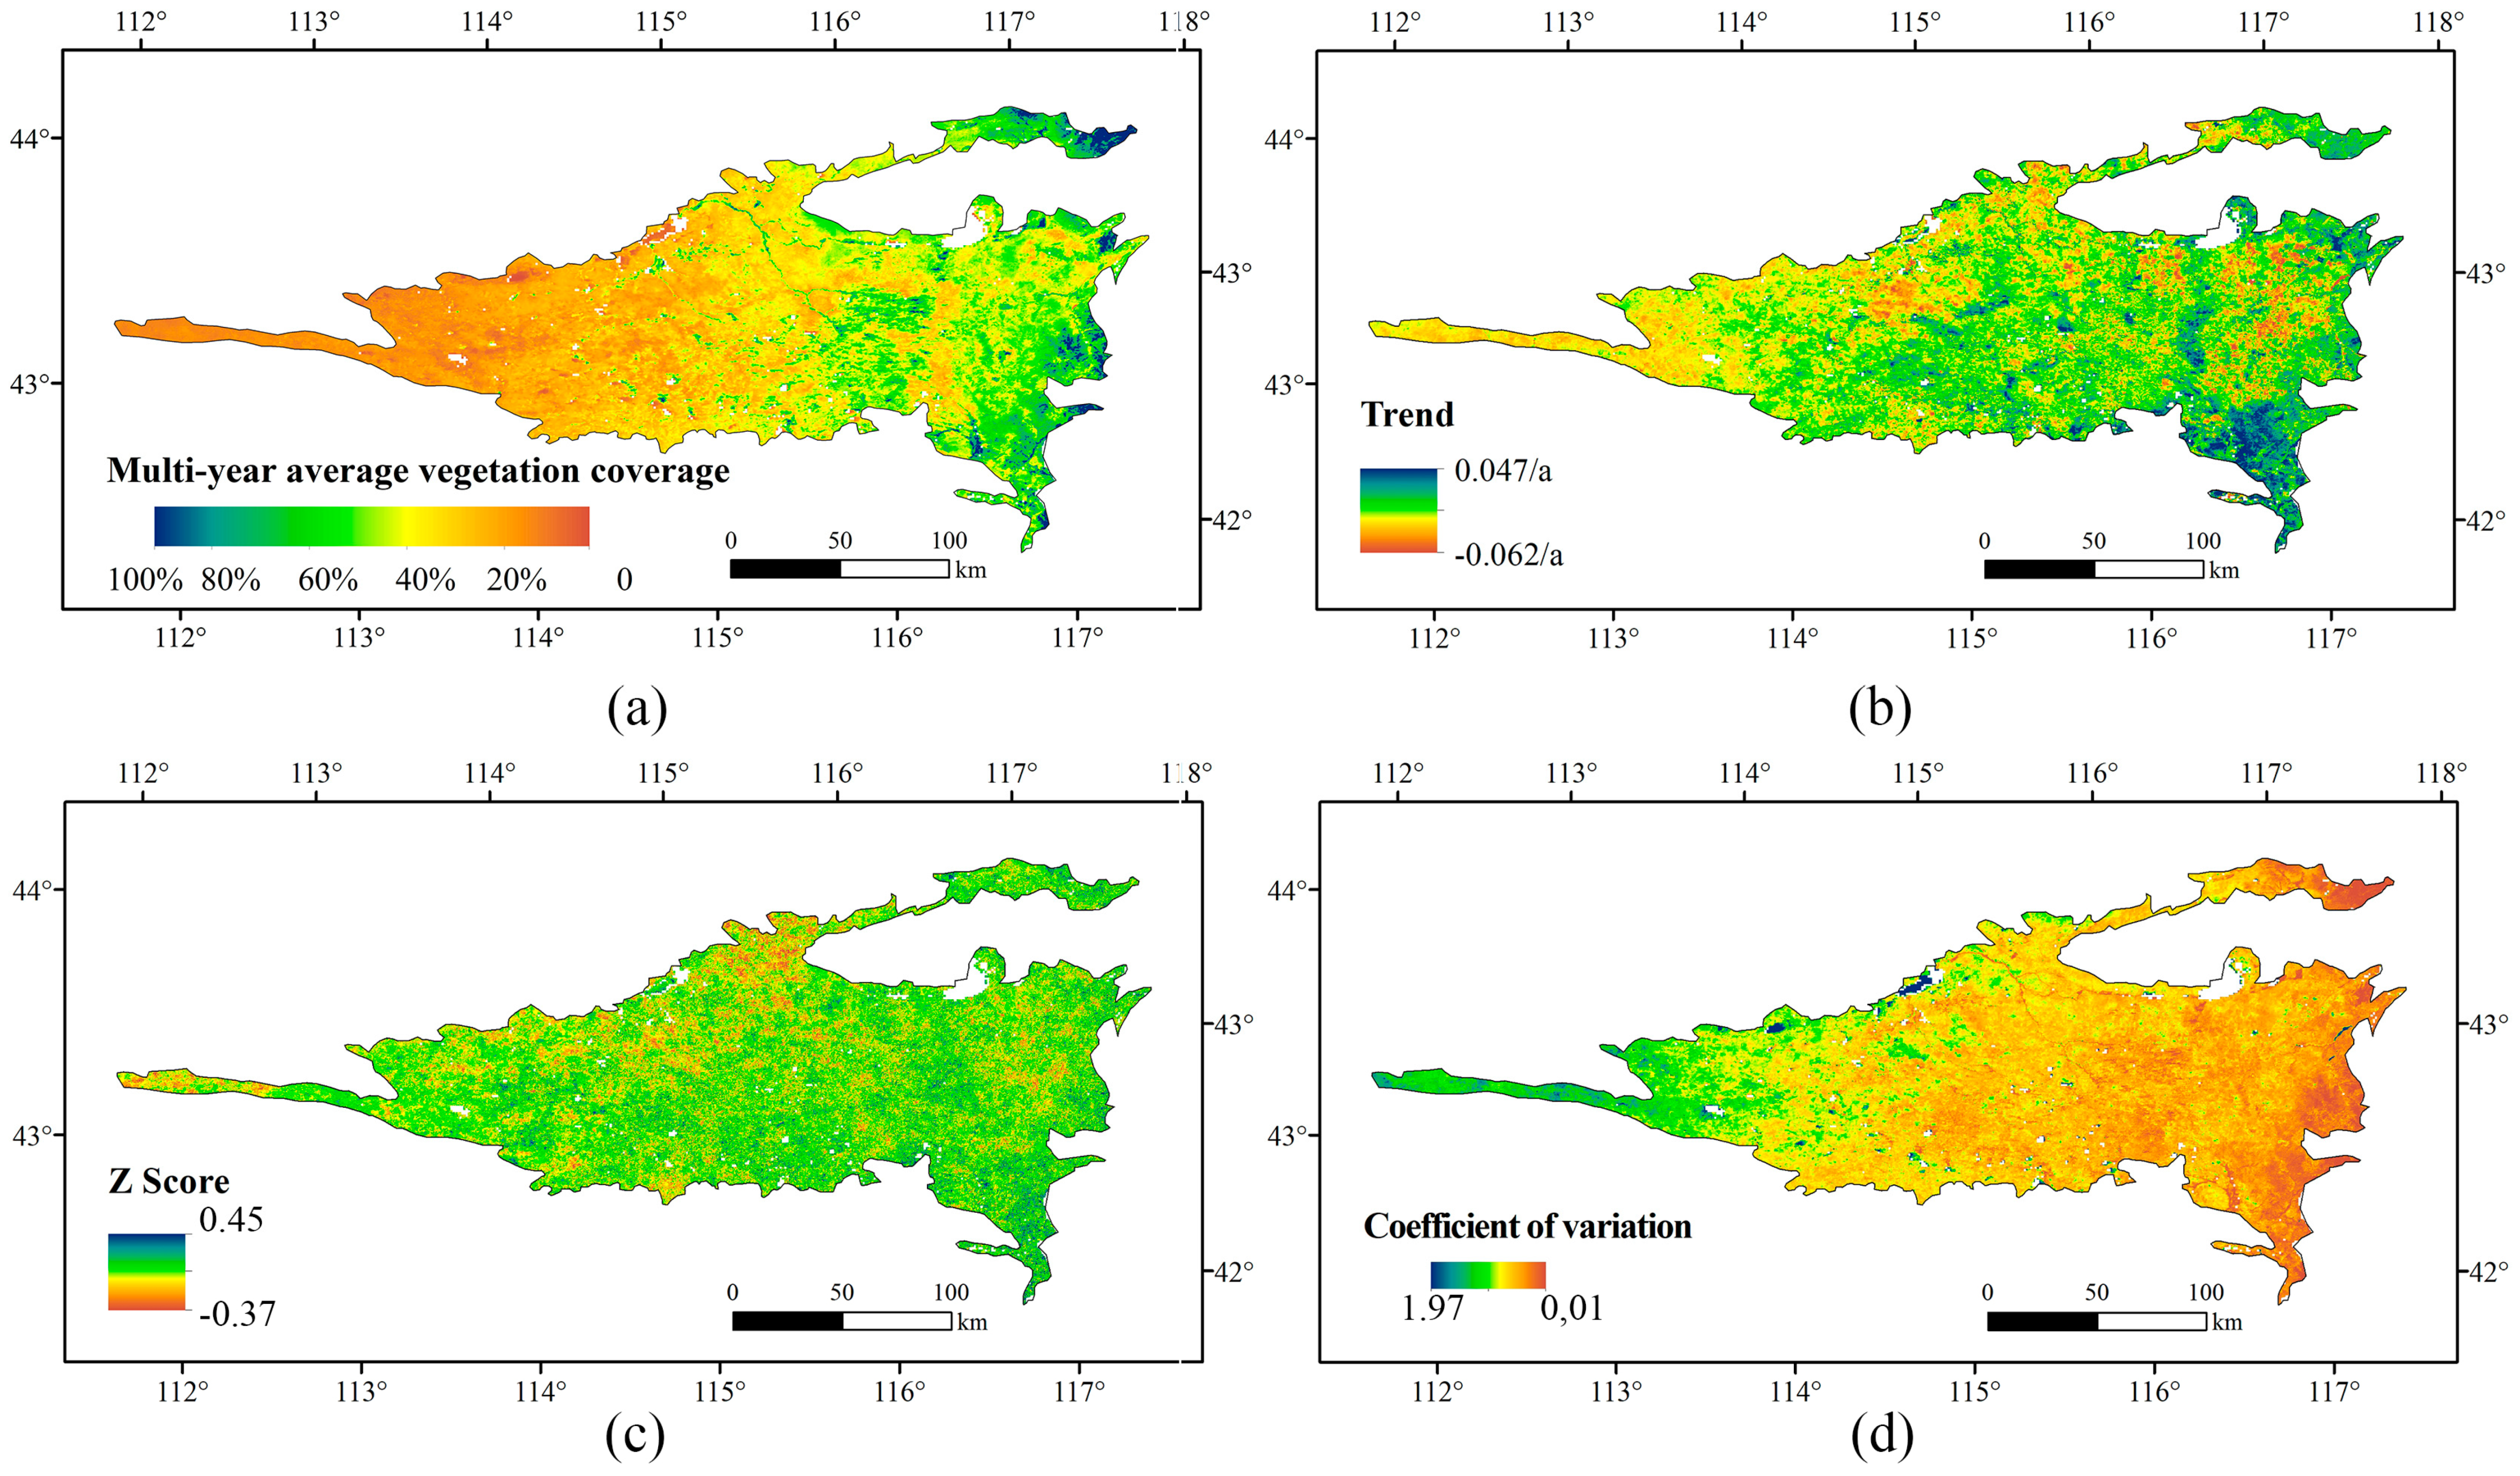
3.1. Temporal and Spatial Changes in Vegetation Coverage in the OSL from 2001 to 2017
3.2. The Impact of Climate-Human Factors on FVC
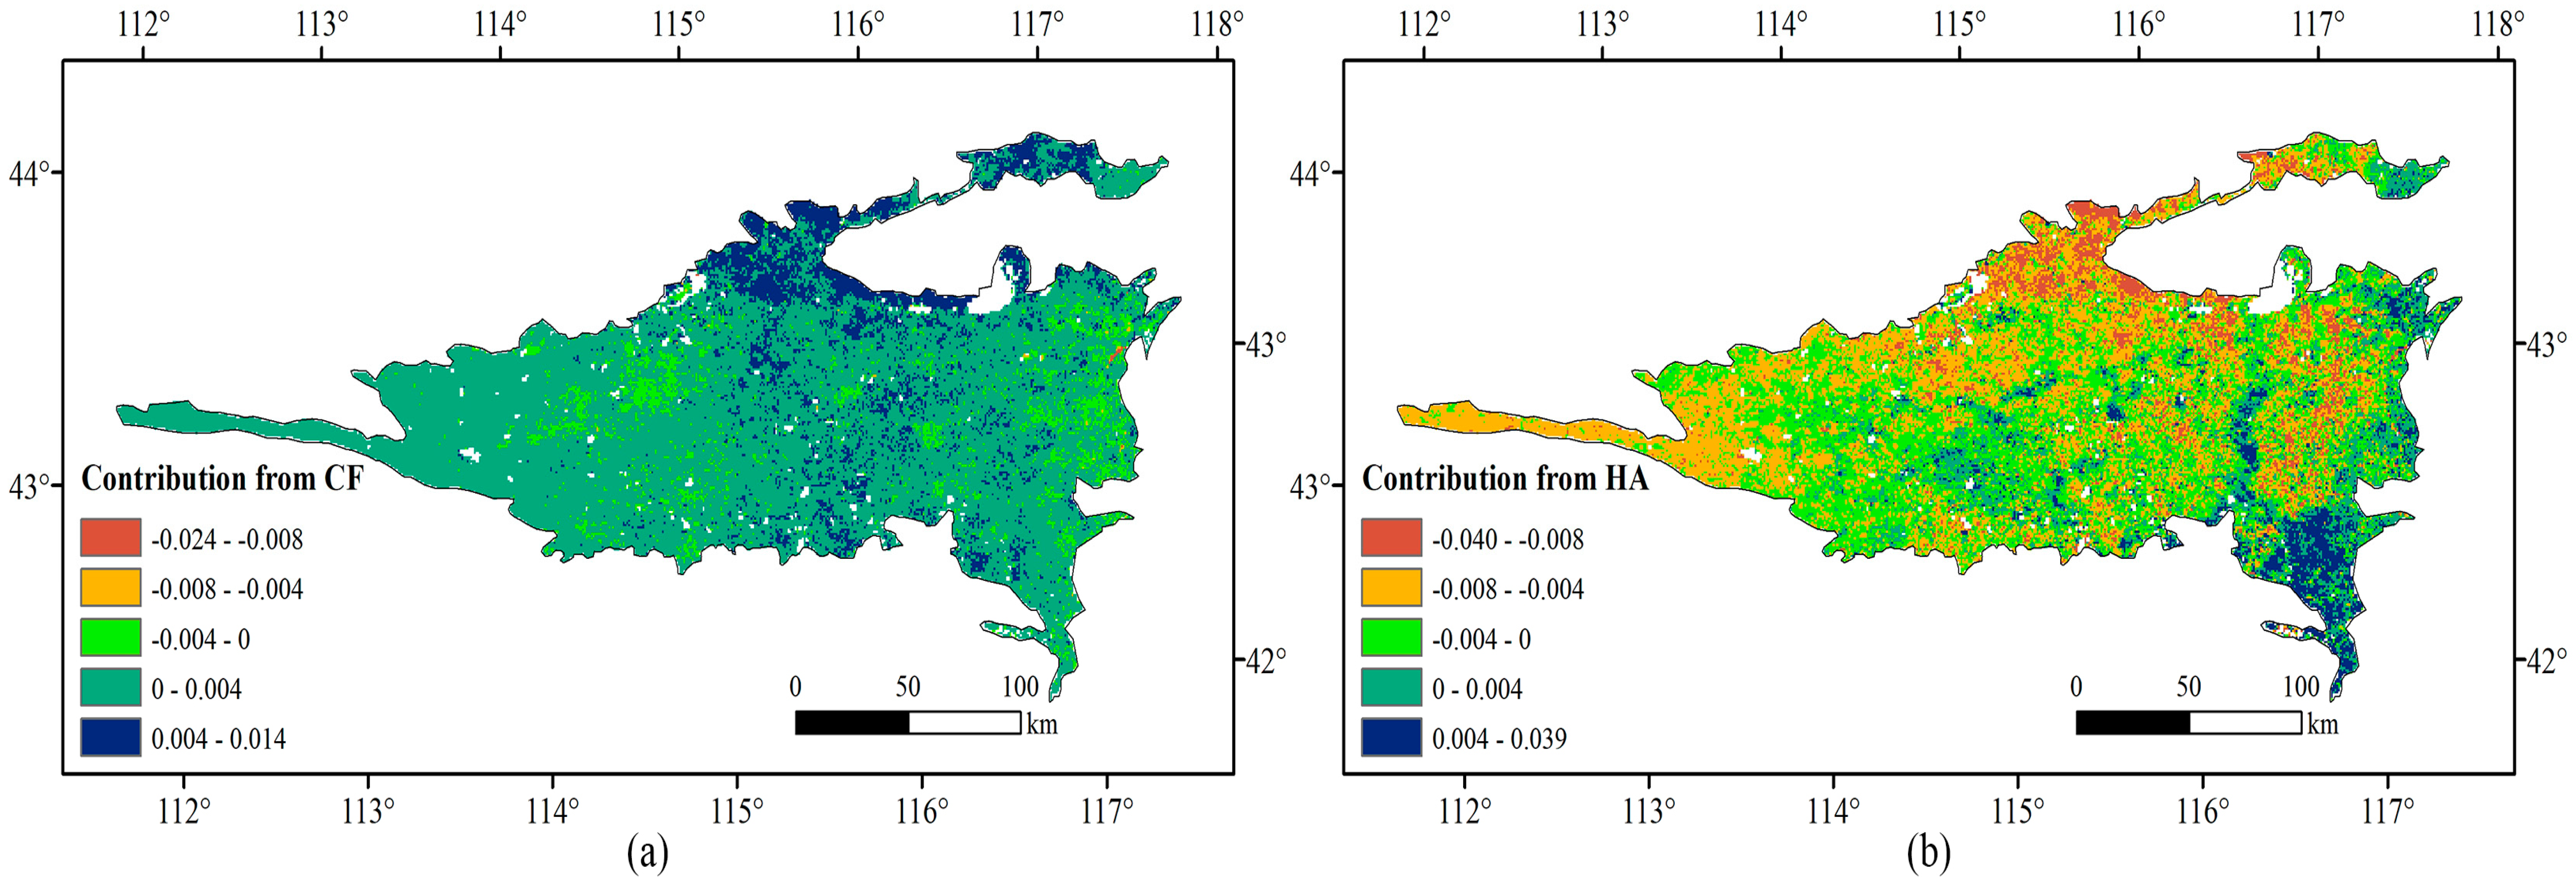
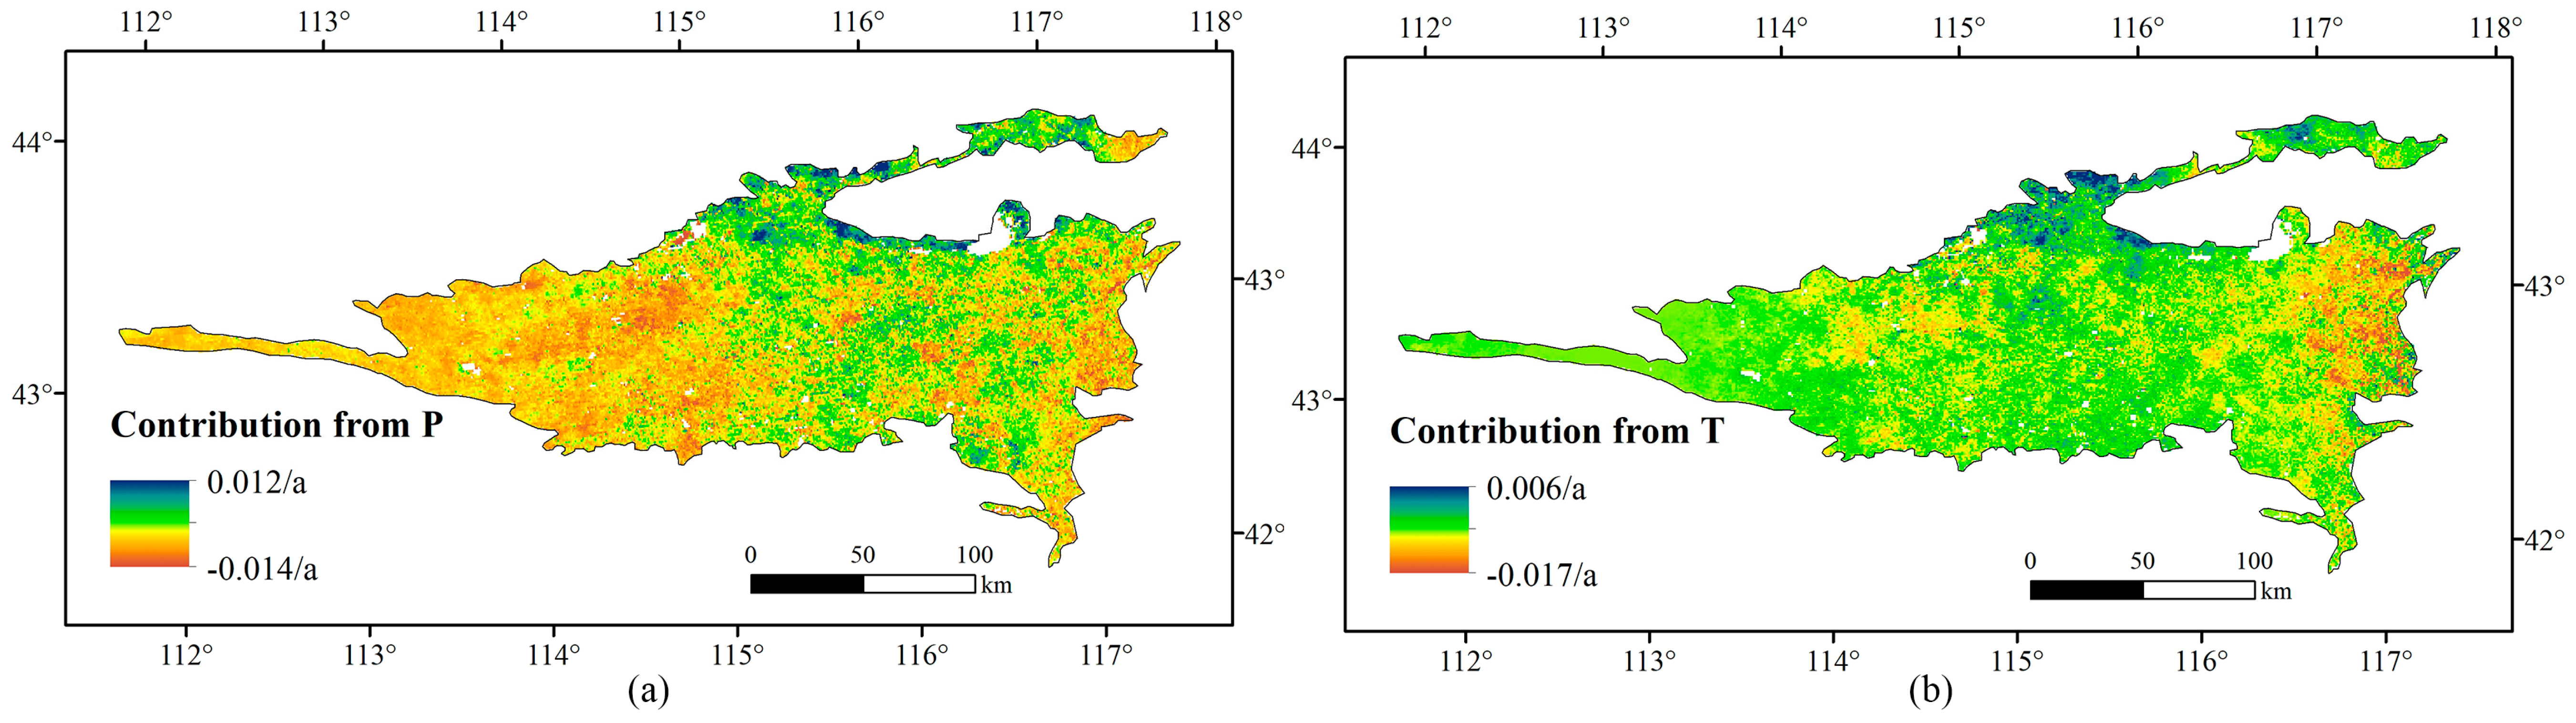
3.2.1. Contribution of Climate Factors to the Inter-Annual Change of Vegetation Coverage
3.2.2. Contribution of Human Activities to the Inter-Annual Change of Vegetation Coverage
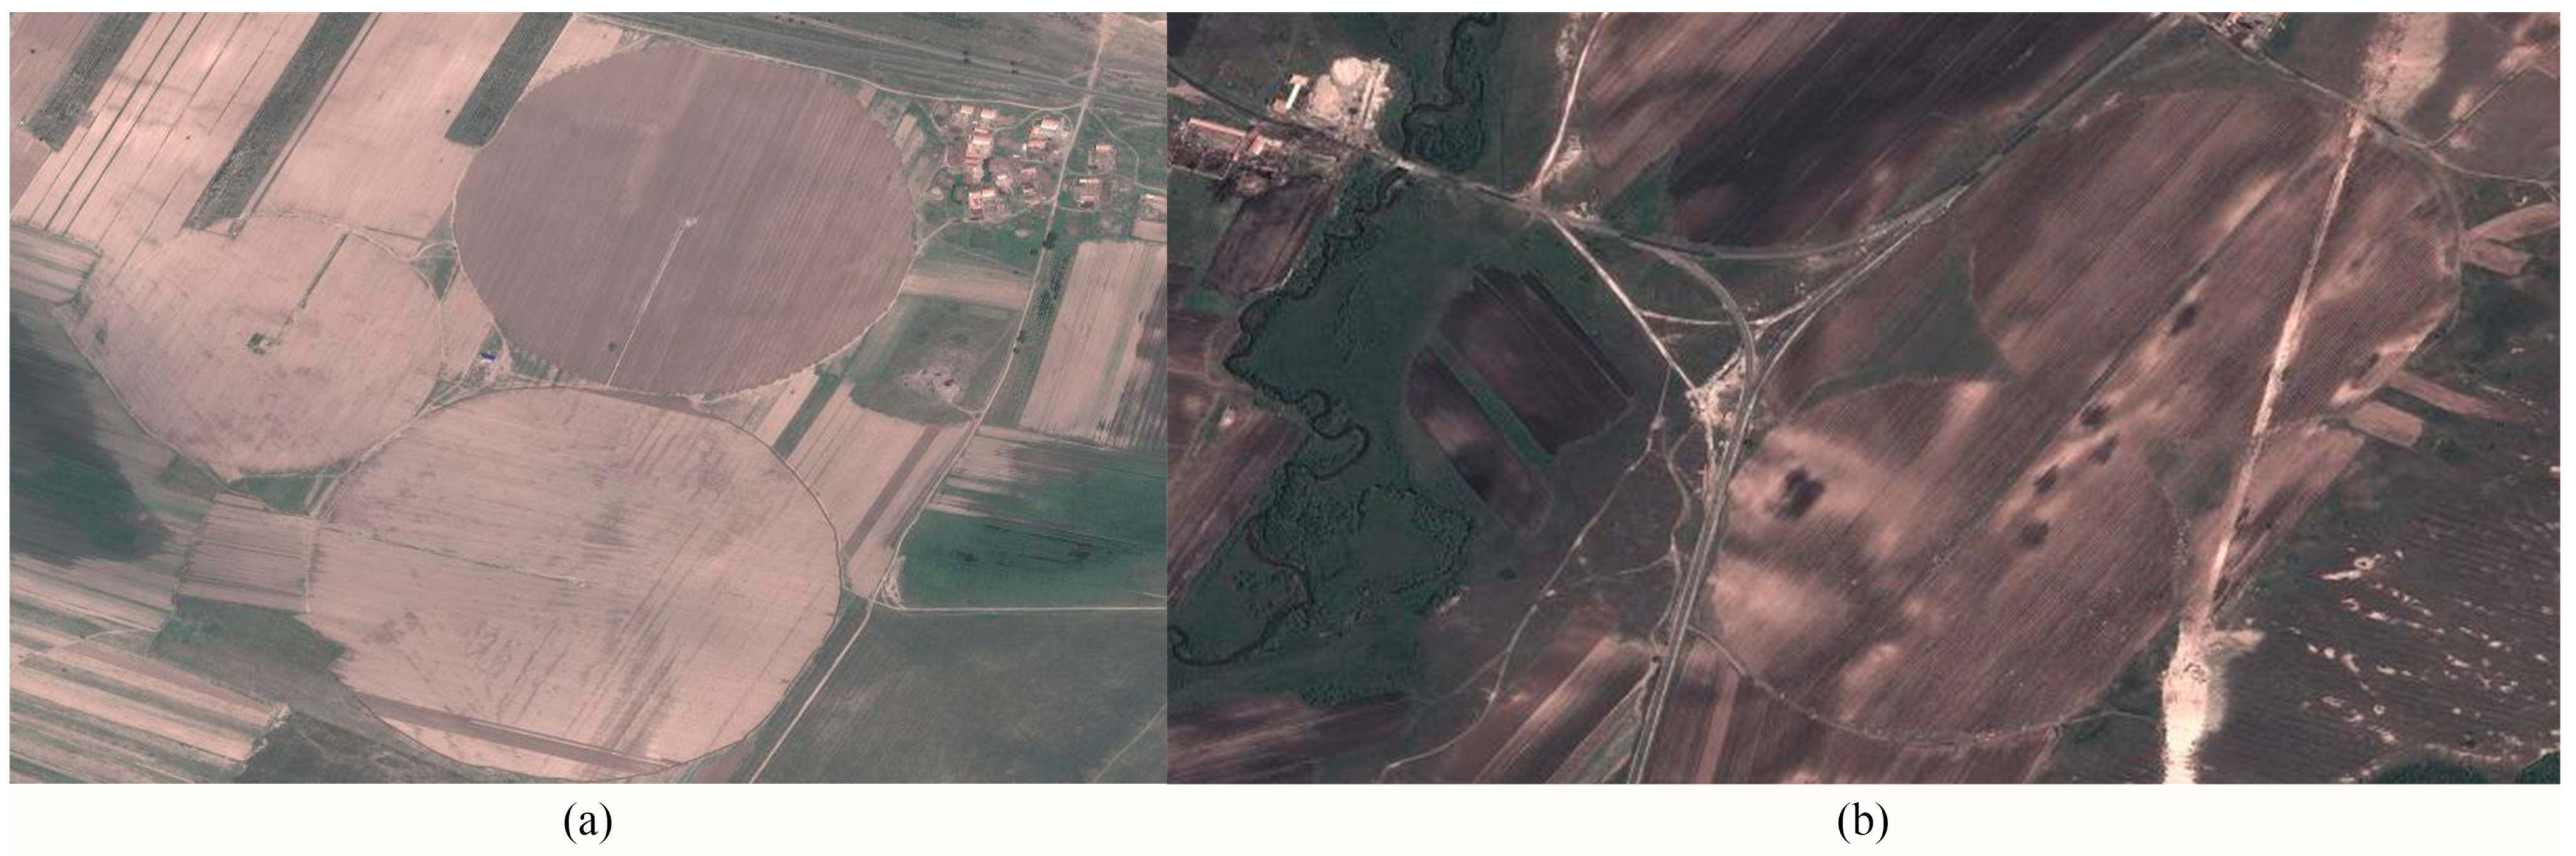
3.3. Characteristics of Land-Use Change and its Impacts on Vegetation Coverage
4. Discussion and Conclusions
4.1. Discussion: Impact of Human Factors on FVC
4.2. Conclusions
- The vegetation changes are the results of the integrating effects of climate and human factors. In terms of the case of OSL, climate-human factors had a negative effect on FVC overall, so the vegetation coverage tended to decline slightly. The climate factors individually had a positive impact on FVC, while human activities had a negative impact, which was greater than that of the climate factors, indicating that the changes of FVC were more susceptibly affected by and more sensitive to human factors.
- There were differences in the impacts on FVC inside the climate and human factors. Precipitation was the main climate factor with a significantly positive impact, but the impact of temperature was relatively slight. The impacts of human factors had two sides, that is, the positive one and negative one. Industrialization (especially mining activities), urbanization, and lifestyle changes had a negative impact, effecting vegetation recovery, while ecological policies promoted the vegetation restoration, prevented FVC from further degradation, and made up for the negative impacts of other human factors mentioned above.
- The differences in the combination of specific climate and human factors influenced the spatial patterns of FVC. In the region with abundant precipitation and ecological restoration projects, the positive impact of human factors was more likely to be observed, so FVC there showed an upward trend. However, in the region with scarce precipitation, great evapotranspiration, and few ecological measures, FVC was more fragile and sensitive to production and other economic activities impacts.
Author Contributions
Funding
Acknowledgments
Conflicts of Interest
References
- Walker, B.; Steffen, W. IGBP Science No.1: A Synthesis of GCTE and Related Research; IGBP: Stockholm, Sweden, 1997; pp. 1–24. [Google Scholar]
- Parmesan, C.; Yohe, G. A globally coherent fingerprint of climate change impacts across natural systems. Nature 2003, 421, 37–42. [Google Scholar] [CrossRef] [PubMed]
- Zhou, W.; Gang, C.C.; Zhou, F.C.; Li, J.L.; Dong, X.G. Quantitative assessment of the individual contribution of climate and human factors to desertification in northwest China using net primary productivity as an indicator. Ecol. Indic. 2015, 48, 560–569. [Google Scholar] [CrossRef]
- Ryan, C.M.; Pritchard, R.; McNicol, L.; Owen, M.; Fisher, J.A.; Lehmann, C. Ecosystem services from southern African woodlands and their future under global change. Philos. Trans. R. Soc. B Biol. Sci. 2016, 371, 1703. [Google Scholar] [CrossRef] [PubMed]
- Mirzabaev, A.; Ahmed, M.; Werner, J.; Pender, J.; Louhaichi, M. Rangelands of Central Asia: Challenges and opportunities. J. Arid Land 2016, 8, 93–108. [Google Scholar] [CrossRef] [Green Version]
- Tong, X.W.; Wang, K.; Yue, Y.M.; Brandt, M.; Liu, B.; Zhang, C.H.; Liao, C.J.; Fensholt, R. Quantifying the effectiveness of ecological restoration projects on long-term vegetation dynamics in the karst regions of Southwest China. Int. J. Appl. Earth Obs. Geoinf. 2017, 54, 105–113. [Google Scholar] [CrossRef] [Green Version]
- Liu, X.F.; Zhu, X.F.; Pan, Y.Z.; Li, S.S.; Ma, Y.Q.; Nie, J. Vegetation dynamics in Qinling-Daba Mountains in relation to climate factors between 2000 and 2014. J. Geogr. Sci. 2016, 26, 45–58. [Google Scholar] [CrossRef] [Green Version]
- Wang, X.M.; Chen, F.H.; Dong, Z.B. The relative role of climatic and human factors in desertification in semiarid China. Glob. Environ. Chang. 2006, 16, 48–57. [Google Scholar] [CrossRef]
- Mu, S.J.; Yang, H.F.; Li, J.L.; Chen, Y.Z.; Gang, C.C.; Zhou, W.; Ju, W.M. Spatio-temporal dynamics of vegetation coverage and its relationship with climate factors in Inner Mongolia, China. J. Geogr. Sci. 2013, 23, 231–246. [Google Scholar] [CrossRef]
- Chuai, X.W.; Huang, X.J.; Wang, W.J.; Bao, G. NDVI, temperature and precipitation changes and their relationships with different vegetation types during 1998–2007 in Inner Mongolia, China. Int. J. Climatol. 2013, 33, 1696–1706. [Google Scholar] [CrossRef]
- Li, Z.; Chen, Y.N.; Li, W.H.; Deng, H.J.; Fang, G.H. Potential Impacts of Climate Change on Vegetation Dynamics in Central Asia. J. Geophys. Res. Atmos. 2015, 120, 2045–2057. [Google Scholar] [CrossRef]
- Xie, B.N.; Jia, X.X.; Qin, Z.F.; Shen, J.; Chang, Q.R. Vegetation Dynamics and Climate Change on the Loess Plateau, China: 1982–2011. Reg. Environ. Chang. 2016, 16, 1583–1594. [Google Scholar] [CrossRef]
- Liu, X.F.; Zhang, J.S.; Zhu, X.F.; Pan, Y.Z.; Liu, Y.X.; Zhang, D.H.; Lin, Z.H. Spatiotemporal changes in vegetation coverage and its driving factors in the Three-River Headwaters Region during 2000–2011. J. Geogr. Sci. 2014, 24, 288–302. [Google Scholar] [CrossRef]
- Zheng, Y.R.; Xie, Z.X.; Robert, C.; Jiang, L.H.; Shimizu, H. Did climate drive ecosystem change and induce desertification in Otindag sandy land, China over the past 40 years? J. Arid Environ. 2006, 64, 523–541. [Google Scholar] [CrossRef]
- Liu, S.L.; Wang, T. Aeolian desertification from the mid-1970s to 2005 in Otindag Sandy Land, Northern China. Environ. Geol. 2007, 51, 1057–1064. [Google Scholar] [CrossRef]
- He, C.Y.; Tian, J.; Gao, B.; Zhao, Y.Y. Differentiating climate- and human-induced drivers of grassland degradation in the Liao River Basin, China. Environ. Monit. Assess. 2015, 187, 4199. [Google Scholar] [CrossRef] [PubMed]
- Ma, W.Y.; Wang, X.M.; Zhou, N.; Jiao, L.L. Relative importance of climate factors and human activities in impacting vegetation dynamics during 2000–2015 in the Otindag Sandy Land, northern China. J. Arid Land 2017, 9, 1–10. [Google Scholar] [CrossRef]
- Yao, R.; Wang, L.C.; Huang, X.; Chen, J.P.; Li, J.R.; Niu, Z.G. Less sensitive of urban surface to climate variability than rural in Northern China. Sci. Total Environ. 2018, 628–629, 650–660. [Google Scholar] [CrossRef]
- Gong, Z.N.; Zhao, S.Y.; Gu, J.Z. Correlation analysis between vegetation coverage and climate drought conditions in North China during 2001–2013. J. Geogr. Sci. 2017, 27, 143–160. [Google Scholar] [CrossRef]
- Song, W.; Deng, X.Z.; Liu, B.; Li, Z.H.; Jin, G.; Dong, J.W. Impacts of Grain-for-Green and Grain-for-Blue Policies on Valued Ecosystem Services in Shandong Province, China. Adv. Meteorol. 2015, 2015, 1–10. [Google Scholar] [CrossRef] [Green Version]
- Wang, J.; Chen, Y.Q.; Shao, X.M.; Zhang, Y.Y.; Cao, Y.G. Land-use changes and policy dimension driving forces in China: Present, trend and future. Land Use Policy 2012, 29, 737–749. [Google Scholar] [CrossRef]
- Liu, S.L.; Wang, T. Study on Land Desertification Process in Otindag Sandy Land. J. Desert Res. 2007, 27, 719–724. [Google Scholar]
- Wang, F.; Pan, X.B.; Wang, D.F.; Shen, C.Y.; Lu, Q. Combating desertification in China: Past, present and future. Land Use Policy 2013, 31, 311–313. [Google Scholar] [CrossRef]
- Miao, L.J.; Moore, J.C.; Zeng, F.J.; Lei, J.Q. Footprint of research in desertification management in China. Land Degrad. Dev. 2015, 26, 450–457. [Google Scholar] [CrossRef]
- Piao, S.L.; Fang, J.Y. Seasonal changes in vegetation activity in response to climate changes in China between 1982and 1999. Acta Geogr. Sin. 2003, 58, 119–125. [Google Scholar]
- Puredorj, T.S.; Tateishi, R.; Ishiyama, T. Relationships between percent vegetation cover and vegetation indices. Int. J. Remote Sens. 1998, 19, 3519–3535. [Google Scholar] [CrossRef]
- Gutman, G.; Ignatov, A. The derivation of the green vegetation fraction from NOAA/AVHRR data for use in numerical weather prediction models. Int. J. Remote Sens. 1998, 19, 1533–1543. [Google Scholar] [CrossRef]
- Feng, Q.; Liu, Y.S.; Mikami, M. Geostatistical analysis of soil moisture variability in grassland. J. Arid Environ. 2004, 58, 357–372. [Google Scholar] [CrossRef]
- McGrath, D.; Zhang, C.S.; Carton, O.T. Geostatistical analyses and hazard assessment on soil lead in Silvermines area, Ireland. Environ. Pollut. 2004, 127, 239–248. [Google Scholar] [CrossRef]
- Yuan, Z.H.; Bao, G.; Yin, S.; Lei, J.; Bao, Y.H. Vegetation changes in Otindag sand country during 2000–2014. J. Acta Prataculturae Sin. 2016, 25, 33–46. [Google Scholar]
- Zhao, A.Z.; Zhang, A.B.; Liu, H.X.; Liu, Y.X.; Wang, H.F.; Wang, D.L. Spatiotemporal variation of vegetation coverage before and after implementation of grain for green project in the Loess Plateau. J. Nat. Resour. 2017, 32, 449–460. [Google Scholar]
- Qu, S.; Wang, L.C.; Lin, A.W.; Zhu, H.J.; Yuan, M.X. What drives the vegetation restoration in Yangtze River basin, China: Climate change or anthropogenic factors? Ecol. Indic. 2018, 90, 438–450. [Google Scholar] [CrossRef]
- Tian, H.J.; Cao, C.X.; Chen, W.; Bao, S.N.; Yang, B.; Myneni, R. Response of vegetation activity dynamic to climatic change and ecological restoration programs in Inner Mongolia from 2000 to 2012. Ecol. Eng. 2015, 82, 276–289. [Google Scholar] [CrossRef]
- Pan, T.; Zou, X.T.; Liu, Y.J.; Wu, S.H.; He, G.M. Contributions of climatic and non-climatic drivers to grassland variations on the Tibetan Plateau. Ecol. Eng. 2017, 108, 307–317. [Google Scholar] [CrossRef]
- Meng, D.J.; Mo, X.G. Assessing the effect of climate change on mean annual runoff in the Songhua River basin, China. Hydrol. Process. 2012, 26, 1050–1061. [Google Scholar] [CrossRef]
- Zhang, Y.; Zhang, C.B.; Wang, Z.Q.; Chen, Y.Z.; Gang, C.C.; An, R.; Li, J.L. Vegetation dynamics and its driving forces from climate change and human activities in the Three-River Source Region, China from 1982 to 2012. Ence Total Environ. 2016, 563, 210–220. [Google Scholar] [CrossRef]
- Zhang, Y.L.; Song, C.H.; Zhang, K.R.; Cheng, X.L.; Zhang, Q.F. Spatial–temporal variability of terrestrial vegetation productivity in the Yangtze River Basin during 2000–2009. J. Plant Ecol. 2014, 7, 10–23. [Google Scholar] [CrossRef] [Green Version]
- Yang, H.B.; Yang, D.W. Climatic factors influencing changing pan evaporation across China from 1961 to 2001. J. Hydrol. 2012, 414, 184–193. [Google Scholar] [CrossRef]
- Guo, L.H.; Wu, S.H.; Zhao, D.S.; Yin, Y.H.; Leng, G.Y.; Zhang, Q.Y. NDVI-based vegetation change in Inner Mongolia from 1982 to 2006and its relationship to climate at the Biome scale. Adv. Meteorol. 2014, 2014, 692068. [Google Scholar] [CrossRef]
- Cai, H.Y.; Yang, X.H.; Wang, K.J.; Xiao, L.L. Is Forest Restoration in the Southwest China Karst Promoted Mainly by Climate Change or Human-Induced Factors? Remote Sens. 2014, 6, 9895–9910. [Google Scholar] [CrossRef] [Green Version]
- Liu, H.Y.; Jiao, F.S.; Yin, J.Q.; Li, T.Y.; Gong, H.B.; Wang, Z.Y.; Lin, Z.S. Nonlinear relationship of vegetation greening with nature and human factors and its forecast—A case study of Southwest China. Ecol. Indic. 2020, 111, 106009. [Google Scholar] [CrossRef]
- Padilla, F.M.; Vidal, B.; Sánchez, J.; Pugnaire, F.I. Land-use changes and carbon sequestration through the twentieth century in a Mediterranean mountain ecosystem: Implications for land management. J. Environ. Manag. 2010, 91, 2688–2695. [Google Scholar] [CrossRef] [PubMed]
- Boumans, R.; Roman, J.; Altman, I.; Kaufman, L. The Multiscale Integrated Model of Ecosystem Services (MIMES): Simulating the interactions of coupled human and natural systems. Ecosyst. Serv. 2015, 12, 30–41. [Google Scholar] [CrossRef]
- Aldieri, L.; Vinci, C. Green economy and sustainable development: The economic impact of innovation on employment. Sustainability 2018, 10, 3541. [Google Scholar] [CrossRef] [Green Version]
- Li, F.; Zhang, S.W.; Yang, J.C.; Bu, K.; Wang, Q.; Tang, J.M.; Chang, L.P. The effects of population density changes on ecosystem services value: A case study in Western Jilin, China. Ecol. Indic. 2016, 61, 328–337. [Google Scholar]
- Jia, X.Q.; Fu, B.J.; Feng, X.M.; Hou, G.H.; Liu, Y.; Wang, X.F. The tradeoff and synergy between ecosystem services in the Grain-for-Green areas in Northern Shaanxi, China. Ecol. Indic. 2014, 43, 103–113. [Google Scholar] [CrossRef]
- Qu, S.; Wang, L.; Lin, A.W.; Yu, D.Q.; Yuan, M.X.; Li, C.A. Distinguishing the impacts of climate change and anthropogenic factors on vegetation dynamics in the Yangtze River Basin, China. Ecol. Indic. 2020, 108, 1–11. [Google Scholar] [CrossRef]
- Jiang, Z.; Huete, A.R.; Chen, J.; Chen, Y.H.; Li, J.; Yan, G.J.; Zhang, X.Y. Analysis of NDVI and scaled difference vegetation index retrievals of vegetation fraction. Remote Sens. Environ. 2006, 101, 366–378. [Google Scholar] [CrossRef]
- Mu, S.J.; Li, J.L.; Chen, Y.Z.; Gang, C.C.; Zhou, W.; Ju, W.M. Spatial differences of variations of vegetation coverage in Inner Mongolia during 2001—2010. J. Acta Geogr. Sin. 2012, 67, 1255–1268. [Google Scholar]


| Human Factors | Index | Contribution |
|---|---|---|
| Population pressure [39] | Population density | −0.0040/a |
| Economic development level [39] | GDP | -0.0026/a |
| per unit area GDP | −0.0029/a | |
| Industrial structure [16] | Number of employees in the secondary industry | −0.0054/a |
| Number of employees in the tertiary industry | −0.0039/a | |
| Industrial added value | −0.0060/a | |
| Pastoral structure [16] | Number of large livestock | −0.0059/a |
| Number of sheep | −0.0042/a |
| Primary Classes | Secondary Classes | Area Change Ratio from 2000 to 2015 | |
|---|---|---|---|
| Cultivated Land | Dry land | −6.83% | −6.83% |
| Forestland | Woodland | 0.27% | −2.73% |
| Shrub land | −2.73% | ||
| Sparse woodland | −0.27% | ||
| Grassland | High coverage grass | −59.29% | 4.92% |
| Medium coverage grass | 28.69% | ||
| Low coverage grass | 35.52% | ||
| Water area | River channel | 0.00% | −17.49% |
| Lake | −27.87% | ||
| Reservoir pit | 0.27% | ||
| Beach | 10.11% | ||
| Industrial and mining warehouse land, residential land | Townhouse | 0.82% | 3.28% |
| House-site in the countryside | 0.55% | ||
| Other construction land | 1.91% | ||
| Unutilized | Sandy land | 16.94% | 18.85% |
| Saline-alkali land | −3.01% | ||
| Wetlands | 4.92% | ||
| Bare land | 0.00% | ||
| Bare rock texture | 0.00% | ||
© 2020 by the authors. Licensee MDPI, Basel, Switzerland. This article is an open access article distributed under the terms and conditions of the Creative Commons Attribution (CC BY) license (http://creativecommons.org/licenses/by/4.0/).
Share and Cite
Wang, H.; Yao, F.; Zhu, H.; Zhao, Y. Spatiotemporal Variation of Vegetation Coverage and Its Response to Climate Factors and Human Activities in Arid and Semi-Arid Areas: Case Study of the Otindag Sandy Land in China. Sustainability 2020, 12, 5214. https://doi.org/10.3390/su12125214
Wang H, Yao F, Zhu H, Zhao Y. Spatiotemporal Variation of Vegetation Coverage and Its Response to Climate Factors and Human Activities in Arid and Semi-Arid Areas: Case Study of the Otindag Sandy Land in China. Sustainability. 2020; 12(12):5214. https://doi.org/10.3390/su12125214
Chicago/Turabian StyleWang, Hao, Fei Yao, Huasheng Zhu, and Yuanyuan Zhao. 2020. "Spatiotemporal Variation of Vegetation Coverage and Its Response to Climate Factors and Human Activities in Arid and Semi-Arid Areas: Case Study of the Otindag Sandy Land in China" Sustainability 12, no. 12: 5214. https://doi.org/10.3390/su12125214