1. Introduction
In the Czech Republic (CR), there are many prefabricated houses from the 1970s or 1980s, which are conceptually obsolete from the point of view of modern times and, in many aspects, no longer meet current standards of modern living. As the demands for permanent housing are constantly growing, the problem of whether it is preferable to reconstruct existing buildings or to build a new housing developments was solved. According to Reference [
1], the first method, i.e., reconstruction of existing prefabricated buildings, is more economical. The main emphasis here is mainly on the energy performance of buildings and the economics of operation.
The main goals of the research were:
To evaluate, in the long run, the rate of energy savings of selected prefabricated apartment buildings as a result of their revitalization, and thus provide feedback to the relevant authorities on the degree of efficiency in order to answer the question of whether prefabricated buildings are advantageous to revitalize or, conversely, if it is more efficient to gradually remove them and replace them with new buildings,
To evaluate selected parameters in the locality related to the attractiveness of housing in terms of housing costs (energy), transport services, amenities, and noise pollution for the purposes of the real estate market, with the possibility of presenting results to those interested in living in the locality.
This is a relatively ambitious goal, which requires the selection of relevant criteria for assessing the quality of housing, including geographical, environmental, economic, and statistical criteria. Obtaining the values of these criteria is important in terms of the purpose of their evaluation. In practice, this means providing input data that contains these values. Additionally important is the selection of a suitable method or combination of methods for processing and evaluation of criteria. The locality of Nový Lískovec was selected as the modeled area, which is one of the city districts of Brno, the second largest city in the Czech Republic; the necessary data were available for this locality to be evaluated. The result is the creation of a general model applicable to any housing location and fulfilling the required role, both for the relevant authorities and for a more correct functioning of the real estate market with housing.
In this article, we propose a bottom-up method, which is based on the opinions of those interested in permanent housing in prefabricated houses. The method is based on a questionnaire survey, where selected criteria for the quality of housing and their required values will be identified. To obtain a comprehensive set of criteria, respondents are divided into several groups, and a model for evaluating the values of individual criteria is proposed. The model designed in this way is sufficiently universal so that it can be used for any conditions and demographic compositions of populations in various localities with panel construction.
In this article, we focus mainly on the parameters of energy savings, noise pollution of the site caused mainly by traffic, and spatial analysis based on questionnaire surveys, as well as creating a model combined with multi-criterial analysis (MCA) and weighted linear combination (WLC) for use in the real estate market.
The paper is organized as follows. In
Section 2, we mention some related work concerning the given issues. In
Section 3, we describe the method of solution, input data, and processing in Geographical Information System (GIS), and propose the model for the choice of buildings for residence living.
Section 4 demonstrates the experiments,
Section 5 contains discussion of the given topic, and, finally,
Section 6 addresses the conclusions.
2. Related Works
The issue of reconstruction of existing prefabricated houses from the construction and architectural point of view is addressed in, e.g., publications [
2,
3]. Article [
2] focuses on the interdisciplinary and complex nature of revitalization implemented in Poland, which can improve the quality of life of the population. Currently, about 10 million people live in prefabricated apartment buildings in Poland, i.e., over 1/4 of the country’s population. Poles remain in these settlements, while, in Germany or France, they are depopulated. The revitalization potential of prefabricated housing estates was evaluated, and the documentation of buildings was analyzed. It turned out that prefabricated housing estates still have great revitalization potential; housing estates are well equipped with basic services and are well connected with the rest of the city. This work confirms that the project described in this article was necessary and has great justification, i.e., the revitalization of prefabricated houses makes sense.
The aim of Reference [
3] was to evaluate the effectiveness of revitalization and to present a proposal of the best variant in terms of investment and energy savings in the conditions of the Czech Republic. This publication was the basic study for our article.
A case study [
4] on a residential building near Milan, Italy, deals with energy intensity. It is a comparison of two prefabricated technological systems for building cladding. The combination of the two prefabricated construction systems applied in the case study allowed the reduction of the building energy demand by 82%. For this reason, in this project, we focused mainly on the energy savings of buildings.
Reference [
5] is focused on the search for unused areas with the aim of their further use for city development. The aim was to improve the quality and attractiveness of the housing estate environment. Emphasis was placed on functionality, improving the quality of public spaces, including greenery, and economically optimal use of residential areas. The supporting functional framework of the area was created by connections between local key nodes and the transformation of the ground floor architecture of residential buildings. By adding to the existing solitaire residential blocks, compact semi-enclosed spaces, spaces for relaxation, sports, and social gardens were created to revive community activities. The work takes into account not only the parameters of the building, but also the surrounding amenities. These aspects were the motivation for our article.
Reference [
6] addresses the advantages and disadvantages of building new prefabricated houses in Beijing (China). The paper presents an analysis of the costs and benefits of changing rates of construction costs and environmental benefits. It focuses on the parameters of energy consumption, water consumption, construction waste, steel and concrete, dust, and noise pollution. It demonstrates the efficiency of public prefabricated housing and its efficiency and environmental friendliness. The article addresses similar issues to those described in this text.
The impact of noise in cities is an unfavorable hygienic factor. In a field study [
7], the noise level was measured using a sound level meter, and a noise map was generated based on geostatistical methods using GIS software. To this end, factors affecting noise levels (e.g., traffic, road width, slope, and residential or administrative and commercial land use) were identified and recorded for each point, and their local and temporal dependences were calculated using SPSS. The results indicated that, with a large margin, traffic was the most significant factor in noise levels, followed by residential areas, road width, slope, administrative and commercial land use, and green space. According to the noise pollution map, the Hemmat motorway had the highest level of noise pollution, followed by the Hakim, Tohid, and Tajrish motorways.
Reference [
8] developed the first noise map of Quito in Ecuador using a computer-assisted predictive model and official data about road networks, buildings, and population. Three noise prediction models, RLS-90 (German model), STL-86 (Swiss model), and NMPB-Routes-08 (French model), were originally used to compare the modeled and measured results. Short-term noise measurements and vehicle numbers were used as a means of verifying the prediction model. The comparison showed that the RLS-90 model was, in this case, the most suitable for predicting traffic noise levels. Noise increases in local streets, especially in segments with a higher slope of the road, are related to the road surface with the usual surface formed by cobblestones, and, in narrow streets, sound reflections increase the noise level. The Quito area is exposed to road traffic noise above 65 dBA during the year, which is a high and undesirable level. Approximately 25% of the population living in the area is exposed to unwanted daily noise, and 38% of the population is exposed to noise from traffic above 55 dBA, which is still considered dangerous to public health. References [
7] and [
8] motivated us to incorporate road traffic noise analysis into our project.
Reference [
9] deals with the development of the city of Qaziv (Iran) in terms of residential housing in connection with the transfer of inhabitants from the villages to the city. Suitable places for future development and facilities, such as schools, fire stations, hospitals, and new city districts, are being sought. The authors used a combination of three methods: 1) Multi-criterial analysis (MCA)—specifically, an analytical hierarchical process (AHP), 2) a geographical information system (GIS), and 3) a least-squares model. The result of the analysis was finding suitable sites according to two important criteria: Proximity to populated areas and distance from polluted areas.
Demographic change and economic decline are changing patterns, as well as urban density. Reference [
10] examines the demographic changes that occurred in the early 1990s after German reunification in many cities in the former German Democratic Republic (GDR). MCA was used to assess changes. The aim was to identify urban brownfields. The aim was to identify changes in infrastructure and land use and to design demolition scenarios. A case study was conducted for the city of Leipzig.
The use of the MCA method is most common for many analyses in a GIS environment.
In Reference [
11], a methodology for the selection of suitable places for urban greenery is proposed using the methods of MCA and AHP in GIS. The research described in [
12] uses MCA as a quantitative methodology to apply the LP (Logistic Profile) concept for the city of Lisbon as a case study.
The aim of Reference [
13] was to find sustainable areas for absorbing urban growth within Ramallah to alleviate the pressure on the city center, and also to find accommodation for young families seeking better living conditions. The research was carried out in two main phases: (1) Site selection using GIS to identify 13 sites according to established criteria, and (2) evaluation of these sites using MCA with respect to the set of indicators that were evaluated.
In Reference [
14], the authors examine the diversity of vegetation types depending on the regions identified by natural and socio-economic boundaries in large cities. The case study was conducted in Cape Town using MCA and GIS tools.
The use of fuzzy logic is presented in Reference [
15], which deals with the concept of the ecological sustainability of cities in China. The model was verified on the case of planning of the development of industrial greenery in the city of Ordos. The resulting five alternatives were evaluated by MCA.
Reference [
16] presents a methodology for identifying the most environmentally friendly area for the spread of Zamora (Spain) using GIS technology. The aim was to develop a GIS-based methodology for identifying peripheral urban areas that are suitable for the construction of new buildings and the establishment of services that comply with environmental requirements, and which guarantee an adequate quality of life for the future population so as to avoid additional construction costs. The methodological core is based on MCA.
Reference [
17] proposes a methodology for evaluating and selecting the appropriate types of intersections in urban communication networks. The assessment is based on MCA. The AHP method was chosen, where weights of criteria are derived using multilevel hierarchical structures. The work illustrates the implementation of the proposed model in a case study in Riyadh.
Reference [
18] deals with research and comparison of various waste management strategies in Tabriz, Iran, and selects the best method for decision-making. The selection of the best strategy is based on MCA using the AHP method. The research compares four waste management strategies, including different processes, such as resource separation (SS), biological and mechanical treatment (BMT), incineration (RDF), and landfills. Eight main weighted criteria were used to select the best strategy.
Reference [
19] presents a methodology for evaluating rainwater control measures in an urban drainage system that combines hydrological–hydraulic modeling and MCA. The methodology was verified on the water system in Girona, Spain.
Road transport is a major source of emissions in urban areas, and infrastructure has a significant impact on the urban agglomeration. An integrated evaluation methodology was developed in Reference [
20] in order to prioritize a set of transport-related measures. The approach uses MCA to derive a practically relevant solution that supports ownership and responsibility of all stakeholders to local transport and mobility problems. The methodology was validated in Potsdam, Germany.
Reference [
21] addresses rush hour traffic in cities. In theory, moving some supplies off-peak would reduce both traffic density and time to deliver. The paper introduces the Multi-Actor MCA as a suitable tool for measuring out-of-town supply operations and describes the application of this methodology to a case study of a large retail food retailer in Brussels.
Reference [
22] presents a multi-criteria analysis (MCA) of selected electric vehicles (EV) in the context of urban traffic. From a methodological point of view, this is a unique approach based on MCA. The MCA procedure is based on the two carefully selected PROMETHEE II and fuzzy TOPSIS methods, which process both certain and uncertain data sets in a single decision process. The proposed approach was realized by developing a set of preferential decision-making models (based on certain and uncertain data) of carefully selected EVs.
The projects described in References [
9,
10,
11,
12,
13,
14,
15,
16,
17,
18,
19,
20,
21,
22] use a similar methodology to that of our article—MCA (AHP) + GIS combination.
The above survey shows that the issue of reconstruction of prefabricated houses and assessing the quality of housing in them is solved in the current work using the top-down method, i.e., from the point of view of architects, construction professionals, and environmental and socio-economic aspects. Another common denominator of these works is the solution methodology. The majority of projects are a combination of GIS and MCA, namely AHP or the TOPSIS method using fuzzy logic. There is a complete lack of bottom-up approaches, i.e., from the point of view of the end users—potential inhabitants of prefabricated houses. Therefore, the authors decided to supplement the existing approach with this aspect.
3. Materials and Methods
3.1. Objectives and Methods of Solution
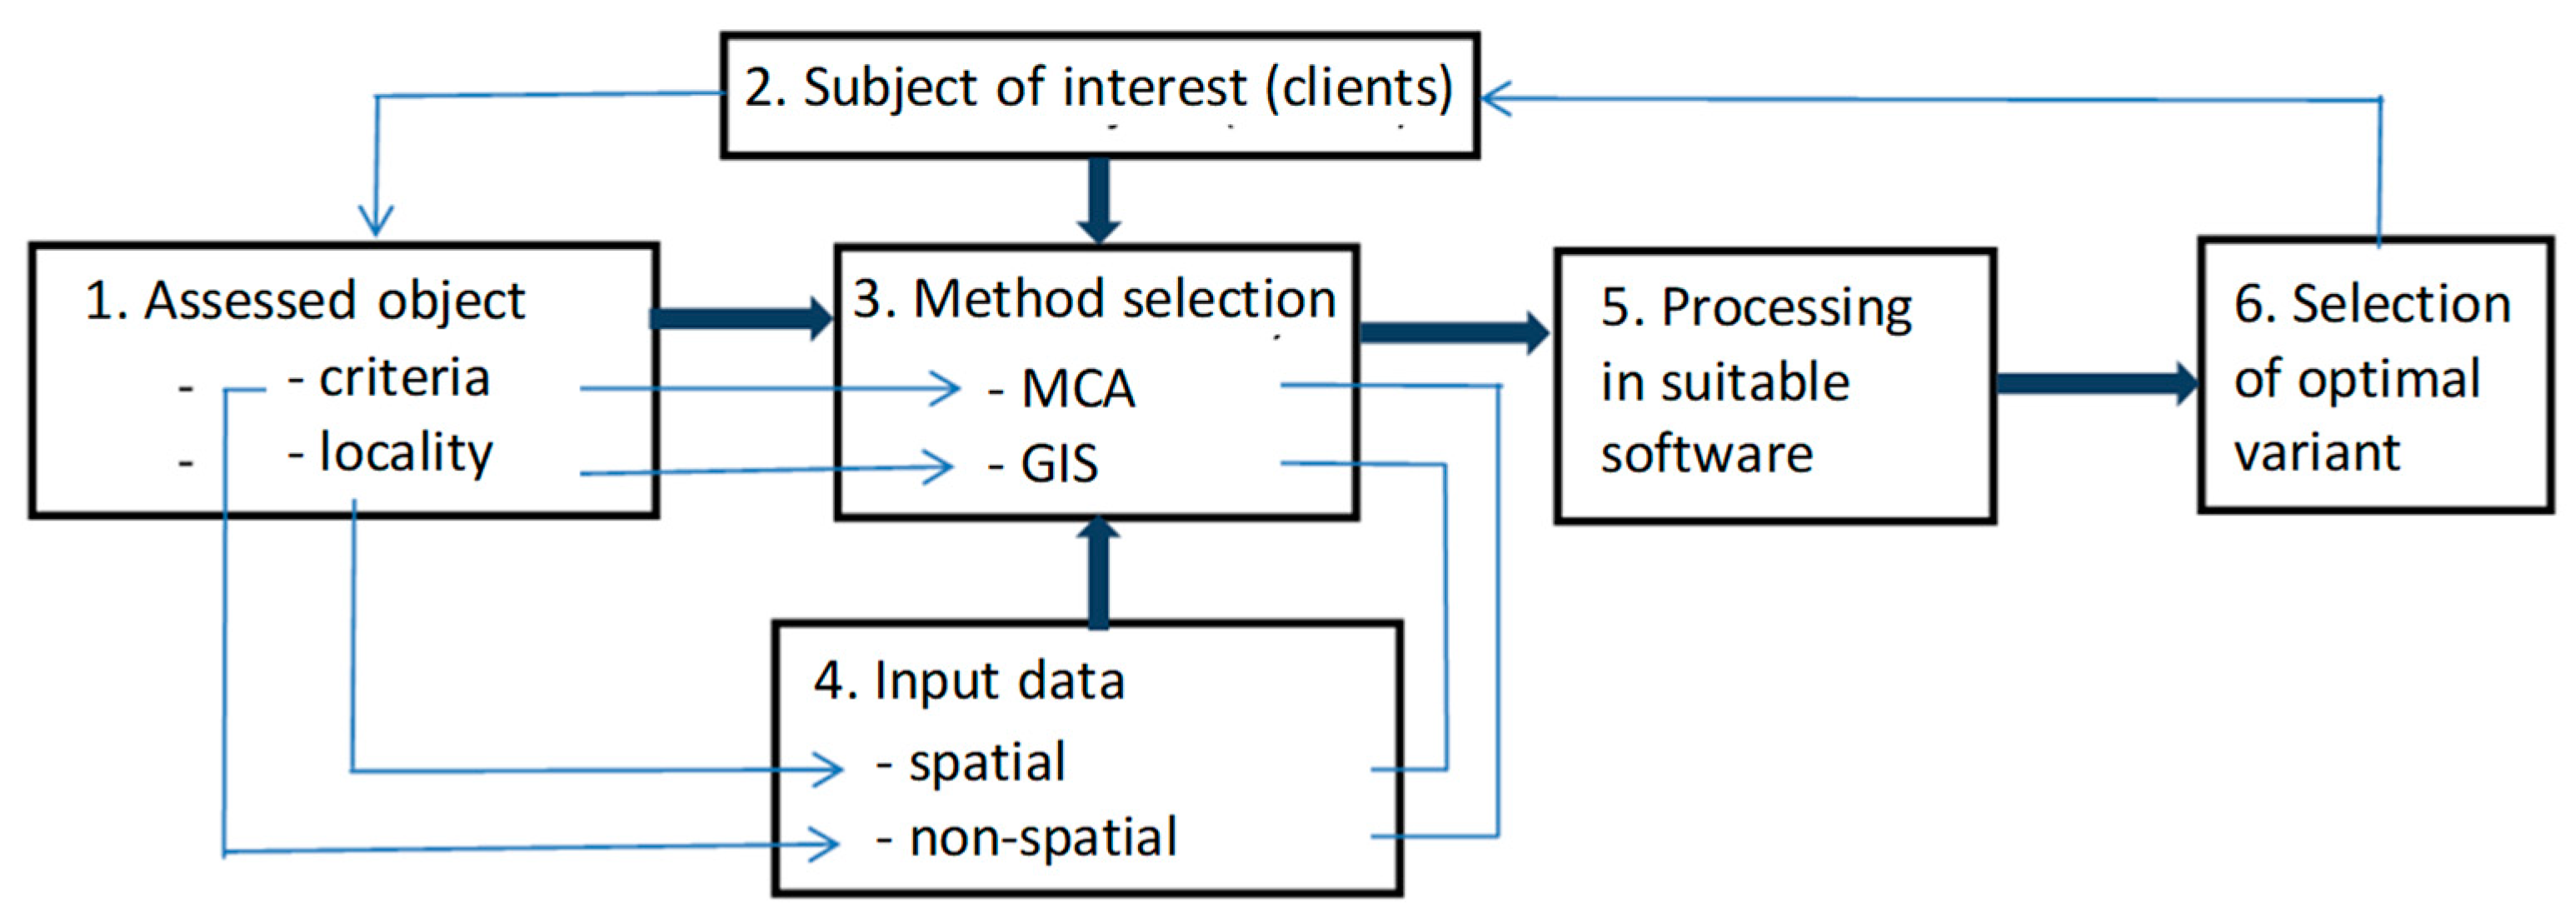
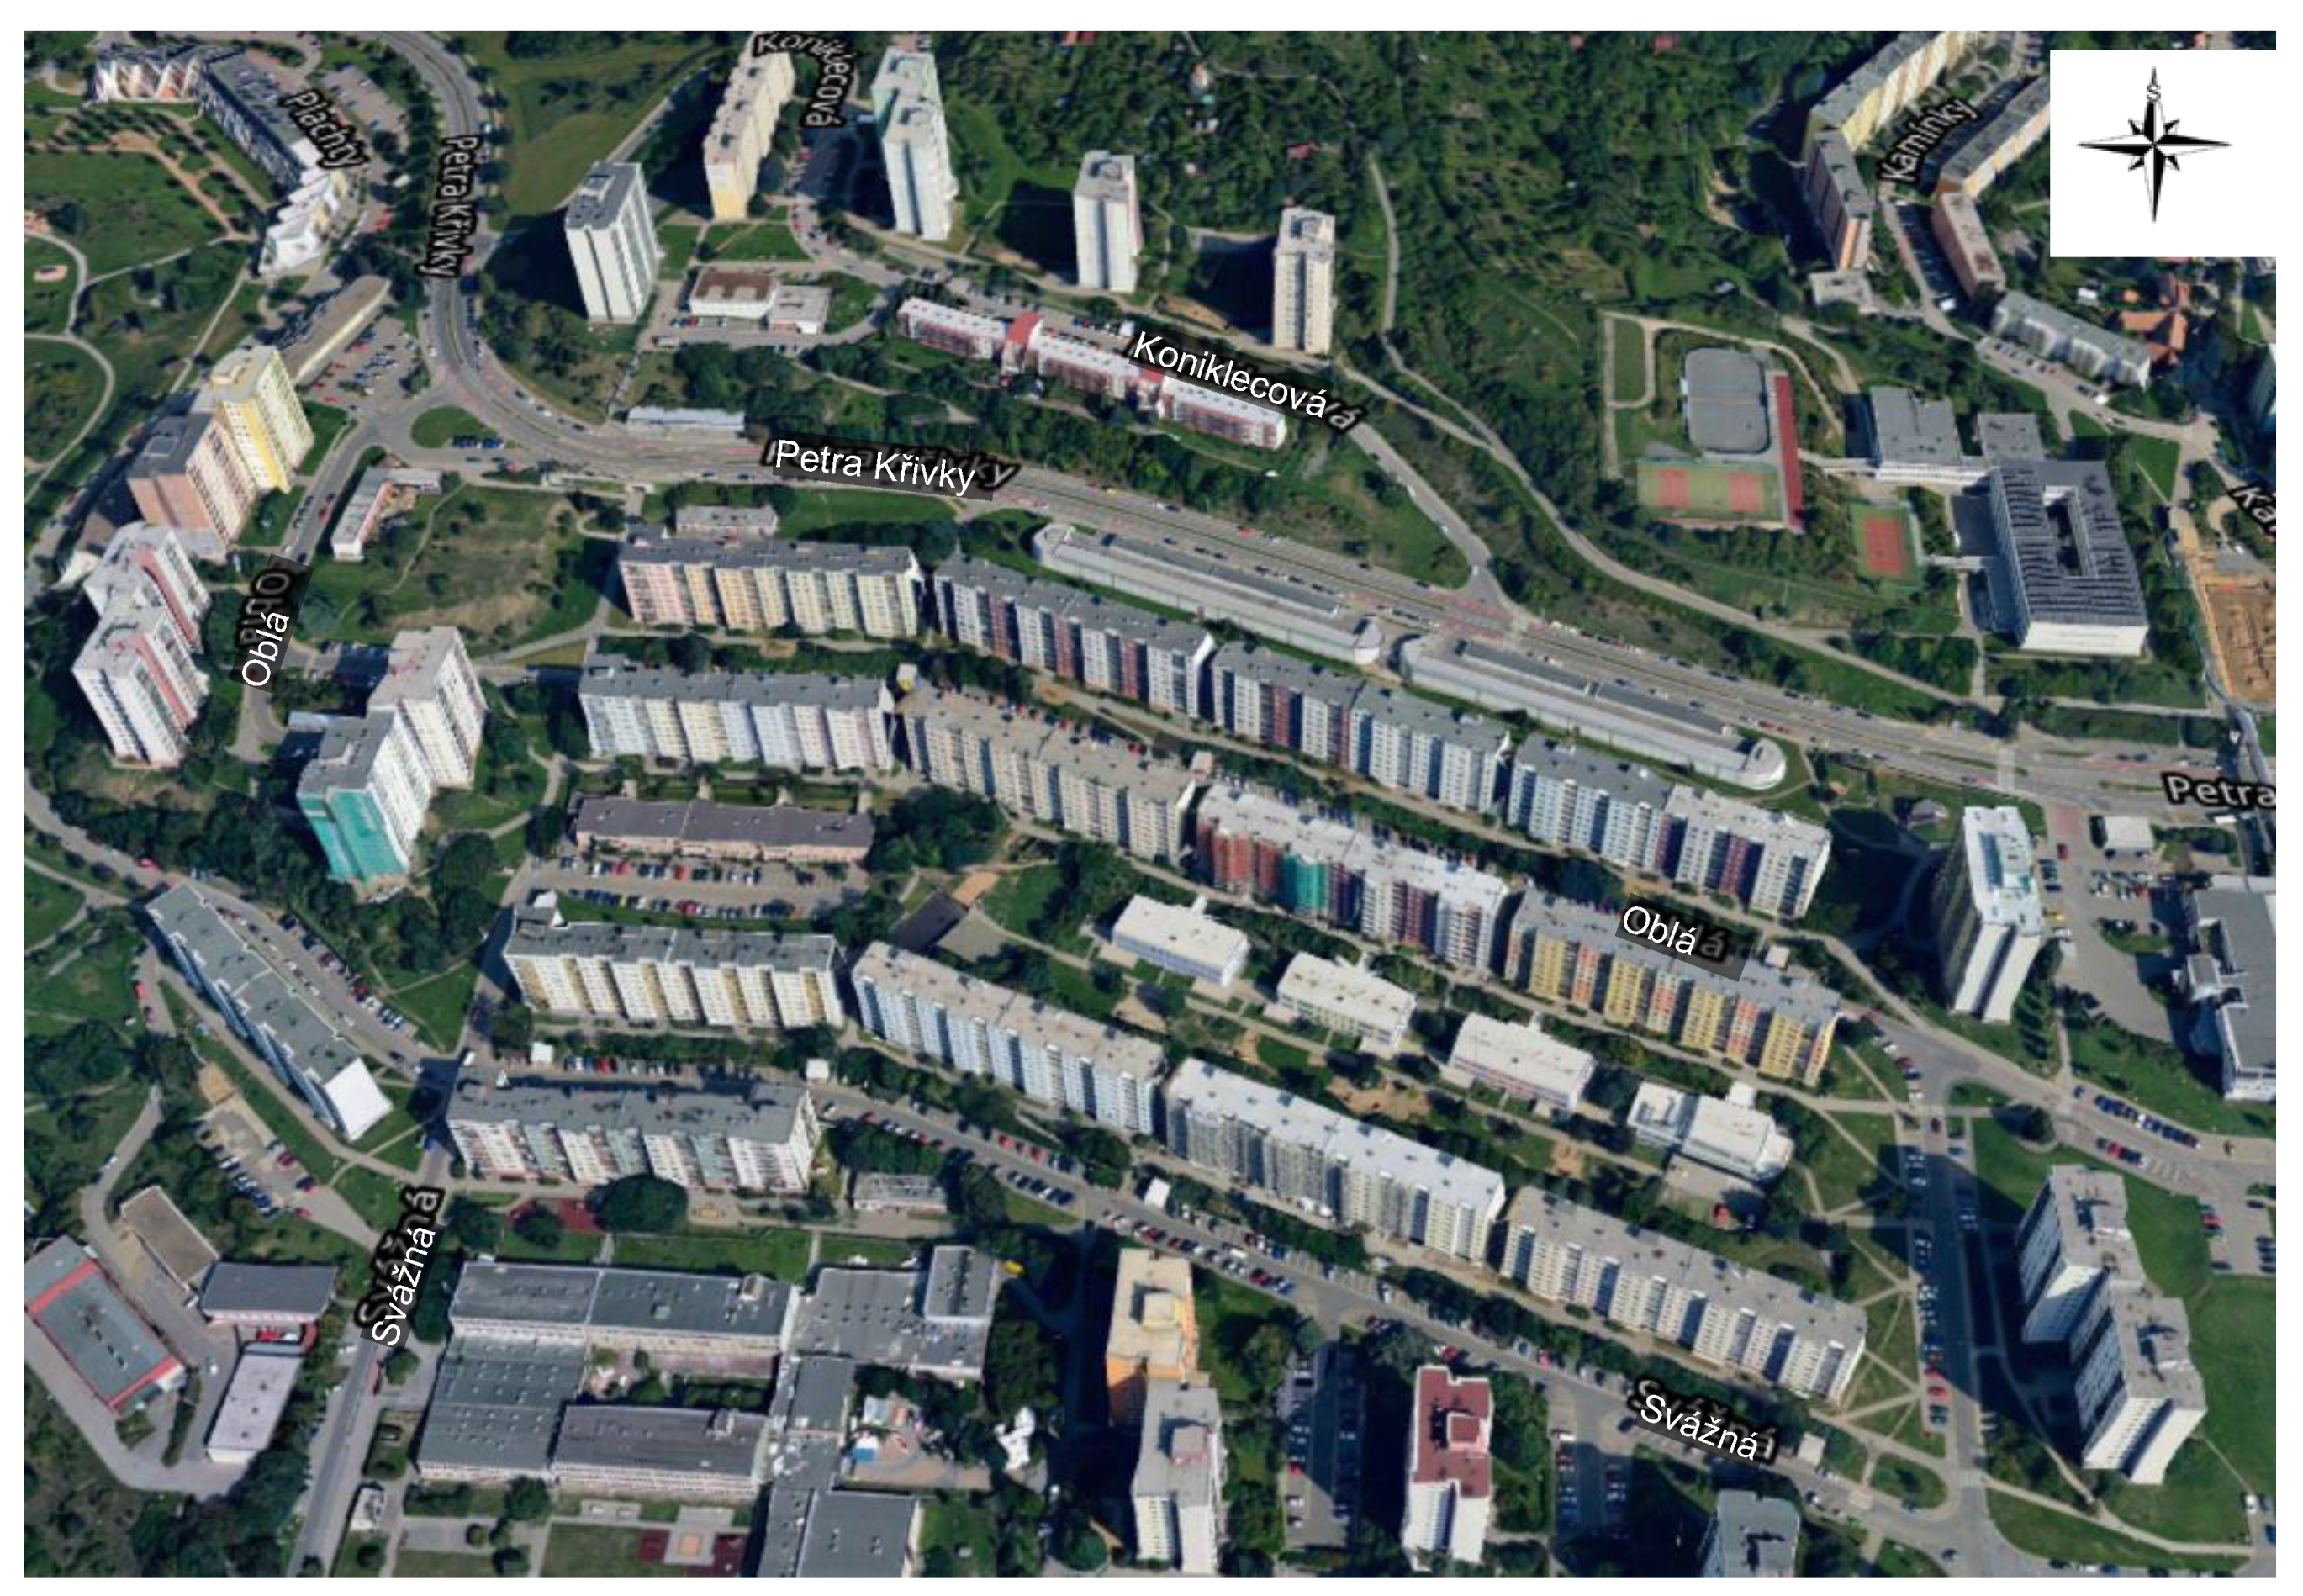
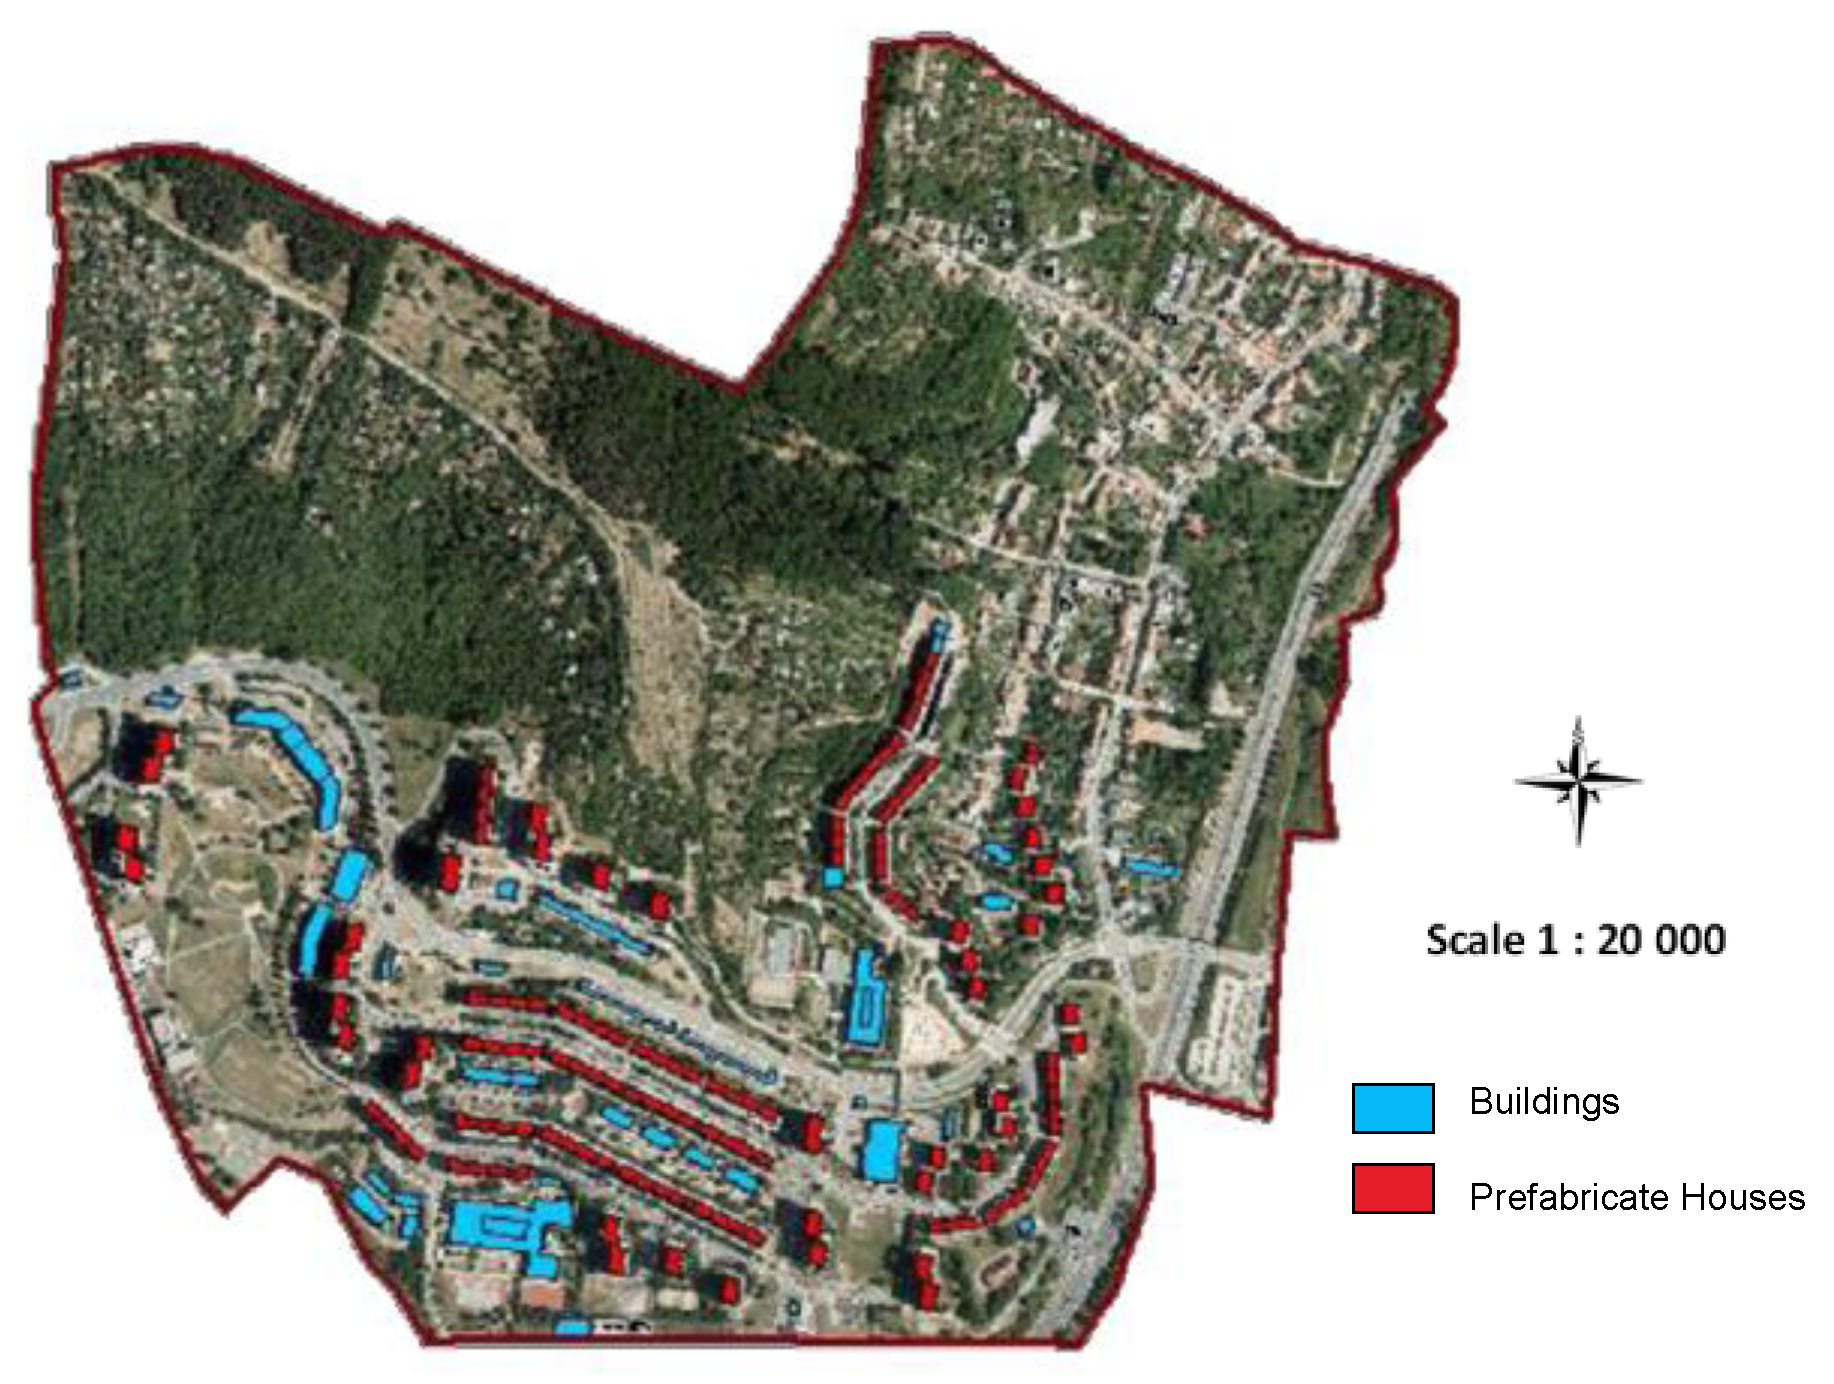
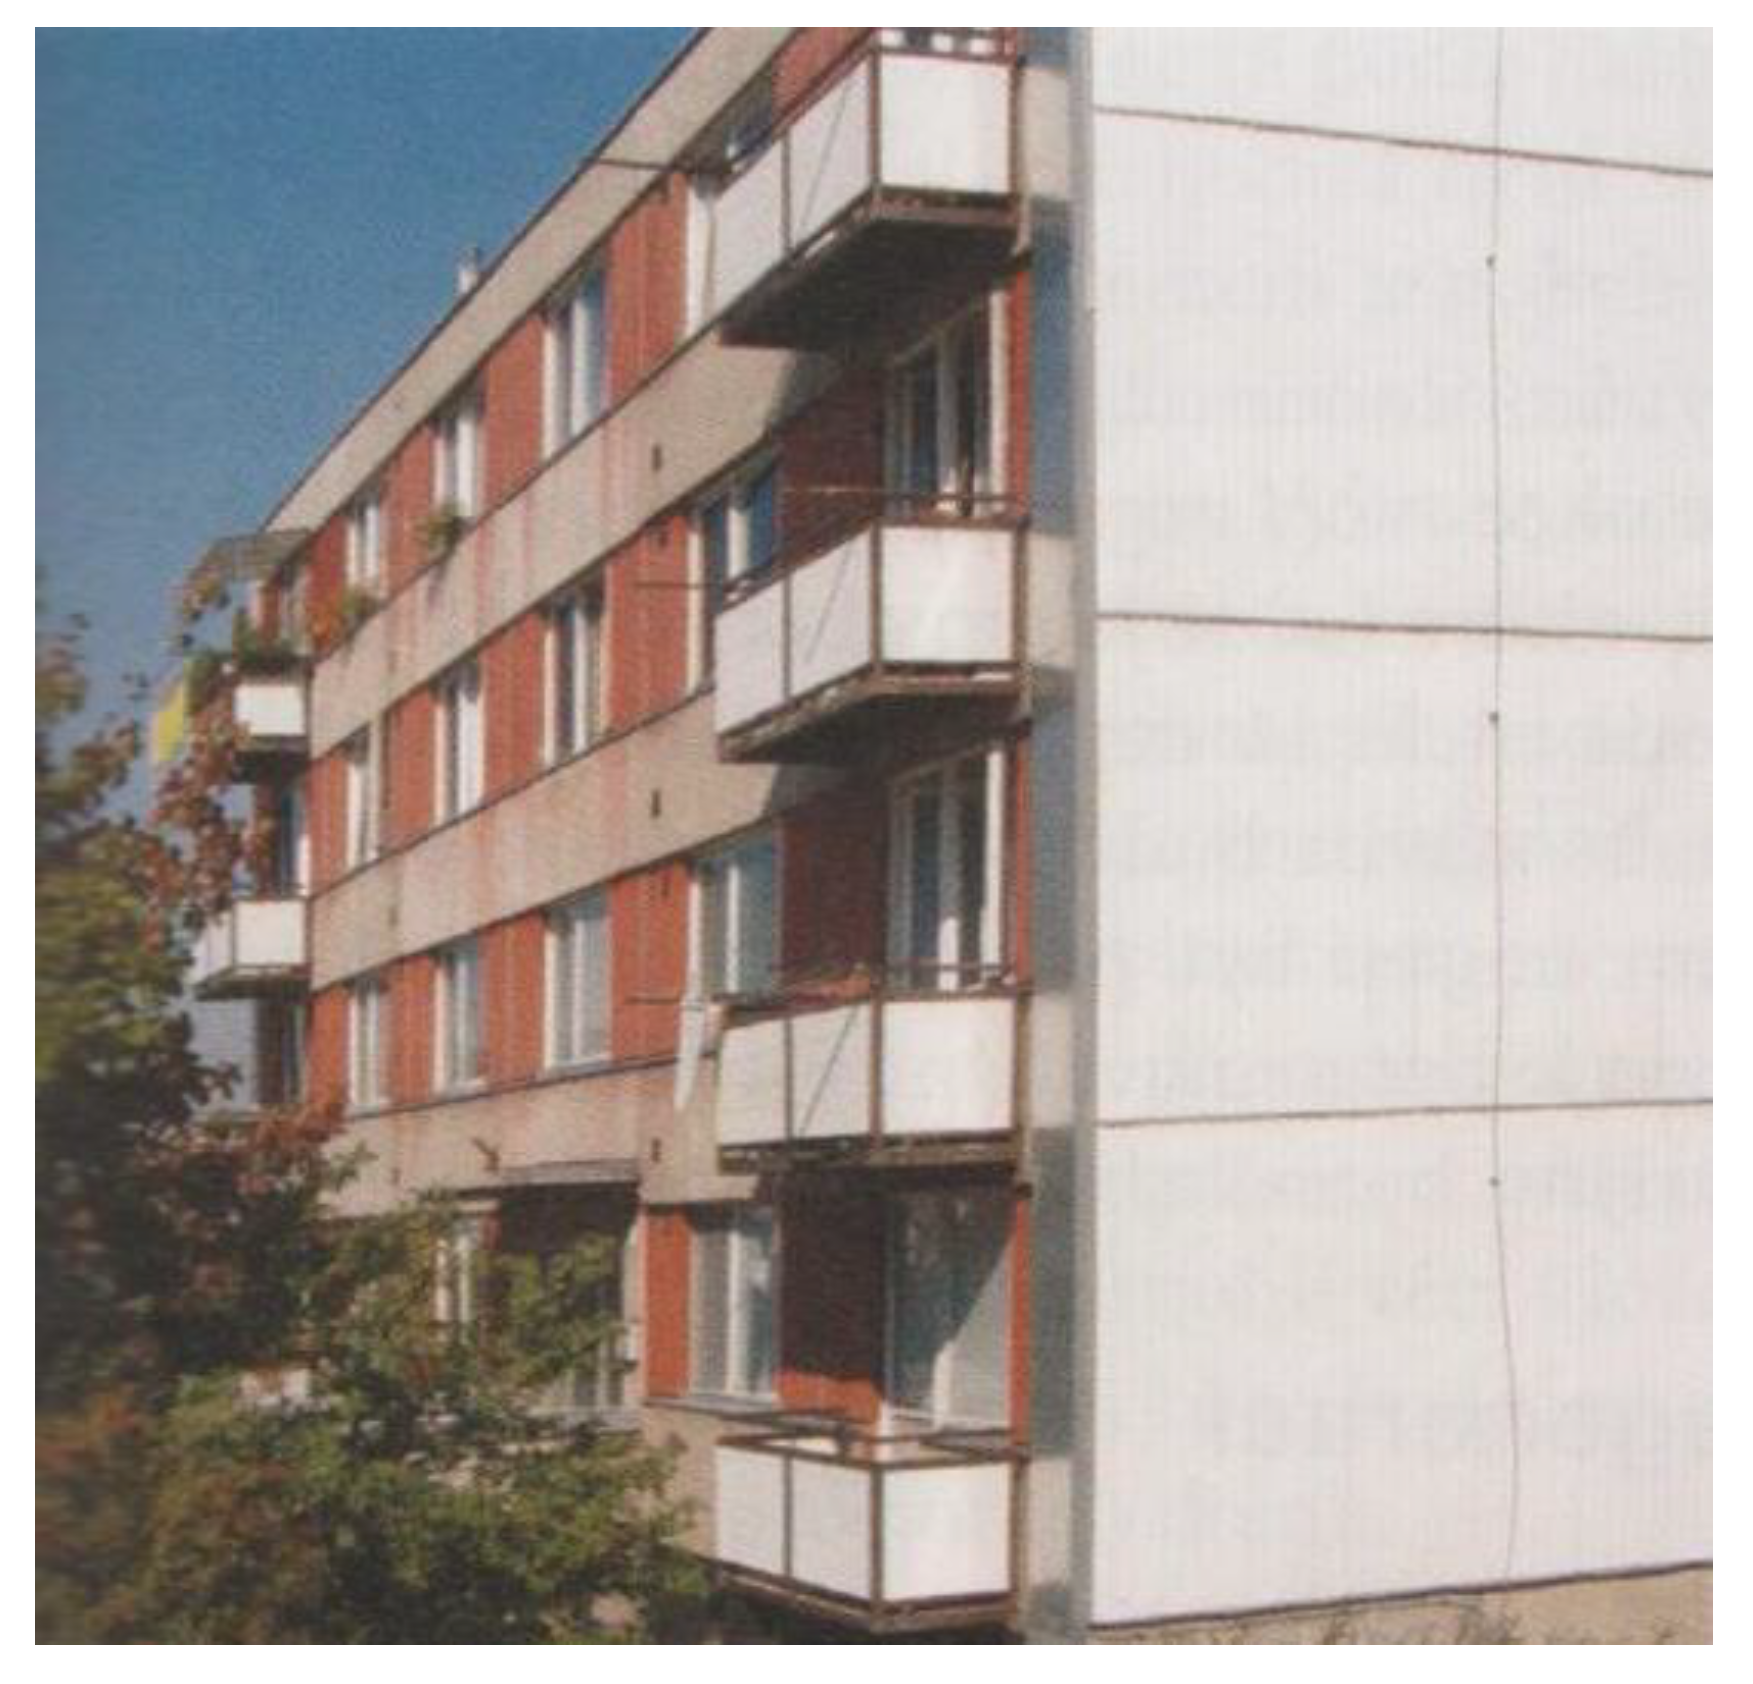
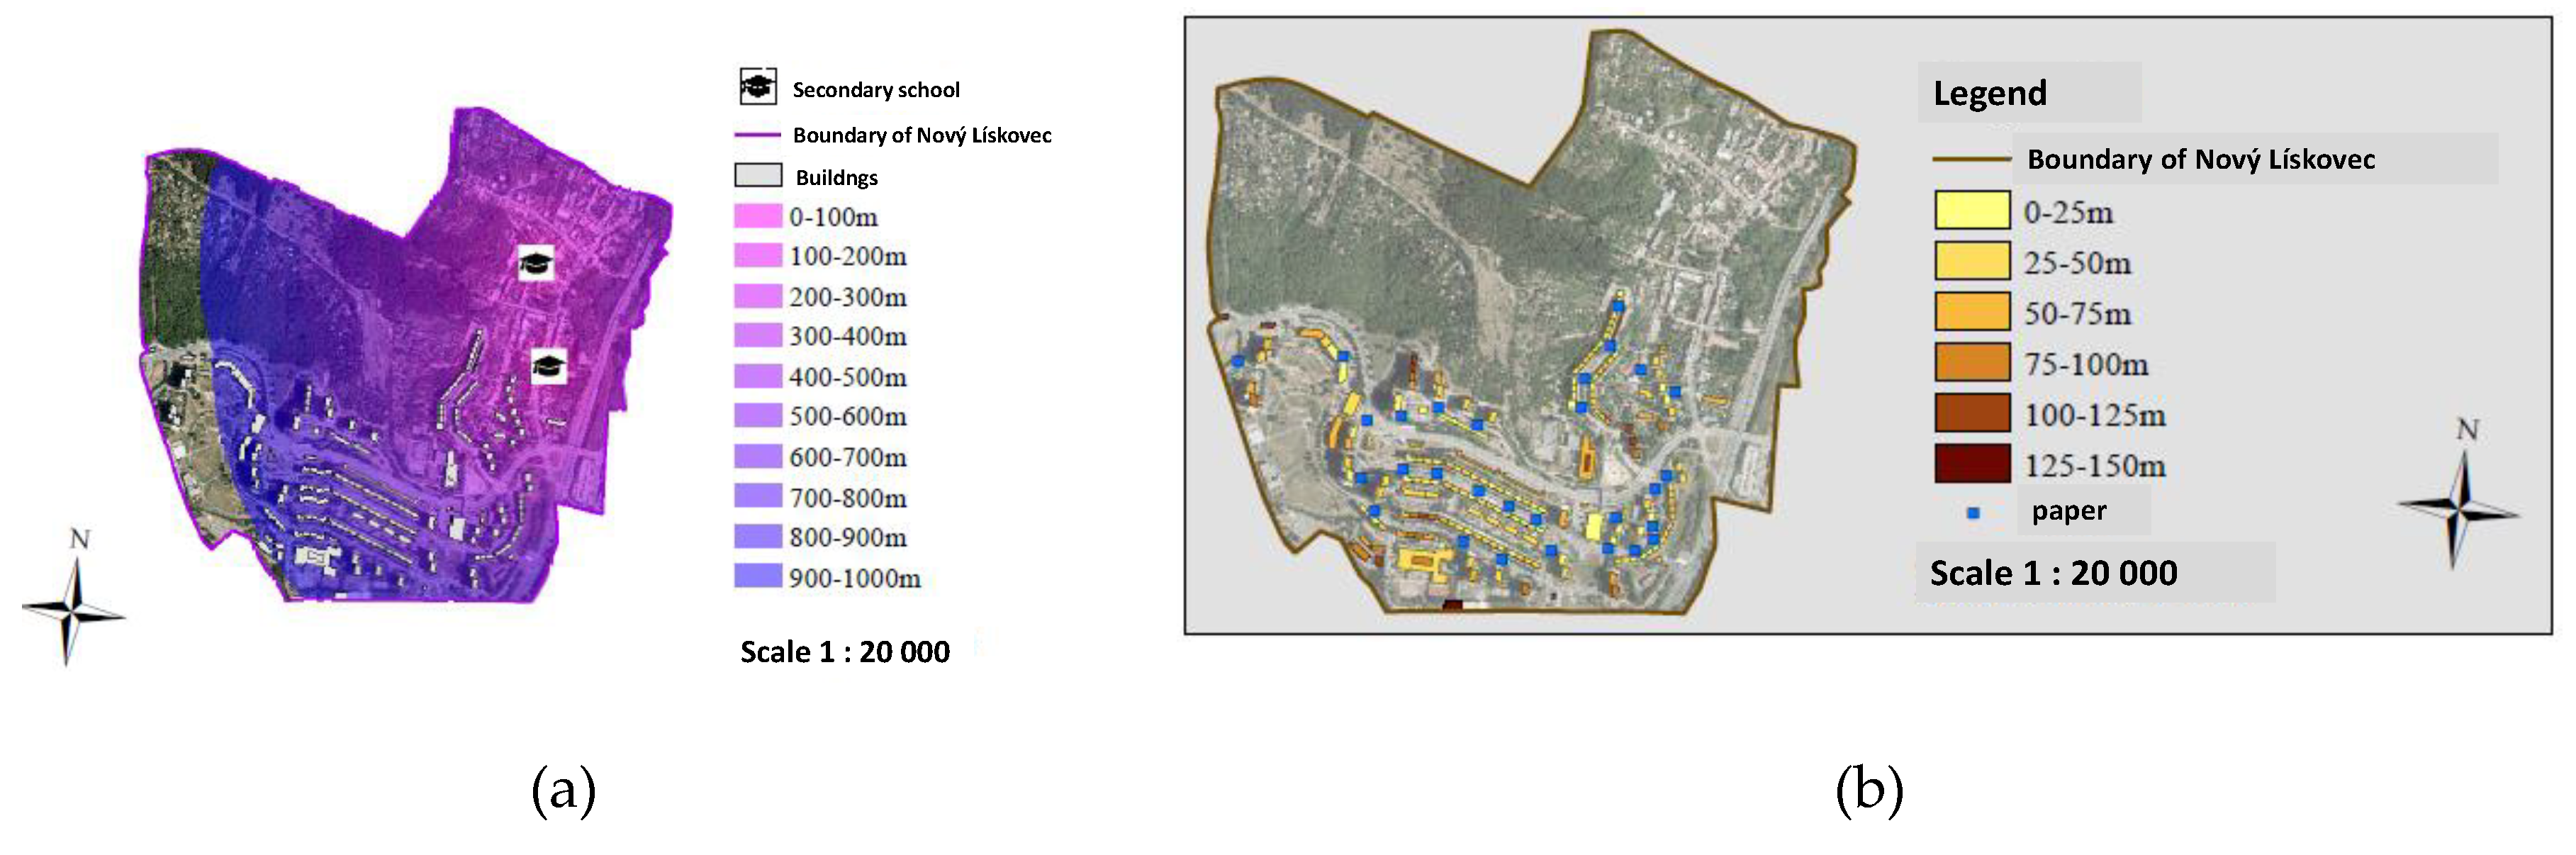
The objects under assessment (block no. 1 in
Figure 1) are prefabricated houses in Nový Lískovec, a city district in Brno (Czech Republic). The assessment criteria were selected to suit all potential housing applicants and can be divided into the following categories:
Spatial parameters:
- (a)
Distances (e.g., distances to public transport stops or distances to school buildings);
- (b)
Networks (for two types of models):
Transportation network—so-called unmanaged network. It is possible to assign direction to individual edges of the mesh.
Utility network—represents a so-called managed network. Position and direction are given in advance.
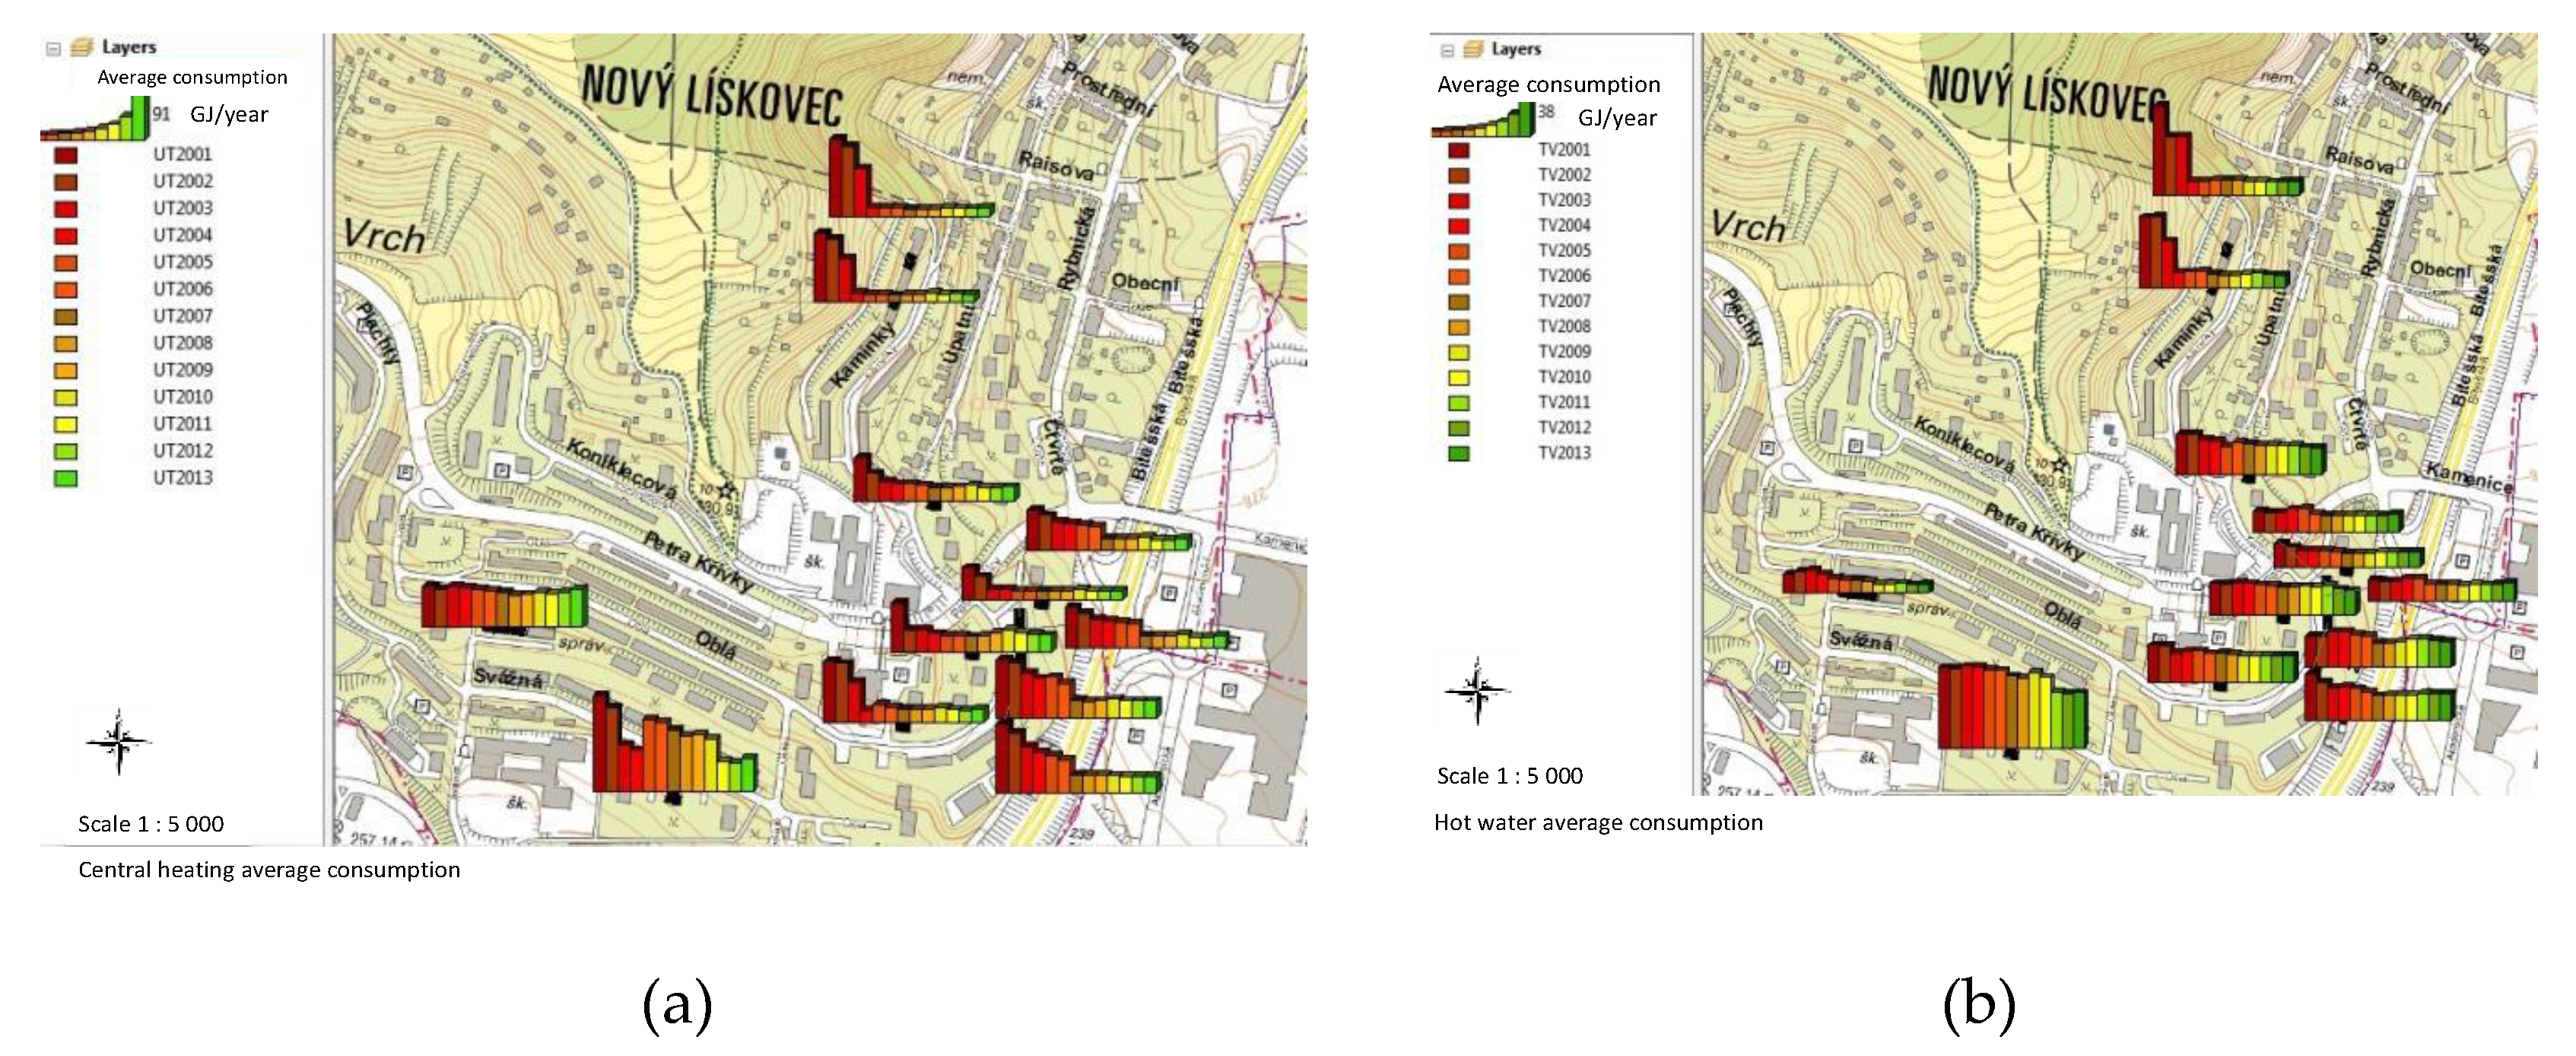
Energy intensity of housing (average energy consumption per month, recalculated consumption per person).
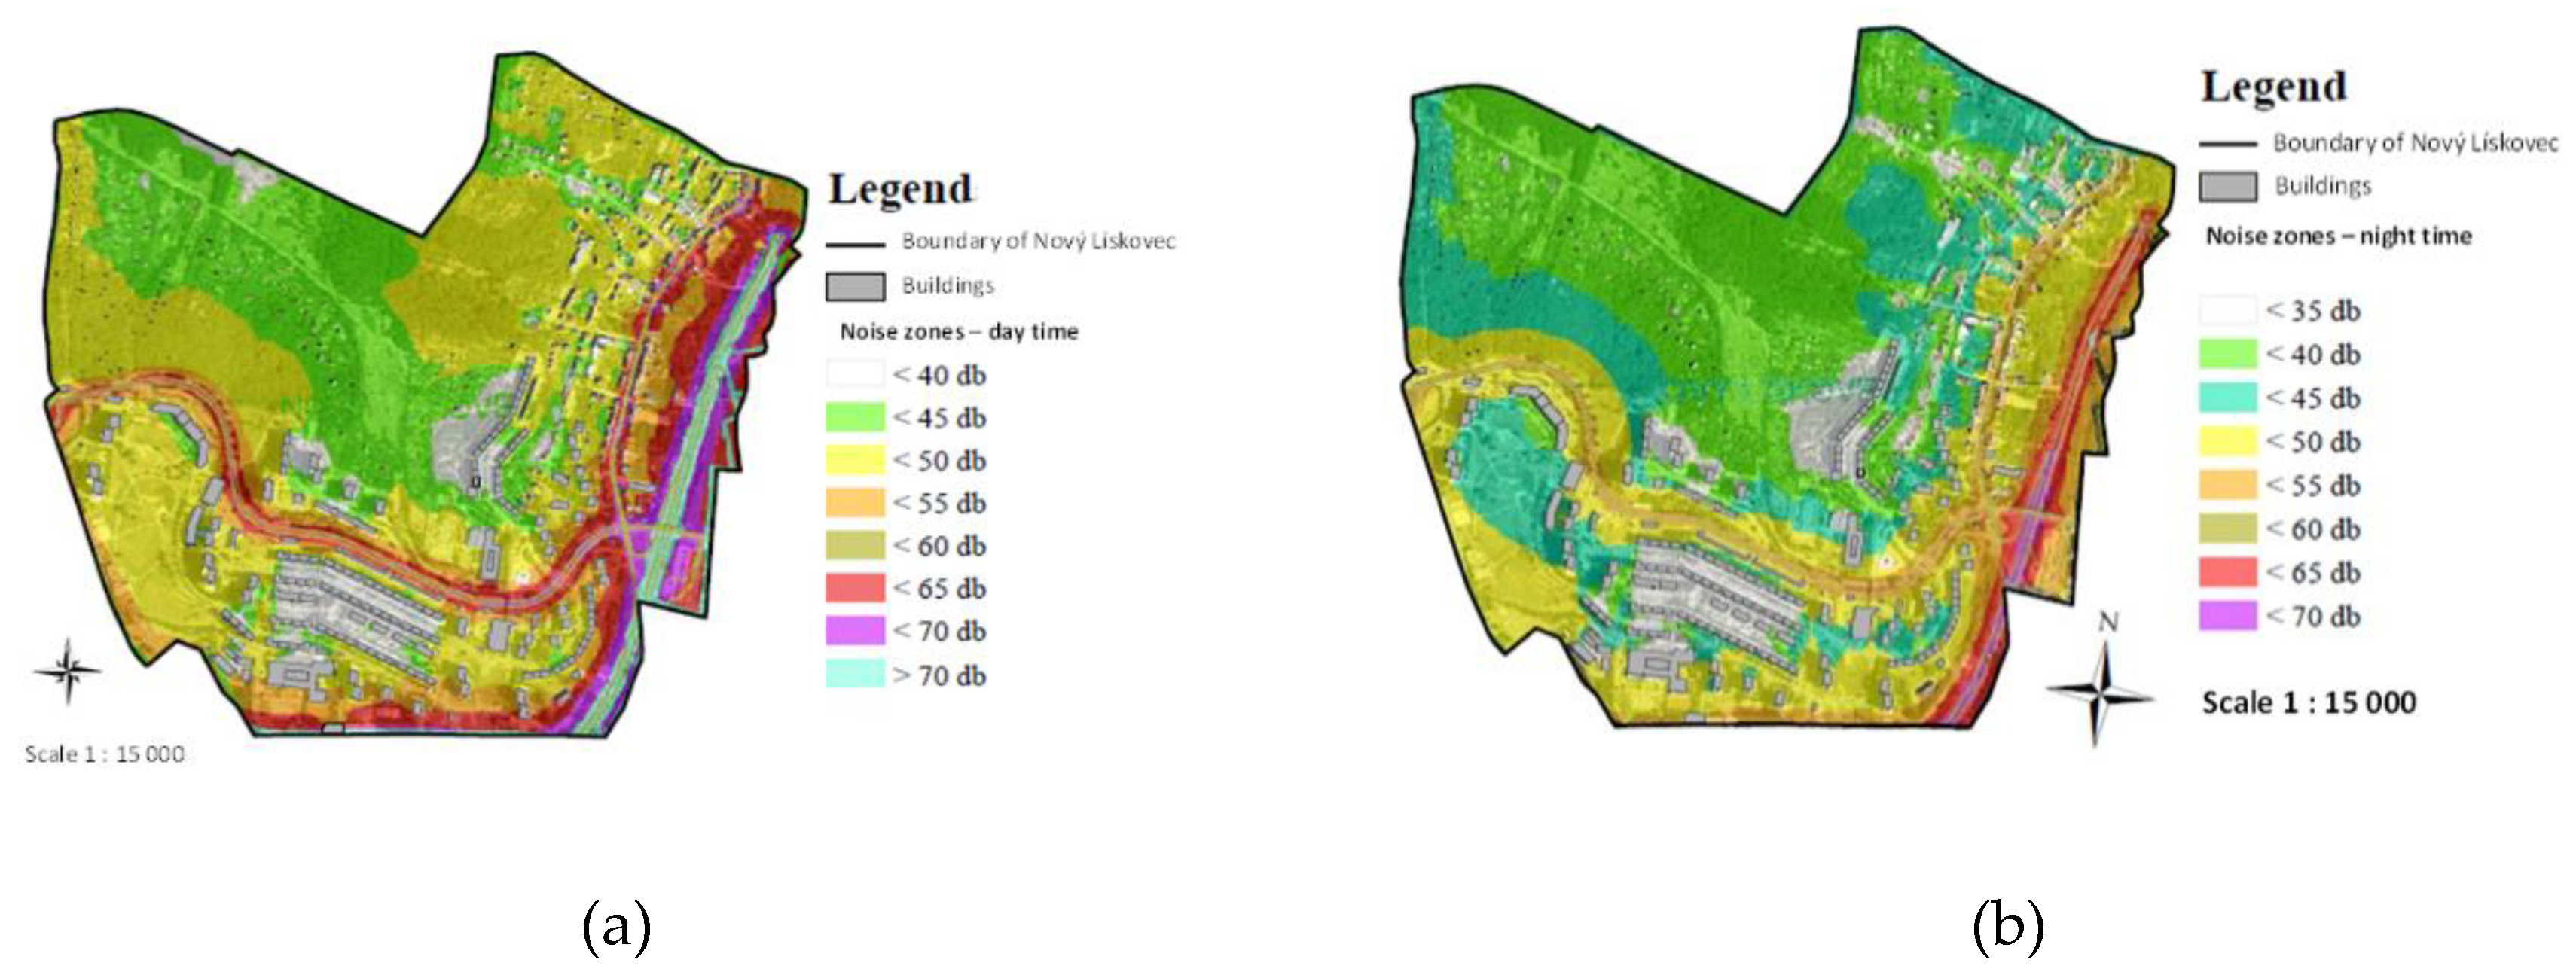
Environmental aspects (day/night noise zones).
Additional criteria (number of flats in the building, lift, type and size of flats).
Existing buildings (prefabricated houses) in the given locality were assessed in terms of permanent housing. Because it is a case of processing the generally heterogeneous statistical but mainly spatial data in a given locality, the basic model of the solution was built on multi-criterial analysis (MCA) in a geographic information system (GIS). A general scheme of this approach is shown in
Figure 1. In block no. 1, the modeled area (Nový Lískovec) is selected and the evaluation criteria are determined. These criteria are determined by clients (block no. 2), the values of the criteria were fuzzified in the interval <0, 10> in terms of finer resolution (from unacceptable to the most suitable value). In this case, clients are potential people interested in permanent housing in a given locality and in a given type of building (panel house).
In block 3, the solution method is determined and a model is created in GIS. The required input data of the model are available in block no. 4. The scope of input data is given by the selected locality, and their content is determined by the evaluation criteria (e.g., for distance analyses, a layer of roads is required). The actual processing takes place in block no. 5 in a suitable GIS software—in our case, ArcGIS with an implemented MCA algorithm—and WLC in the form of a plug-in module. After the calculation in block no. 5, the final evaluation will take place in block no. 6. Here, the values are defuzzified by thresholding, i.e., the scale <0, 10> is converted to the interval <0, 1>, where 0 = unsatisfactory and 1 = satisfactory value of the criterion. From all criteria, a suitable or unsuitable variant is then determined using MCA, and the result is available to the client (respondent—see block no. 2).
3.2. Input Data
The input data (block 4 in
Figure 1) can be divided into spatial (vector and raster) and non-spatial data. Vector spatial data were obtained from the ZABAGED database, particularly its planimetric part, which contains 2D spatial information and descriptive information on settlements, roads, distribution networks, pipelines, water, territorial and protected units, vegetation and surfaces, terrain relief, and point fields. Other vector element classes that were not contained in the ZABAGED database were created manually as new element classes, such as the Integrated Traffic System of the South-Moravia Region IDS JMK stop layer or the separated waste container location layer. Raster spatial data were obtained as freely available image formats from Internet servers and were transformed and georeferenced to the Datum of Uniform Trigonometric Cadastral Network S-JTSK coordinate system—i.e., a raster map of separated waste containers available on the map portal of the city of Brno [
23] or a map of IDS JMK stops available on the server of the integrated transport system of the South Moravian Region [
24]. The noise map of the day and night time was freely available on the website of the Municipality of Brno in PDF format on two map sheets. Transformation of PDF format to TIFF raster format and its subsequent geo-referencing was used as an input for the noise zone solution in the area of Nový Lískovec [
25]. Other spatial data were used as the underlying layers (orthophoto and ZM 10), which were obtained from the Web Map Services WMS services of the COSMC geo-portal.
The remaining data were statistical (non-spatial). Data on lift equipment of prefabricated houses were obtained from RUIAN (register of territorial identification of addresses and real estate), which is one of four registers of electronic support of the public administration e-Government e-GON CR. Data on population in the given locality and information on heating of flats were obtained from the Department of Housing and House Administration in Nový Lískovec.
3.3. Pilot Questionnaire Survey
The aim of the pilot questionnaire survey was to obtain a sample of parametric data in the model so that it could be debugged by software. The priority was the creation of a functional modifiable model, and the authors were aware of the lower explanatory power of this pilot survey due to the small number of respondents. It was expected that after debugging the model, it would be subsequently filled with more extensive data, e.g., from selected official statistics and other databases related to the real estate market.
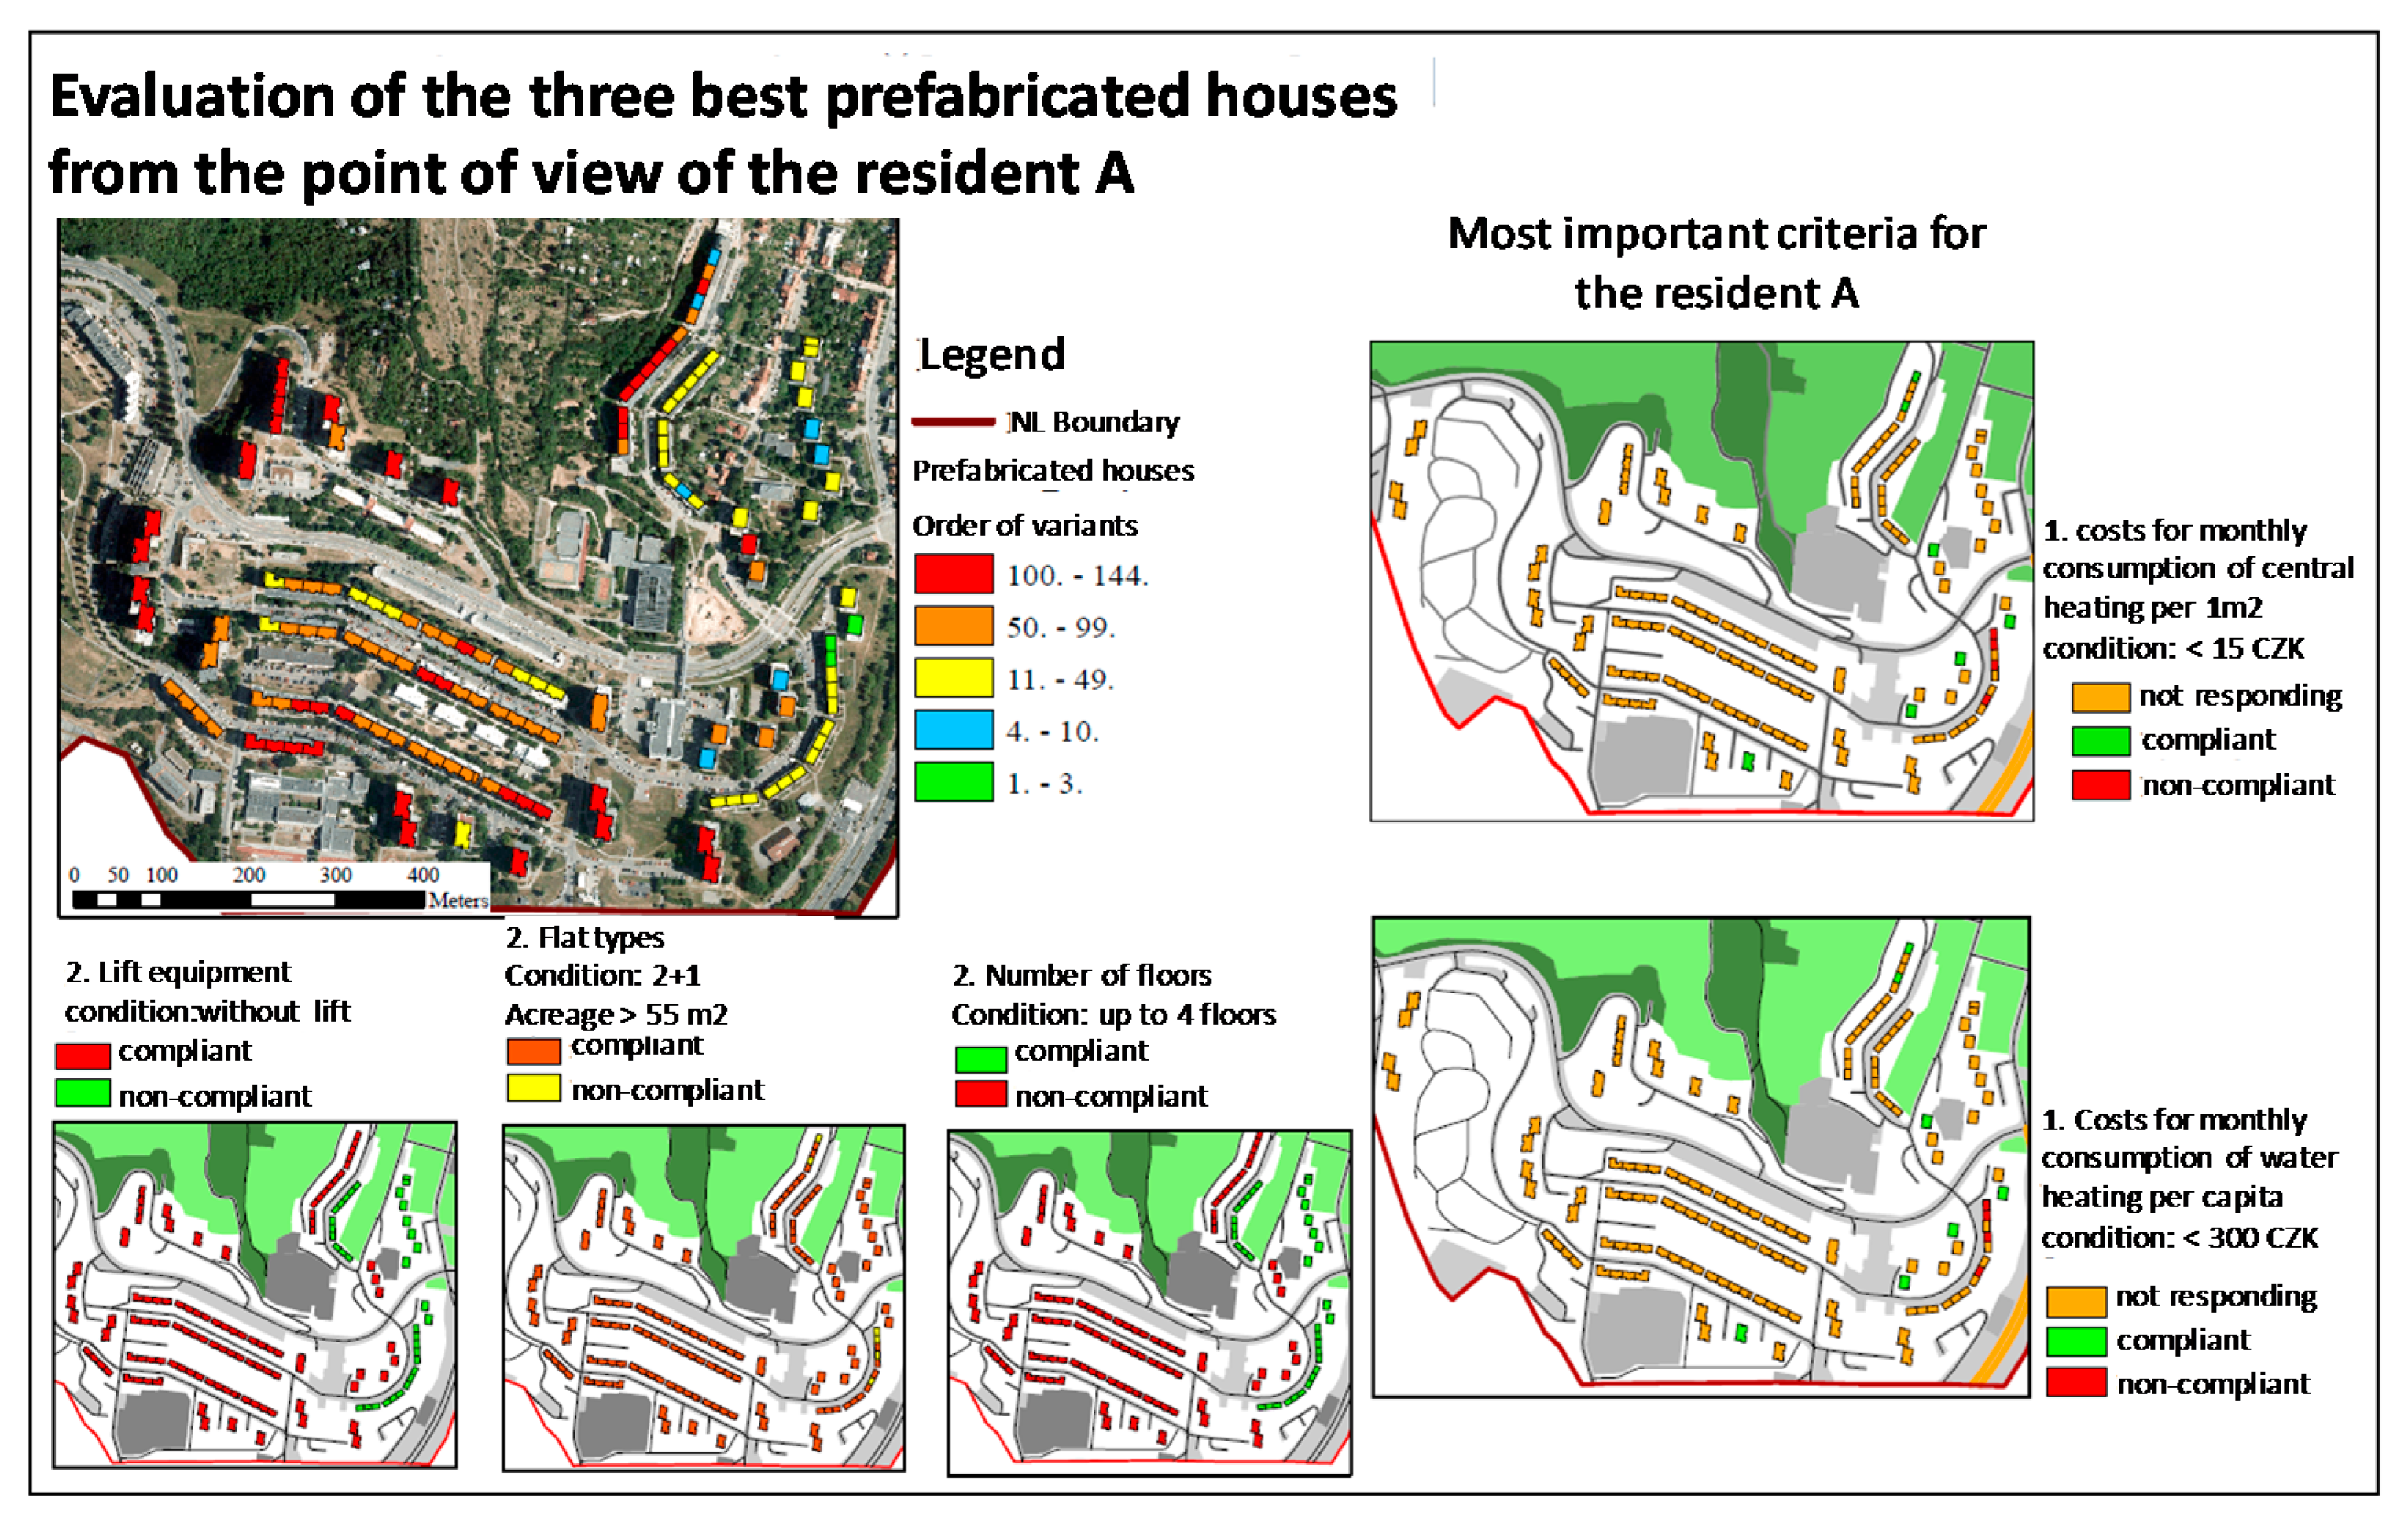
The following three groups of people were interviewed in a pilot questionnaire survey:
A—persons over 50 working in the center of Brno;
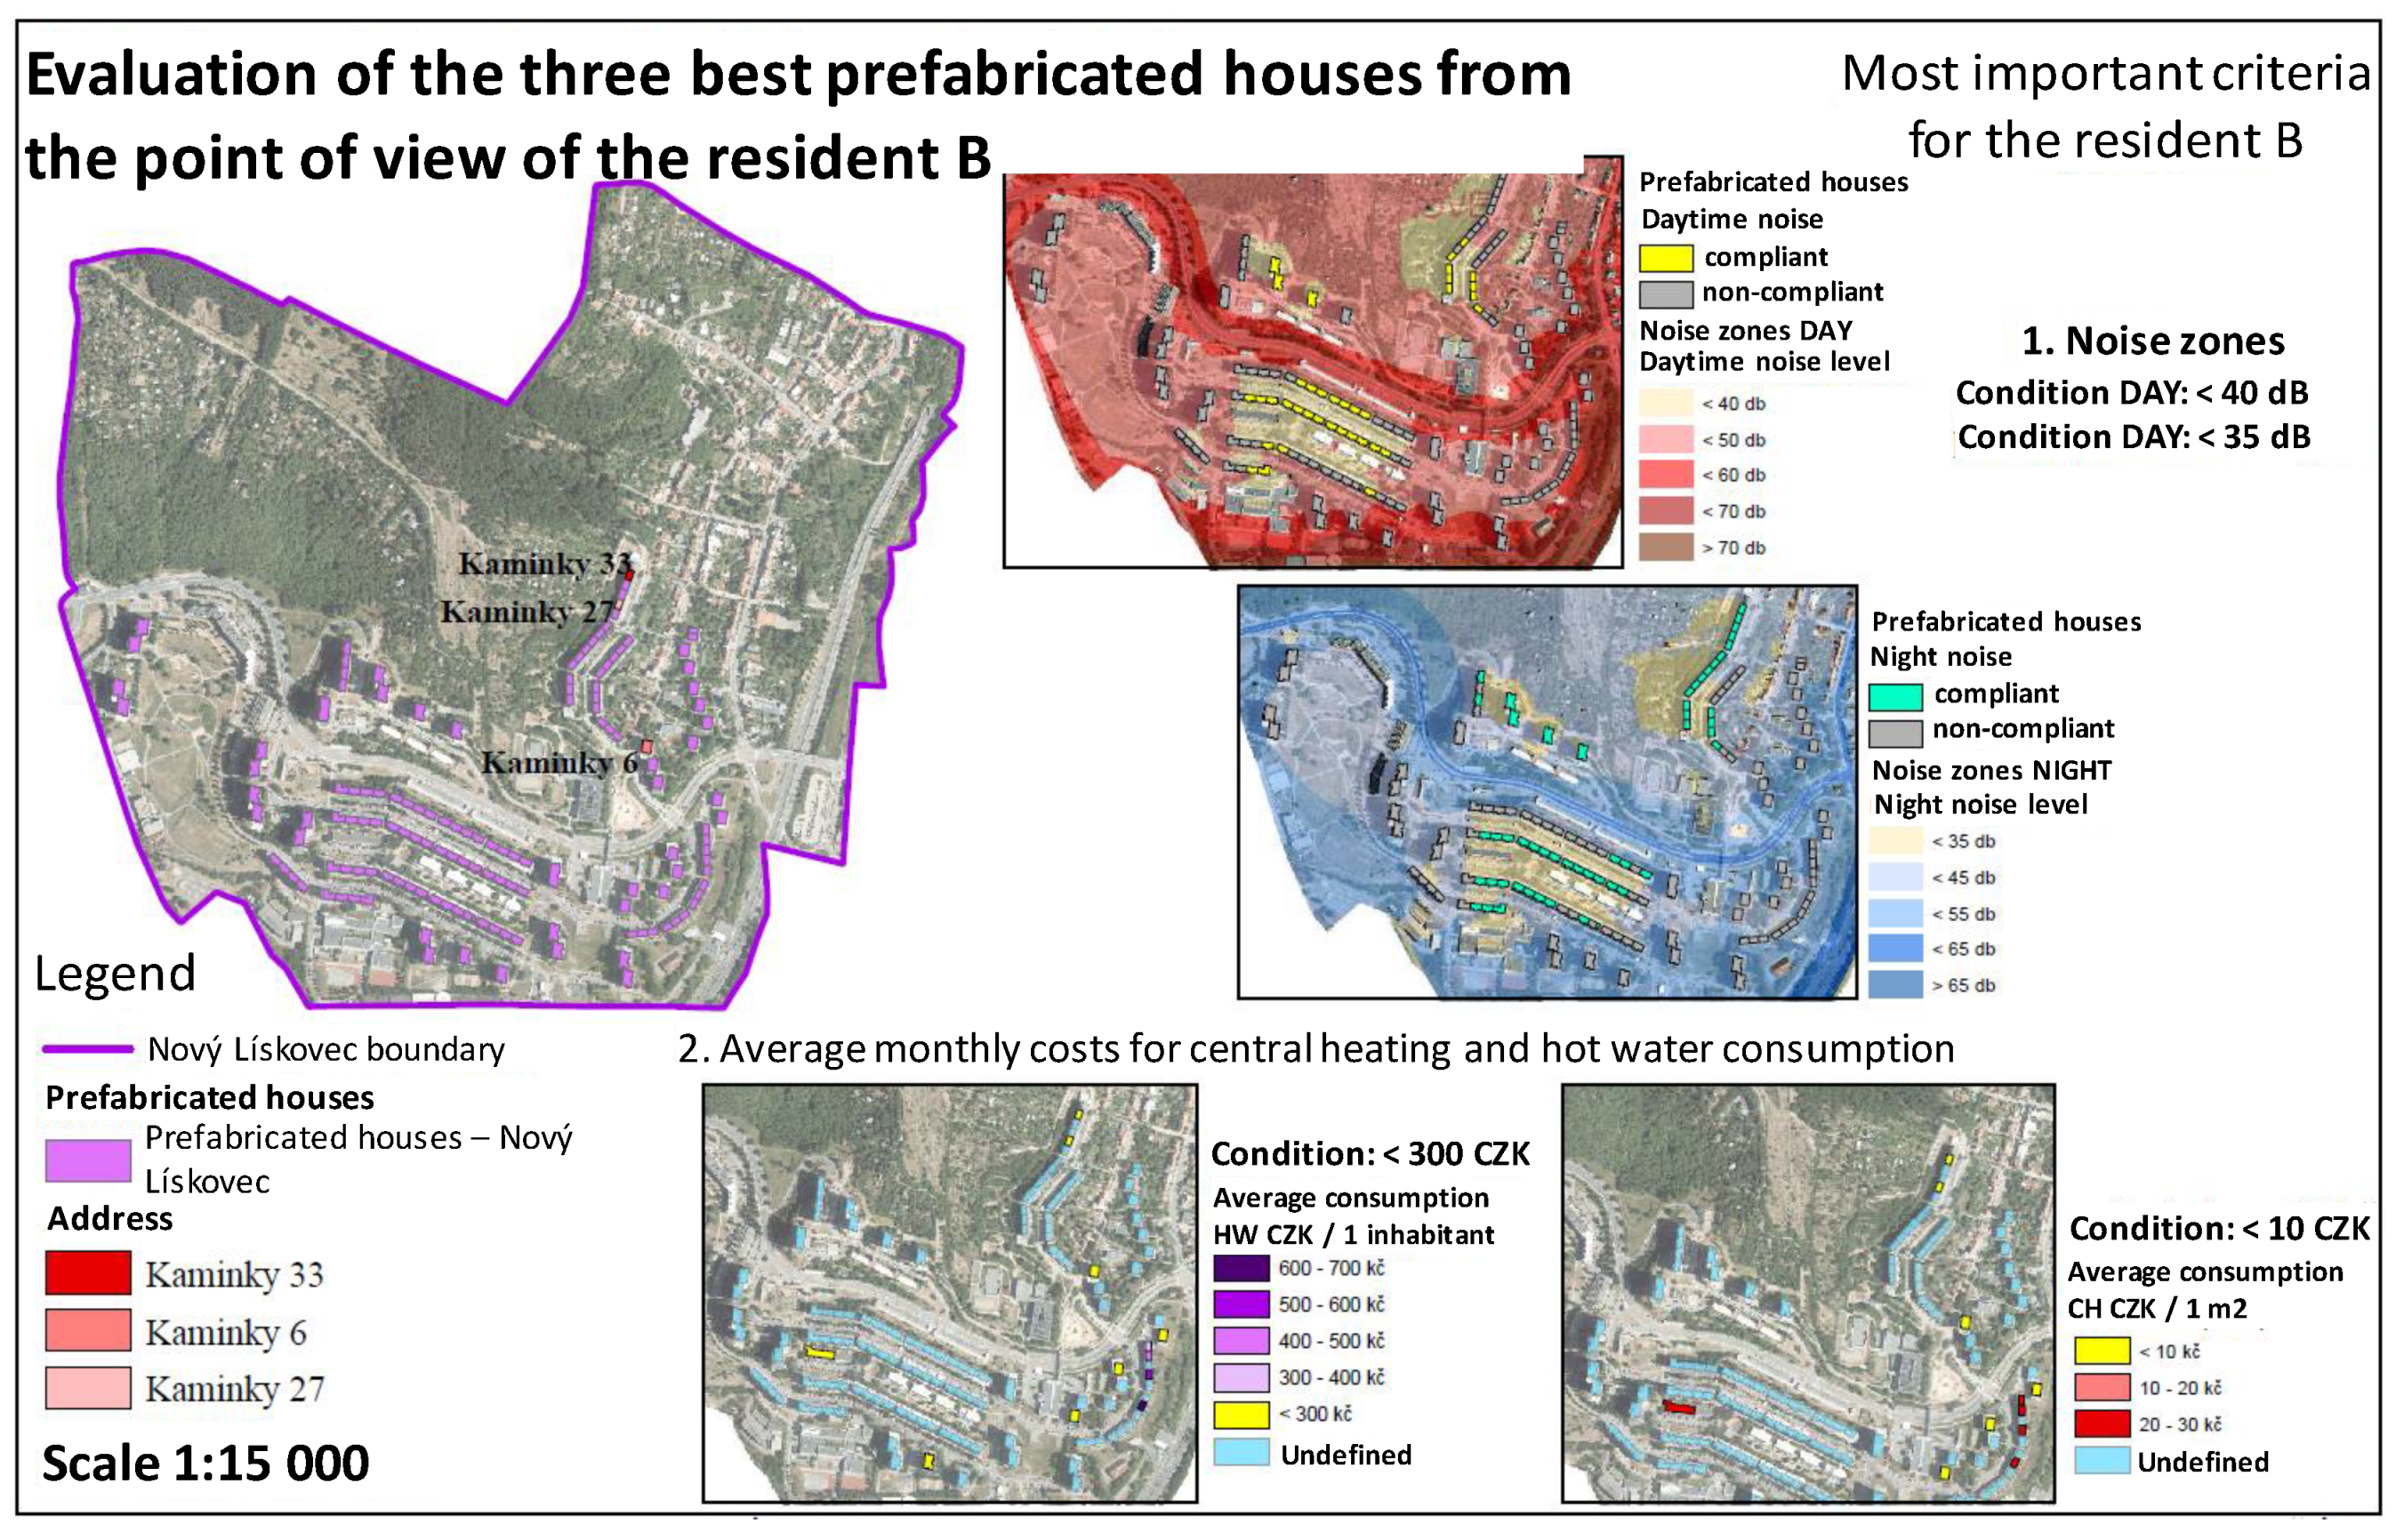
B—young families of three looking for housing in the locality;
C—students under the age of 25 studying in Brno.
The survey was conducted directly by walking in the field and addressing random pedestrians who were willing to participate in the questionnaire survey and who, at the same time, fell into the appropriate category of respondents. In category A, the necessary data were obtained from a total of 18 persons, in category B from 16 persons, and in category C from 20 persons. The questionnaire survey was carried out partly by a tour in the locality of interest, Nový Lískovec. Category C was investigated partly in the locality of interest and also among students at the university. A questionnaire template (16 questions) was prepared for the survey. Respondents assigned importance to individual criteria. The scale was determined in the interval <0, 10> (0 = least important, 10 = most important). Based on the results, the weights of individual criteria were determined (see Chapter 4.4.4.). Respondents were also co-creators of the criteria by being able to modify the template according to their priorities. Data from the templates were summarized and supplemented by assigning the appropriate weights, and subsequently used as input for the multi-criteria analyses.
3.4. Multi-Criteria Analysis
The solution is based on the analysis of selected data according to several criteria, the creation of a list of variants, their sorting according to their contribution to the result of the solution, and finding the most advantageous variant. Multi-criteria decision theory is based on mathematical modeling. Spatial analysis works with data that are tied to a specific place and carry information about the spatial location.
For all multi-criteria decision-making tasks, it is necessary to define at the beginning:
Subject of decision-making.
Decision-making objectives and conditions to be met in the objective.
Decision-making aspects to be respected in decision-making.
The time horizon in which the decision result will apply.
There are a number of steps to take to select or recommend the best solution:
Creating and determining a set of evaluation criteria.
Assignment of weights to individual evaluation criteria.
Determination of model values of criteria weights.
Partial evaluation of the achieved results.
Risk assessment of the implementation of individual variants.
Determining the final order of all variants and selecting the best variant.
Overview of applicable methods:
The weighted linear combination method (WLC) is based on the principle of weighted averages. The criteria are converted into common numerical series, followed by the assignment of weights, and then the series are combined with the help of a weighted average.
The analytical hierarchical process method (AHP) is based on the principle of dividing more complex problems into less complex ones and arranging them into a hierarchical structure in which the decision-making process will take place. It is based on pairwise comparison. All elements influencing the outcome of decision-making, the relationships between them, and the intensity of interaction are taken into account. It is currently one of the most widely used methods of multi-criteria decision making.
The ordered weighted average method (OWA) has a similar basis to that of the WLC method on the principle of the weighted average, but three important components are taken into account—the value of the criterion, the weight of the criterion, and the order of the weights. A higher degree of risk control and balance is achieved by means of so-called ordered weights, which are assigned to individual criteria. The weights are determined by pairwise comparison and are then sorted from the least suitable level to the highest. The first lowest weight value will be given to the criterion with the lowest suitability value, the second lowest weight will be assigned to the criterion with the second lowest suitability value, etc., up to the highest value.
The ELECTRE method (Election et Choix Traduisant la Réalité) is based on the arrangement of variants into identification classes on the basis of preferences or disparities. We work with the selection of effective variants, arranging the variants according to the order and sorting the variants into groups.
In our case, the WLC method was chosen from all the mentioned methods to evaluate the criteria. This method is suitable because the criteria are assigned weights of different sizes, and the resulting variant is given by the ordered sum of all values of the criteria. Another advantage is that this method can be used for any GIS system for both raster and vector data.
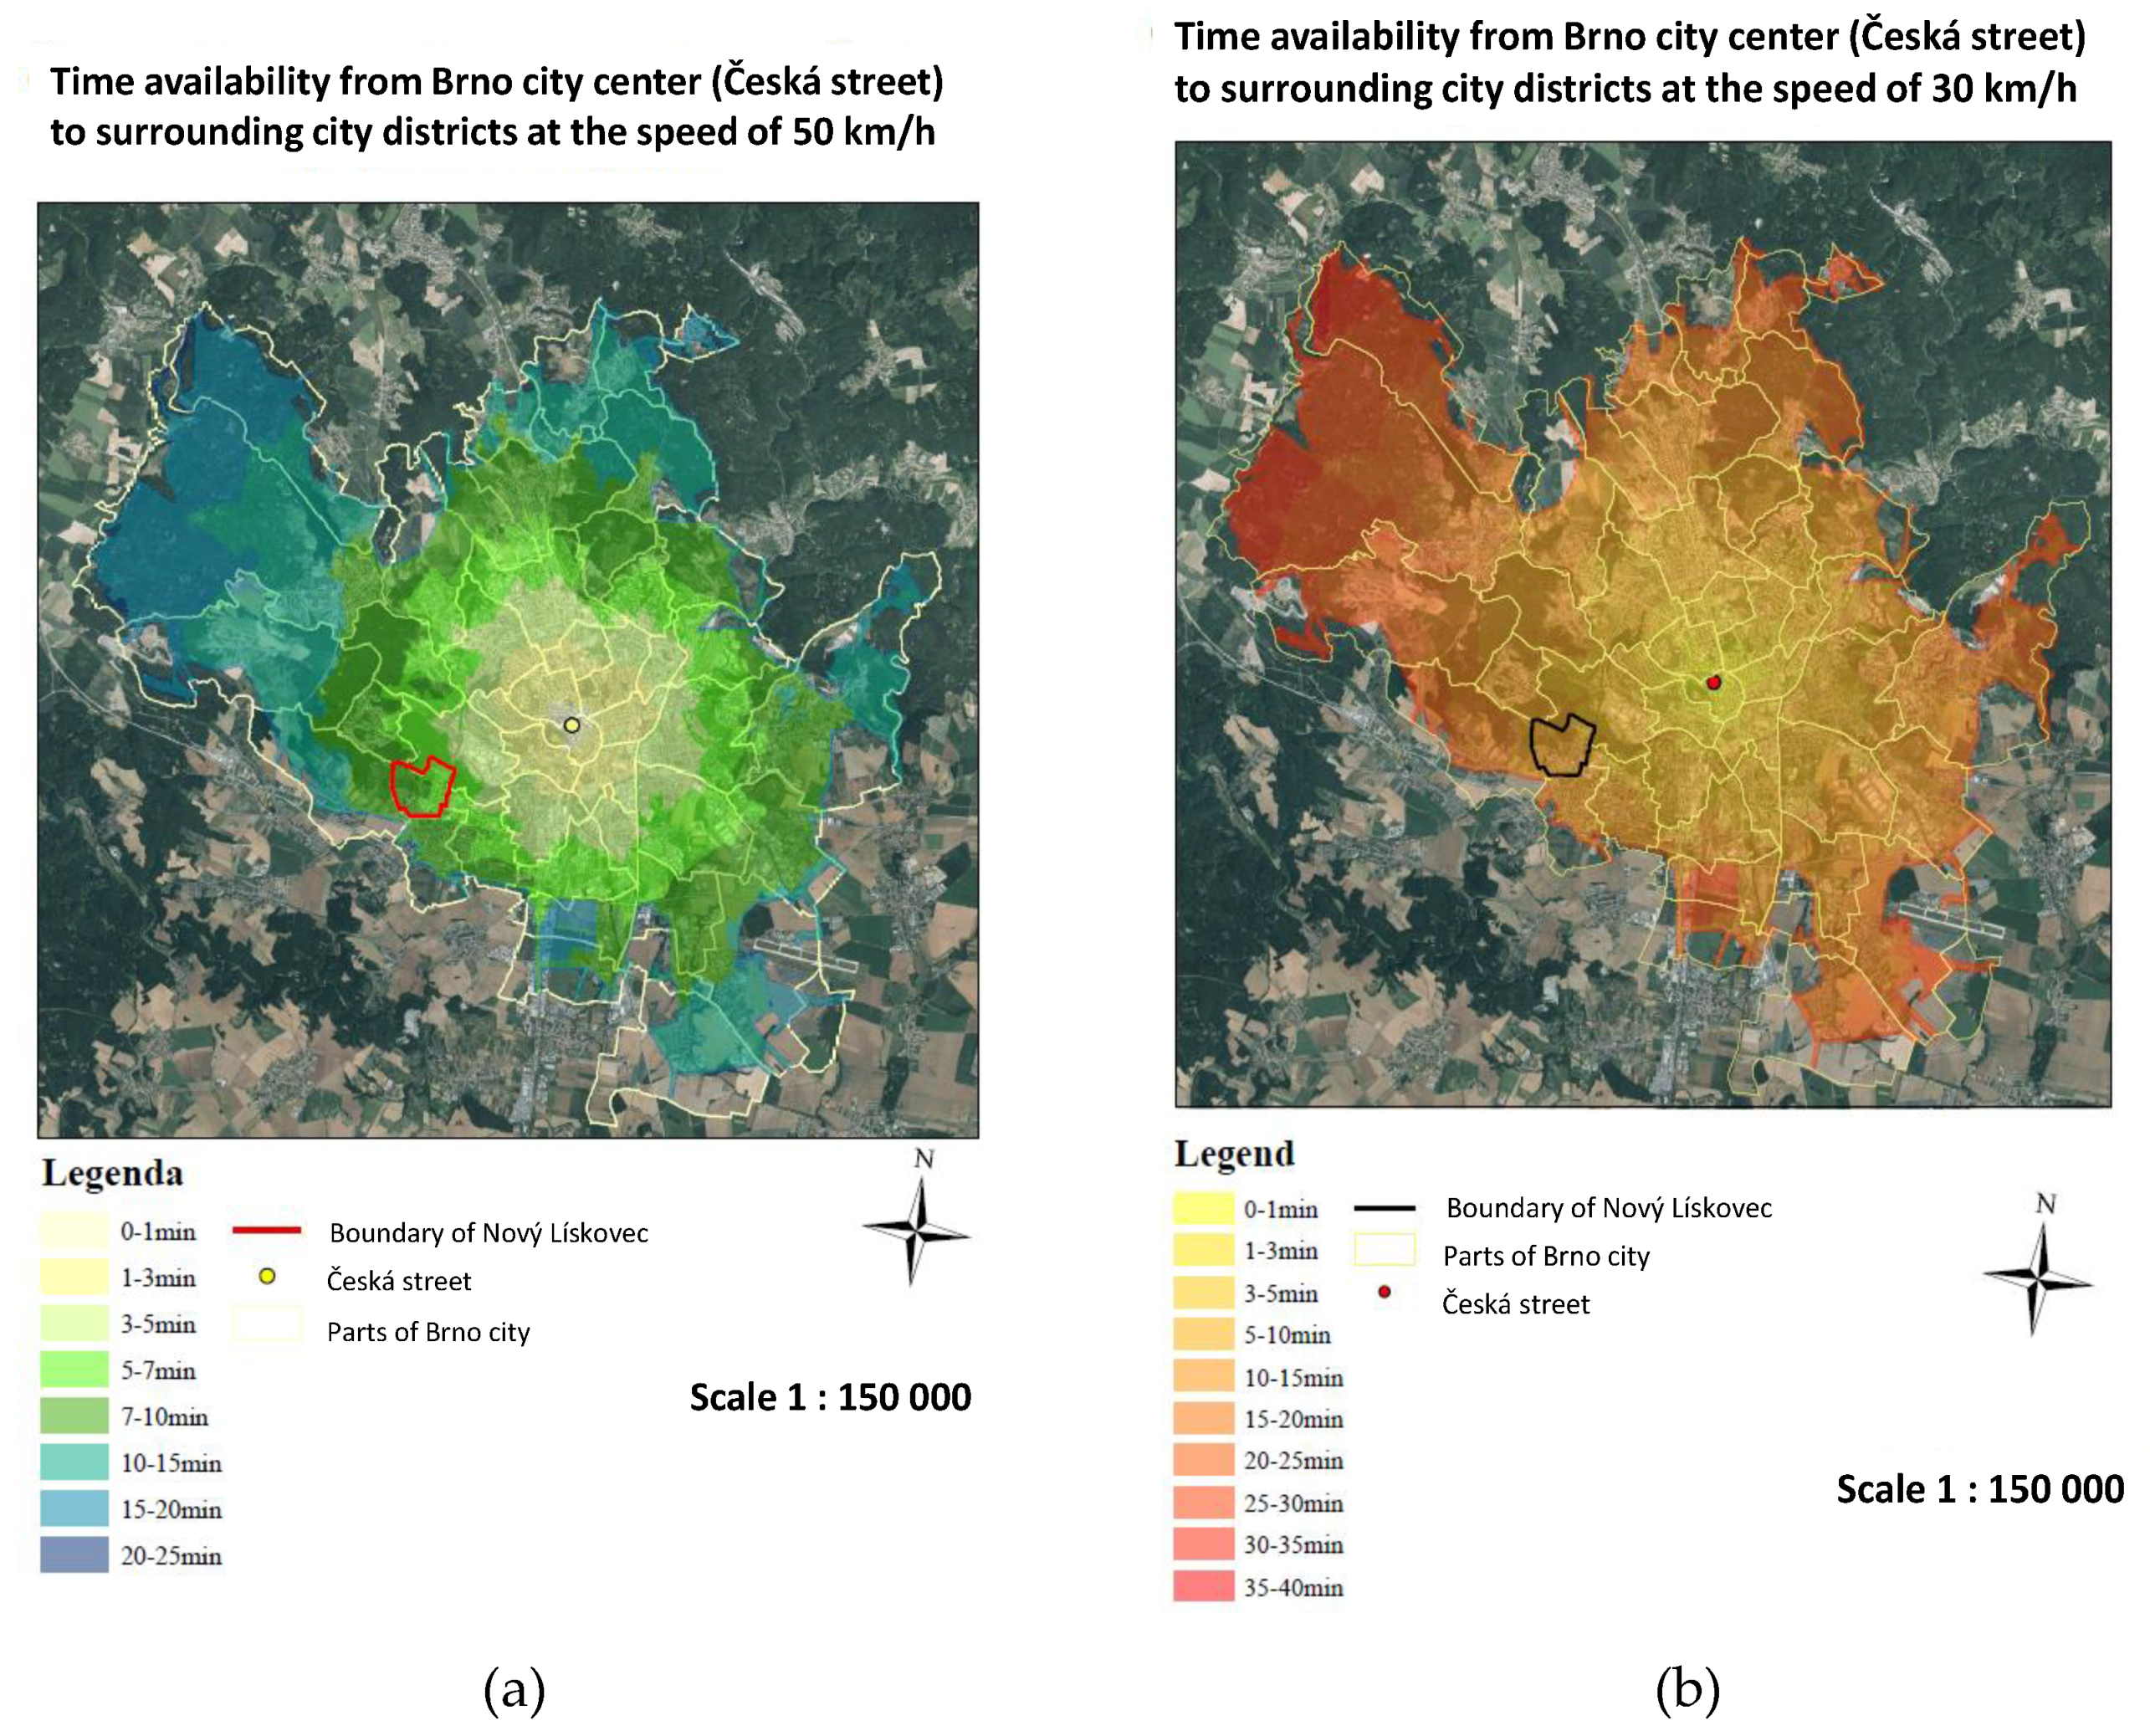
Multi-criteria analysis was used for spatial analyses in the locality, i.e., determination of time and distance accessibility of the locality of interest from the city center by car or public transport (
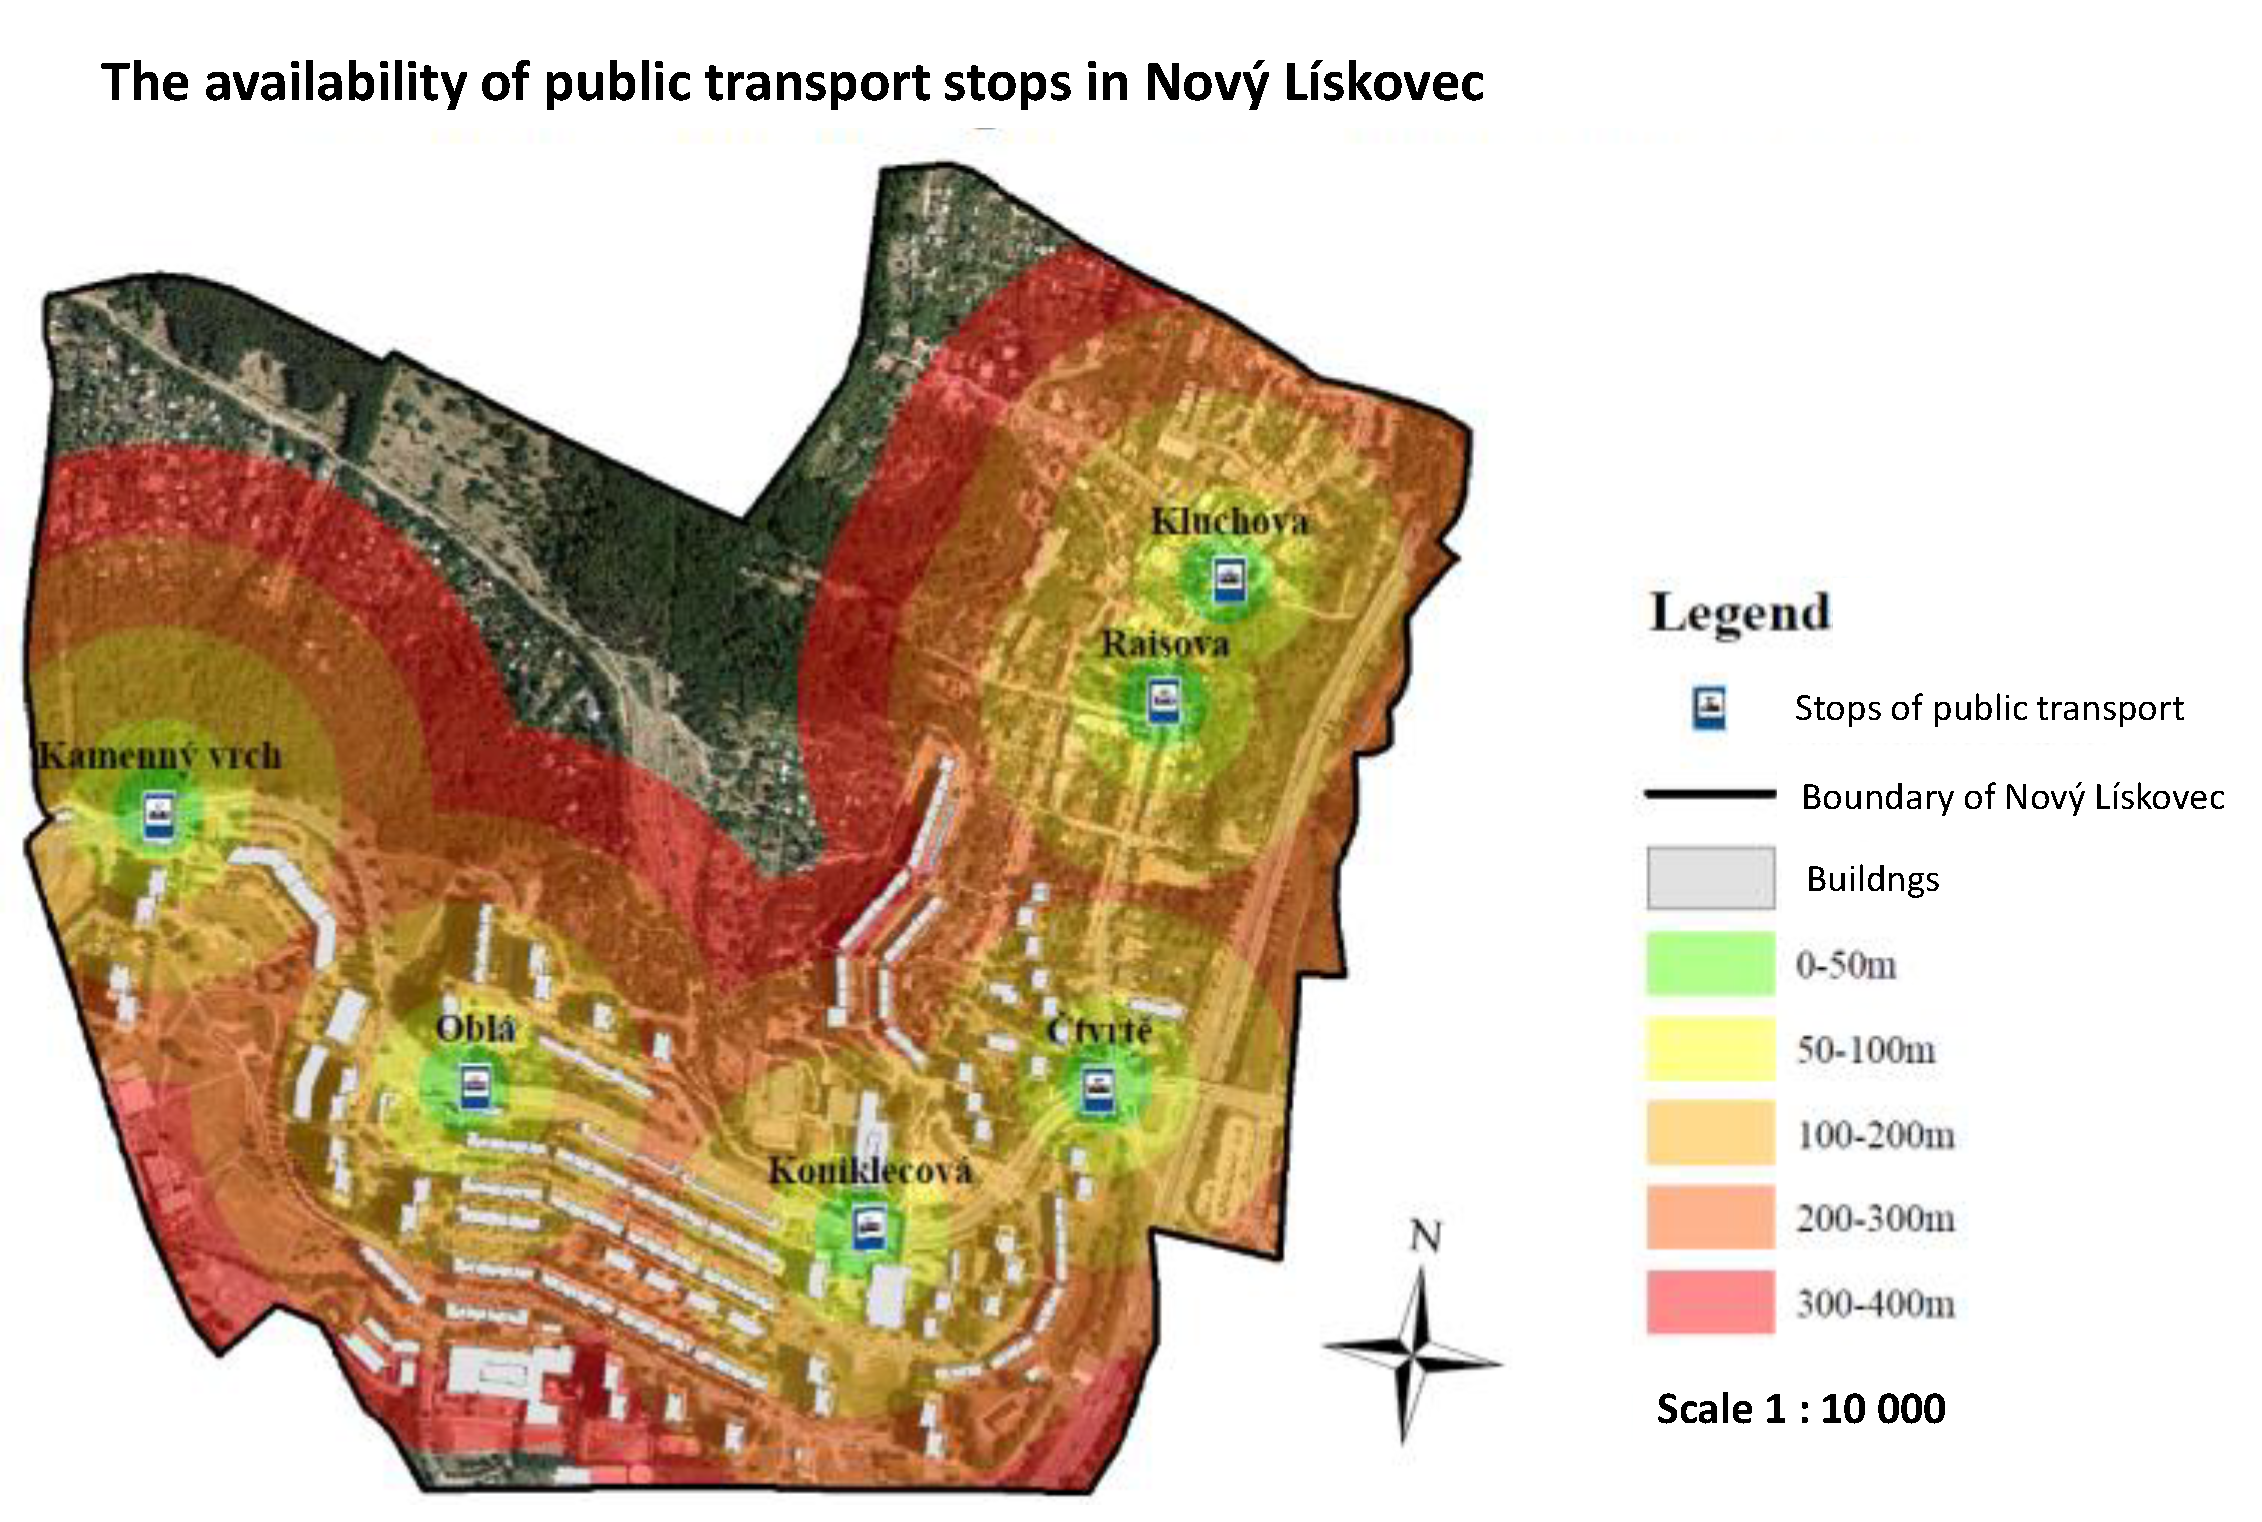
Section 4.4.1), evaluation of the availability of public transport stops in the locality on foot (
Section 4.4.2), and selected objects of civic amenities (
Section 4.4.3).
3.5. Processing in GIS
For processing (block No. 5 in
Figure 1), the ArcGIS system was chosen, in which spatial analyses were performed. Spatial and non-spatial data were processed by WLC (weighted linear combination) multi-criterial analysis.
This method is based on a weighted average concept, in which the criteria are standardized to common numerical series and then combined using a weighted average. The decision-maker assigns weights of relative importance directly to each attribute of the map layers for each criterion. This means that a low variant value in one criterion can be offset by a high value in another criterion. The total number for each variant is obtained by the sum of the multiplied values of the individual criteria by the weighting factor [
26]:
where
S is the result of the suitability of the variant,
vi is the weight of the
i-th factor, and
xi is the value of the criterion of the
i-th factor. The results are calculated for each variant, and the best variant selected is the variant with highest value. This method avoids the so-called Boolean evaluation, where values are reclassified to only two classes by numerically assigning a weight value of 0 or 1. This occurs when using the AND operator, which results in either a totally inappropriate or completely appropriate solution. In any case where at least one criterion is 0, the resulting value is 0. The use of the AND operator is called a pessimistic strategy. In the case of the WLC method, where weights of different sizes are assigned to the evaluation criteria, the result is the sorting of the variants according to the sum of their values from the best to the worst, and, thus, it is not possible to get a completely suitable or completely inappropriate solution. This method is applicable to any GIS system and can be implemented for both raster and vector data.
Since the criteria are defined at different levels, it is inevitable that the individual factors are standardized so that they can be compared with each other. If factors are not only classified as zeros and ones, they can be transformed to some extent by some function. Factor standardization is performed using the fuzzy method (uncertainty method)—by assigning values in the range <0, 1> based on real numbers, or in the interval <0, 10> on a set of integers. It is recommended to use the second method to optimize the calculations. A value of 1 or 10 is considered the best, 0 as the worst.
The simplest standardization is linear scaling:
where
Ri is the criterion value,
Rmin and
Rmax are the minimum and maximum criterion values,
S is value from Equation (1), and
SR is the normalized criterion value [
26,
27].
The WLC was implemented in Java and implemented as a plug-in for the ArcGIS environment [
28]. The use of the WLC method for multi-criterial analysis in terms of housing is a quick and easy way for the client to fill in the input parameters. The contractor only determines the criteria thresholds and then sorts the criteria from the most important to the least important. Another advantage is the possibility to evaluate two criteria as equally important. Values of weights of individual criteria were determined by the on-site questionnaire survey.
The selection of optimal variants for the target group of clients (block no. 6 in
Figure 1) was consulted with experts in the field of land registry and building valuation.
5. Discussion
In terms of energy savings of revitalized panel buildings, the effectiveness of revitalization by thermal insulation of buildings was proven, while savings in heating costs ranged from a total of 52% to 88%. The savings began to show a jump in terms of comparing costs before and after revitalization. For some buildings, it was necessary to carry out the revitalization in stages due to costs spread over two to three years (implementation of cladding on partial walls of the building or on half of the building). The results of Reference [
4] showed that the use of building cladding resulted in savings of 82%, which corresponds to the results analyzed by us. It has been shown that a significant part of the costs can also be saved by introducing metering systems for sub-households in the building, which leads to significant overall energy savings in both central heating and hot water consumption.
The revitalization of prefabricated buildings has been carried out commercially on the market in the Czech Republic since about 2000. In
Table 4, for comparison, we present data on heating savings from selected contractors operating on the market for a long time, dealing with the revitalization of prefabricated houses for housing and presenting this data on a publicly available websites. It turns out that the contractors present different values of savings with respect to the insulation technology used. We consider these data as indicative only. We consider the data presented by us to be reliable, as they are obtained from direct long-term monitoring of heating consumption on a specific sample of buildings.
In terms of noise pollution of the site, it has been shown that the main impact is caused by traffic. The noise level at 80% of the evaluated Nový Lískovec locality does not exceed 40 dB during the day; in narrow areas along local roads, the daily noise ranges up to 65 dB, and in the vicinity of the motorway feeder, the noise level does not exceed 70 dB. At night, the noise level drops to about a third of the daily values, with the smallest attenuation in the vicinity of roads. Reference [
8] corresponds to our findings, of course with regard to the different nature of the localities. In the streets, noise is related to the road surface; in narrow streets, noise is multiplied by sound reflections. The Quito area is also exposed to road traffic noise above 65 dB during the year. It is stated that about 25% of the population living in the area is exposed to daily noise, and 38% of the population is exposed to traffic noise above 55 dB.
In terms of spatial analyzes, the time and distance accessibility of the site from the city center were addressed. Based on a questionnaire survey on a small sample of 54 respondents, the parameters of the requirements of the three different groups of respondents—potential applicants for housing in the locality—were evaluated. It was not just about obtaining statistically relevant information from the real estate market survey, but also about compiling parameters for the construction of a technically functional evaluation model based on multi-criteria analysis using the WLC method. Statistically representative requirements could be obtained mainly by involvement in the cooperation of real estate brokers and municipal departments, which have a good overview of demand in the real estate market and communicate with potential applicants.
The implemented information model about the locality of Nový Lískovec is generally usable for any locality and is variably adaptable to the requirements of a more representative set of respondents when provided data about the locality.
Our solution is a comprehensive set of data and methods for assessing the quality of living in prefabricated houses. It integrates spatial, non-spatial, and environmental data and methods, as well as the criteria of the questionnaire survey with the tool of MCA-WLC in GIS. The whole issue is solved from the perspective of not only experts (building specialists, architects), but also from the perspective of the general public, especially from the perspective of potential people interested in housing. The benefit is also for the needs of the real estate market, real estate brokers, and municipal authorities dealing with housing issues. The advantage of the implemented model is the comparison of different localities on the basis of the same parameters, which are also modifiable. Another advantage is the possibility of applying the model to other purposes or parameters of the real estate market or the requirements of the municipal office. The possibility of using the model as a source of expanding information for those interested in housing is also important. For municipal authorities, the information can be used in terms of assessing the effectiveness of revitalization and also to specify the methodology and procedures for their planning in other localities.
6. Conclusions and Future Work
For the Nový Lískovec locality with extensive panel construction, a general model of evaluation of energy-saving parameters, noise load, and spatial analyses in GIS was created on a sample of buildings, which is applicable to any housing locality, and can be used for municipal decision-making in planning revitalization of localities with panel buildings intended for housing. The model can also be used for the real estate market in the sense of expanding the range of information on housing in the locality demanded mainly by potential applicants for housing and also by real estate companies. Relevant information on housing also contributes to the partial natural regulation of the free real estate market in order to avoid overpricing of real estate in terms of the price–quality ratio of housing demanded by those interested in housing.
GIS technology enables the results to be processed efficiently by multi-criteria analysis (MCA) methods directly in the GIS environment. Of all the existing MCA methods, the authors eventually chose the WLC method. Although it is relatively one of the simplest methods, the results show that, in this case, it is very effective and sufficiently general. The results of the analyses can thus be clearly visualized, and the outputs can be mediated via the Internet to a wide range of people interested in housing via the municipality’s website, or within real estate web servers. Graphical representation of housing parameters creates an attractive form of information for those interested in housing.
As prefabricated buildings still make up a significant percentage of buildings intended for permanent housing in the Czech Republic, the proposed method has prerequisites for further use. The proposed evaluation of the criteria by three different categories of applicants for housing is sufficiently representative and creates good basis for decision-making.
In the next phase, it would be appropriate to extend the project with a layer of prefabricated houses in 3D format, where the buildings would be divided into individual apartments, according to their layout in the building. This could extend the list of criteria affecting housing with additional information, such as the size of the flat, the type of flat, the position of the flat (floor, corner), the orientation of the flat on the sun side, the window view, and others.


