Article

Assessment of Ecological Efficiency and Environmental Sustainability of the Minjiang-Source in China

1
School of Economics and Management & Research Center of Low Carbon Economy, Sanming University, Sanming 365004, China
2
Business School, Shantou University, Shantou 515063, China
3
State Key Laboratory of Grassland Agro-Ecosystems, Institute of Arid Agroecology, School of Life Sciences, Lanzhou University, Lanzhou 730000, China
*
Author to whom correspondence should be addressed.
Sustainability 2020, 12(11), 4783; https://doi.org/10.3390/su12114783
Submission received: 21 April 2020 / Revised: 7 June 2020 / Accepted: 8 June 2020 / Published: 11 June 2020
(This article belongs to the Special Issue Sustainable Ecological Efficiency)

Abstract

:
Ecological sustainability is treated as a main reflection of the synergy among social development, economic growth and environmental protection, while ecological efficiency is an index used to reflect the sustainable development of the ecological environment. The super efficiency model with undesirable outputs (SE-SBM) model was applied to measure the eco-efficiency of the 12 counties in the Minjiang-Source, China, in 2005–2017. The spatial and temporal evolution and spatial differentiation of the eco-efficiency were analyzed. The results showed that the eco-efficiency of 67.7% of the 12 counties remains at a low level but with an increasing trend. A typical spatial aggregation effect was found with the characteristics of “high in the east and low in the west”. The Malmquist-Luenberger index shows a trend of fluctuation with the same trend between scale efficiency and technical efficiency changes. The results proved the positive effect of technological progress on local eco-efficiency. Environmental regulation has a positive impact on eco-efficiency in the short term and an inhibition effect in the long run. Hence, technological innovation and industrial adjustment will be an effective way to improve the eco-efficiency of the Minjiang-Source and promote its sustainability.

1. Introduction

For ages, society has made great efforts towards economic development while consuming too many natural resources, bringing severe pollution problems. Due to natural resource constraint, the world, especially China, is facing a lot of environmental and ecological problems, such as air pollution and ecological damage. To overcome these problems, the Chinese government has taken a lot of measures, such as laws like the Pollution Prevention Act and the Environmental Protection Act, measures like cleaner production and a recycling economy, and systems like the environmental protection administrative system of interviews. It has experienced a great evolution, both in practice and theory, from an administrative management-based approach to an economic instruments-based approach, from environmental protection to sustainable development, and from pollution control to ecological conservation [1]. A vast work has been addressed towards awareness of ecological conservation.
Meanwhile, the Chinese government also chose some areas as the key ecological functional ones to undertake the ecological functions of ecological guarantee, resource reserve and landscape construction. Key ecological functional areas are areas with extremely important ecosystems and are closely related to the ecological security of the country or a wide range of regions. However, these areas have been deteriorating, and there is need to limit large-scale and high-strength development of urbanization and industrialization in the nation to maintain and improve the supply capacity of ecological products [2]. For a long time, the key ecological functional areas have been troubled by the difficulty in coordinating ecological environment protection and regional economic development, as well as by the severe challenges of resource demand pressure and ecological environment destruction [3,4]. How to optimally explore ecological benefits on the premise of minimum resource consumption and environmental investment has become a key issue to promote the construction of ecological civilization in the key ecological functional areas in China at the present stage. With the continuous advance in ecological civilization construction and the proposition of the coordinated concept of social development, economic growth and ecological environment protection, it is urgent to guide the sustainable development of both the social economy and ecological environment in the key ecological functional areas in China.
Ecological efficiency (Eco-efficiency) is a representational index that reflects the coordinated development of regional social development, economic growth and ecological environment [5,6]. Through embedding ecological consumption of resources into the traditional input-output accounting [7,8], eco-efficiency has become an important tool for regional sustainability assessment. Extant studies on regional eco-efficiency assessment mainly focus on the evaluation of large-scale regions, such as the national level [9,10,11], trans-regional level [12,13] and provincial level [14,15]. However, there are few studies on regions at the county level, especially on the evaluation of eco-efficiency in key ecological functional areas.
Evaluation of ecological benefit is the basis and focus of ecological benefit research. With regards to the selection of an eco-efficiency evaluation index, most studies choose environmental pollution and resource consumption as input indicators, and regional production indicators as output indicators [16,17]. For example, the discharge of waste water, waste gas and waste solid are used as inputs in efficiency evaluation, which is not consistent with the actual situation [18,19]. In the evaluation of regional eco-efficiency, the indexes should be expanded or adjusted appropriately according to the differentiation in the connotation of the research objects [20]. Therefore, the establishment of a scientific and reasonable evaluation model and a scientific index system in typical regions is crucial to the measurement of eco-efficiency and the assessment of sustainability.
Although the existing studies provide a good theoretical basis for the present study, there is a lack of evaluation of eco-efficiency at the meso-level, and few studies on the evaluation of the key ecological functional areas. The key ecological functional areas are greatly restricted by the ecological environmental protection system and have great differences in eco-efficiency evaluations compared to those at a larger scale area or macro level. Based on this, this study applies the undesirable output of super efficiency (Super-SBM) model and the undesirable output model of total factor productivity index (ML) in Minjiang-Source to empirically analyze the temporal and spatial evolution of eco-efficiency and the factors influencing it. The results provide reference for the sustainable development of key ecological function areas and provide scientific basis for local policy making.

2. Study Area, Indicators and Data
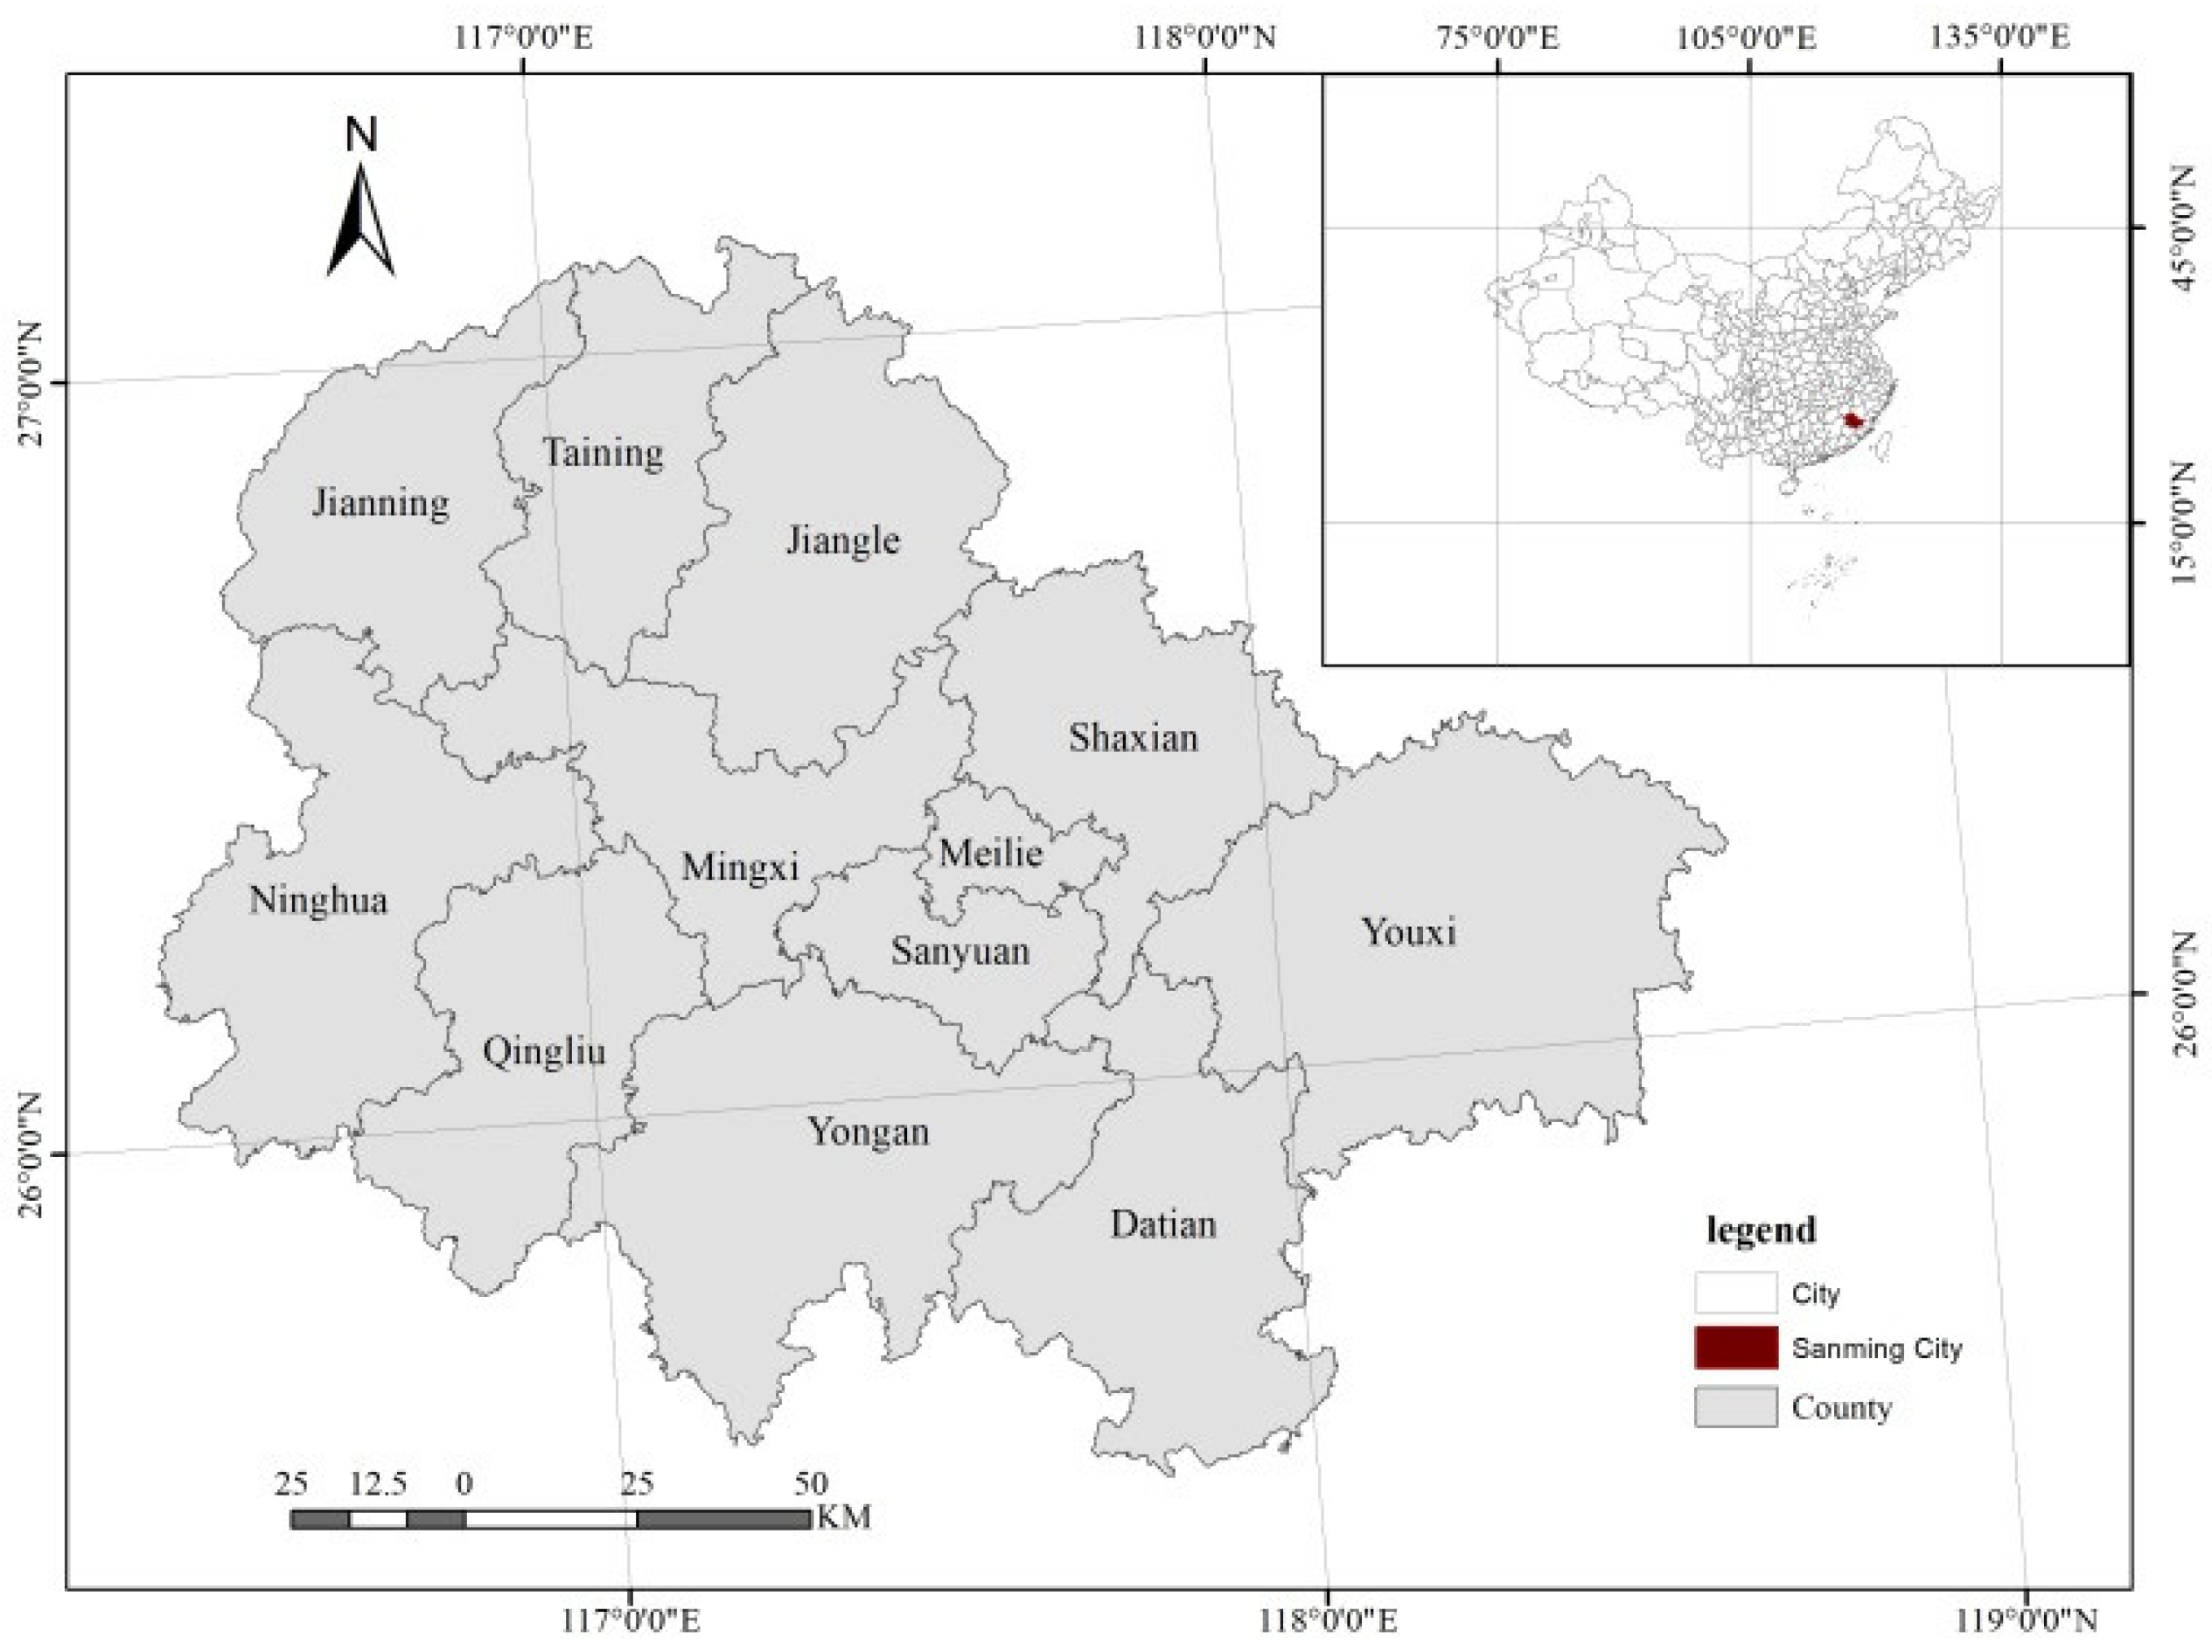
2.1. Study Area

Minjiang-Source is a key ecological functional area in Fujian province, China. The area is located in the northwest of Fujian province, within the jurisdiction of two districts, one city and nine counties, and a total area of 22,900 square kilometers (See Figure 1). There are six provincial-level and five national-level nature reserves, covering a total area of 85,800 hectares, accounting for 3.7% of the land area. There are three national-level and four provincial-level scenic spots, with a total area of 27,200 hectares, accounting for 1.18% of the land area. In 2017, the regional GDP reached 210.26 billion Chinese yuan (RMB), the per capita GDP was 83,000 RMB, the per capita public revenue was 5700 RMB, the per capita disposable income of rural residents was 15,000 RMB, and the per capita disposable income of urban residents was 32,000 RMB.

2.2. Indicators and Data

2.2.1. Selection of Evaluation Indicators

Eco-efficiency refers to the ratio of the value obtained from regional economic activities and their negative impact on the environment to the actual resource inputs [21]. Based on the evaluation index of eco-efficiency from previous studies, construction land, water consumption, labor force, energy and crop planting area were selected as input indexes according to the characteristics of Minjiang-Source and data availability. Of these, construction land is represented by the urban construction area, water consumption is represented by water consumption of industrial enterprises above designated size, labor force is represented by the labor force at the end of the year, energy is represented by the comprehensive energy consumption, and crop planting area is represented by the area for planting crops. GDP, urban disposable income, rural disposable income, urban per capita green area and major grain yields were selected as desirable output indicators. Industrial waste water emissions, chemical oxygen demand (COD) emissions, ammonia nitrogen emissions, industrial exhaust emissions, industrial soot (dust) emissions, sulfur dioxide (SO2) emissions and industrial solid waste production were selected as undesirable output indicators; detailed indicators are shown in Table 1.

2.2.2. Data

The data used mainly comes from Sanming statistical yearbook, county-level statistical yearbooks (Meilie, Sanyuan, Yongan, Mingxi, Qingliu, Ninghua, Datian, Youxi, Shaxian, Jiangle, Taining, and Jianning County), and the county-level environmental bulletin, environmental quality report, and statistical bulletin of the national economy and social development from 2005 to 2017.

2.2.3. Data Preprocessing
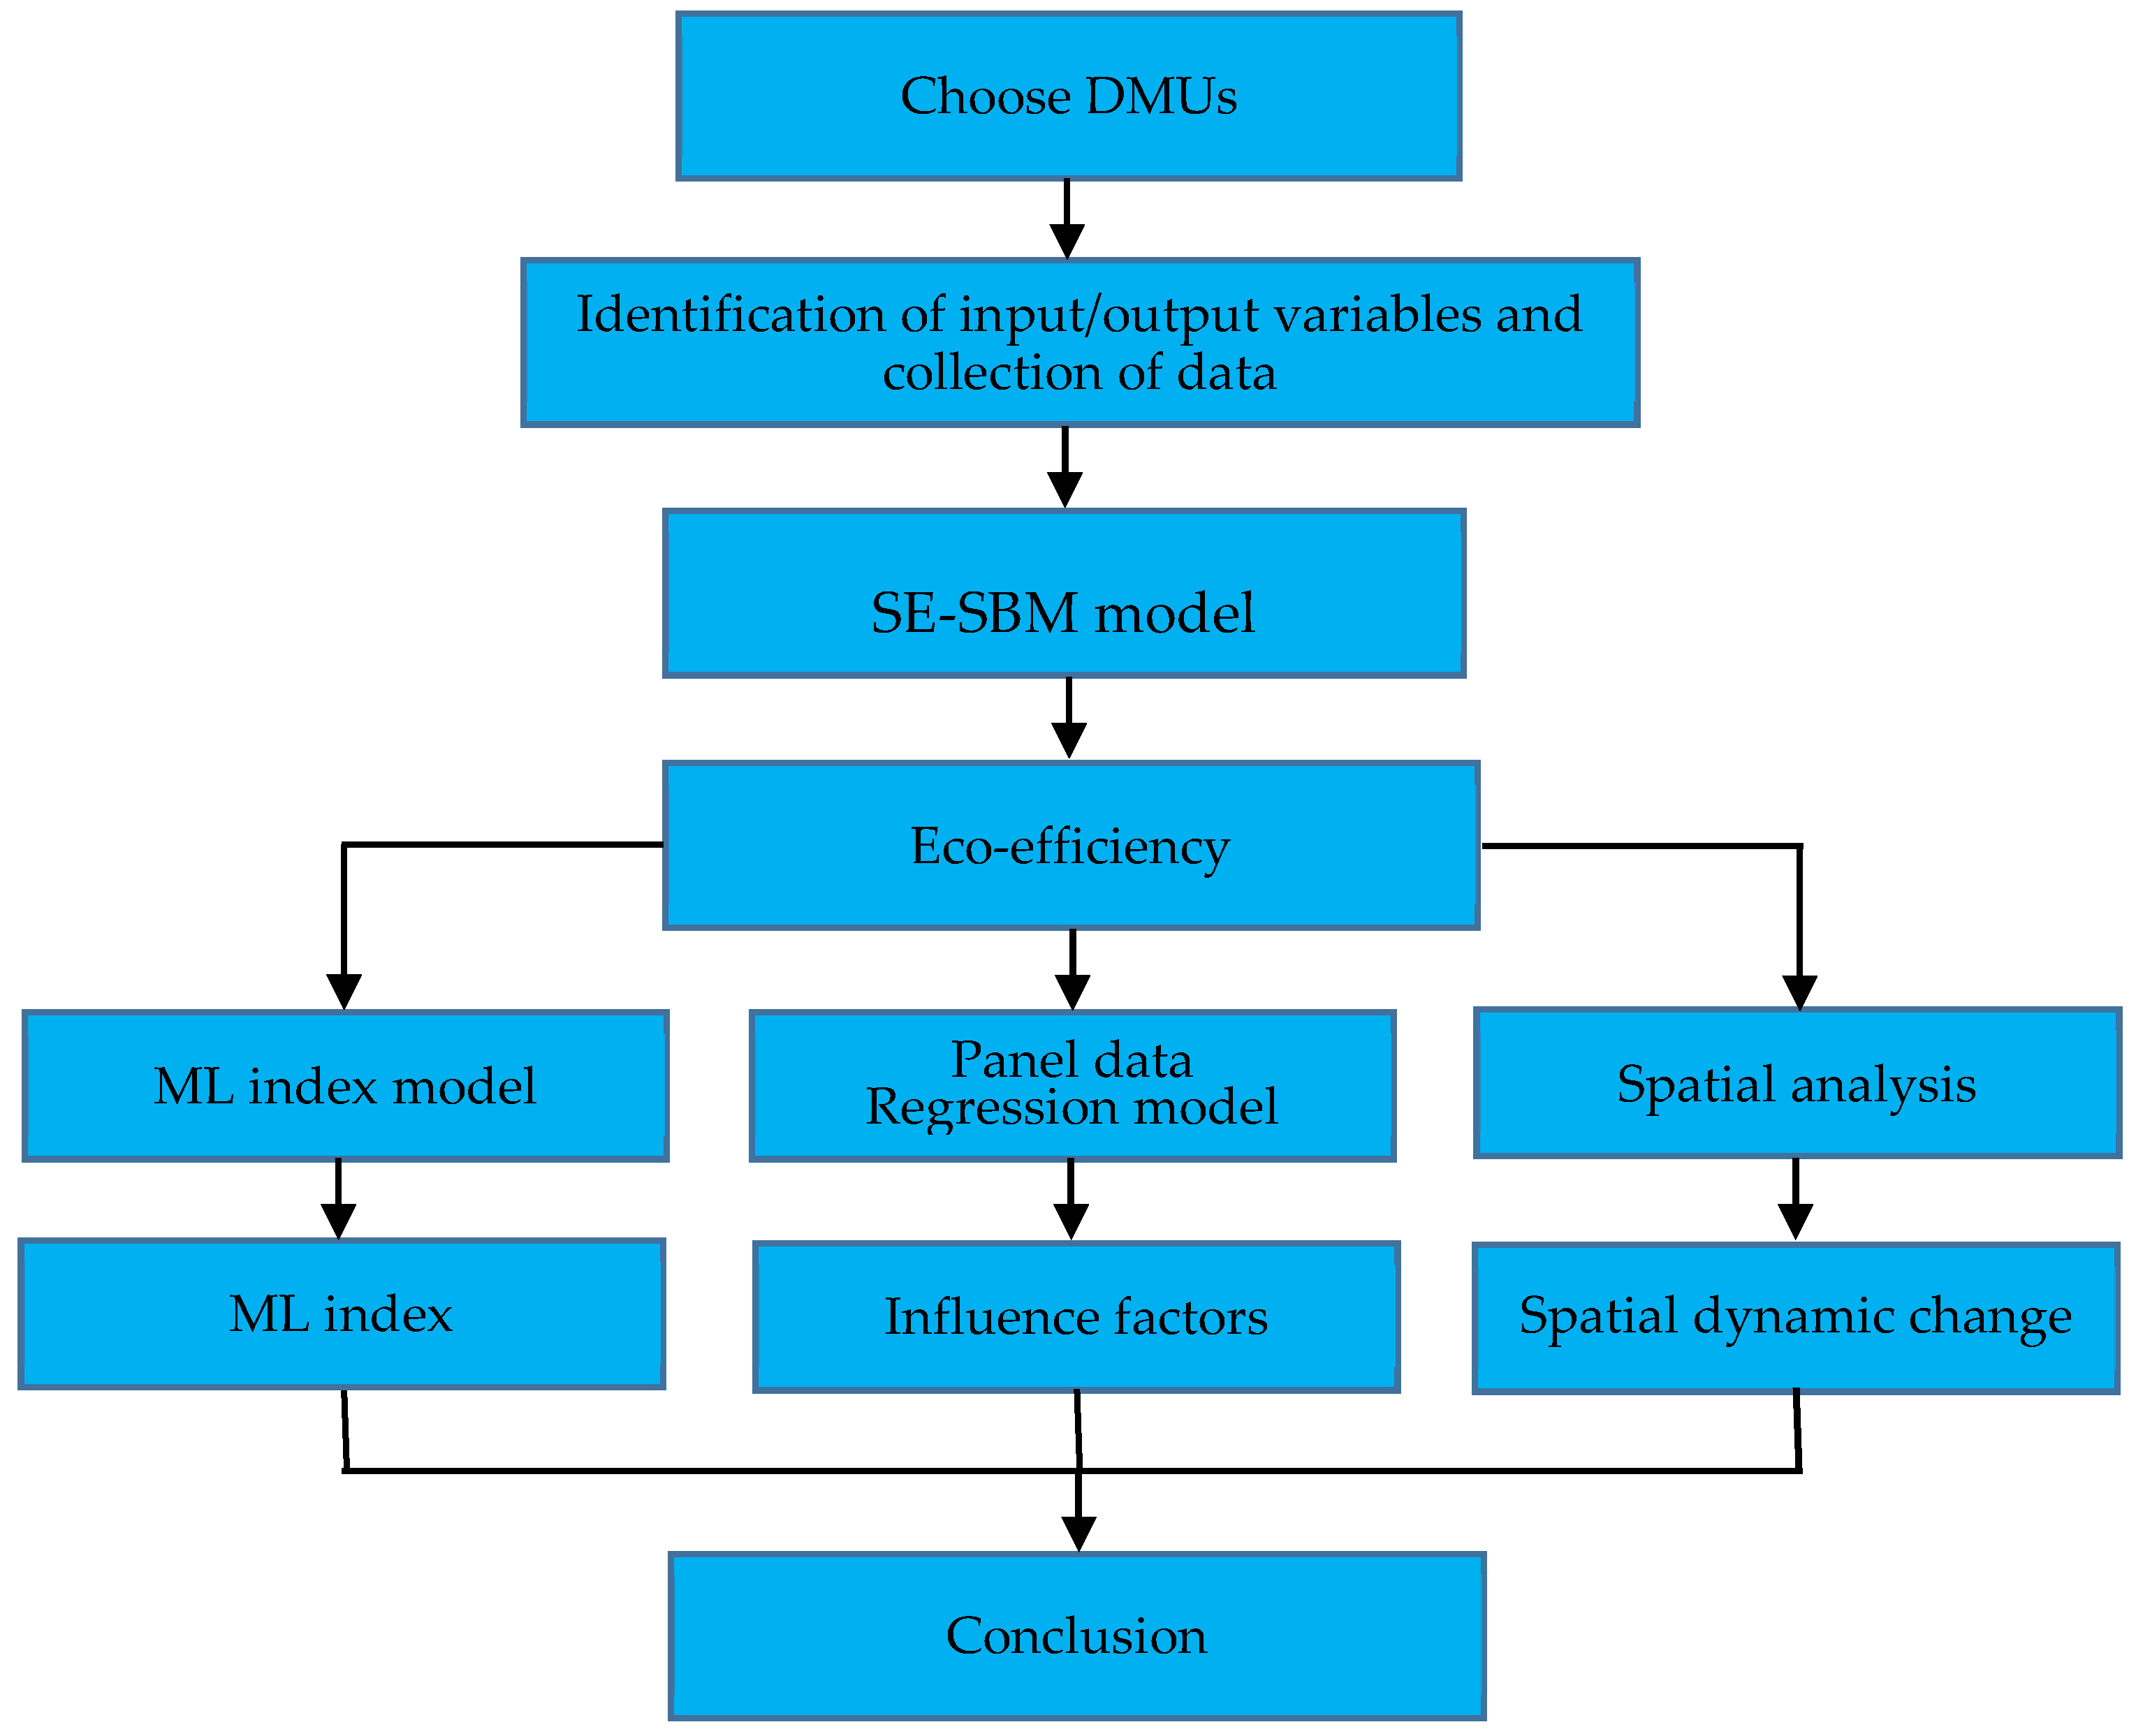
The purpose of data preprocessing is to eliminate the influences of inflation, magnitude and dimensions on the evaluation. First, GDP, urban and rural disposable incomes, and environmental treatment investment were converted according to the consumer price index (CPI) based on 2005. Then the original data was standardized. Let standardized variables be   z . j     , the data of the jth variable on the ith year be xij, the mean of the jth variable be   x ¯ . j . Thus, the formula is as follows:
z . j = x i j x ¯ . j x ¯ . j

3. Research Method

3.1. SE-SBM Model

Existing methods on evaluation of eco-efficiency include logistics analysis [22], index method [23], stochastic frontier analysis (SFA) [24,25] and data envelopment analysis (DEA) [26,27]. The logistics analysis method requires strict restrictions on dataset of the evaluation object [8,28]. The index method is more suitable for independent, discontinuous and single research object. When evaluating systems with continuous multi-inputs and multi-outputs, the weight in index method is difficult to determine and vulnerable to subjective influence [29]. The SFA method can objectively and reasonably assign weights [30], but it is a parameter estimation method which needs to determine a specific mathematical function form in advance, while the DEA model does not need to consider specific functions and weights when dealing with multi-inputs and multi-outputs problem [27,31], making it a more extensive method for evaluating eco-efficiency [32,33]. It is a nonparametric evaluation multi-objective decision model which is generally applied to measure the relative efficiency of a decision-making unit (DMU) with multiple inputs and outputs. Its biggest strength is not needing to consider the specific function between the inputs and outputs and to presuppose the parameters which to some extent helps to avoid subjectivity [19]. However, the traditional DEA uses input and output slacks directly, while not taking into account the undesirable outputs, which leads the measurement results deviating from the actual [34]. In addition, the efficiency values in the DEA models of Charnes, Cooper and Rhodes (CCR) [35] and Banker, Charnes and Cooper (BCC) [36] are between 0 and 1 with 1 as the optimal efficiency. It is difficult to compare when there are multiple 1’s in the efficiency value [37,38].
The super efficiency model (SE-DEA) solves the drawbacks of the CCR and BCC methods, that it is difficult to compare efficiency when there are multiples efficiency values equal to 1 [39]. Furthermore, Zhou and Wang [38] proposed a Super-SBM model which effectively solves the problems of slack variables and non-comparability. The undesirable output model (SBM) takes into account both the undesirable outputs and the problem of relaxation in the traditional DEA model, which can provide a more accurate measurement of efficiency and overcome the problem of deviation from the actual results caused by the undesirable outputs [40]. Therefore, in order to solve the problem of relaxation and the incomparable problem when decision unit is greater than 1, the super efficiency model and undesirable output model (SBM) were incorporated as a super efficiency model with undesirable output (SE-SBM) in the study [41]. Supposing there are n decision units, the input matrix is denoted as   X = ( x i o ) R m × n     , the desirable output matrix as   R g = ( r r 0 g ) R s 1 × n     , and the undesirable output matrix as   R b = ( r r 0 b ) R s 2 × n     , where X > 0,   R g > 0 ,   R b > 0 . In cases of returns to scale, the production possibility set is   p = ( x , r g , r b | x X λ , r g R g   λ , r b R b   λ ) , where λ represents the weights, and   j = 1 n λ = 1     . Therefore, a DEA model with desirable outputs under the assumption of CCR is defined as follows:
min ρ
s . t . { ρ x 0 = x λ + s y 0 g = y g λ s + s 0 s + 0 λ 0
The specific SE-SBM model with both desirable and undesirable outputs can be written as:
min ρ S E = 1 1 m i = 1 m s i x i 0 1 + 1 s 1 + s 2 [ r = 1 s 1 s r g r r 0 g + r = 1 s 2 s r b r r 0 b ]
s . t . { x 0 = x λ + s y 0 g = y g λ s g z 0 b = z b λ + s b s 0 s g 0 s b 0 λ 0
where, ρ in Equation (2) denotes the eco-efficiency of the decision-making unit, m represents the number of input indicators, s 1 represents the number of output indexes, s 2 denotes the number of undesirable output indicators, and s is slack variable.

3.2. ML Index

To depict the dynamic evolution of eco-efficiency, the undesirable outputs total factor productivity index (Malmquist-Luenberger index, ML index) is introduced in the present study. It incorporates directional distance function into productivity index to solve the problem of undesirable outputs [42,43]. The present study adopts ML index from SE-SBM model. Assume that the input and output of the kth decision-making unit in period t be ( x k t , y k t )     . Then, the ML index of the kth decision-making units during periods t and t + 1 is as following [44,45]:
M L ( x t + 1 , y t + 1 , x t , y t ) = d t ( x t + 1 , y t + 1 ) d t ( x t , y t ) × d t + 1 ( x t + 1 , y t + 1 ) d t + 1 ( x t , y t ) = d t + 1 ( x t + 1 , y t + 1 ) d t + 1 ( x t , y t ) × d t ( x t , y t ) d t + 1 ( x t , y t ) × d t ( x t + 1 , y t + 1 ) d t + 1 ( x t + 1 , y t + 1 ) = E C × T C
where, ML represents the undesirable outputs total factor productivity index of the DMU from period t to t + 1, and d t + 1 ( x t + 1 , y t + 1 ) and d t ( x t , y t ) . evaluate technical efficiency of DMU in periods t and t + 1, respectively, the ratio of which represents the technical efficiency change (EC). If the value of EC is greater than 1, it indicates that the present technology is fully utilized; if the value of EC is less than 1, it indicates that the present technology is not fully applied and needs to be further improved. TC represents the technical progress change, which refers to the ratio of the distance function in period t to that in period t + 1 when the input remains unchanged. If TC is greater than 1, it represents the forward movement, indicating the technical progress. The detailed flow chart of the proposed method is reported in Figure 2.

4. Empirical Analysis and Results

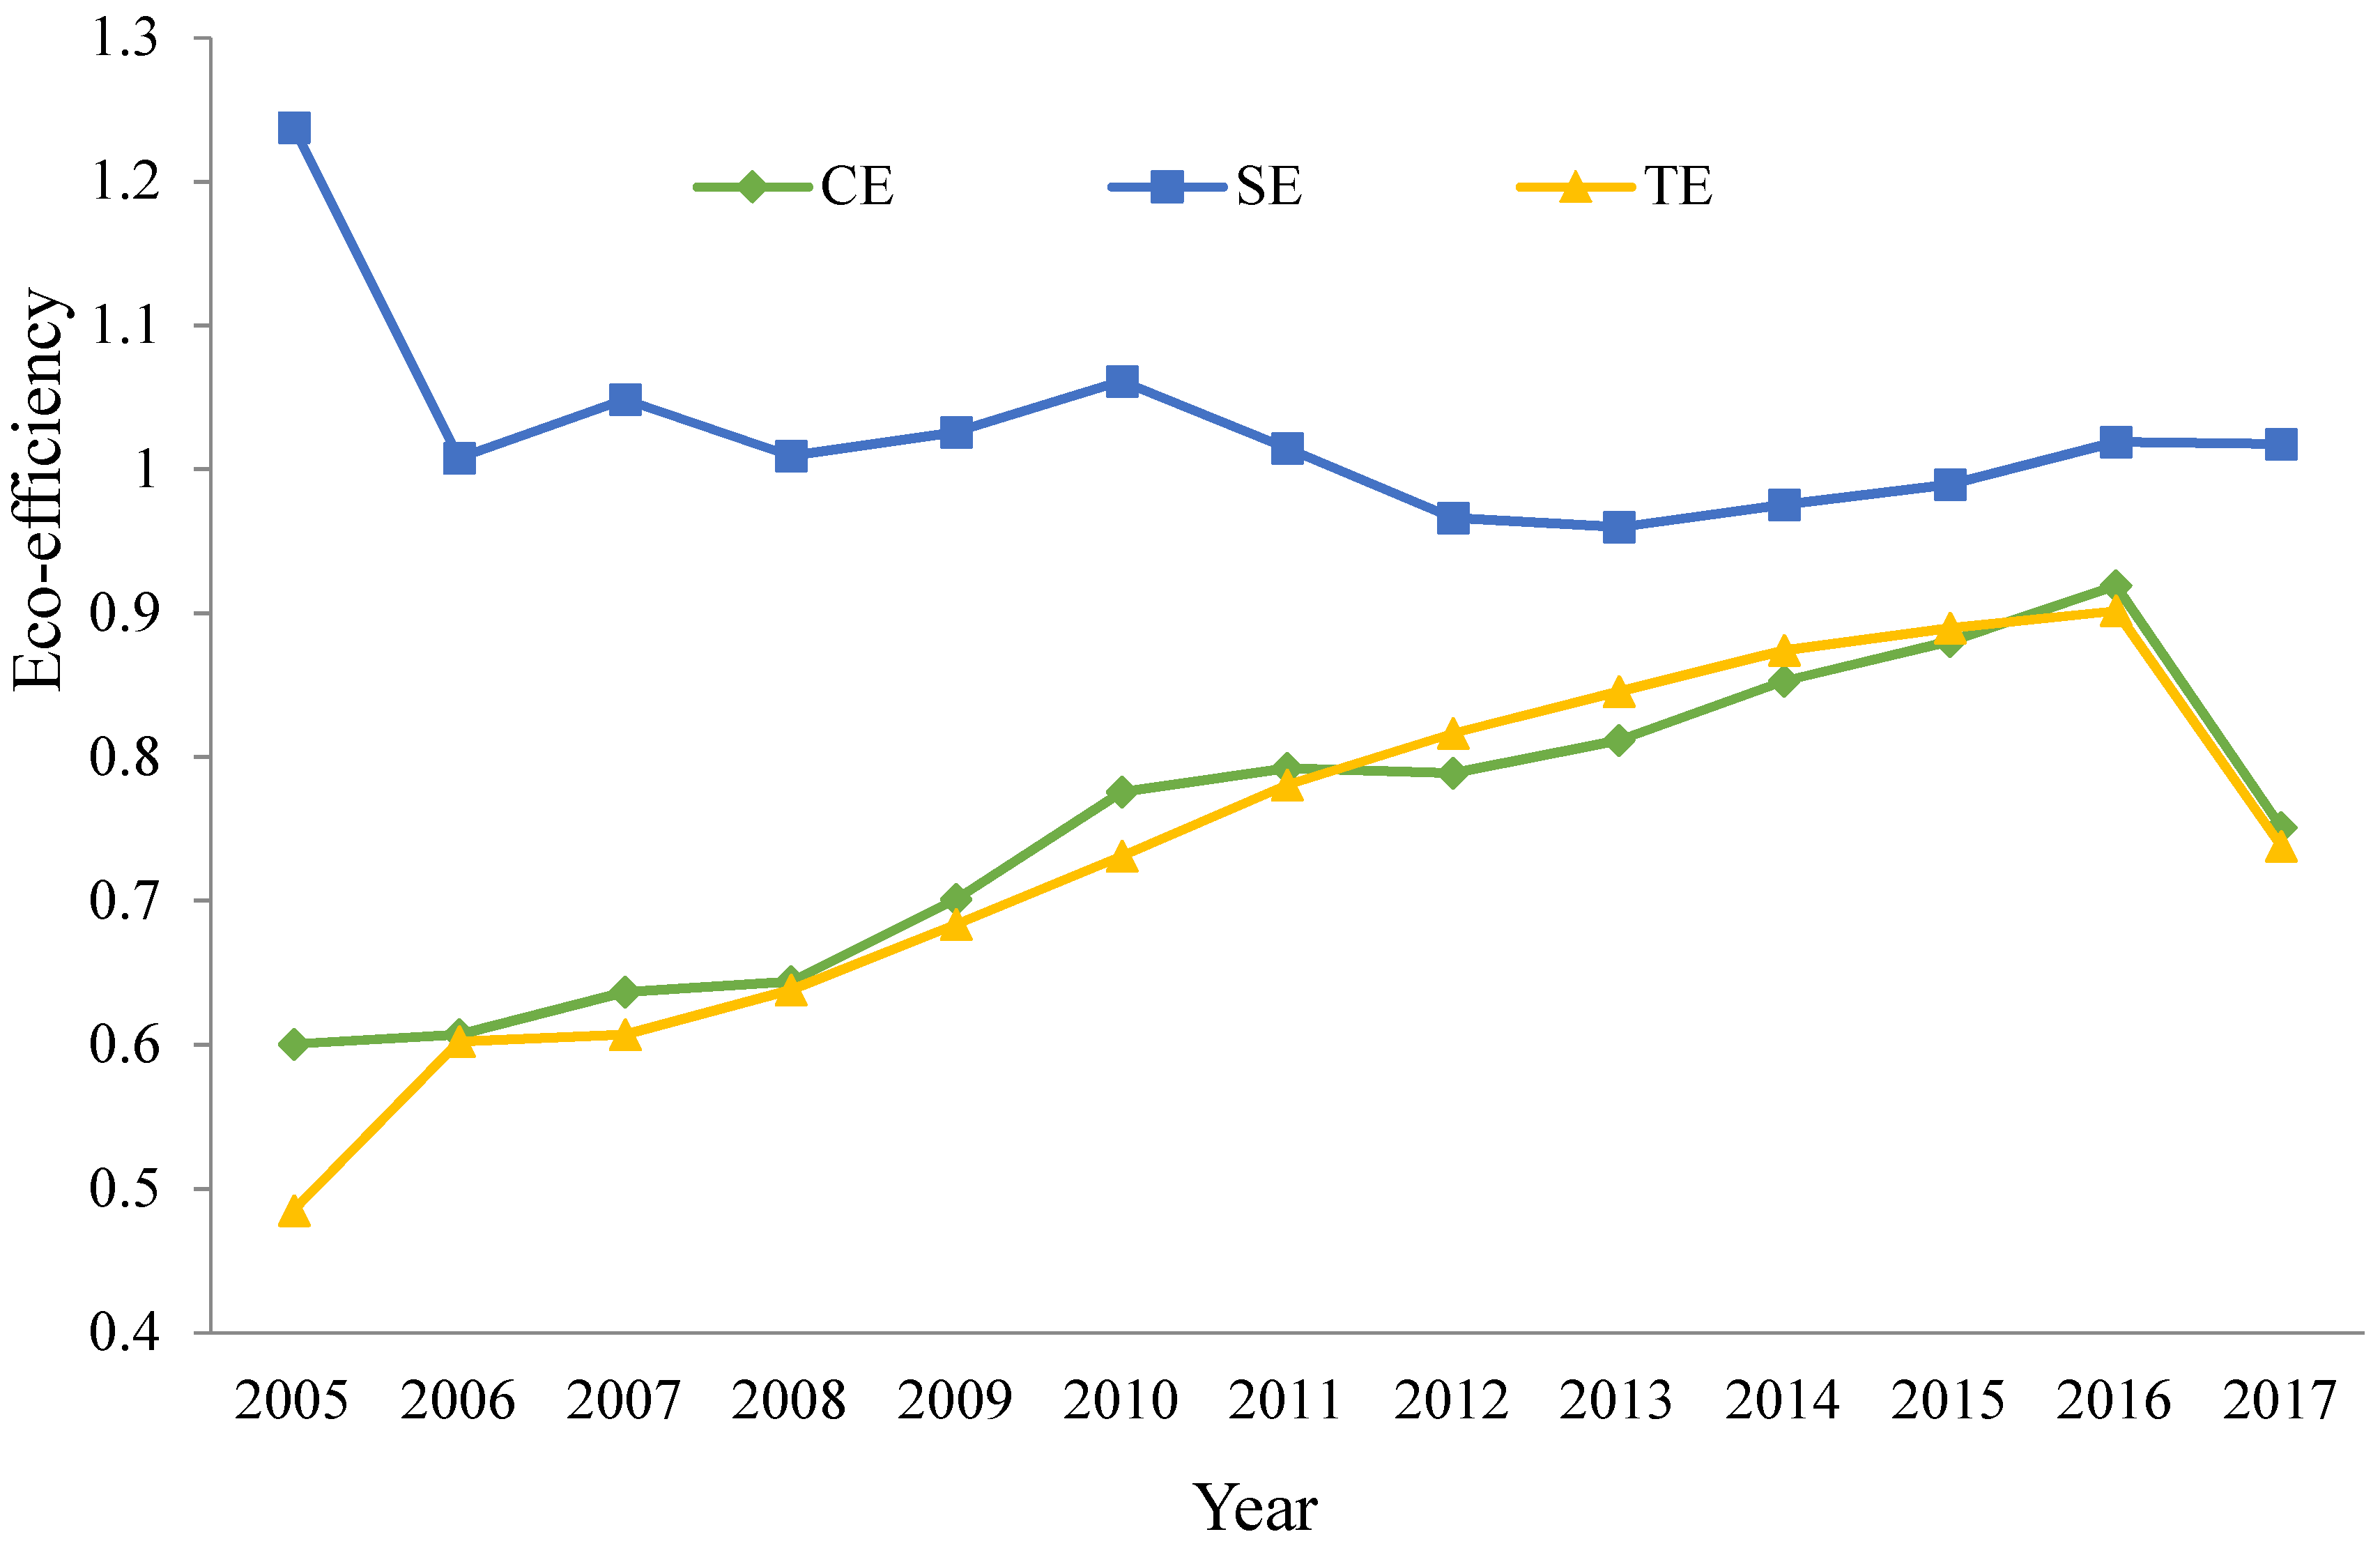
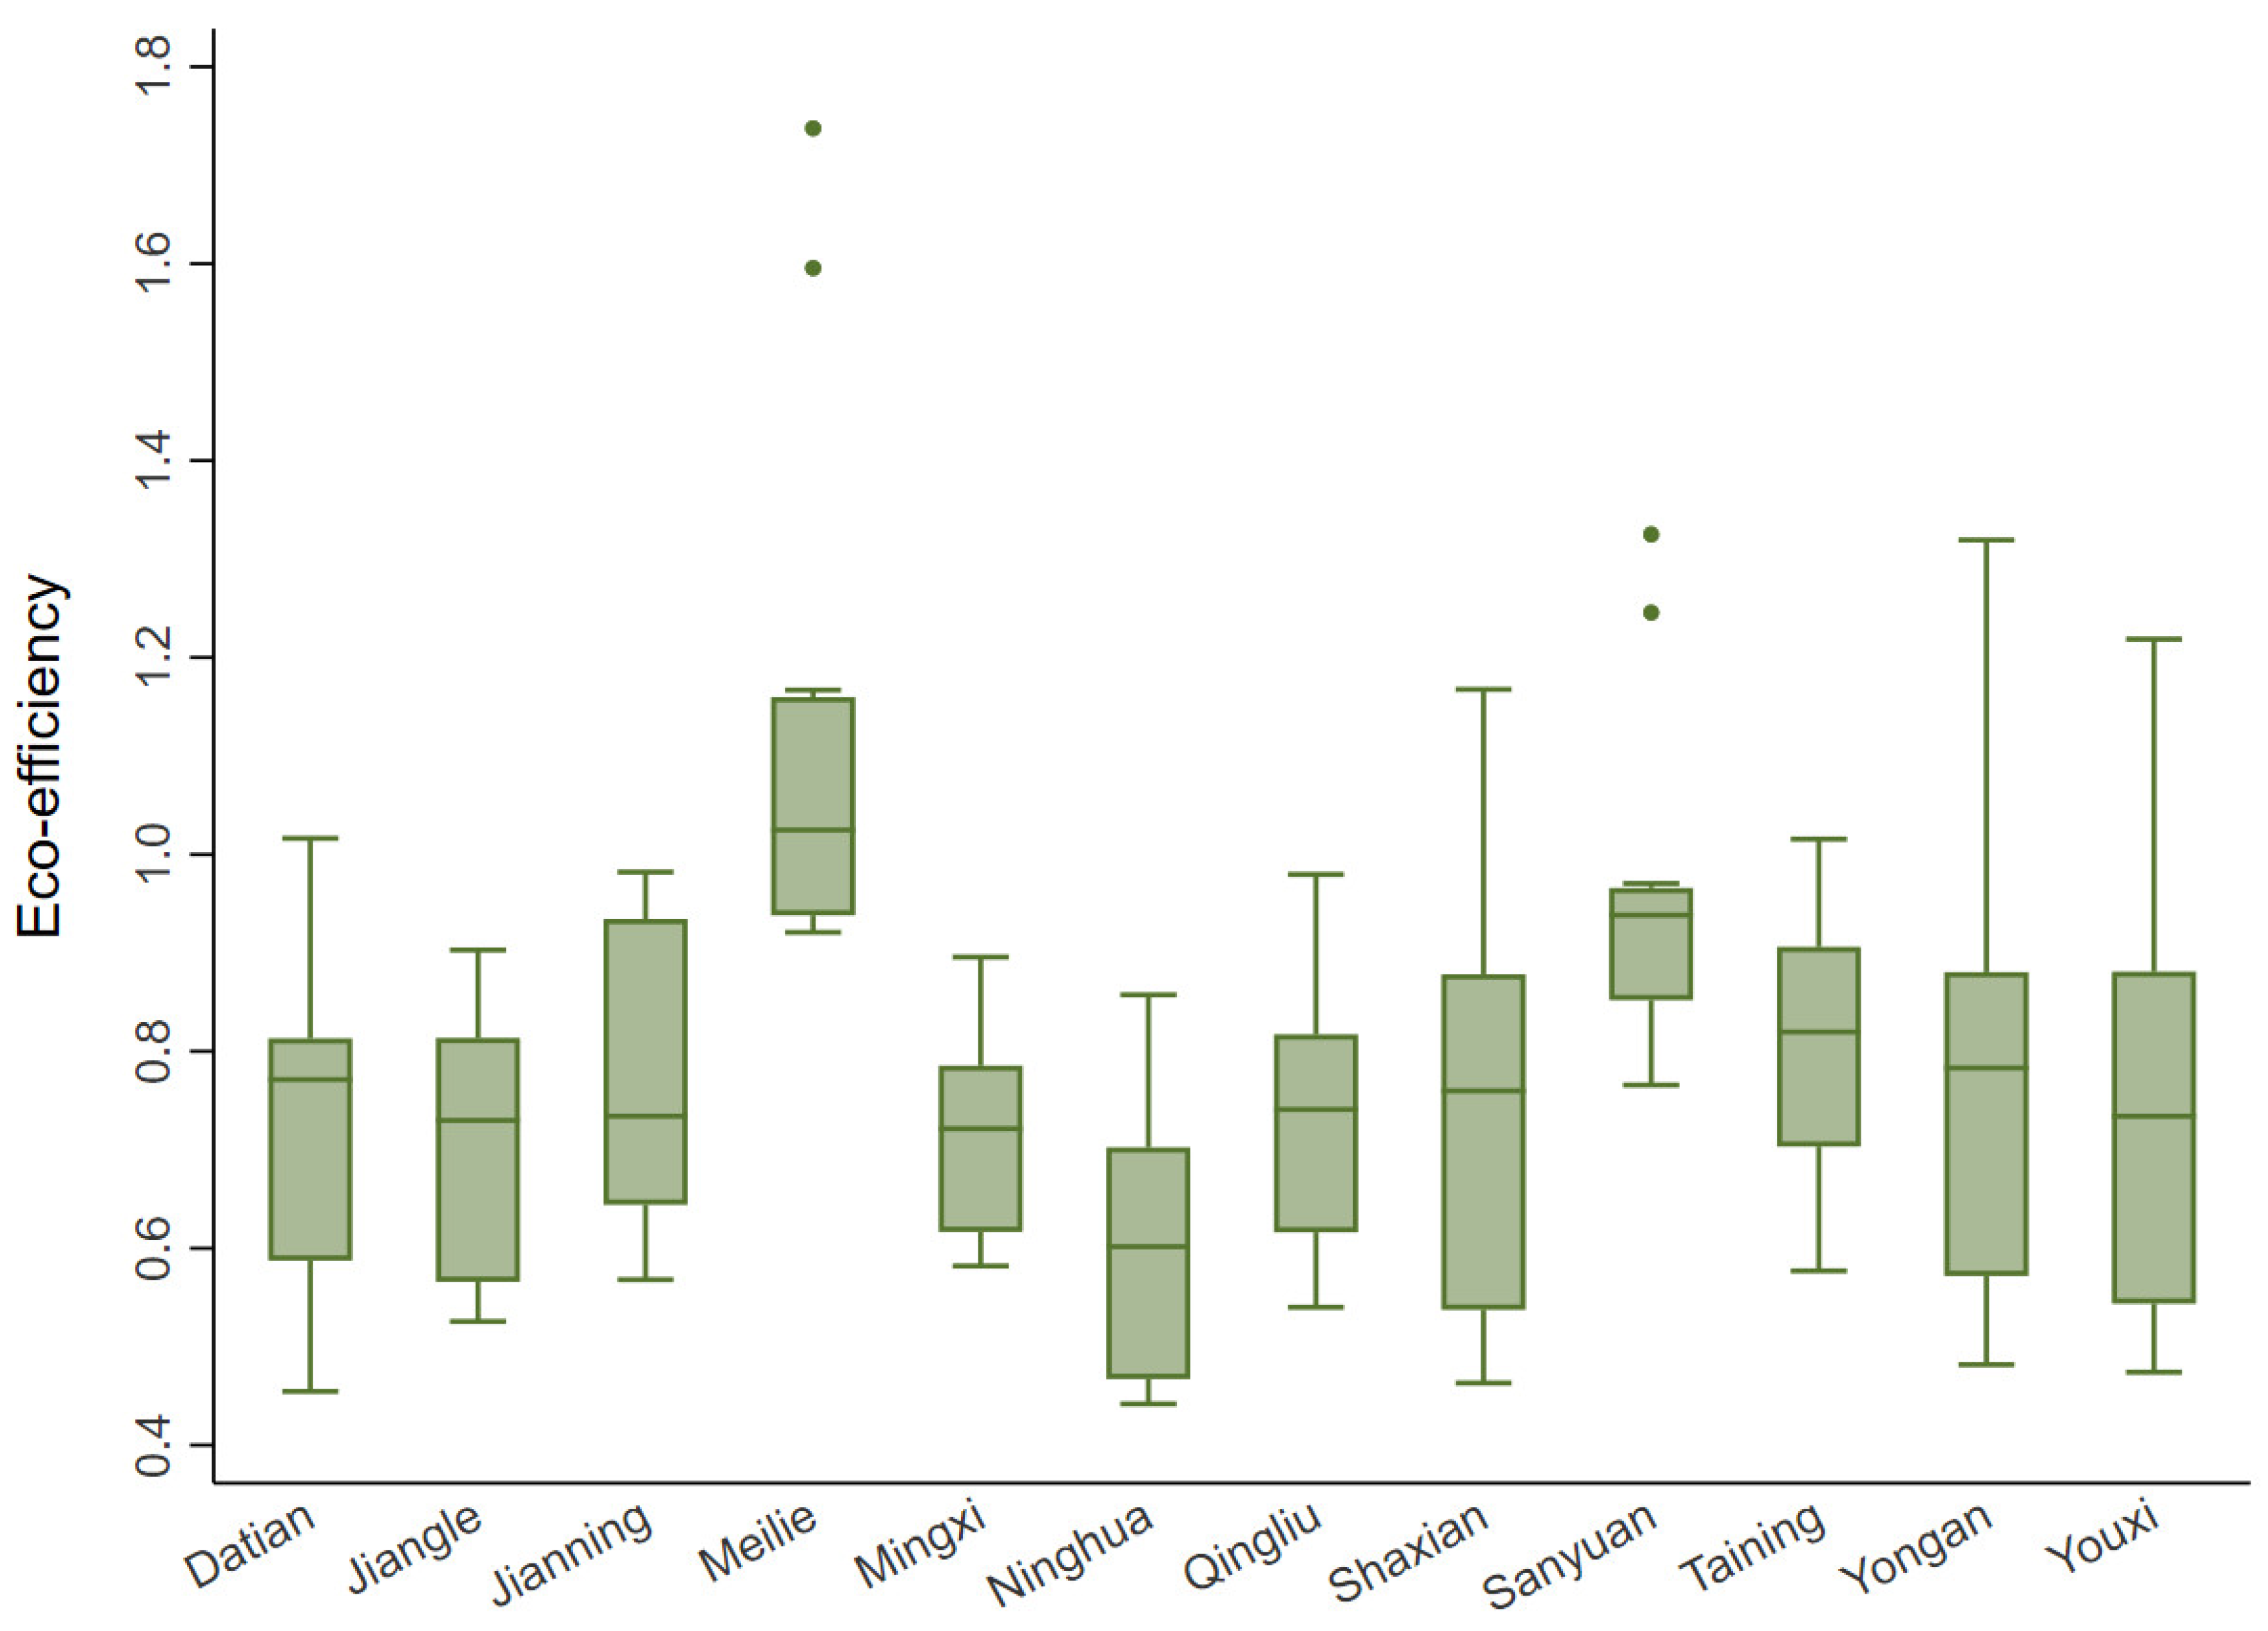
4.1. Eco-Efficiency Analysis of Minjiang-Source

The eco-efficiency value of Minjiang-Source from 2005 to 2017 was calculated by SE-SBM, the result of which is shown in Table 2. In this study, eco-efficiency is divided into four levels, which are super efficiency ( ρ   1   ), medium efficiency ( 0.8   ρ < 1   ), low efficiency ( 0.6   ρ < 0.8   ) and inefficiency ( ρ < 0.6 ) [46].
From the perspective of time dimension (Table 2), the eco-efficiency values of Minjiang-Source from 2005 to 2017 were at the following efficiency levels: the eco-efficiency from 2005 to 2012 was at the low efficiency level, from 2013 to 2016 at the medium efficiency level, and in 2017 at the super efficiency level. However, in the past 13 years, the growth rate of eco-efficiency exhibited a trend of fluctuation, gradually increasing year by year at first, then decreasing sharply, and then gradually increasing again. According to the analysis from the regional dimension (Table 2), among the 12 counties in Minjiang-Source, 67.7% of which were at the inefficiency level, in Meilie at the super efficiency level, and in Ninghua at the low efficiency level. The mean of the eco-efficiency value in two districts located in the downtown, Sanyuan and Meilie, were 1.084 and 0.939, significantly higher than that of other counties in the city. This is probably because the overall economic development level in the downtown is better than other counties, with a typical urban cluster effect, such as a relatively stronger talent aggregation effect, a more developed science and technology, medical and health care, and a relatively higher investment in ecological environment governances, etc.
From the perspective of decomposed efficiency, Figure 3 reflects comprehensive eco-efficiency (CE), pure technical efficiency (TE) and scale efficiency (SE) of the average eco-efficiency of Minjiang-Source from 2005 to 2017. Specifically, the comprehensive eco-efficiency of Minjiang-Source showed an increasing trend. The change rules of comprehensive eco-efficiency and technical efficiency are similar, indicating a strong positive correlation between eco-efficiency and technical efficiency, and technological progress plays a positive role in improving eco-efficiency. Therefore, to improve eco-efficiency means adjusting the industrial structure, promoting industrial transformation and upgrading, increasing investment in science and technology, and focusing on the development of high-tech industry.
The overall variation of the eco-efficiency across the 12 counties of Minjiang-Source was not significant over the years (Figure 4). The dispersion degree of the eco-efficiency of Yongan, Shaxian and Youxi counties was relatively high, which indicates that the eco-efficiency values of these three counties fluctuate greatly and the stability is relatively poor. Meilie, Sanyuan, Taining and Mingxi had a smaller degree of dispersion, indicating a relatively stable eco-efficiency. However, there are outliers in Meilie and Sanyua; both appeared in 2010 and 2017.

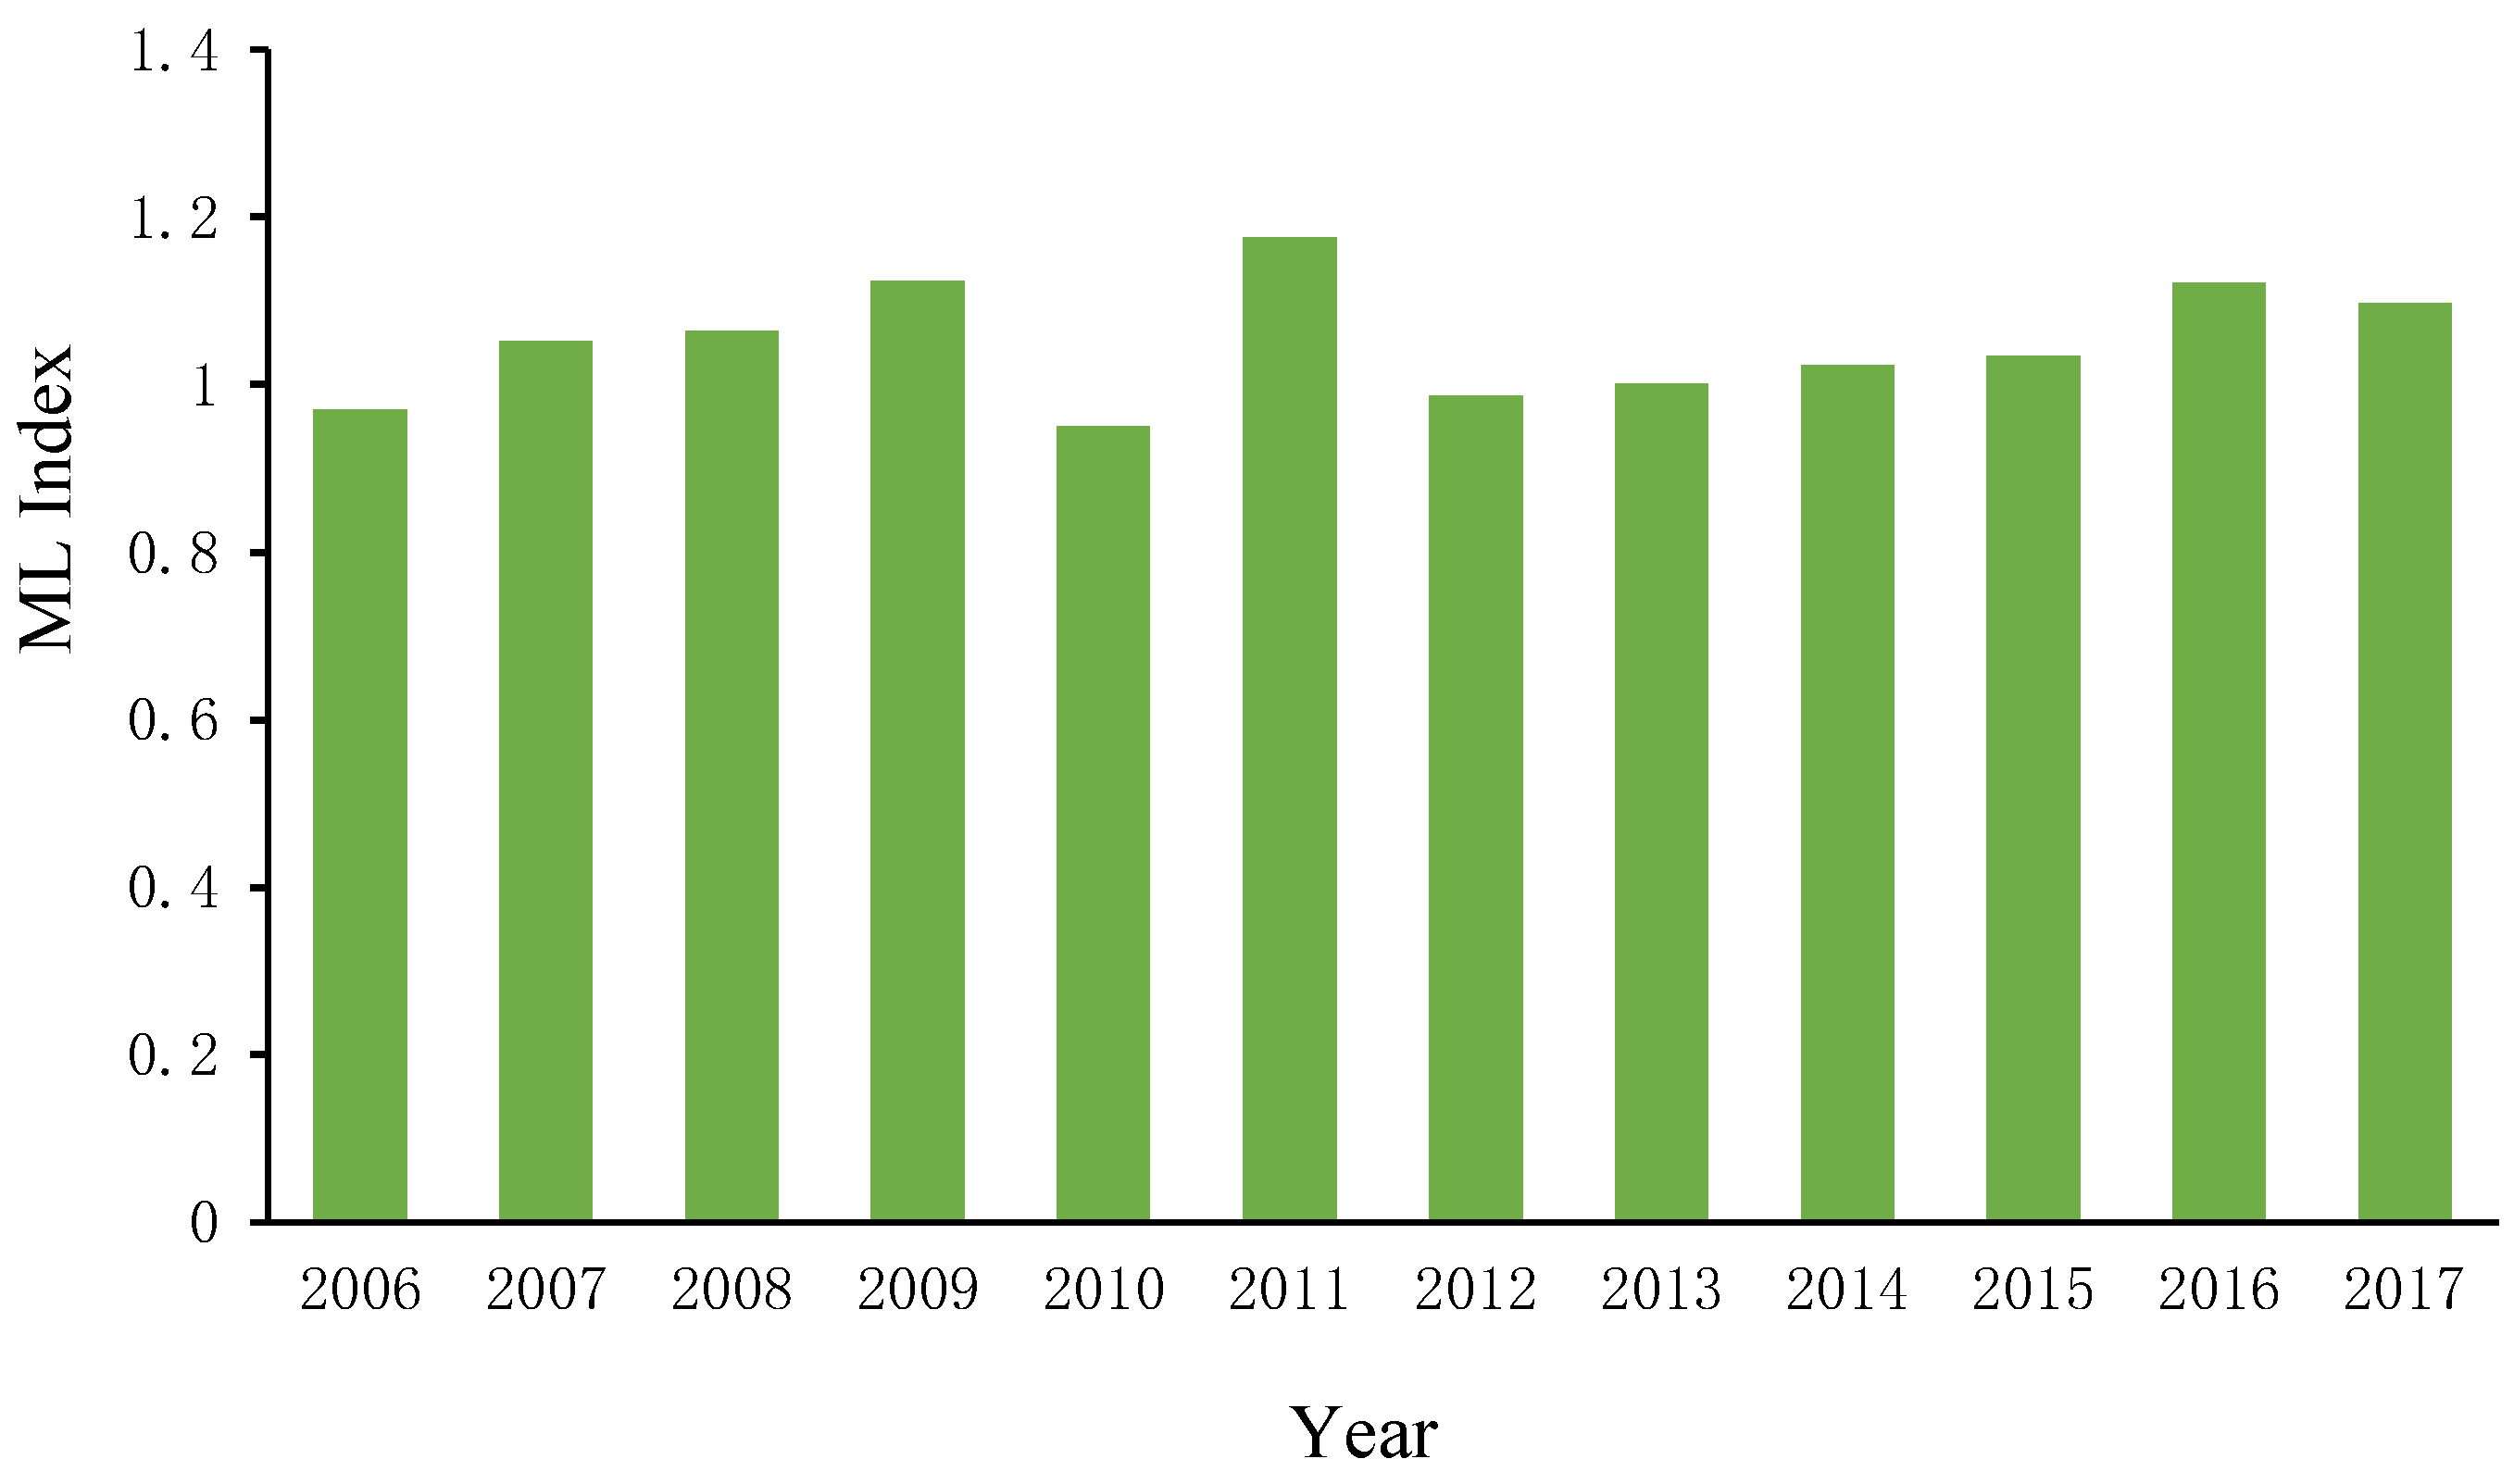
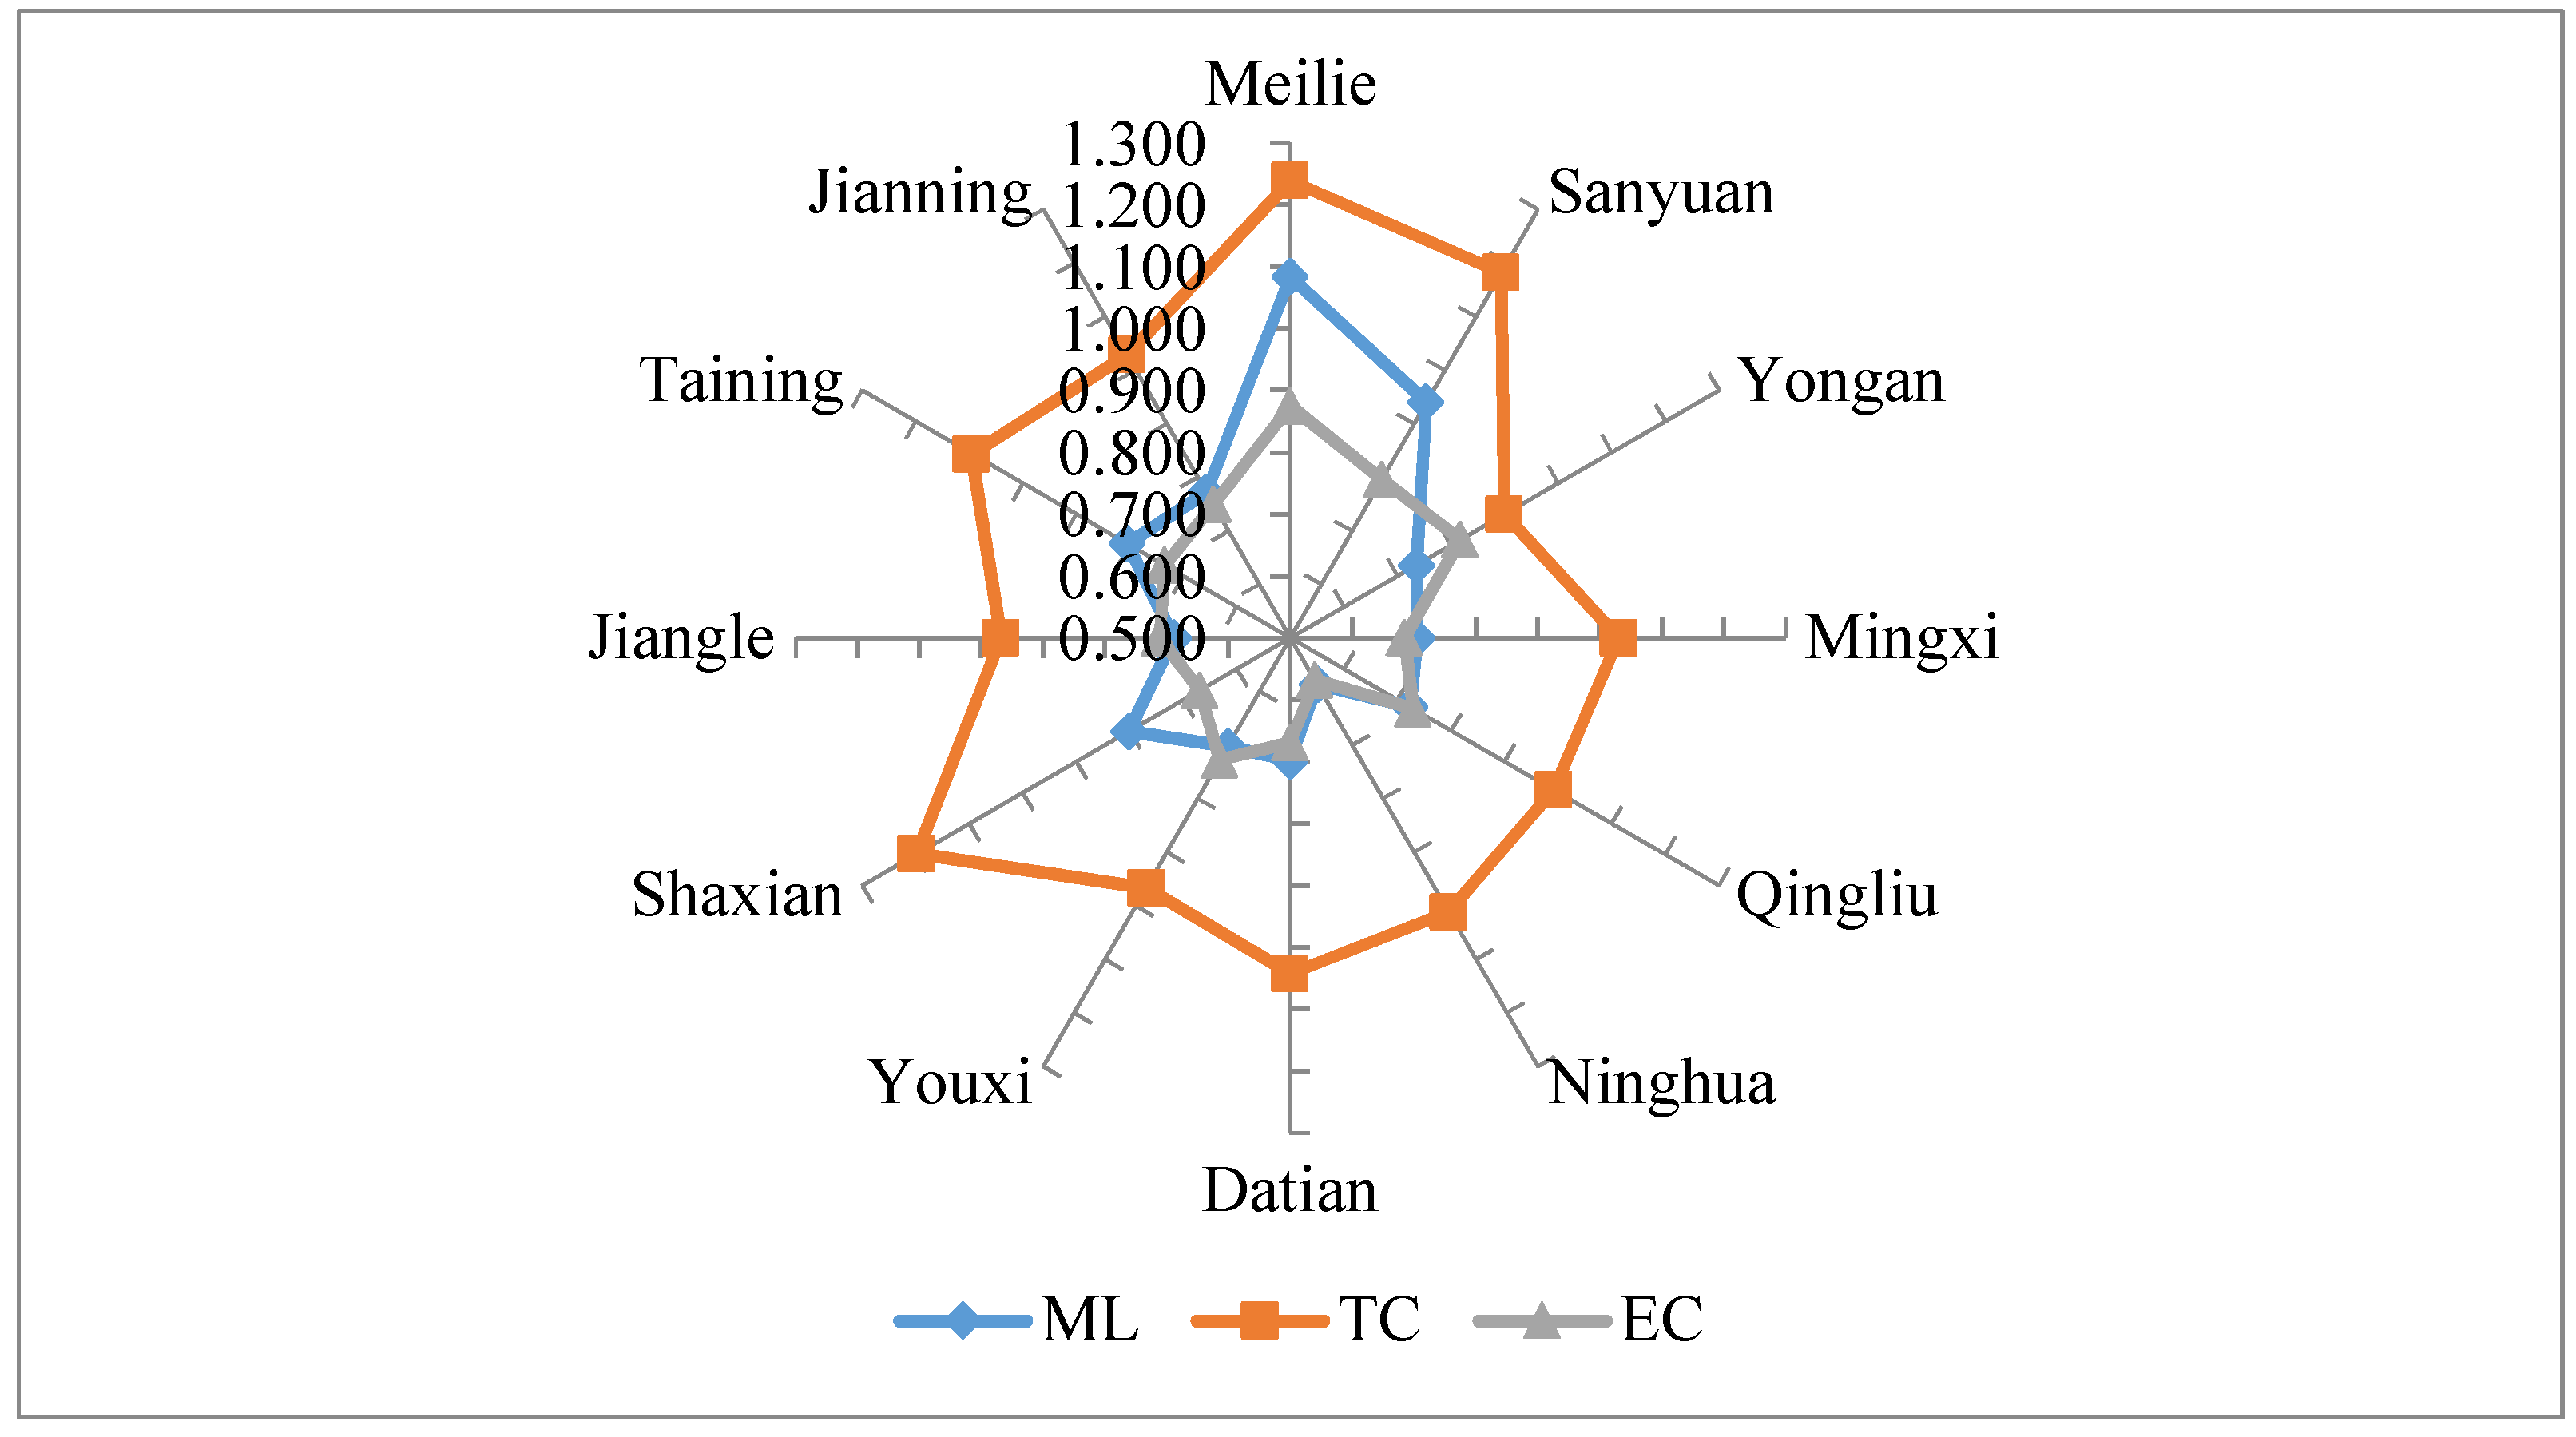
4.2. Index Analysis of ML Index in Minjiang Source

In order to further analyze the dynamic change trend of the eco-efficiency of Minjiang-Source over time, this paper calculated the Malmquist-Luenberger index (ML), technical efficiency change (EC) and technical progress change (TC) of the undesirable output total factor production efficiency index. The mean value across different counties was calculated and is shown in Figure 5. From 2006 to 2017, the ML indexes of Minjiang-Source showed a fluctuating trend, with an average of 1.046, indicating that ecological environment, social development and economic development of Minjiang-Source basically reached a coordinated development.
The Malmquist-Luenberger index (ML), technical efficiency change (EC) and technical progress change (TC) is shown in Figure 6. The comprehensive efficiency (ML) of Meilie and Sanyuan was higher, while that of Ninghua was lower. Overall, in 2006–2017, technological progress efficiency values of all counties in Minjiang-Source had no significant difference, all wandering up and down around 1, with a mean value of 1.011. The distribution of TC tallies with that of comprehensive efficiency, which further proves that technological progress is an important influence factor on sustainable development.

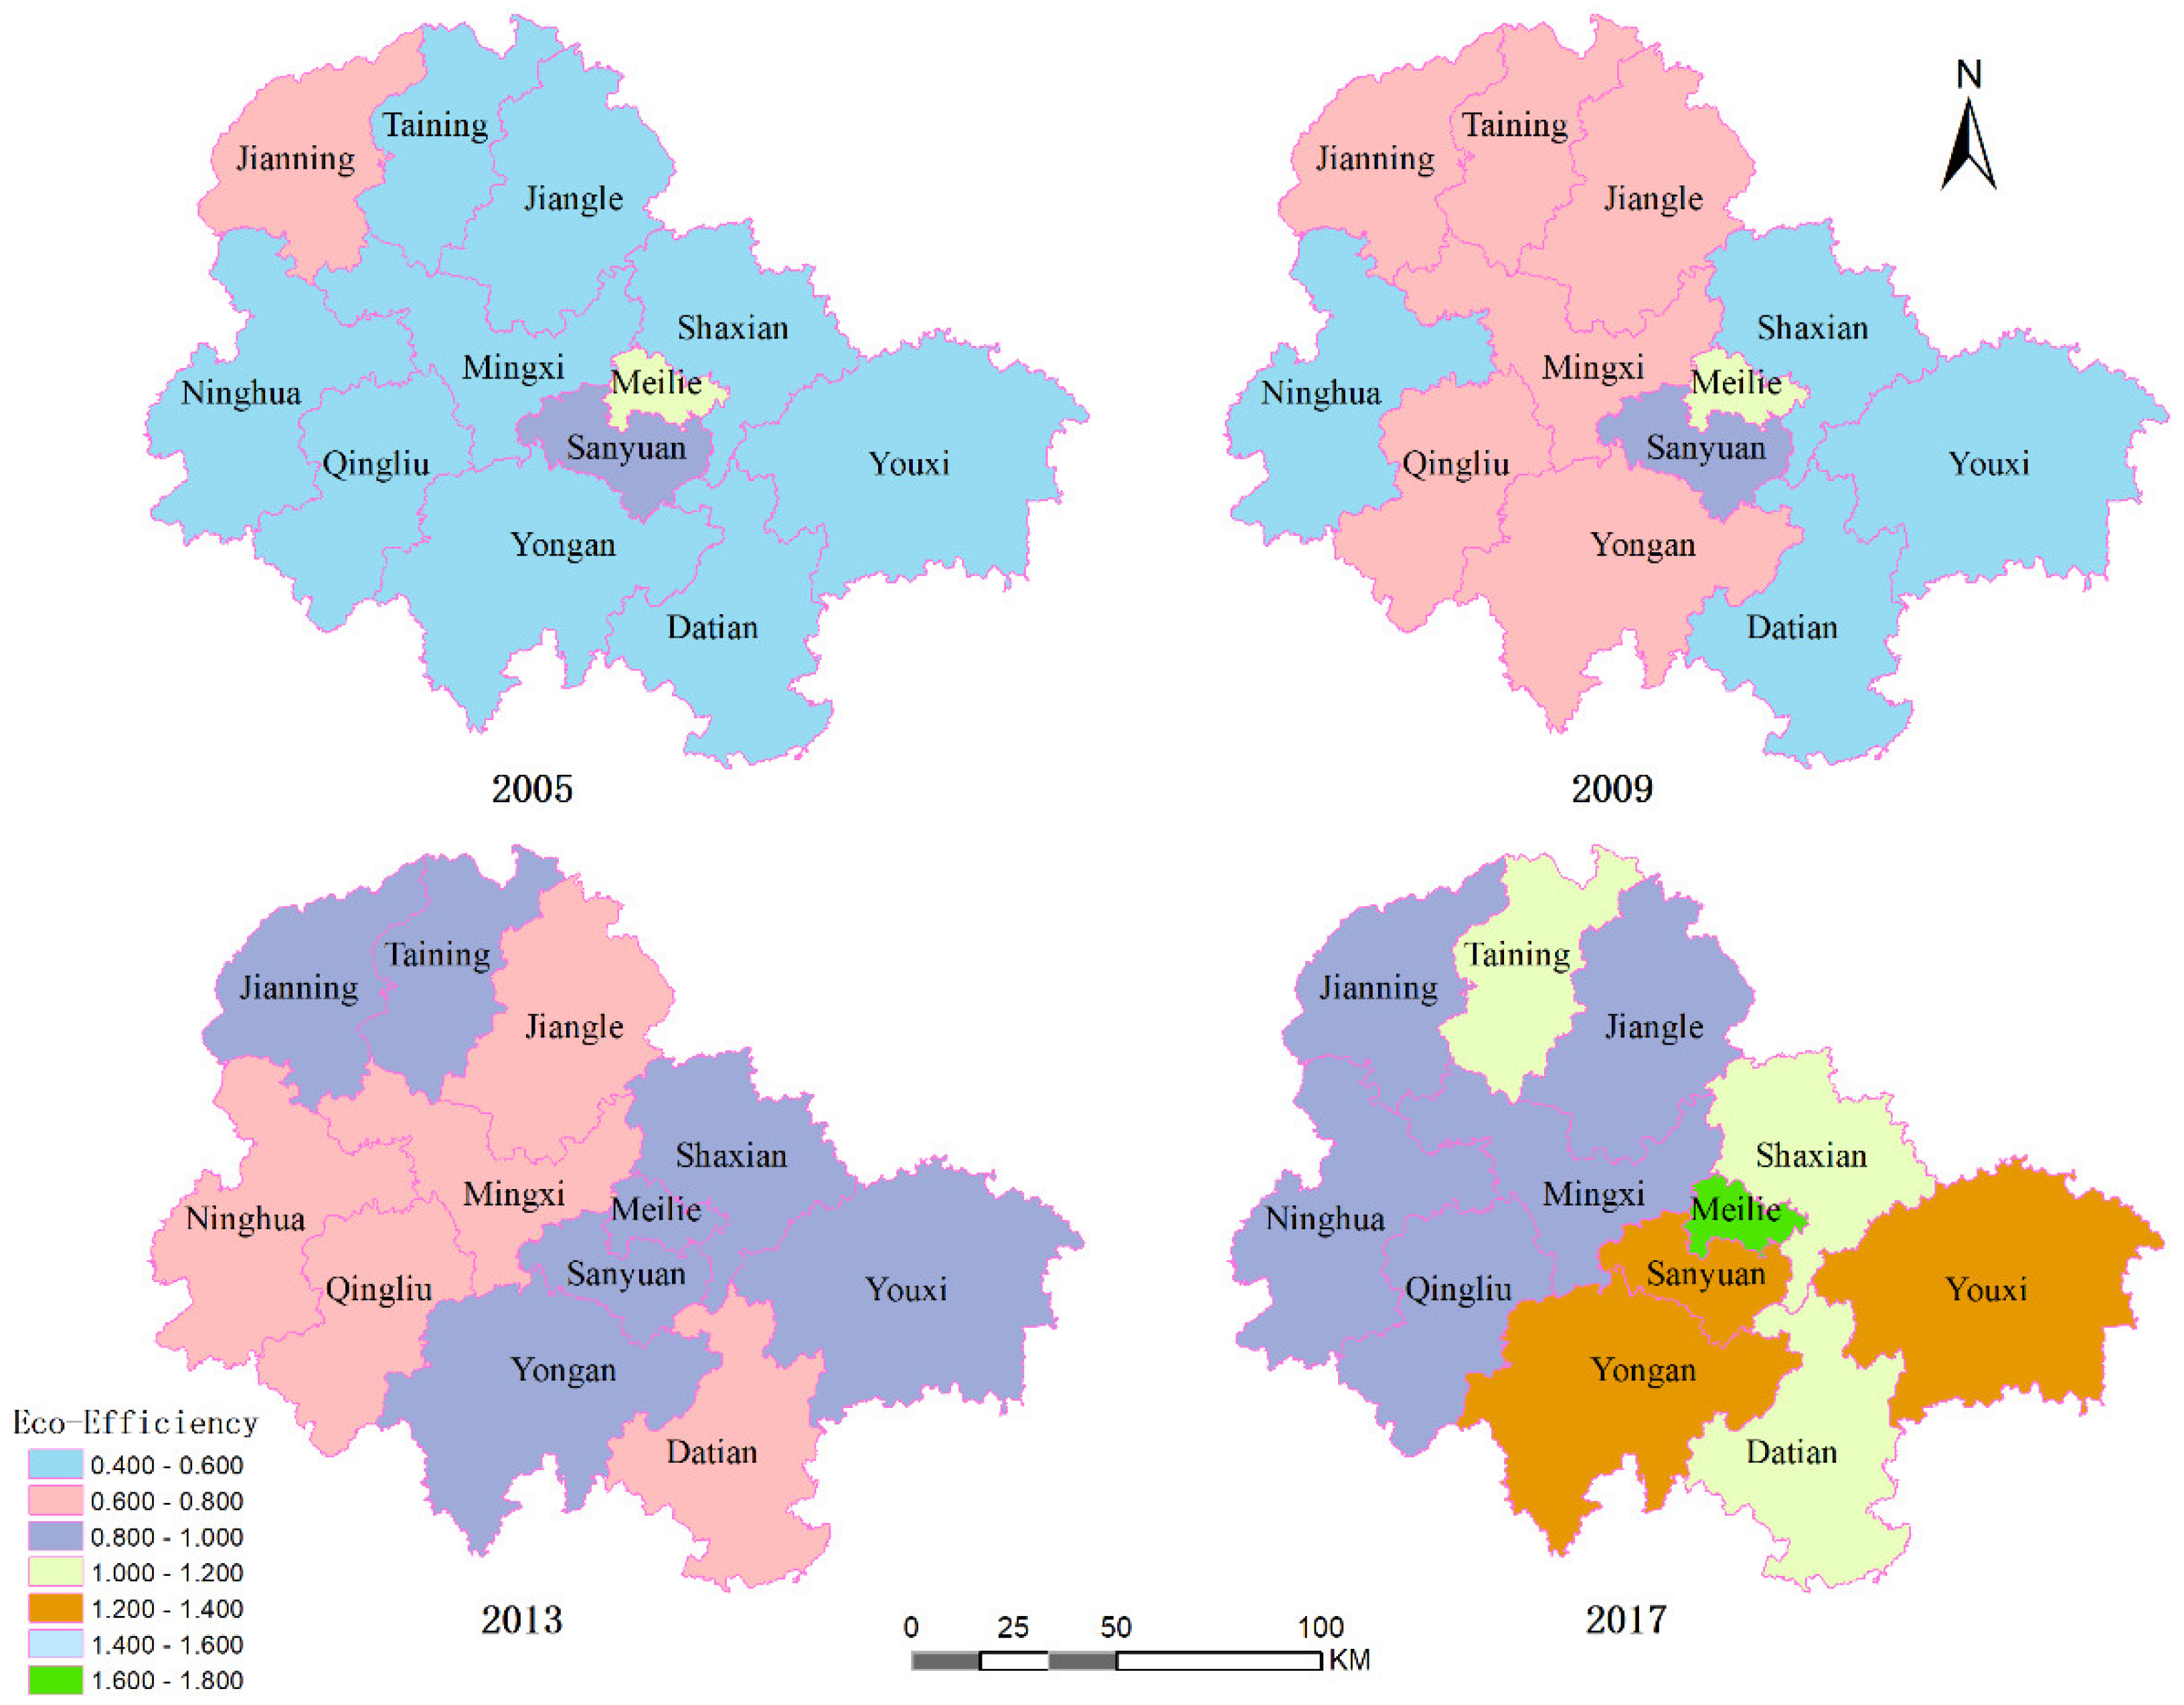
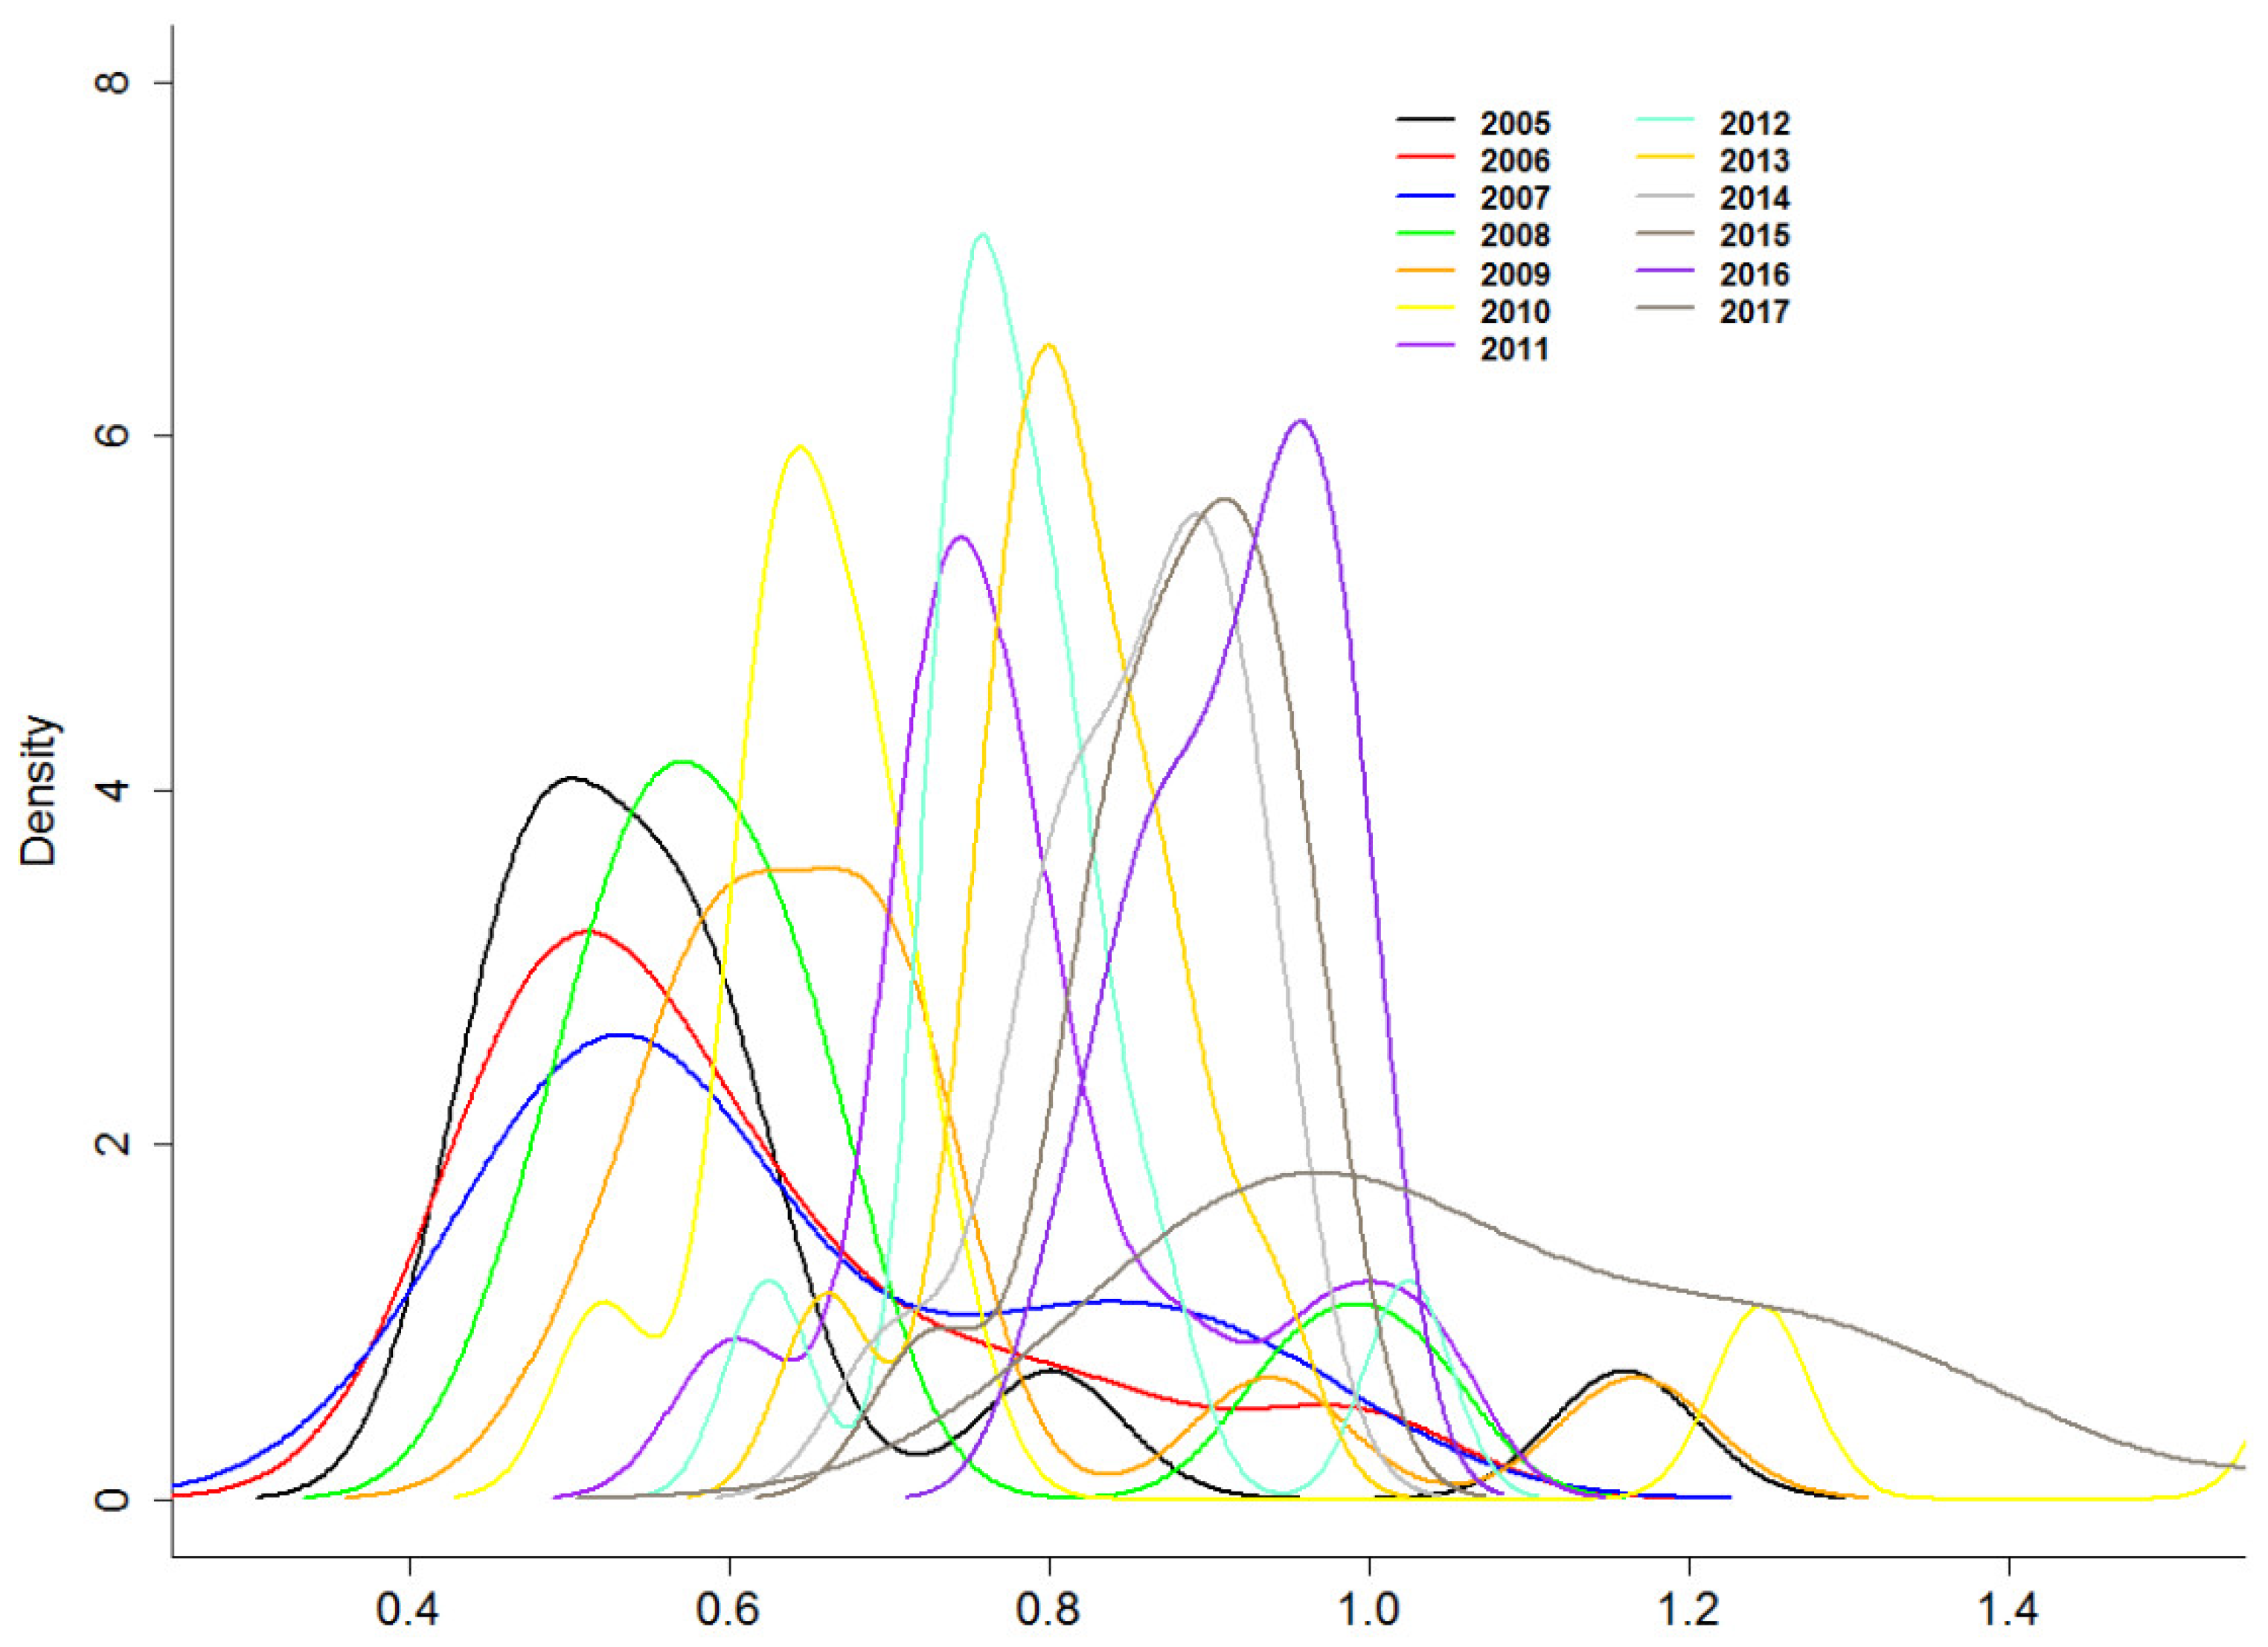
4.3. Spatial and Temporal Difference of Eco-Efficiency in Minjiang River Source and Evolution Analysis

In order to further reflect the temporal and spatial distribution of eco-efficiency intuitively, the eco-efficiency values in 2005, 2009, 2013 and 2017 were selected for spatial comparison analysis and dynamic evolution analysis. The eco-efficiency values were divided into seven levels (Figure 7).
With the passage of time, the eco-efficiency values of all counties in Minjiang-Source gradually improved, but the overall trend of spatial evolution exhibited “higher in the east and lower in the west” (Figure 7). In 2005, the eco-efficiency values of 75% of the counties were at the level of inefficiency, the efficiency value of the Sanyuan was medium, and only the eco-efficiency of Meilie was over 1 showing super efficiency. By 2009, Ninghua, Datian, Youxi and Shaxian were still at the level of inefficiency, Jianning, Taining, Jiangle, Mingxi, Qingliu and Yongan were at the level of low efficiency, and Sanyuan was at the level of medium efficiency, while Meilie was still at the level of super efficiency. By 2013, the eco-efficiency value of Meilie was reduced to the level of medium efficiency, that of Jianning, Taining, Shaxian, Datian and Youxi raised to the level of medium efficiency, the level of Sanyuan did not change level, and the other counties were at the level of medium efficiency. Finally, by 2017, all counties were above the medium efficiency level, and six counties in the eastern part of the city (Meilie, Sanyuan, Yongan, Datian, Shaxian and Youxi) were at the super efficiency level, accounting for 58% of the whole city.
In order to further reveal the evolution law of the eco-efficiency, the density distribution curve of the eco-efficiency in Minjiang-Source was estimated by using non-parametric kernel density function (Figure 8). The peaks are scattered and move to the right over time, indicating that the eco-efficiency was improving. The density function of each year is dispersed and presents a unimodal mode, fluctuating greatly in the low-density areas with a significantly increased heavy right tail. This may be due to the difference in environmental regulation influence on eco-efficiency in different regions, resulting in larger fluctuation of the kernel density curve in high eco-efficiency areas.

4.4. Influence Factors of Eco-Efficiency of Minjiang-Source

Further analysis was conducted on the influence factors of eco-efficiency and sustainable development. Eco-efficiency was selected as the explained variable, with regional economic development, environmental regulation, industrial structure, science and technology investment and labor investment as explaining variables. Regional economic development was measured by per capita GDP, environmental regulation was characterized by the cost on industrial pollution treatment, industrial structure was represented by the accounted proportion of the tertiary industry for GDP, R&D investment was used to measure science and technology investment and labor investment was the number of labor at the end of each year.
According to the previous study, many papers have regressed the efficiency on exogenous factors by using the Tobit regression model (e.g., [47]), fixed effect panel data model (e.g., [38]), bootstrap regression model (e.g., [48]), etc. However, Simar and Wilson [49] pointed out these approaches are not suitable for testing the decisive factors of efficiency due to problems of unknown serial correlation, and then proposed bootstrap regression model to improve the statistical efficiency. Therefore, to estimate the influencing factors of eco-efficiency, this paper adopted a fixed effect panel model with bootstrap procedure. To control heterogeneity in the fixed effect model, the standard errors were based on the Huber/White/sandwich estimator. To overcome the multicollinearity in our model, especially the squared term (SER), we first standardized the natural logarithm of environmental regulation (LNER) and then squared. Thus, multicollinearity is not considered a serious problem due to the bootstrapped variance inflation factors (VIFs) all being significantly less than 10, as reported in Table 3. Further, the fixed effect model was estimated, and the regression results are shown in Table 4.
From Table 4, it can be seen that eco-efficiency is significantly positively related to the level of economic development at the level of 0.05. The squared environmental regulation has significant negative effects on eco-efficiency, exhibiting an “Inverted U-Shape”. The positive coefficient of industrial structure on eco-efficiency was not significant at 0.015 (p = 0.941 > 0.05). There was a significant positive correlation between scientific and technological investment and eco-efficiency, with a coefficient of 0.283 (p = 0.000 < 0.05). The relationship between labor force and eco-efficiency was negatively significant with a coefficient of −0.329 (p = 0.001 < 0.05).

5. Discussions and Conclusions

In this paper, the SE-SBM model was used to calculate the eco-efficiency of the Minjiang-Source in the key ecological function area of Fujian Province, China, and the Malmquist-Luenberger index was applied to analyze the dynamic evolution of eco-efficiency. A fixed effect panel data model was adopted to assess the influencing factors of eco-efficiency. The results show some consistencies and inconsistencies when compared to previous studies.
First, the level of sustainable development of ecological environment in Minjiang-Source is unbalanced, and the eco-efficiency shows a spatial differentiation of “high in the east and low in the west”. Previous studies also report similar results at a different research level. Eco-efficiency studies on Chinese cities at the prefecture-level show the highest eco-efficiency in the eastern region and the lowest eco-efficiency in the western and central regions [10]. Prefecture-level research in different provinces shows slightly different results. For instance, the eastern part in Guangdong presents the highest eco-efficiency, while the mountainous northern area has the lowest eco-efficiency [48]. Therefore, spatial differentiation may exist due to the typical aggregation effect resulting from the economic development level, the industrial structure, etc.
Second, a significant temporal change has been found. From 2005 to 2017, the eco-efficiency values of 67.7% of counties in Minjiang-Source were low, with an average annual growth rate of 5.98%. By 2017, eco-efficiency was above the level of medium efficiency, and 58% of counties were above the level of super efficiency, achieving the coordinated development of ecological environment and social economy. The undesirable outputs total factor production efficiency index (ML) of Minjiang-Source shows a fluctuation trend, and the correlation between comprehensive efficiency and technical efficiency is significant. The fluctuation may be a lagged effect of ecological protection measures like the local government’s emphasis on the urban ecological environment treatment or environmental sewage and garbage treatment action. Extant literature has shown other factors which drive the fluctuation, such as the pursuit of a GDP growth model and financial crisis [38].
Third, the fixed effect model shows that scientific and technological progress, environmental regulation, labor force and economic development level are the main factors affecting the eco-efficiency and sustainable development of Minjiang-Source. Technological progress was found to have a great positive effect on eco-efficiency. Investment in R&D activities helps local industries upgrade the production process, thus fewer undesirable outputs are discharged, improving the eco-efficiency in turn. Labor force has a high negative effect on eco-efficiency. With the development of science and technology, a labor-intensive industry may restrain the improvement of eco-efficiency, and the development of human capital will gradually upgrade. The “Inverted U-Shape” relationship between environmental regulation and eco-efficiency is consistent with the Porter’s hypothesis, showing that proper environmental regulation will enhance eco-efficiency initially and damage eco-efficiency after reaching the extreme point. The coefficient of industrial structure on eco-efficiency is not significant, which may due to that the contribution of tertiary industry to GDP in Minjiang-Source area is relatively small, accounting for an average of only 33.6% of GDP.
To sum up, in the process of regional economic development, with the increase of production scale (scale efficiency increases year by year), accompanied with increased ecological environment pollution and energy consumption, the eco-efficiency will decrease to some extent. However, the upgrading of industrial structure brought by scientific and technological innovation will improve the utilization efficiency of resources, reduce resource consumption and pollution emissions, relieve the pressure of production on resource demand, improve eco-efficiency and promote sustainable environmental development [31]. Therefore, it is necessary to explore the sustainable development of key ecological functional areas under the constraint of resources and environmental protection. First of all, it is urgent to strengthen the investment in science and technology. Developing a high-tech, low-carbon, and environmental protection focused advanced technology industry, eliminating or transform traditional industries with high pollution and high energy consumption, and speeding up local industry transformation and upgrading can help to reduce the destructive effects of lower-end industries on the environment, improve economic productivity of per unit environmental cost, and guarantee the development of economy and the environment. In addition, it is necessary to step up efforts on ecological environment protection, reduce the risks of ecological degradation, and ensure ecological security [50]. Efforts should be made to develop ecological industries that produce valuable ecological product, such as ecotourism, ecological health, green finance, forest carbon sink, and undergrowth economy, etc., so as to reduce the interference and damage to the environment in the process of economic development. Therefore, this study not only effectively evaluates the regional ecological environment and economic development and serves as an aid to the formulation of economic development policies, but also provides reference for the ecological environment protection in other key ecological functional areas.
However, factors influencing the eco-efficiency of key ecological functional areas have yet to be further thorough examined, which may include the economy, society, environment, and even the stages and targeted policy of the areas. With the differences among different scales of research areas and the heterogeneities of human activities, evaluations of eco-efficiency may have a large variation. Further consideration on the environmental sustainability assessment system of macro-, meso- and micro-level of scales could improve the overall evaluation system. Moreover, incorporated with more complex climate change, human activities and policy factors might also help to evaluate eco-efficiency more thoroughly and help government to promote specific policies.

Author Contributions

Conceptualization, J.L.; methodology, J.L. and C.C.; software, J.L. and C.C.; validation, J.L., C.C. and F.Z.; formal analysis, J.L. and F.Z.; investigation, C.C and F.Z.; resources, J.L.; data curation, J.L.; writing—original draft preparation, J.L.; writing—review and editing, C.C. and J.L.; visualization, J.L.; supervision, J.L. and F.Z.; project administration, J.L.; funding acquisition, J.L. All authors have read and agreed to the published version of the manuscript.

Funding

This research was funded by the National Social Science Foundation Project for western China, grant number 16XJY004.

Acknowledgments

We thank the reviewers for their valuable feedback, which helped to improve the manuscript quality.

Conflicts of Interest

The authors declare no conflict of interest.

References

  1. Zhang, K.M.; Wen, Z.G. Review and challenges of policies of environmental protection and sustainable development in China. J. Environ. Manag. 2008, 88, 1249–1261. [Google Scholar] [CrossRef]
  2. The National Development and Reform Commission. The Planning of National and Regional Main Functional Areas; People′s Publishing House: Beijing, China, 2015.
  3. Xu, J.; Xie, G.; Xiao, Y.; Li, N.; Yu, F.; Pei, S.; Jiang, Y. Dynamic Analysis of Ecological Environment Quality Combined with Water Conservation Changes in National Key Ecological Function Areas in China. Sustainability 2018, 10, 1202. [Google Scholar] [CrossRef] [Green Version]
  4. Wang, G.; Yang, D.; Xia, F.; Zhong, R.; Xiong, C. Three Types of Spatial Function Zoning in Key Ecological Function Areas Based on Ecological and Economic Coordinated Development: A Case Study of Tacheng Basin, China. Chin. Geogr. Sci. 2019, 4, 689–699. [Google Scholar] [CrossRef] [Green Version]
  5. Organization for Economic Cooperation and Development (OECD). Eco-Efficiency; OECD: Paris, France, 1998; pp. 7–11. [Google Scholar]
  6. Chu, D.J.; Zhu, Y. Ecological efficiency and circular economy. Fudan J. 2005, 2, 60–66. [Google Scholar]
  7. Schaltegger, S.; Sturm, A. Ökologische Rationalität: Ansatzpunkte zur Ausgestaltung von ökologieorientierten Managementinstrumenten. Unternehmung 1990, 44, 273–290. [Google Scholar]
  8. Rybaczewska-Błażejowska, M.; Masternak-Janus, A. Eco-efficiency assessment of Polish regions: Joint application of life cycle assessment and data envelopment analysis. J. Clean. Prod. 2018, 172, 1180–1192. [Google Scholar] [CrossRef]
  9. Huang, J.; Xia, J.; Yu, Y. Composite eco-efficiency indicators for China based on data envelopment analysis. Ecol. Indic. 2018, 85, 674–697. [Google Scholar] [CrossRef]
  10. Ren, Y.; Fang, C.; Li, G. Spatiotemporal characteristics and influential factors of eco-efficiency in Chinese prefecture-level cities: A spatial panel econometric analysis. J. Clean. Prod. 2017, 72, 2047–2063. [Google Scholar] [CrossRef]
  11. Guo, S.; Li, H.; Zhao, R.; Zhou, X. Industrial environmental efficiency assessment for China’s western regions by using a SBM-based DEA. Environ. Sci. Pollut. Res. 2019, 26, 27542–27550. [Google Scholar] [CrossRef]
  12. Xing, Z.; Wang, J.; Zhang, J. Total-factor ecological efficiency and productivity in Yangtze River Economic Belt, China: A non-parametric distance function approach. J. Clean. Prod. 2018, 200, 844–857. [Google Scholar] [CrossRef]
  13. Zhu, W.; Xu, L.; Tang, L.; Xiang, X. Eco-efficiency of the Western Taiwan Straits Economic Zone: An evaluation based on a novel eco-efficiency model and empirical analysis of influencing factors. J. Clean. Prod. 2019, 234, 638–652. [Google Scholar] [CrossRef]
  14. Wang, Y.; Liu, J.; Hansson, L.; Zhang, K.; Wang, R. Implementing stricter environmental regulation to enhance eco-efficiency and sustainability: A case study of Shandong Province′s pulp and paper industry, China. J. Clean. Prod. 2011, 19, 303–310. [Google Scholar] [CrossRef]
  15. Xing, L.; Xue, M.; Wang, X. Spatial correction of ecosystem service value and the evaluation of eco-efficiency: A case for China’s provincial level. Ecol. Indic. 2018, 95, 841–850. [Google Scholar] [CrossRef]
  16. Chen, L.; Jia, G. Environmental efficiency analysis of China’s regional industry: A data envelopment analysis (DEA) based approach. J. Clean. Prod. 2017, 142, 846–853. [Google Scholar] [CrossRef]
  17. Zhou, Y.; Xing, X.; Fang, K.; Liang, D.; Xu, C. Environmental efficiency analysis of power industry in China based on an entropy SBM model. Energy Policy 2013, 57, 68–75. [Google Scholar] [CrossRef]
  18. Ma, X.; Wang, C.; Yu, Y.; Li, Y.; Dong, B.; Zhang, X.; Gu, Y. Ecological efficiency in China and its influencing factors—A super-efficient SBM metafrontier-Malmquist-Tobit model study. Environ. Sci. Pollut. Res. 2018, 25, 20880–20898. [Google Scholar] [CrossRef]
  19. Chansarn, S. The Evaluation of the Sustainable Human Development: A Cross-country Analysis Employing Slack-based DEA. Procedia Environ. Sci. 2014, 20, 3–11. [Google Scholar] [CrossRef] [Green Version]
  20. Jin, W.; Zhang, H.; Liu, S.; Zhang, H. Technological innovation, environmental regulation, and green total factor efficiency of industrial water resources. J. Clean. Prod. 2019, 211, 61–69. [Google Scholar] [CrossRef]
  21. Sun, X.; Loh, L. Sustainability Governance in China: An Analysis of Regional Ecological Efficiency. Sustainability 2019, 11, 1958. [Google Scholar] [CrossRef] [Green Version]
  22. Page, B.; Wohlgemuth, V. Advances in Environmental Informatics: Integration of Discrete Event Simulation Methodology with ecological Material Flow Analysis for Modelling eco-efficient Systems. Procedia Environ. Sci. 2010, 2, 696–705. [Google Scholar] [CrossRef] [Green Version]
  23. Wursthorn, S.; Poganietz, W.R.; Schebek, L. Economic environmental monitoring indicators for European countries: A disaggregated sector-basedapproach for monitoring eco-efficiency. Ecol. Econ. 2011, 70, 487–496. [Google Scholar] [CrossRef]
  24. Beames, A.; Broekx, S.; Heijungs, R.; Lookman, R.; Boonen, K.; Geert, Y.V.; Dendoncker, K.; Seuntjens, P. Accounting for land-use efficiency and temporal variationsbetween brownfield remediation alternatives in lifecycle assessment. J. Clean. Prod. 2015, 101, 109–117. [Google Scholar] [CrossRef]
  25. Bai, Y.P.; Deng, X.Z.; Jiang, S.; Zhang, Q.; Wang, Z. Exploring the relationship between urbanization and urban eco–efficiency: Evidence from prefecture–level cities in China. J. Clean. Prod. 2018, 195, 1487–1496. [Google Scholar] [CrossRef]
  26. Zhou, P.; Poh, K.L.; Ang, B.W. A non-radial DEA approach to measuring environmental performance. Eur. J. Oper. Res. 2007, 178, 1–9. [Google Scholar] [CrossRef]
  27. Moutinho, V.; Fuinhas, J.A.; Marques, A.C.; Santiago, R. Assessing eco-efficiency through the DEA analysis and decoupling index in the Latin America countries. J. Clean. Prod. 2018. [Google Scholar] [CrossRef]
  28. Zhang, B.; Bi, J.; Fan, Z.; Yuan, Z.; Ge, J. Eco-efficiency analysis of industrial system in China: A data envelopment analysis approach. Ecol. Econ. 2008, 68, 306–316. [Google Scholar] [CrossRef]
  29. Yin, K.; Wang, R.S.; Zhou, C.B.; Liang, J. Review of eco-efficiency accounting method and its applications. Acta Ecol. Sin. 2012, 32, 3595–3605. [Google Scholar] [CrossRef]
  30. Lin, B.Q.; Wang, X.L. Exploring energy efficiency in China′s iron and steel industry: A stochastic frontier approach. Energy Policy 2014, 72, 87–96. [Google Scholar] [CrossRef]
  31. Halkos, G.; Petrou, K. Assessing 28 EU member states′ environmental effi-ciency in national waste generation with DEA. J. Clean. Prod. 2019, 208, 509–521. [Google Scholar] [CrossRef]
  32. Ali, E.; Yang, G. A survey and analysis of the first 40 years of scholarly literature in DEA: 1978–2016. Socio-Econ. Plan. Sci. 2018, 61, 4–8. [Google Scholar]
  33. Wu, J.; Xiong, B.; An, Q.; Sun, J.; Wu, H. Total-factor energy efficiency evaluation of Chinese industry by using two-stage DEA model with shared inputs. Ann. Oper. Res. 2015, 255, 257–276. [Google Scholar] [CrossRef]
  34. Deng, G.; Li, L.; Song, Y. Provincial water use efficiency measurement and factor analysis in China: Based on SBM-DEA model. Ecol. Indic. 2016, 69, 12–18. [Google Scholar] [CrossRef]
  35. Charnes, A.; Cooper, W.W.; Rhodes, E. Measuring the efficiency of decision making units. Eur. J. Oper. Res. 1978, 2, 429–444. [Google Scholar] [CrossRef]
  36. Banker, R.D.; Charnes, A.; Cooper, W.W. Some models for estimating technical and scale inefficiencies in data envelopment analysis. Manag. Sci. 1984, 30, 1078–1092. [Google Scholar] [CrossRef] [Green Version]
  37. Yang, L.; Ouyang, H.; Fang, K.; Ye, L.; Zhang, J. Evaluation of regional environmental efficiencies in China based on super-efficiency-DEA. Ecol. Indic. 2015, 51, 13–19. [Google Scholar] [CrossRef]
  38. Zhou, C.S.; Shi, C.Y.; Wang, S. Estimation of eco-efficiency and its influencing factors in Guangdong province based on Super-SBM and panel regression models. Ecol. Indic. 2018, 86, 67–68. [Google Scholar] [CrossRef]
  39. Zhang, X.Q. Research on Scientific Research Performance of Humanities and Social Sciences in China’s First-class Universities Based on SE-DEA. J. Econ. Sustain. Dev. 2019, 10, 15–32. [Google Scholar]
  40. Huang, Y.S.; Liu, S.J. Efficiency evaluation of a sustainable hydrogen production scheme based on super efficiency SBM model. J. Clean. Prod. 2020, 256, 1–25. [Google Scholar] [CrossRef]
  41. Tone, K.A. Slacks-based measure of efficiency in data envelopment analysis. Eur. J. Oper. Res. 2001, 130, 498–509. [Google Scholar] [CrossRef] [Green Version]
  42. Fare, B.R.; Grosskopf, S.; Norris, M.; Zhang, Z. Productivity growth, technical progress and efficiency change in industrialized countries. Am. Econ. Rev. 1994, 84, 66–83. [Google Scholar]
  43. Tang, D.C.; Tang, J.X.; Xiao, Z.; Ma, T.; Bethel, B.J. Environmental regulation efficiency and total factor productivity—Effect analysis based on Chinese data from 2003 to 2013. Ecol. Indic. 2017, 73, 312–318. [Google Scholar] [CrossRef]
  44. Ren, Y.F.; Fang, C.L.; Lin, X.Q. Evaluation of eco-efficiecy of four major urban agglomerations in eastern coastal area of China. Acta Geogr. Sin. 2017, 72, 2047–2063. [Google Scholar]
  45. Yue, S.; Shen, Y.; Yuan, J. Sustainable total factor productivity growth for 55 states: An application of the new malmquist index considering ecological footprint and human development index. Resour. Conserv. Recycl. 2019, 146, 475–483. [Google Scholar] [CrossRef]
  46. Pan, J.H.; Yin, J. Analysison the Urban Development Efficiency of Citiesat Prefecture Level or abovein China Basedon DEA-ESDA. Econ. Geogr. 2012, 32, 53–60. [Google Scholar]
  47. Diaz-Villavicencio, G.; Didonet, S.R.; Dodd, A. Influencing factors of eco-efficient urban waste management: Evidence from Spanish municipalities. J. Clean. Prod. 2017, 164, 1486–1496. [Google Scholar] [CrossRef]
  48. Liu, T.; Li, J.; Chen, J.; Yang, S. Urban Ecological Efficiency and Its Influencing Factors—A Case Study in Henan Province, China. Sustainability 2019, 11, 5048. [Google Scholar] [CrossRef] [Green Version]
  49. Simar, L.; Wilson, P.W. Estimation and inference in two-stage, semi-parametric models of production processes. J. Econom. 2007, 136, 31–64. [Google Scholar] [CrossRef]
  50. Rak, J.R.; Pietrucha-Urbanik, K. An Approach to Determine Risk Indices for Drinking Water–Study Investigation. Sustainability 2019, 11, 3189. [Google Scholar] [CrossRef] [Green Version]
Figure 1. Geographic location of Minjiang-Source.
Sustainability 12 04783 g001
Figure 2. Flow chart of the proposed model.
Sustainability 12 04783 g002
Figure 3. Temporal change trend of decomposed value of eco-efficiency in the Minjiang-Source during 2005–2017. Note: CE = Comprehensive Efficiency, TE = Pure Technical Efficiency, SE = Scale Efficiency.
Sustainability 12 04783 g003
Figure 4. Boxplot of average eco-efficiency in the Minjiang-Source during 2005–2017.
Sustainability 12 04783 g004
Figure 5. Average Malmquist-Luenberger Index in the Minjiang-Source in 2006–2017.
Sustainability 12 04783 g005
Figure 6. Decomposed index of Malmquist-Luenberger during 2006–2017. Note: ML = Malmquist-Luenberger Index, EC = Technical Efficiency Change, TC = Technical Progress Change.
Sustainability 12 04783 g006
Figure 7. Temporal-spatial difference of eco-efficiency in the Minjiang-Source.
Sustainability 12 04783 g007
Figure 8. The kernel density curve of eco-efficiency evolution the Minjiang-Source during 2005–2017.
Sustainability 12 04783 g008
Table 1. The evaluation indicators of eco-efficiency in the Minjiang-Source.
CategoriesIndicatorsUnits
InputsConstruction landSquare Kilometers
Water consumption10,000 Cube Meters
Labor force10,000
EnergyTons of Standard Coal
Crop planting areaAcre
Desirable OutputsGDP100 Million RMB
Urban disposable income RMB
Rural disposable incomeRMB
Urban per capita green areaSquare Meters
Major grain yieldsTon
Undesirable OutputsIndustrial waste water emissions10,000 Tons
Chemical oxygen demand (COD) emissionsTon
Ammonia nitrogen emissionsTon
Industrial exhaust emissions100 Million Cube Meters
Industrial soot (dust) emissionsTon
Sulfur dioxide (SO2) emissionsTon
Industrial solid waste production10,000 Tons
Table 2. Eco-efficiency in the Minjiang-Source during 2005–2017.
YearMeilieSanyuanYonganMingxiQingliuNinhuaDatianYouxiShaxianJiangleTainingJianningMean
20051.160 0.801 0.482 0.582 0.566 0.442 0.510 0.474 0.463 0.526 0.577 0.624 0.601
20060.989 0.830 0.500 0.602 0.560 0.456 0.455 0.497 0.487 0.545 0.726 0.641 0.607
20070.948 0.766 0.523 0.595 0.540 0.445 0.809 0.512 0.498 0.546 0.891 0.568 0.637
20081.027 0.957 0.572 0.617 0.616 0.467 0.509 0.544 0.538 0.566 0.671 0.644 0.644
20091.167 0.938 0.700 0.641 0.693 0.505 0.587 0.581 0.577 0.614 0.703 0.708 0.701
20101.596 1.246 0.678 0.645 0.689 0.520 0.623 0.642 0.612 0.632 0.694 0.734 0.776
20111.035 0.970 0.880 0.721 0.741 0.602 0.788 0.734 0.778 0.730 0.802 0.729 0.792
20121.025 0.866 0.783 0.751 0.797 0.625 0.742 0.741 0.760 0.748 0.820 0.810 0.789
20130.938 0.852 0.806 0.752 0.790 0.661 0.771 0.809 0.824 0.789 0.865 0.884 0.812
20140.928 0.902 0.874 0.785 0.817 0.702 0.813 0.881 0.878 0.813 0.906 0.934 0.853
20150.931 0.944 0.889 0.830 0.869 0.726 0.828 0.908 0.896 0.840 0.940 0.963 0.880
20160.921 0.966 0.944 0.850 0.909 0.807 0.872 0.987 0.945 0.866 0.980 0.982 0.919
20171.737 1.325 1.320 0.896 0.980 0.858 1.016 1.219 1.168 0.903 1.016 0.973 1.117
Mean1.084 0.939 0.735 0.706 0.723 0.586 0.698 0.704 0.696 0.689 0.804 0.771
Table 3. Variance inflation factors (VIFs) of each exogenous factor.
VariablesVIFStd.Err.zp > |z|[95% Conf. Interval]
LNPGDP3.4640.3898.9100.0002.7024.227
LNER2.4770.23610.5100.0002.0152.940
SER1.7970.1879.5900.0001.4292.164
IS1.0230.1735.9100.0000.6841.363
LNTECH6.9640.7768.9800.0005.4448.484
LNLAB2.7780.3178.7700.0002.1573.398
Note: LNPGDP = natural logarithm of per capita GDP, LNER = natural logarithm of environmental regulation (Normalized), SER = squared environmental regulation, IS = industrial structure, LNTECH = natural logarithm of technology investment, LNLAB = natural logarithm of labor force.
Table 4. Bootstrap regression results.
Eco-EfficiencyObserved
Coef.
Bootstrap
Std. Err.
zp > |z|Normal-Based
[95% Conf. Interval]
LNPGDP0.1310.0393.3800.0010.0550.206
LNER−0.0990.041−2.4400.015−0.179−0.020
SER−0.0440.017−2.5700.010−0.078−0.011
IS0.0150.2050.0700.941−0.3870.417
LNTECH0.2830.0485.9200.0000.1890.377
LNLAB−0.3290.098−3.3600.001−0.521−0.137
Constant4.1711.0883.8300.0002.0386.304
N = 156
Wald chi2(6) = 419.98
Prob > chi2 = 0.000
Within R-squared = 0.789
Between R-squared = 0.722
overall R-squared = 0.740
Note: LNPGDP = natural logarithm of per capita GDP, LNER = natural logarithm of environmental regulation (Normalized), SER = squared environmental regulation, IS = industrial structure, LNTECH = natural logarithm of technology investment, LNLAB = natural logarithm of labor force.

