Article

Effects of Design Parameters on Operating Characteristics of an Electric Assisted Bicycle Using Fuel Cell

1
School of Mechanical Engineering, Hanoi University of Science and Technology, 1 Dai Co Viet Road, Hai Ba Trung District, Hanoi 100000, Vietnam
2
School of Mechanical Engineering, University of Ulsan, 93 Daehak-ro, Nam-gu, Ulsan 44610, Korea
*
Authors to whom correspondence should be addressed.
Sustainability 2020, 12(11), 4684; https://doi.org/10.3390/su12114684
Submission received: 1 April 2020 / Revised: 29 May 2020 / Accepted: 1 June 2020 / Published: 8 June 2020
(This article belongs to the Collection Sustainable Development of Electric Vehicle)

Abstract

:
A simulation study was conducted to examine the effects of design parameters on the operation of an electric power-assisted bicycle using fuel cell. Bicycle dynamic, electric motor and fuel cell models were built to depict operation of the electric bicycle. These models were solved by Matlab-Simulink to obtain the operating characteristics of the electric bicycle, such as power of fuel cell, propulsion force, moving distance and velocity. The simulation results in motion were compared to experimental results to validate the simulation models. The effects of the number of cells and hydrogen fuel pressure on the operation of the electric bicycle were investigated. In addition, the influences of slope grade on the operating characteristics of the electric-assisted bicycle and fuel cell were investigated in two cases: without and with fuel cell control. The simulation results show that the operating performance of the electric bicycle was improved when the number of cells was increased. The increase in hydrogen fuel pressure helped to increase the operating performance of the electric bicycle; however, this contribution was not significant. When fuel cell control was applied, the velocity of the electric assisted bicycle could be maintained at a stable value, in spite of changing slope grade.

1. Introduction

Environmental pollution issues are challenges for the world, caused by exhaust emissions from fossil-fueled vehicles. One of the approaches to avoiding the dependence on fossil fuels, as well as to reducing exhaust emissions from the traditional transportation vehicles, is using electric vehicles (EVs) [1,2,3,4,5,6]. The number of EVs worldwide rapidly increased between 2010 and 2015 [7], and may increase to 10 million in 2040 [8]. Electric bicycles (EBs) are getting more attention among EVs because of their many benefits [9]. In comparison with other EVs, EBs are smaller in size and can move flexibly on various terrains, including flat, rugged and hilly terrains. In addition, EBs can help to restrict traffic jams in crowded cities, because of their small size. The price of EBs is also cheaper when compared with that of other EVs. Furthermore, the maintenance costs of EBs are low when compared with other EVs. In addition, EBs can help riders to improve their health [10,11,12].
There are three main kinds of EBs, including EBs assisted by electric power, EBs using pure electric power, and EBs using a combination of electric power-assisted and pure electric modes [13]. In EBs using the pure electric mode, an electric motor is equipped on the wheels or frame and used as a unique power to drive the EBs. For EBs assisted by electric power, also called power-assisted EBs (PAB), an electric motor is equipped on a wheel or frame to support the rider as they are pedaling [9]. For the third kind, EBs include two operating modes, electric power-assisted and pure electric modes, in which the pure electric mode uses a handlebar throttle to control the driving power of the electric motor, while another mode is similar to the power-assisted EBs.
EBs can use various batteries to provide a current to the electric motor, such as lithium-ion (Li-ion), nickel-cadmium (NiMh), lithium-ion plolymer (Li-po) and nickel-cadmium (NiCd). Besides these batteries, EBs can use other energy sources, such as solar energy and fuel cells [14].
Among the energy sources mentioned above, the fuel cell has received significant attention from researchers, because it can provide high efficiency and help EBs to move long distances. Experimental research on an EB using fuel cell was conducted by Kheirandish et al. [15], in which a fuel cell system with a polymer electrolyte membrane was used as a power source for the EB. Their research results indicated that the system efficiency was obtained with the value of 35.4%. Hwang and his research group [16] developed an EB prototype using a fuel cell system with a proton exchange membrane. Their study results indicated that the fuel cell efficiency could increase to 35%. A generator 300 W for EB using fuel cell was designed by Cardinali et al. [17], in which the fuel cell system efficiency in a range of load from 50% to 100% was higher than 31%. The above studies provide useful information for designing and using fuel cell in EBs; however, model-based studies of EBs using fuel cells were rarely mentioned. To describe the operation of the fuel cell EBs, a combination of dynamic models and fuel cell models is necessary. In addition, to increase fuel cell power, as well as operating performance of the EBs, variations of structural and operating parameters for fuel cell need to be examined.
This paper presents a modeling-based study on the operating characteristics of a power-assisted bicycle (PAB) using a fuel cell. Simulation models, including bicycle dynamic, electric motor and fuel cell models, were built to depict the operation of the PAB. These models were programmed and solved in Matlab-Simulink to obtain operating characteristics of the PAB, such as the power of the fuel cell, propulsion force, moving distance and velocity. To increase fuel cell power and operating performance of the PAB, the influences of the design parameters of the fuel cell, including the number of cells and hydrogen fuel pressure, on the operating characteristics of the PAB were investigated. In addition, to evaluate the effects of terrain condition for the operation of the PAB and fuel cell, effects of slope grade for operating characteristics of PAB and fuel cell were examined in two cases: without and with fuel cell control.

2. Establishment of Models

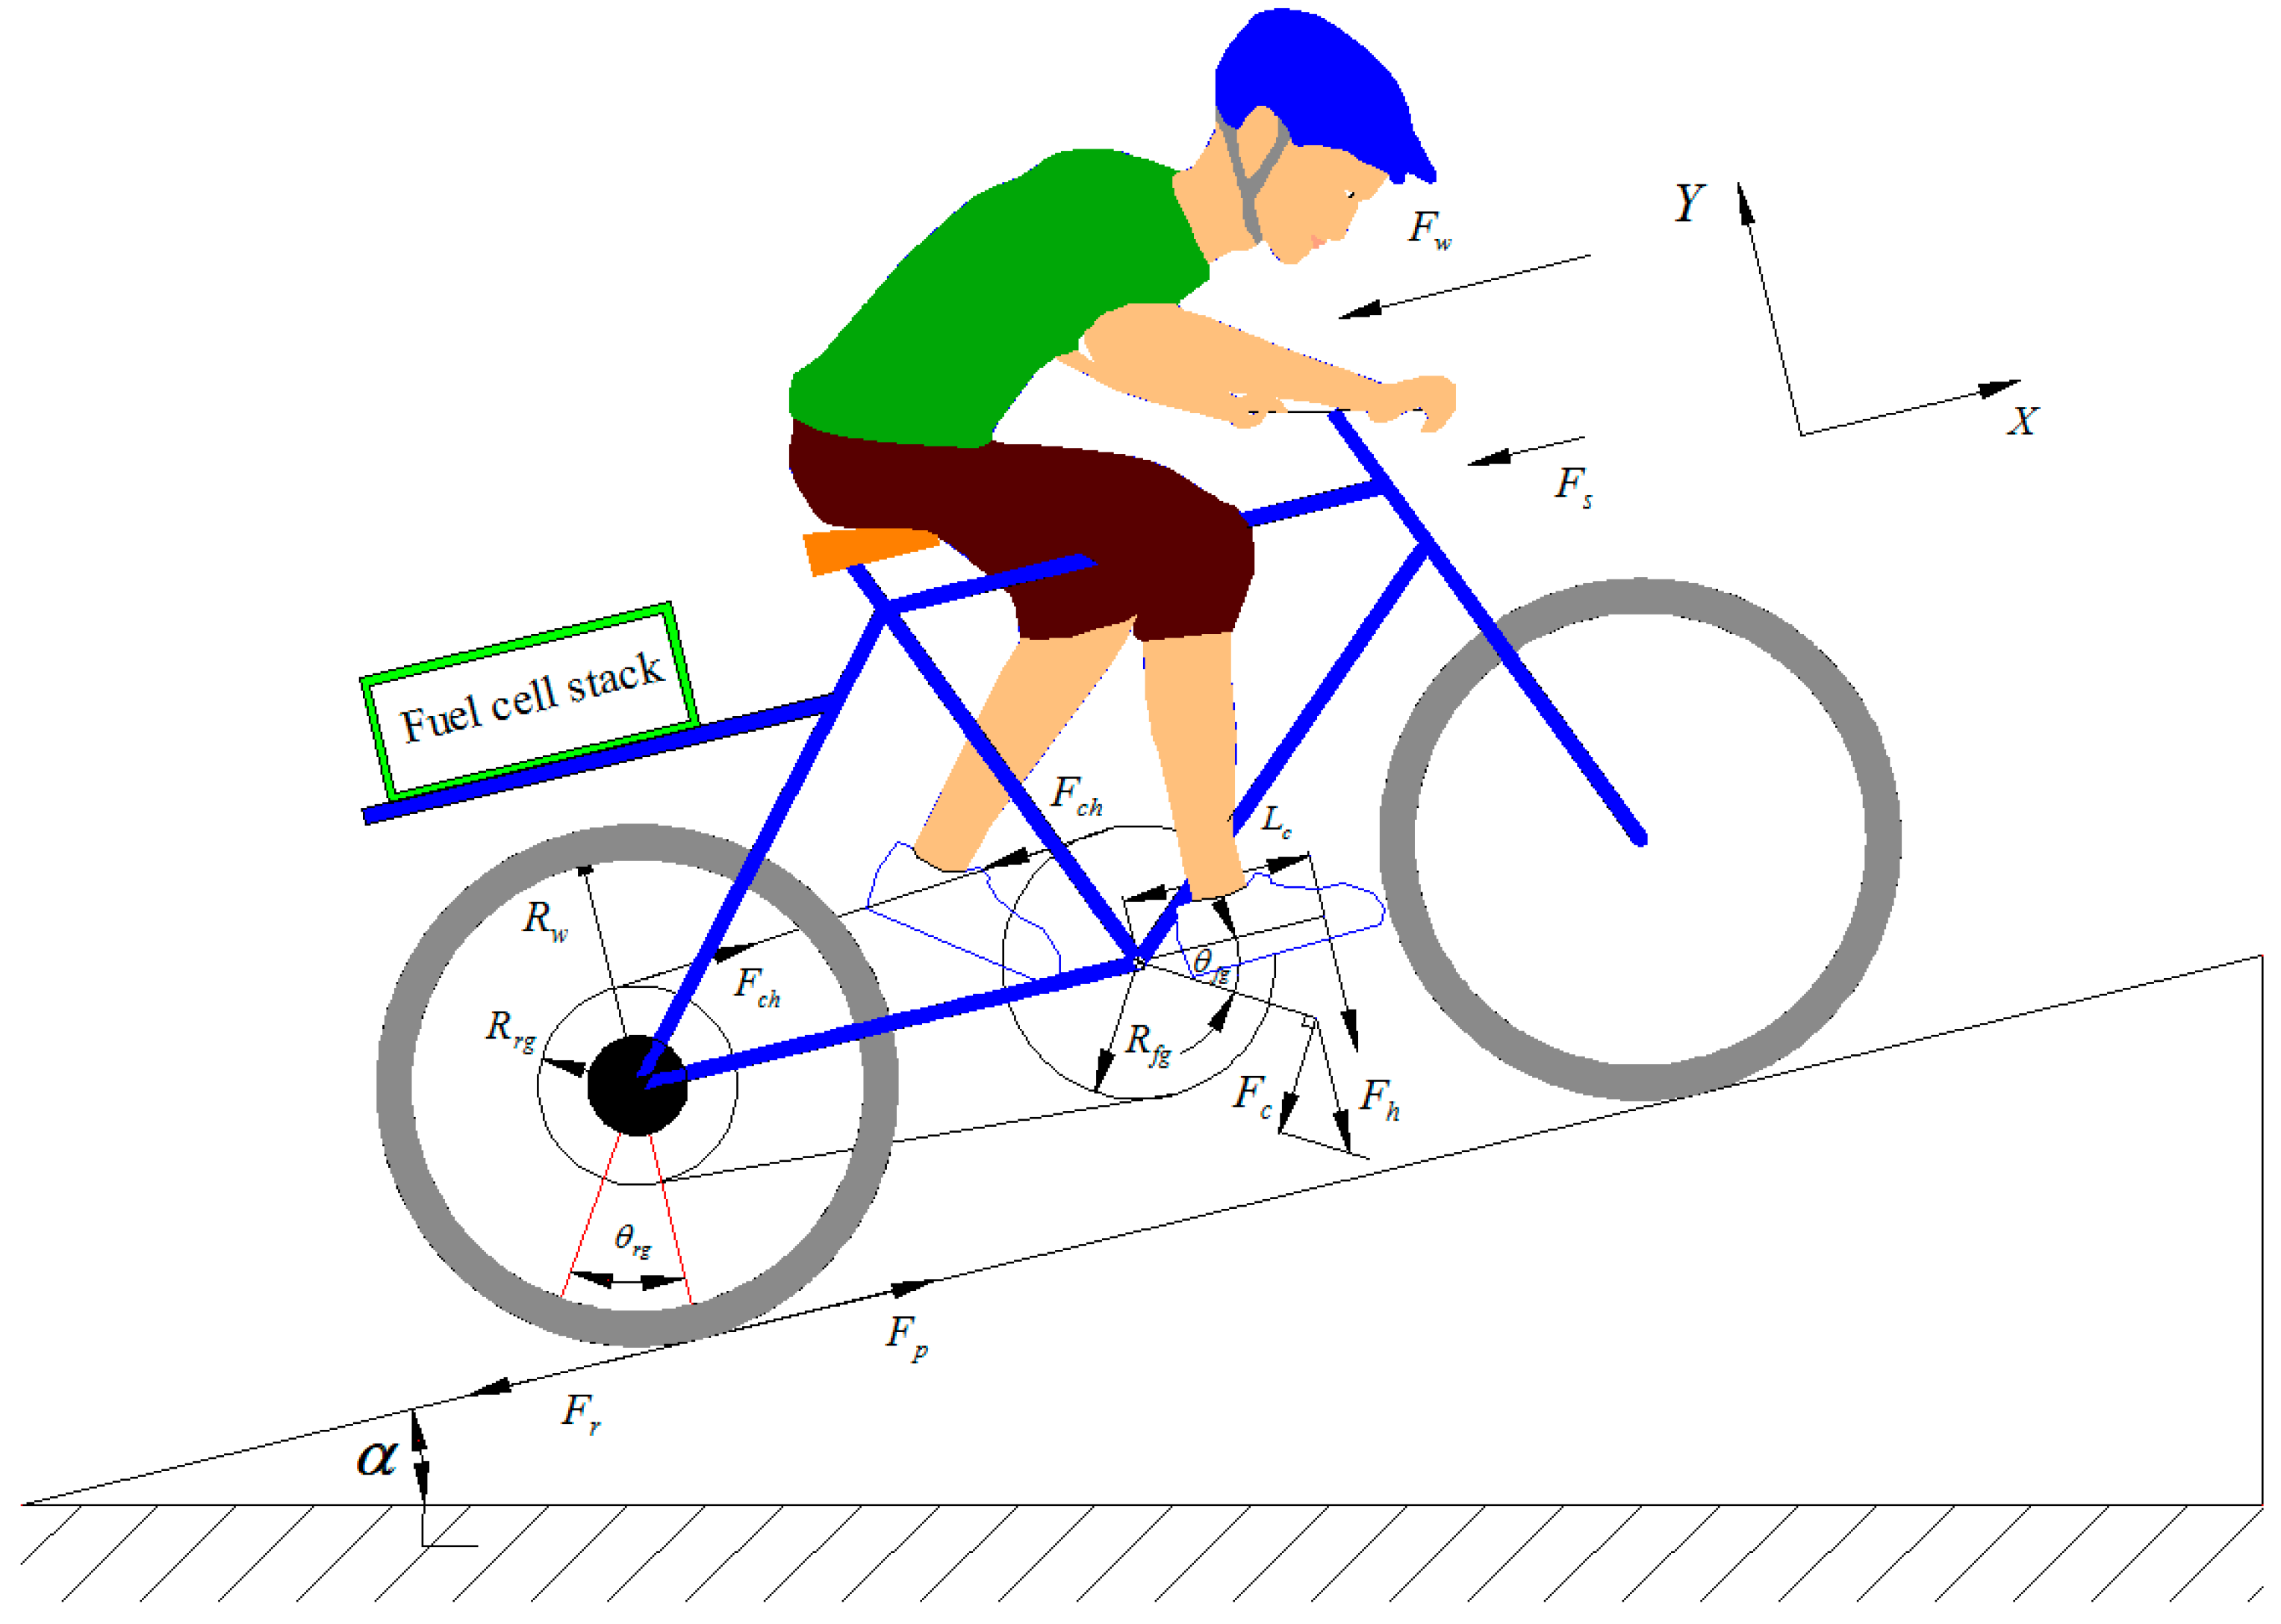
2.1. PAB Dynamic Models

A dynamic model of the PAB is described in Figure 1, in which fuel cell is used as a power source to drive the electric motor, as well as to assist the rider when pedaling. Table 1 shows the specifications of the PAB used in this study.
An equation was established based on Newton’s second law to describe the motion of the PAB, as shown below:
F p F s F w F r = M d 2 x d t 2
where M is the total of Mr (rider mass) and Mb (PAB mass), t is time, x is moving distance of the PAB, Fr is resistance force caused by rolling, Fp is propulsion force, Fw is resistance force caused by wind, and Fs is resistance force caused by slope.
The resistance force caused by slope was described by the following equation:
F s = 9.81 M G
where G denotes slope grade.
The wind resistance force was calculated by:
F w = 1 2 C d D A ( v w + v g ) 2
where D is air density (kg/m3), A is frontal area (m2), Cd is the drag coefficient, vg is ground speed (m/s), and vw is wind speed (m/s).
The resistance force caused by rolling was defined by using the following equation:
F r = 9.81 M C r cos α
where α is slope angle (0), and Cr is the coefficient of rolling resistance.
The propulsion force was defined based on propulsion torque, as shown by the following equation:
F p . R w = T p = T r + T m
where Rw is denoted as radius of rear wheel, Tp is denoted as propulsion torque, which is total of Tm (motor torque), and Tr (rider torque) as pedaling. The rider torque was defined by equation:
T r = F c h R r g
where Fch is force of chain, and Rrg is radius of rear gear. The force of chain was calculated based on the PAB dynamic model described in Figure 1:
F c h = 1 R f g L c F h cos θ f g = 1 γ R r g L c F h cos θ f g
where Lc is crank length, Fh is force caused by rider, Rfg is front gear radius, and γ is transmission ratio of sprocket.
The rider torque was derived by using a combination of Equations (6) and (7), which was obtained by:
T r = R r g R f g L c F h cos θ f g = 1 γ L c F h cos θ f g
In this PAB, a direct current (DC) motor was installed in rear wheel, as described in Figure 1. When the rider pedaled, a torque signal generated by pedaling was transferred to a controller, to control the motor torque and support the rider when pedaling. The motor torque was calculated based on a dynamic model of the DC motor [18]:
L a d i a d t + i a ( t ) R a + K b ω m = U a
J d ω m d t + B 1 ω m + T m = K b i a ( t )
where La is inductance of the armature, ia is current of the armature, Ra is resistance of the armature, Kb is back EMF constant, ωm is motor speed, Ua is terminal voltage of the electric motor, J is inertia torque, B1 is coefficient of viscous friction, and Tm is the torque of the electric motor.
The propulsion force was derived by using a combination of Equations (5), (8)–(10), which was obtained by:
F p = T r + T m R w = 1 γ R w L c F h cos θ f g + 1 R w [ K b R a U a K b L a R a d i a d t J d ω m d t ( B 1 + K b 2 R a ) ω m ]

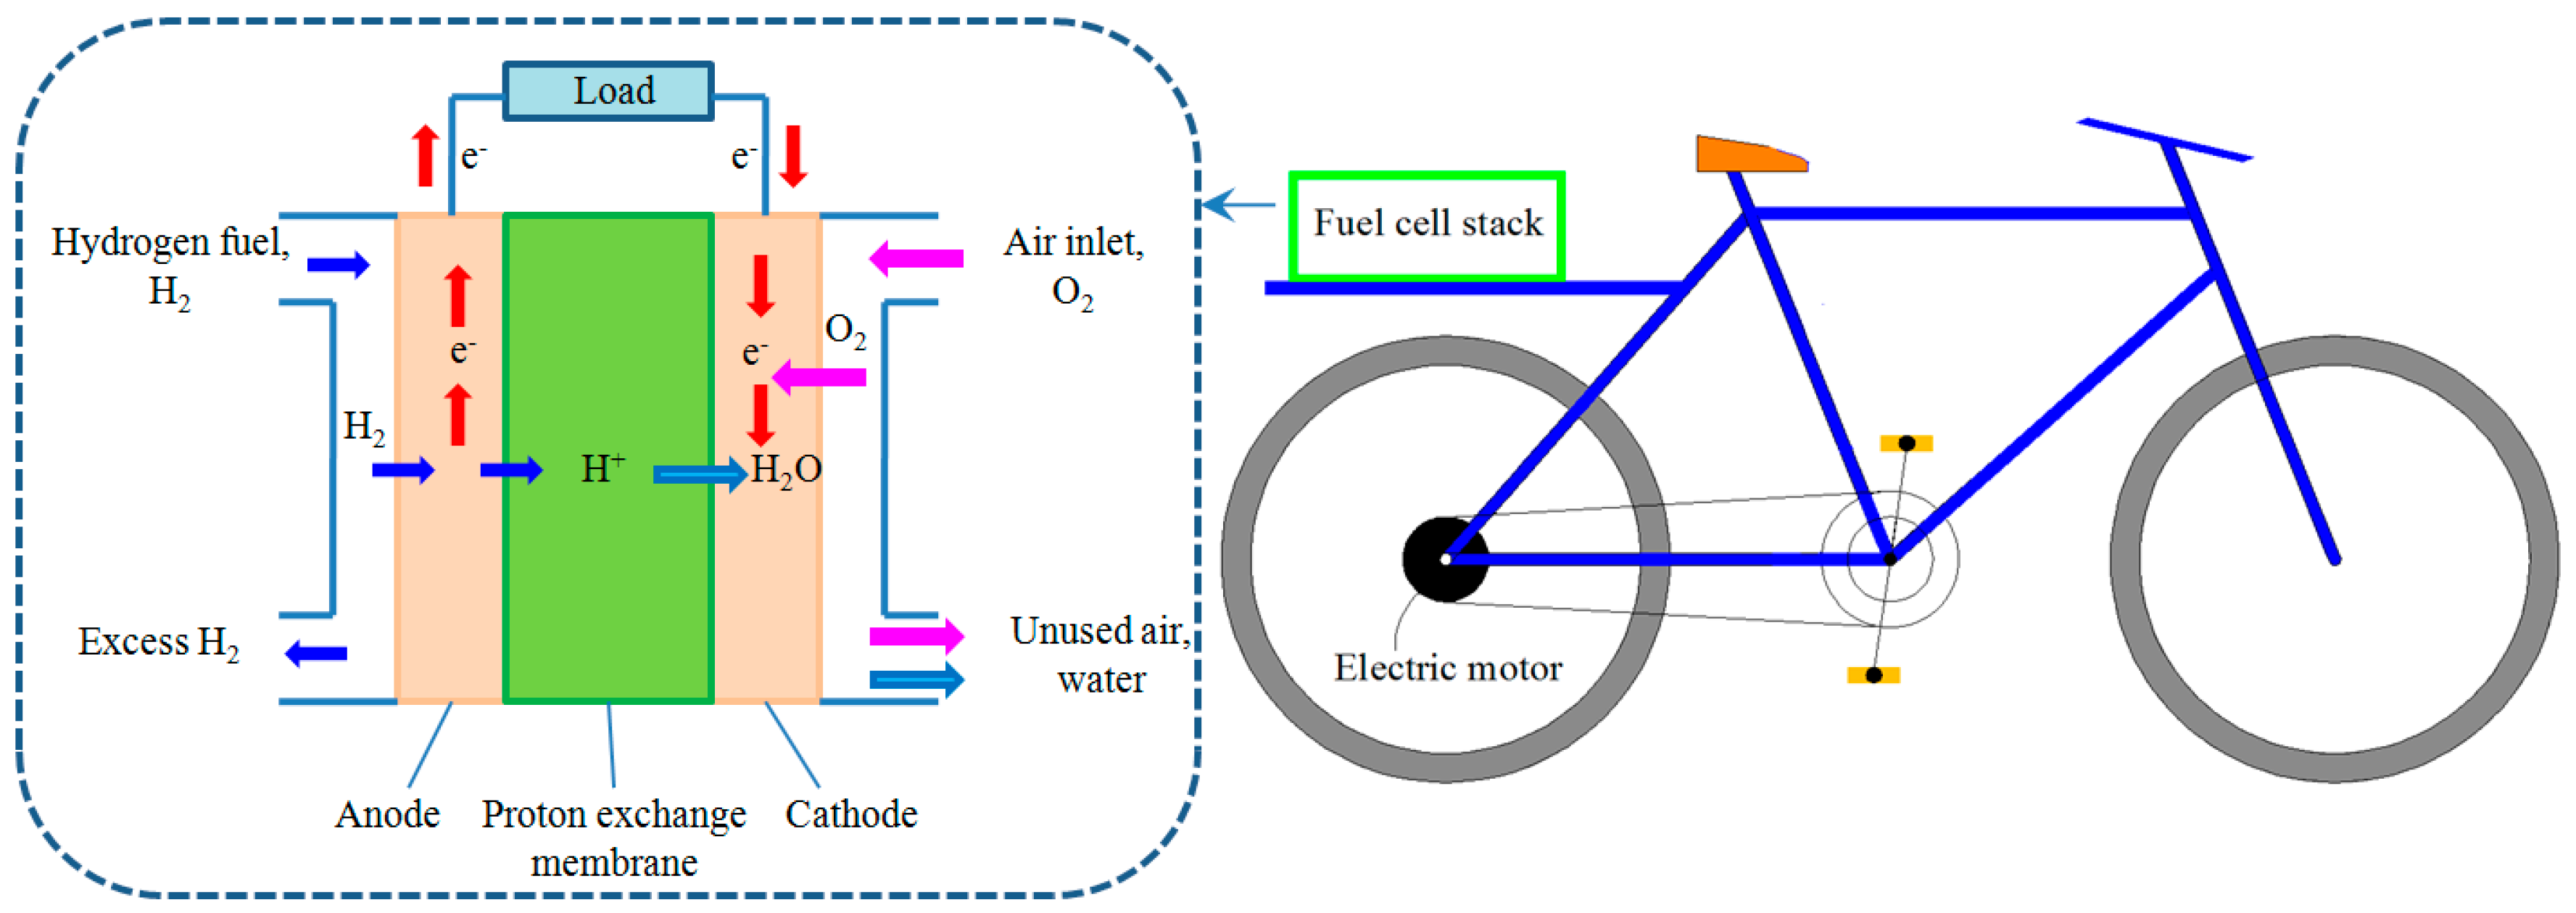
2.2. Mathematical Models of Fuel Cell

The operating principle of fuel cell is described in Figure 2, in which hydrogen molecules are disarticulated into electrons (e-) and protons (H+) at anode following the reaction:
H2 → 2H+ + 2e
Electrons move along the load circuit to cathode after released from hydrogen. Therefore, an output current is generated, which can be used to drive the electric motor. The simulation parameters of the fuel cell are described in Table 2.
Protons go through proton exchange membrane (PEM) after disarticulated from hydrogen. Then, they are combined with electrons coming from anode and oxygen coming from air inlet to create water at the cathode. This is described by the following reaction:
1/2O2 + 2H+ + 2e- → H2O
Hydrogen excess can be returned to a storage tank, while the unused air and water are pushed through the exhaust port. The output voltage of fuel cell stack was calculated using the following equation:
V s = k ( E n e r n s t V o l t a g e L o s s e s )
where Vs is the output voltage of fuel cell stack, k is the number of cells in the stack, and Enernst is the voltage obtained in open circuit thermodynamic balance, which was described by the equation:
E n e r n s t = E o + R T 2 F ( ln P H 2 P O 2 1 / 2 P H 2 O )
where E0 is standard potential, R is universal gas constant, T is temperature, F is Faraday’s constant, and P is gas pressure.
Voltage losses include activation loss (Va), ohmic loss (Vo) and concentration voltage loss (Vc). The activation loss was shown by the Tafel equation:
V a = R T α n F ln i i o
where i is the current density, α is charge transfer coefficient, and io is reaction exchange current density.
Ohmic loss was given by the following equation:
V o = i R o = i ( R i + R e )
where Ri is ionic resistance of electrolyte, and Re is total resistance of conductive components.
Concentration voltage loss is caused by the changed concentration of the reactants on the surface of electrodes, which was described by the following equation:
V c = γ ln ( i l i l i )
where il is limiting current density, and γ is the constant.
Finally, the output voltage of fuel cell stack was given by:
V s = k ( E n e r n s t V a V o V c )
The hydrogen flow and oxygen flow consumed in the stack to generate current were calculated using the following equations [19]:
W H 2 = M H 2 I s t 2 F
W 0 2 = M O 2 I s t 4 F
where MH2 and MO2 are mole masses of hydrogen and oxygen, Ist is the stack current, and F is the Faraday constant.

3. Simulation Results

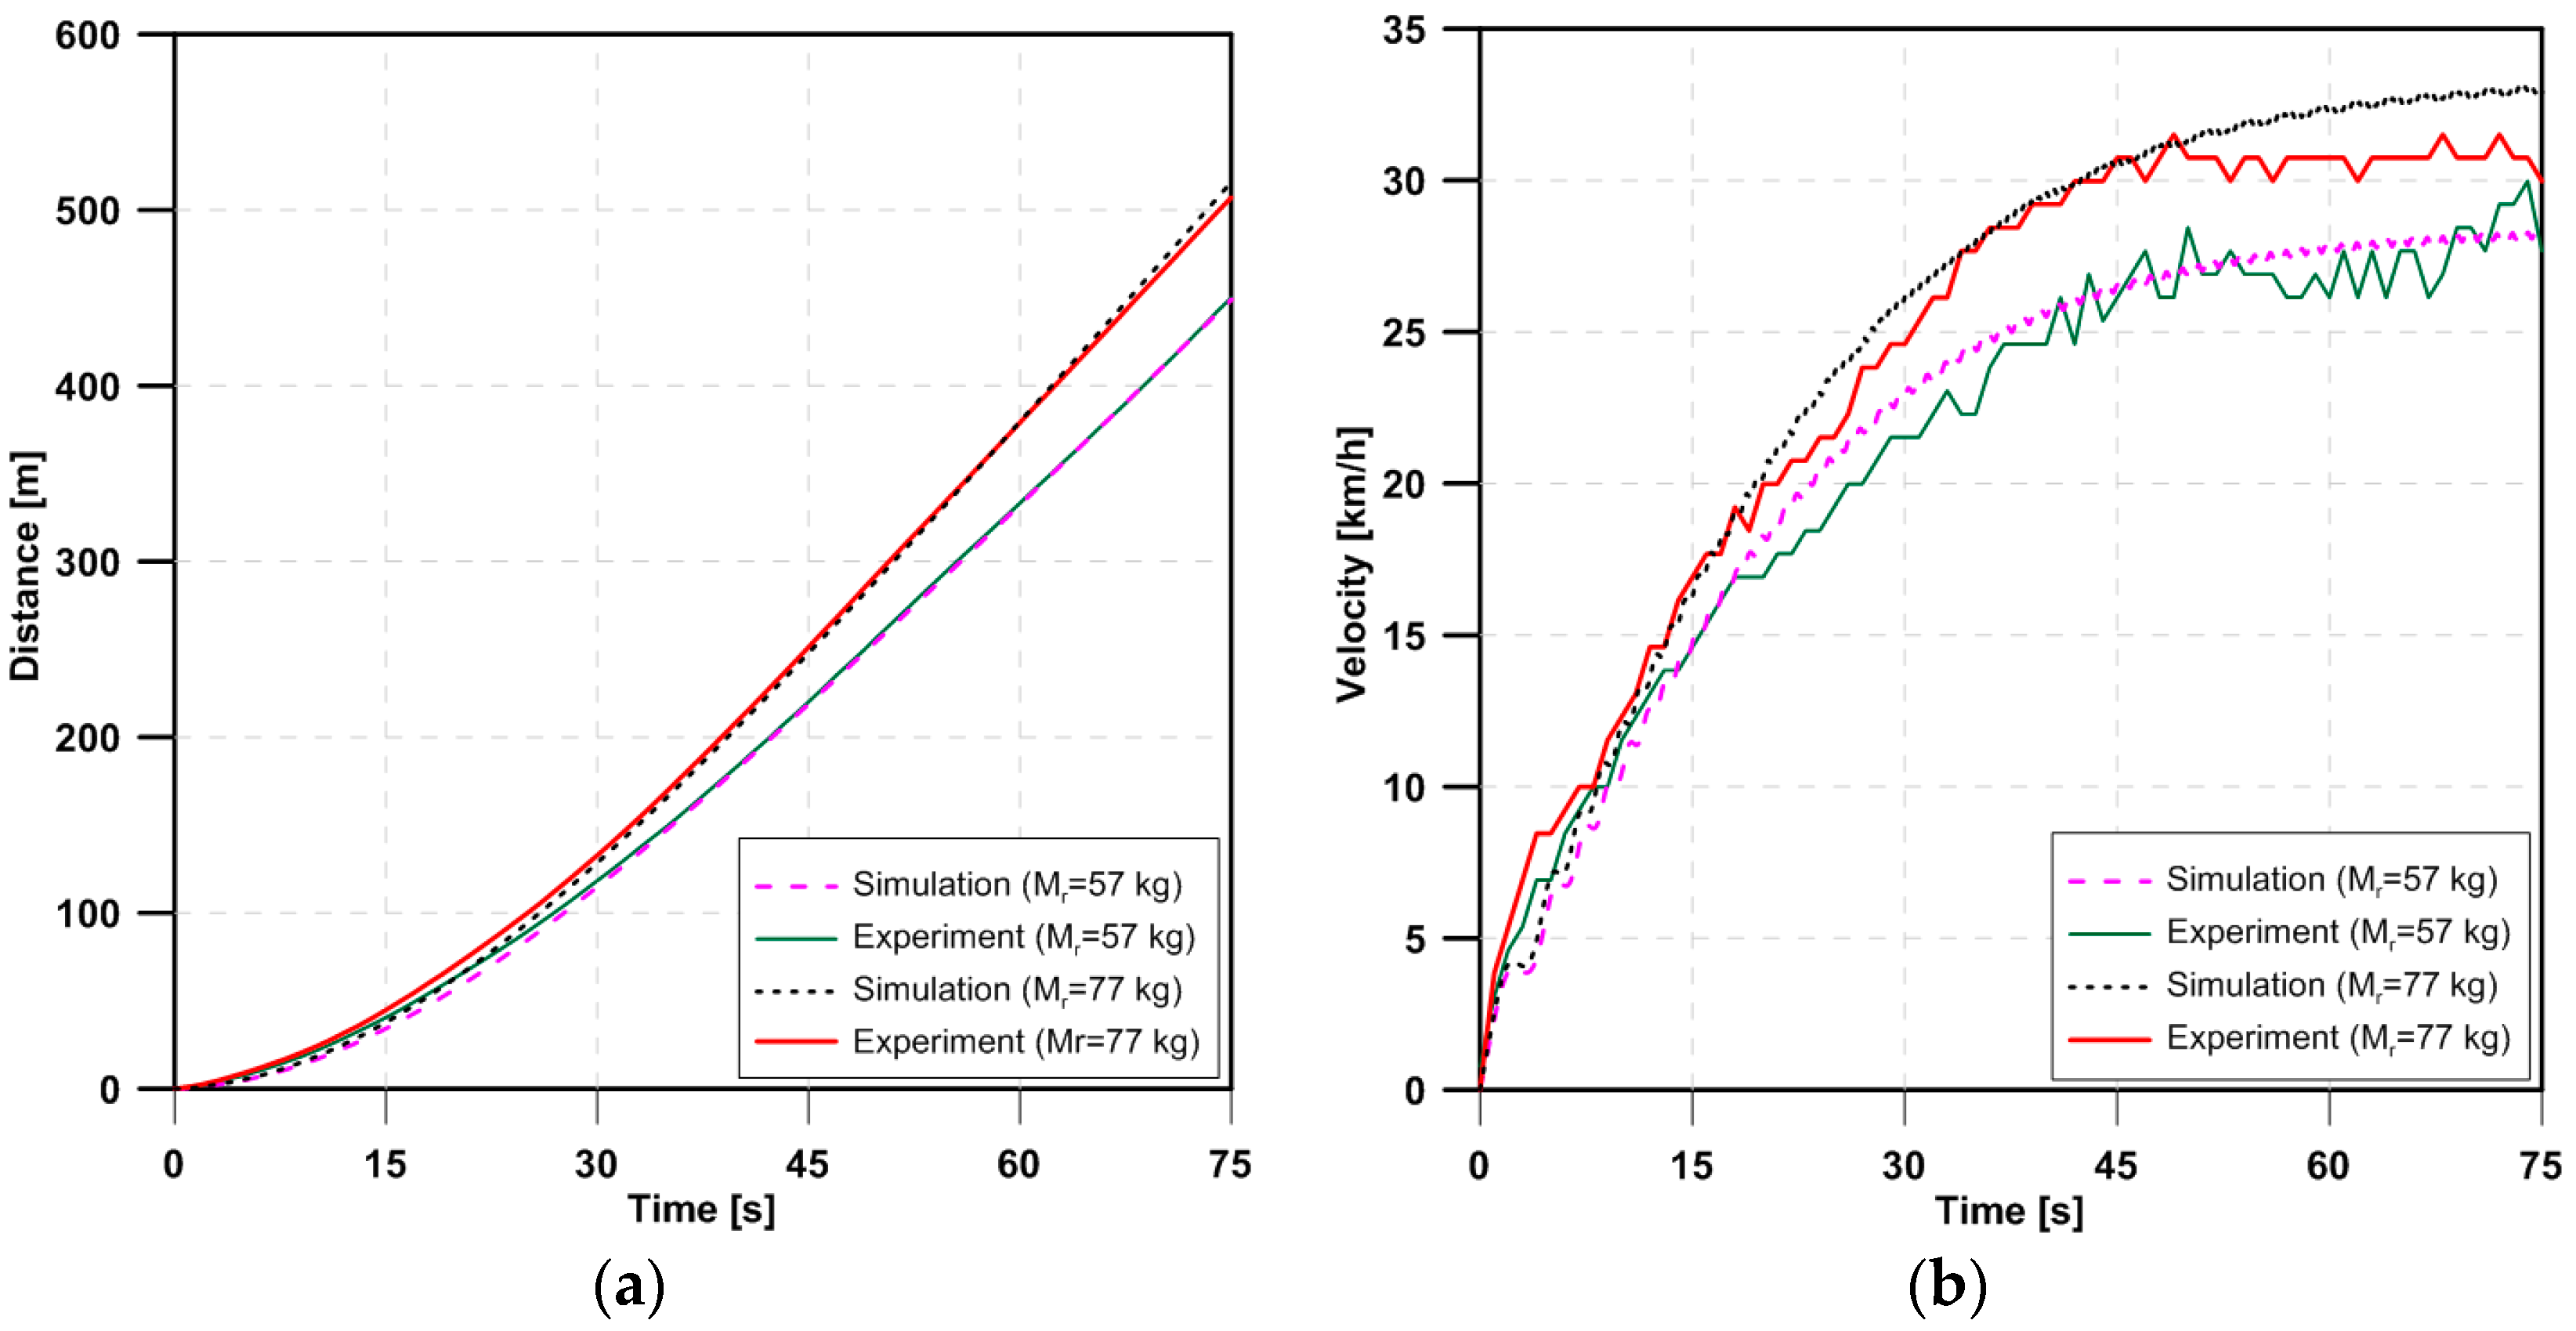
3.1. Comparison between Simulation and Experiment

In order to validate PAB dynamic model, simulation results were compared with experimental results in the same PAB specifications and human power only. Figure 3 shows comparison results of motion characteristics of the PAB based on changing rider mass.
The simulation results show that by increasing rider mass, the moving distance and velocity of the PAB increased, in which the maximum distance and velocity were increased by 12.9% and 14.1%, respectively. The experimental results also show the similar trends, when compared with the simulation results of motion characteristics of the PAB.

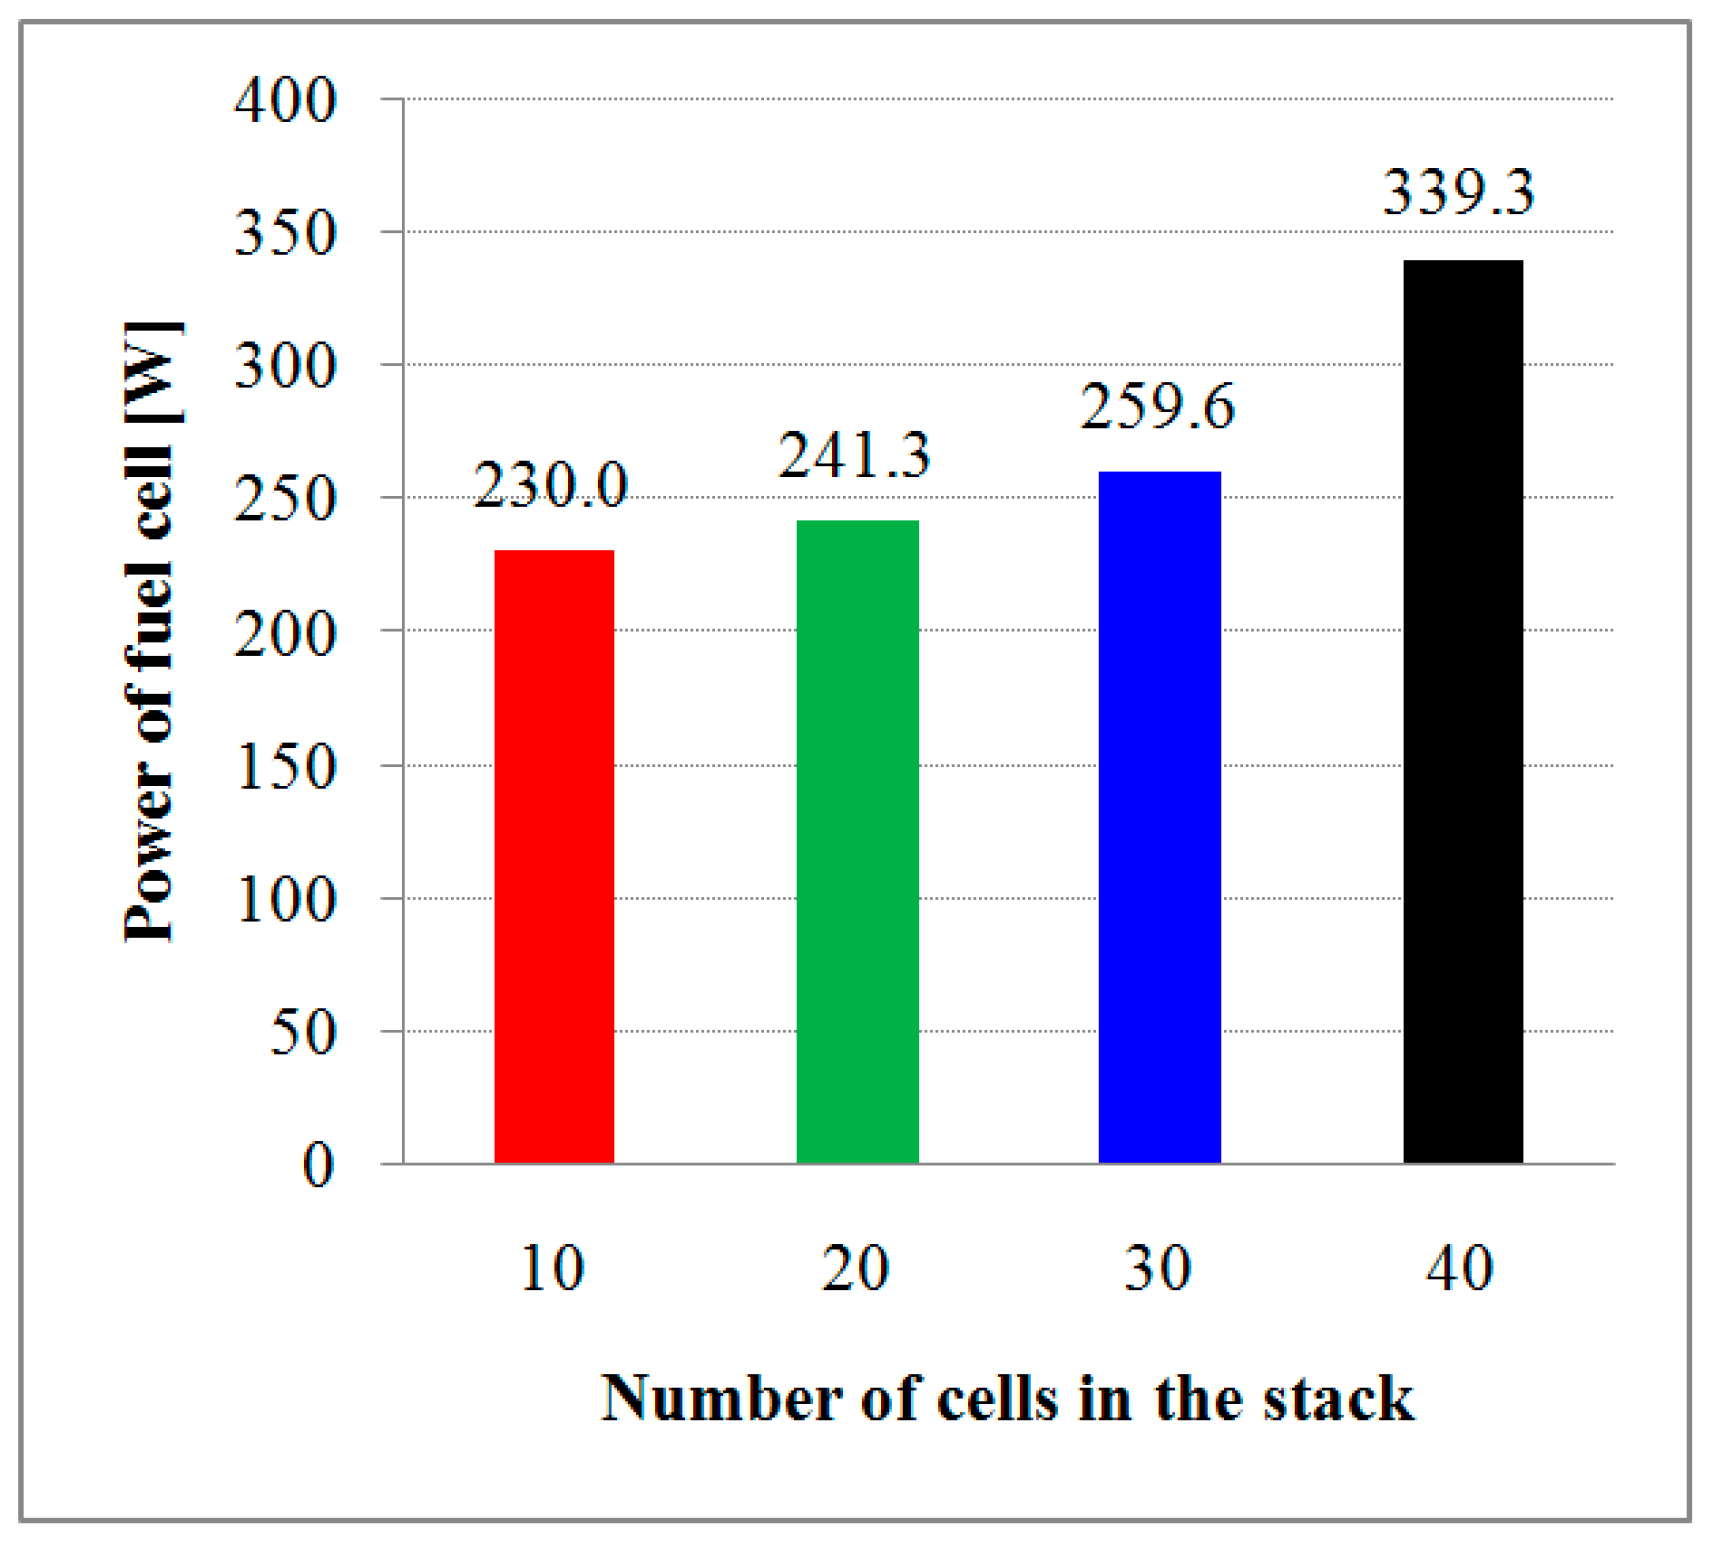
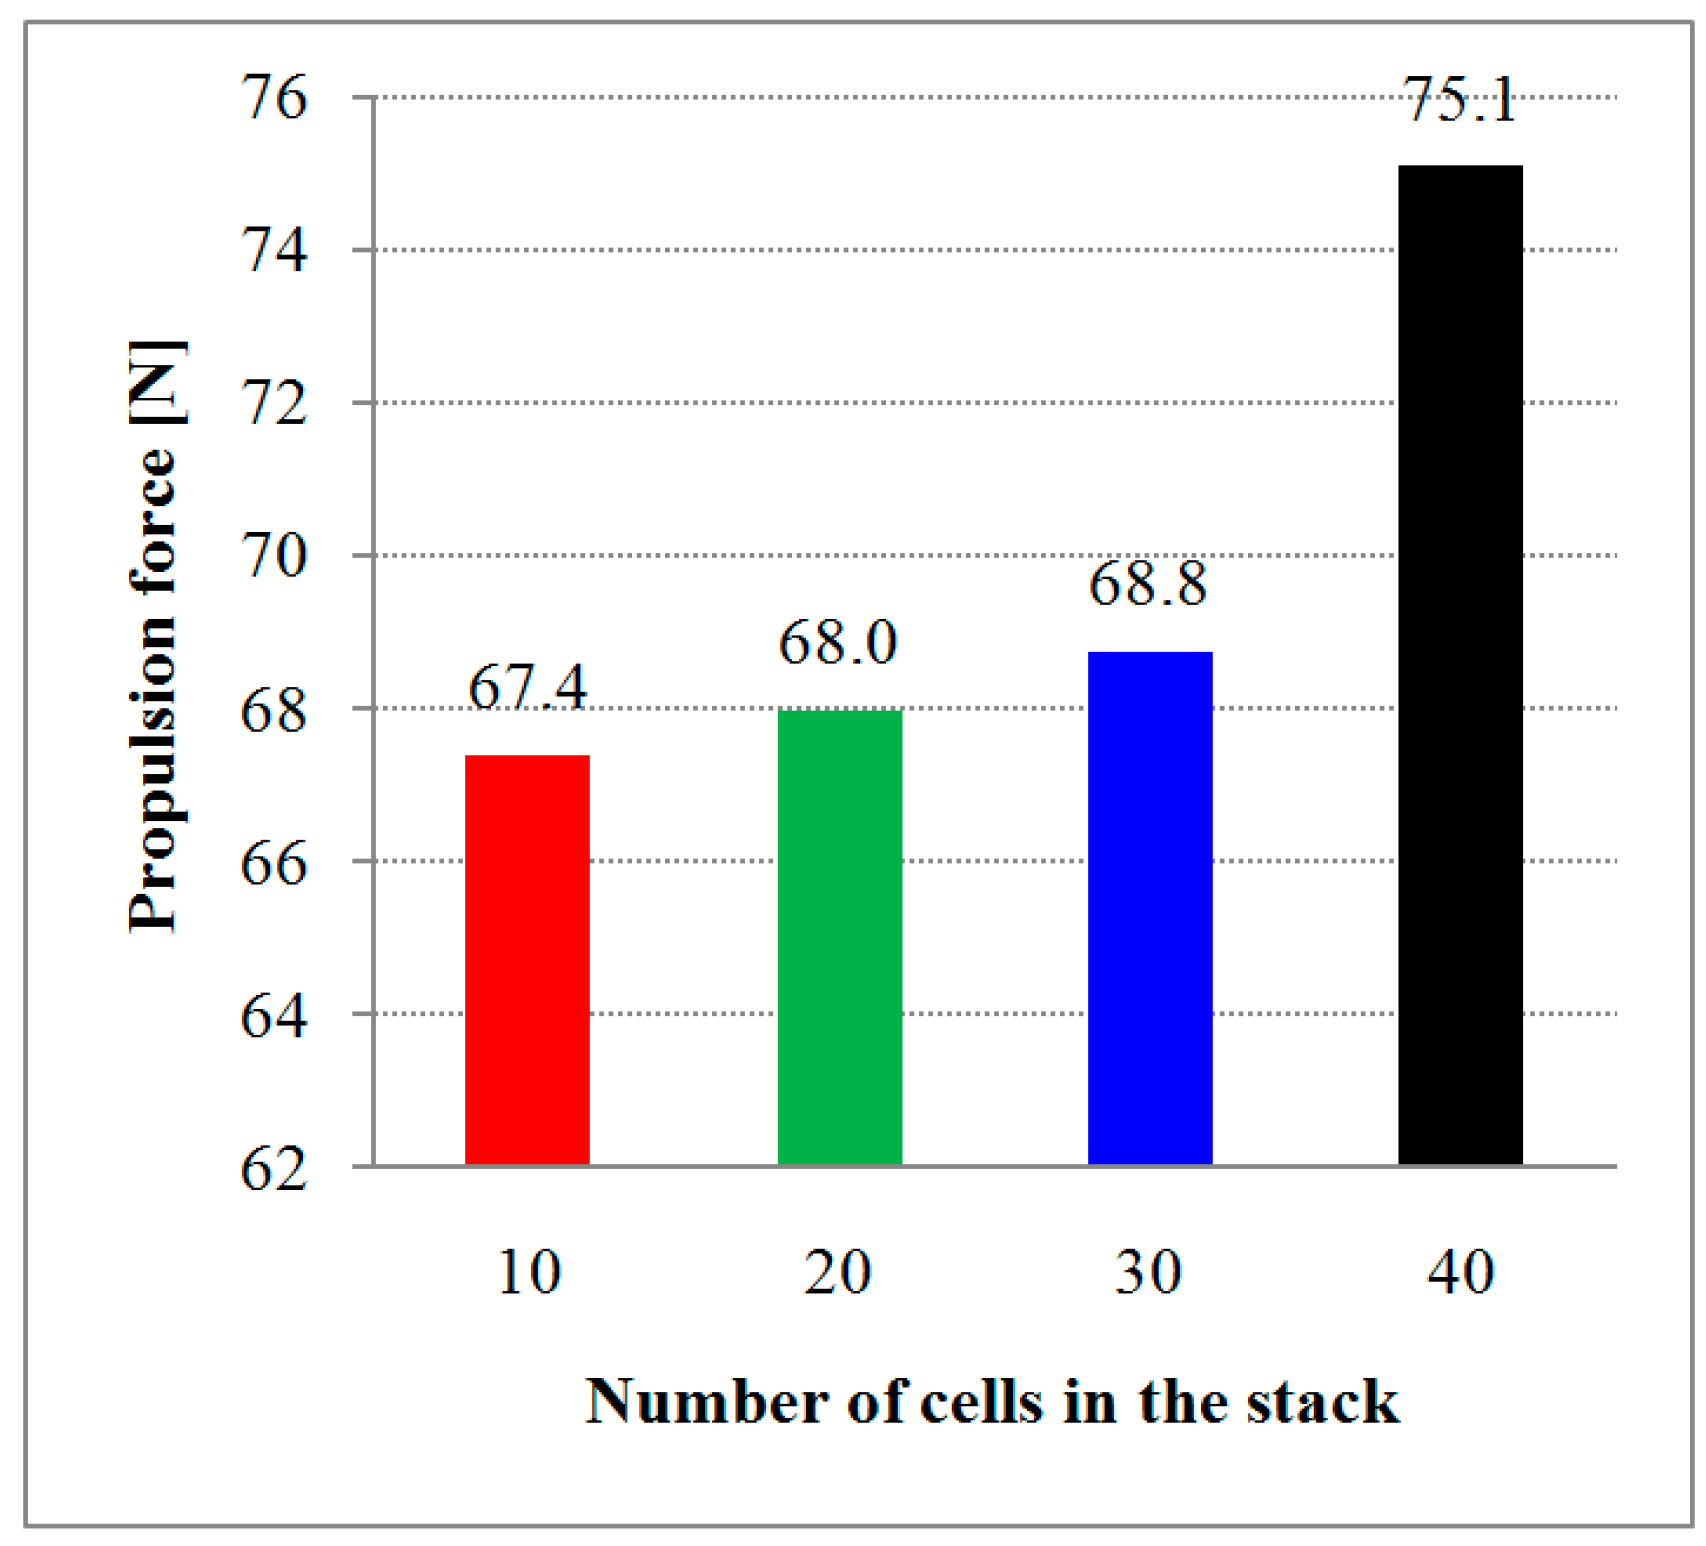
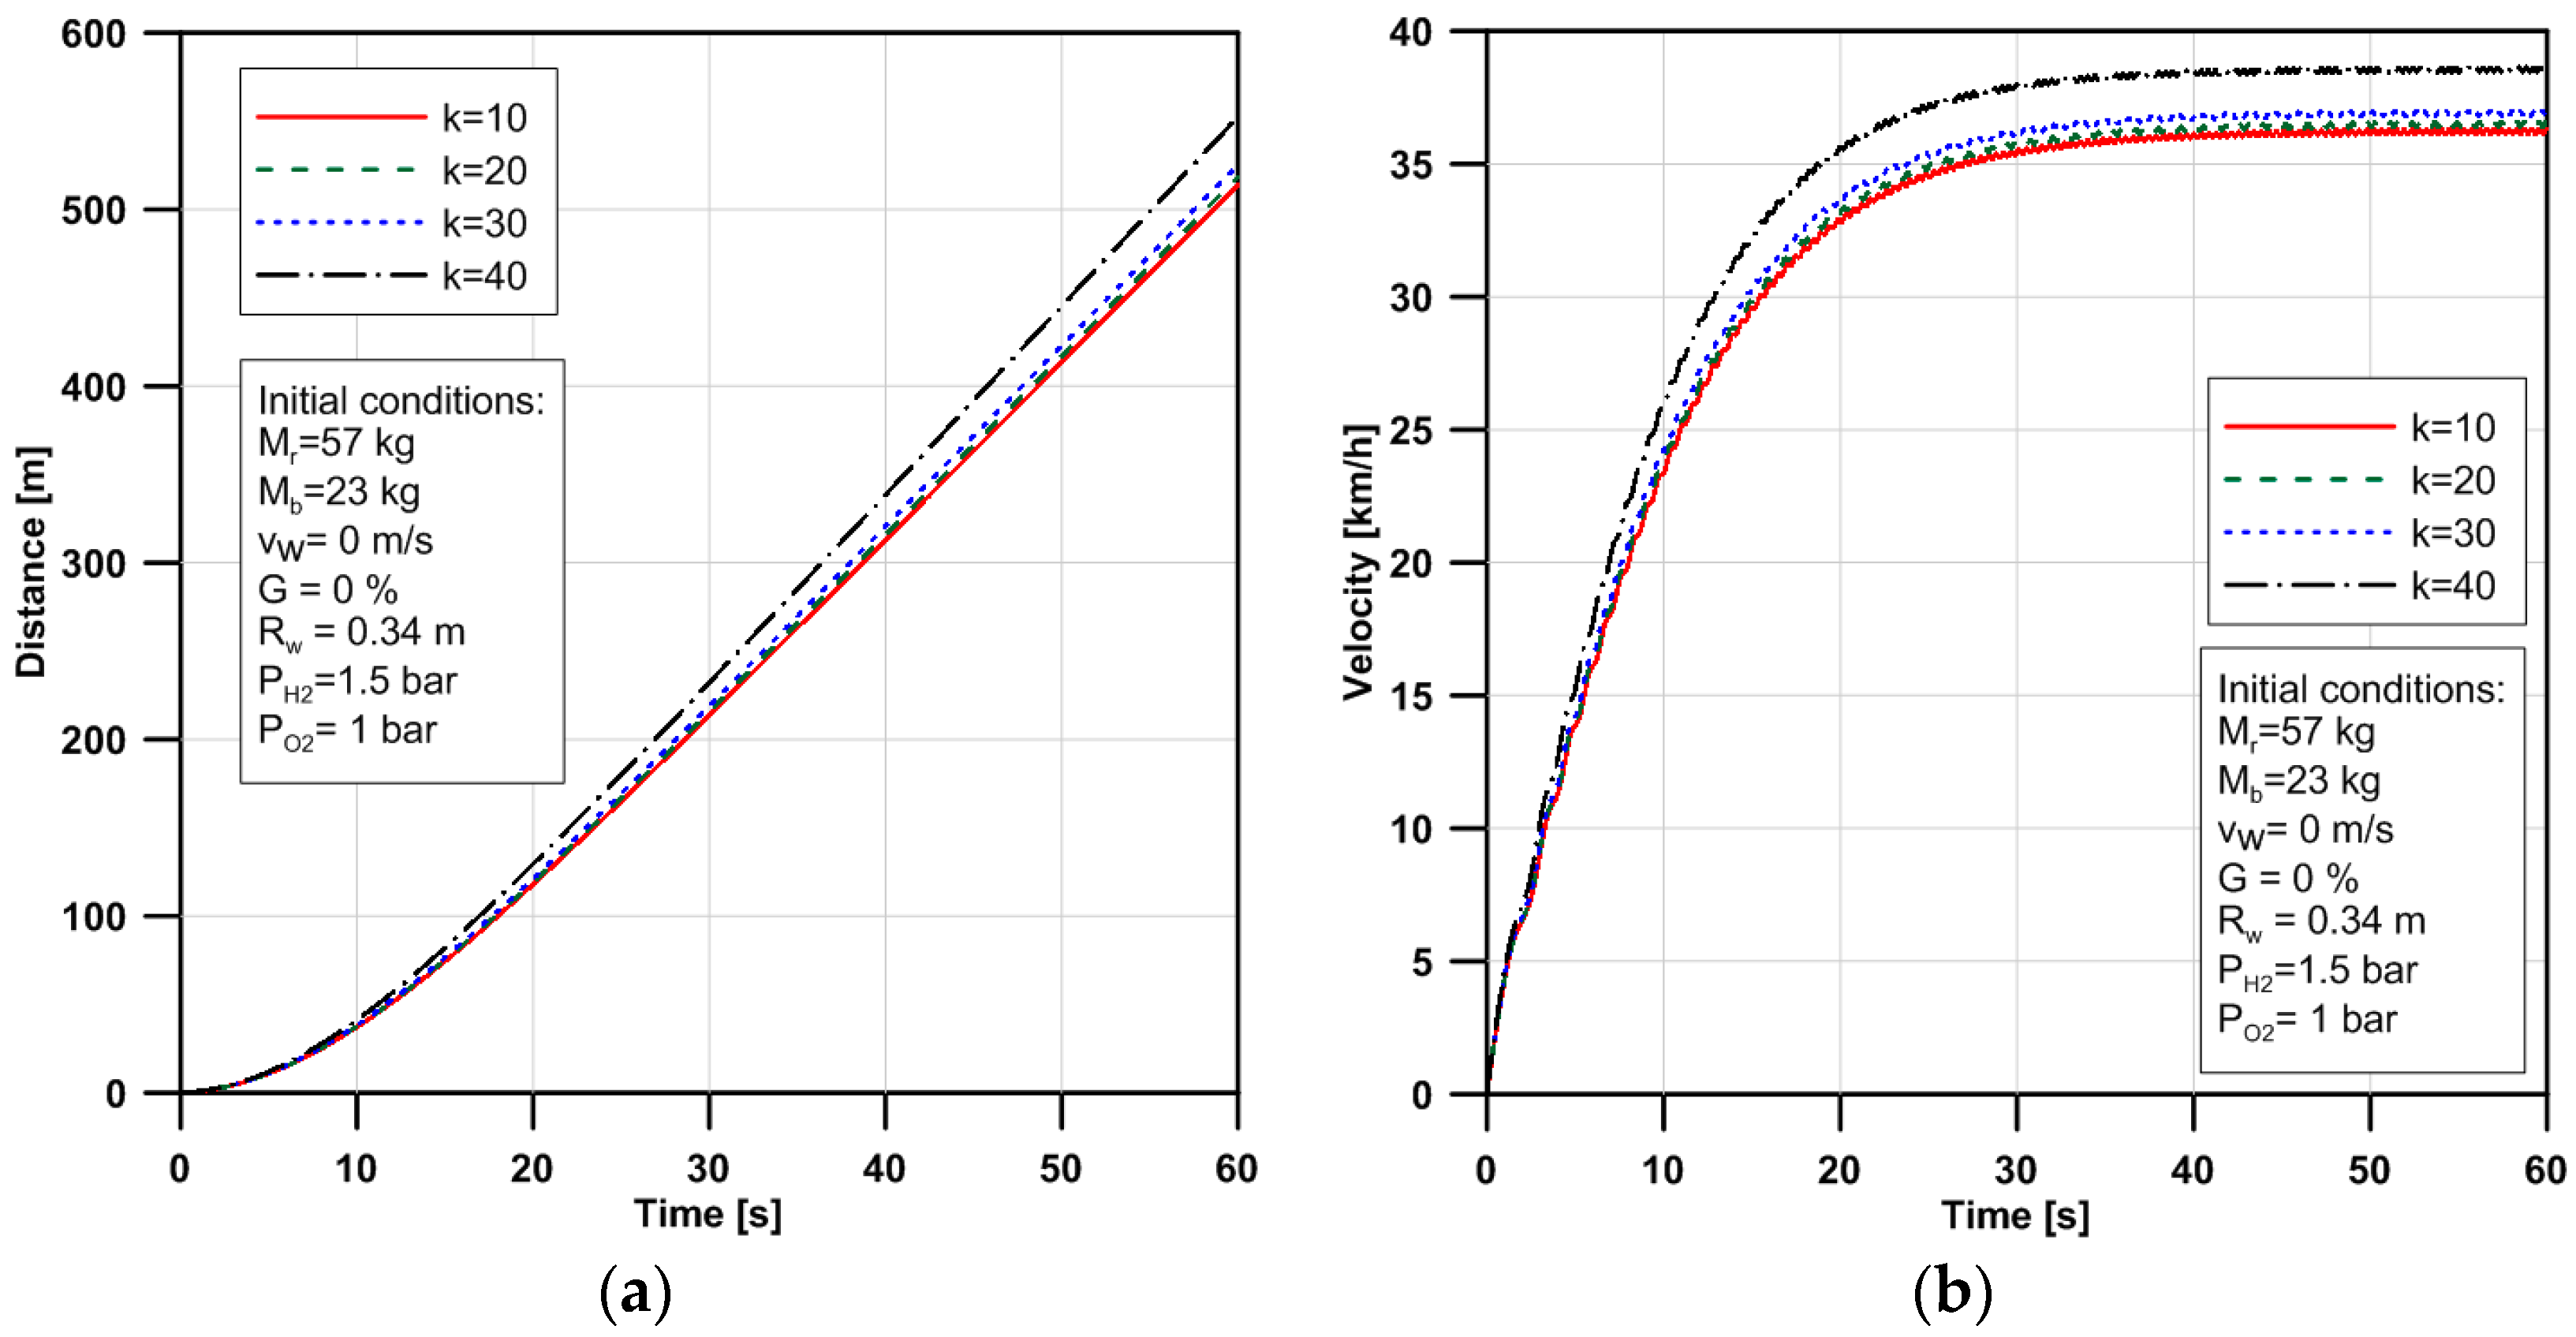
3.2. Effects of Number of Cells in the Stack

Number of cells in the fuel cell stack is denoted by k, which is described in Equation (14). The effects of number of cells on the power of fuel cell are shown in Figure 4, in which k is varied at 10, 20, 30 and 40, while the other initial conditions are kept constant, as shown in Table 2. The simulation results show that the power of fuel cell is increased when the number of cells is changed from 10 to 40. It can be seen that when the number of cells increases from 10 to 30, the power of fuel cell increased with an increment of 11.4%. In particular, when the number of cells is changed from 30 to 40, the power of fuel cell is significantly increased from 259.6 W to 339.3 W, respectively.
The increase in power of fuel cell results in the increase in the propulsion force of the PAB with a similar trend, as shown in Figure 5. When the number of cells is changed from 10 to 40, the propulsion force is significantly increased from 67.4 to 75.1 N, respectively. The increase in propulsion force contributes to improving the motion characteristics of the PAB, as described in Figure 6.
Figure 6 shows the effects of number of cells on the distance of movement and velocity of the PAB. The simulation results show that when the number of cells increases from 10 to 30, the maximum velocity and moving distance of the PAB is slightly increased due to the small increase in propulsion force described in Figure 5. However, when the number of cells is increased to 40, the moving distance and velocity of the PAB is considerably improved with the increments of 6.9% and 6.0%, respectively, as shown in Figure 6.

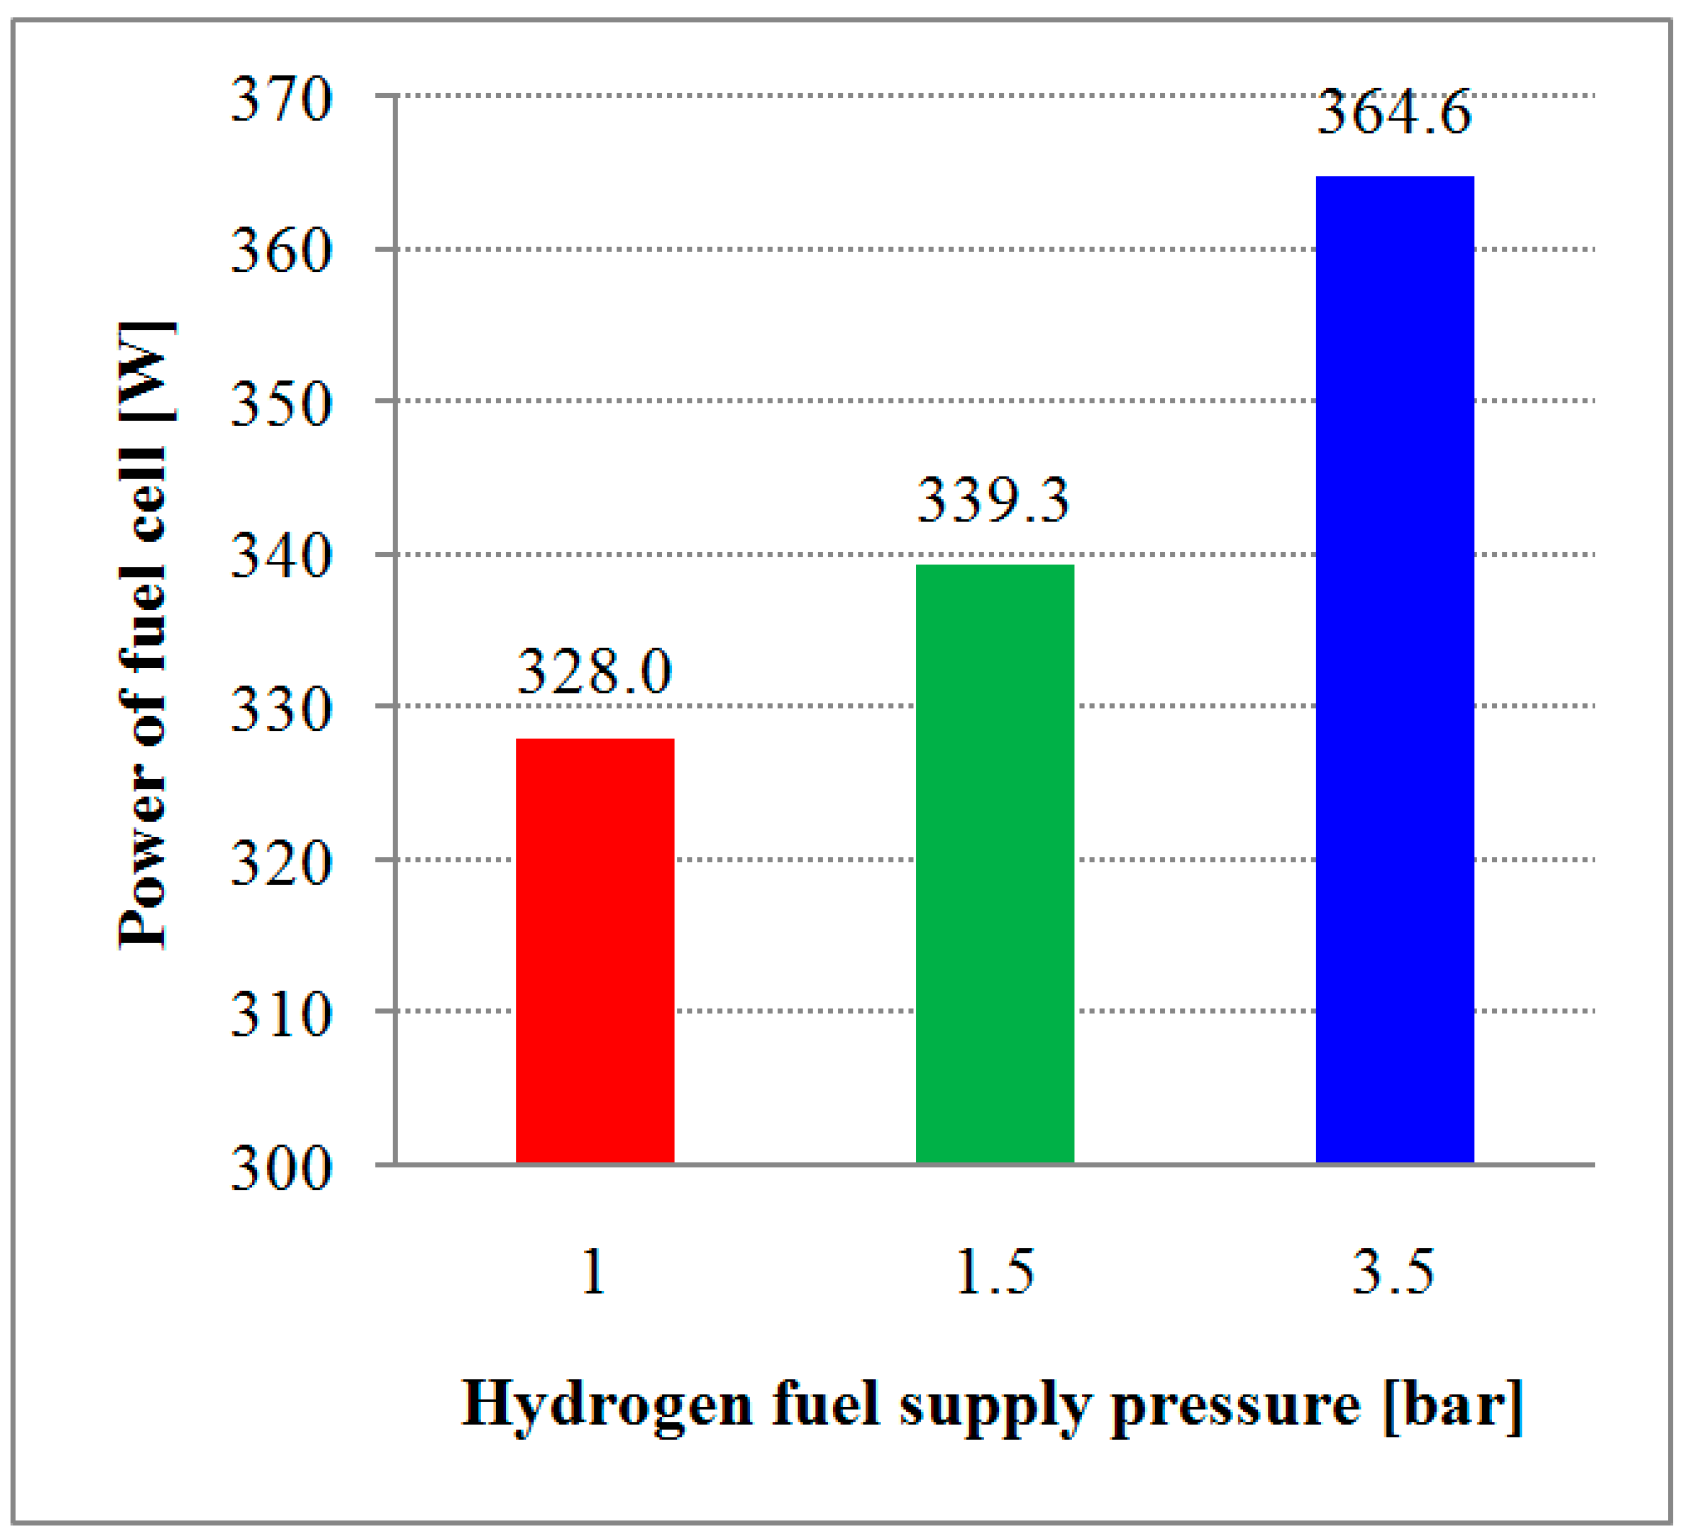
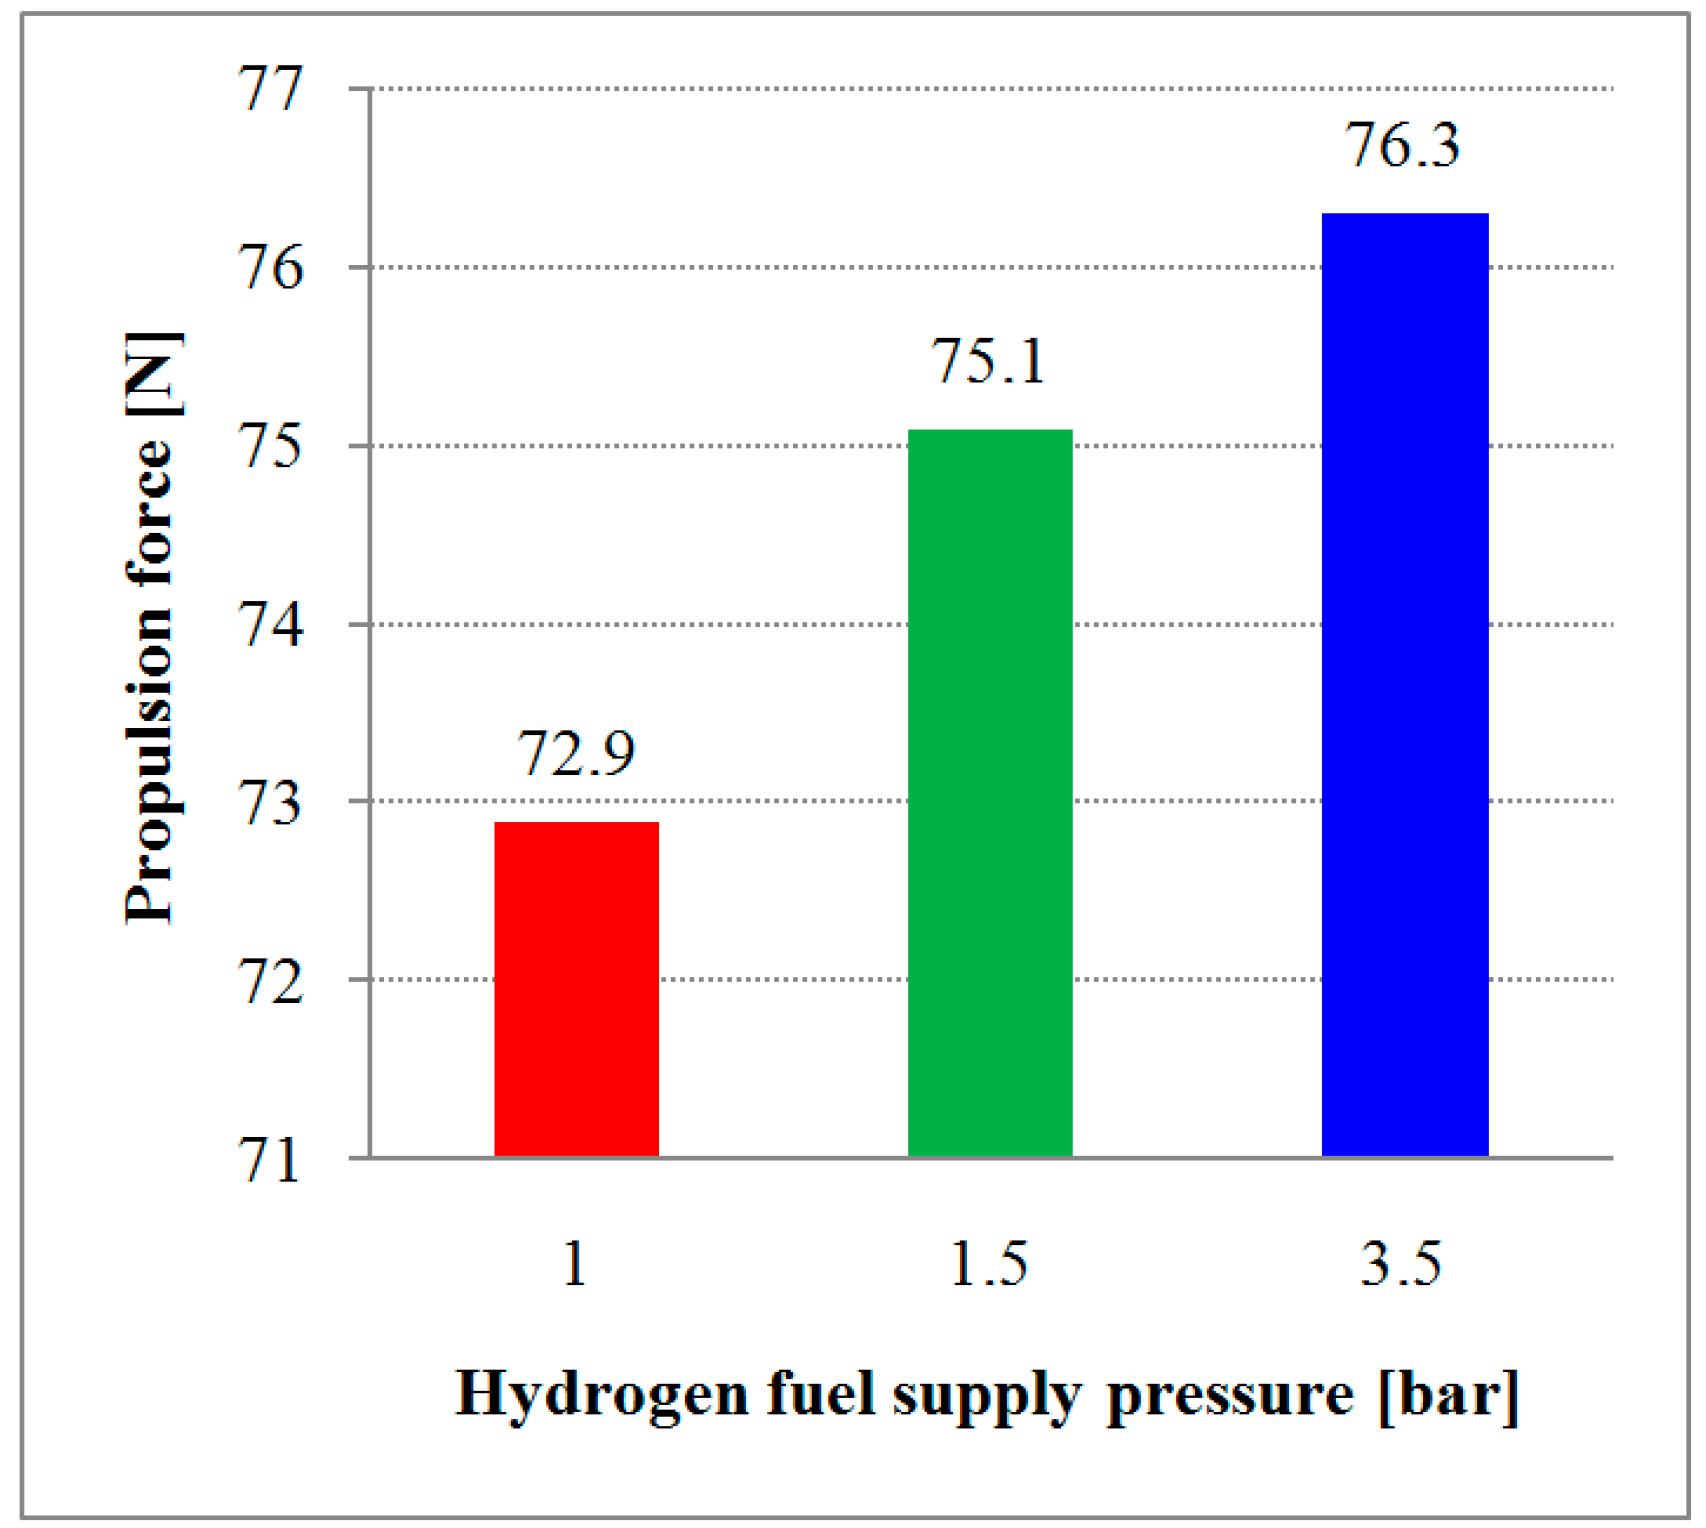
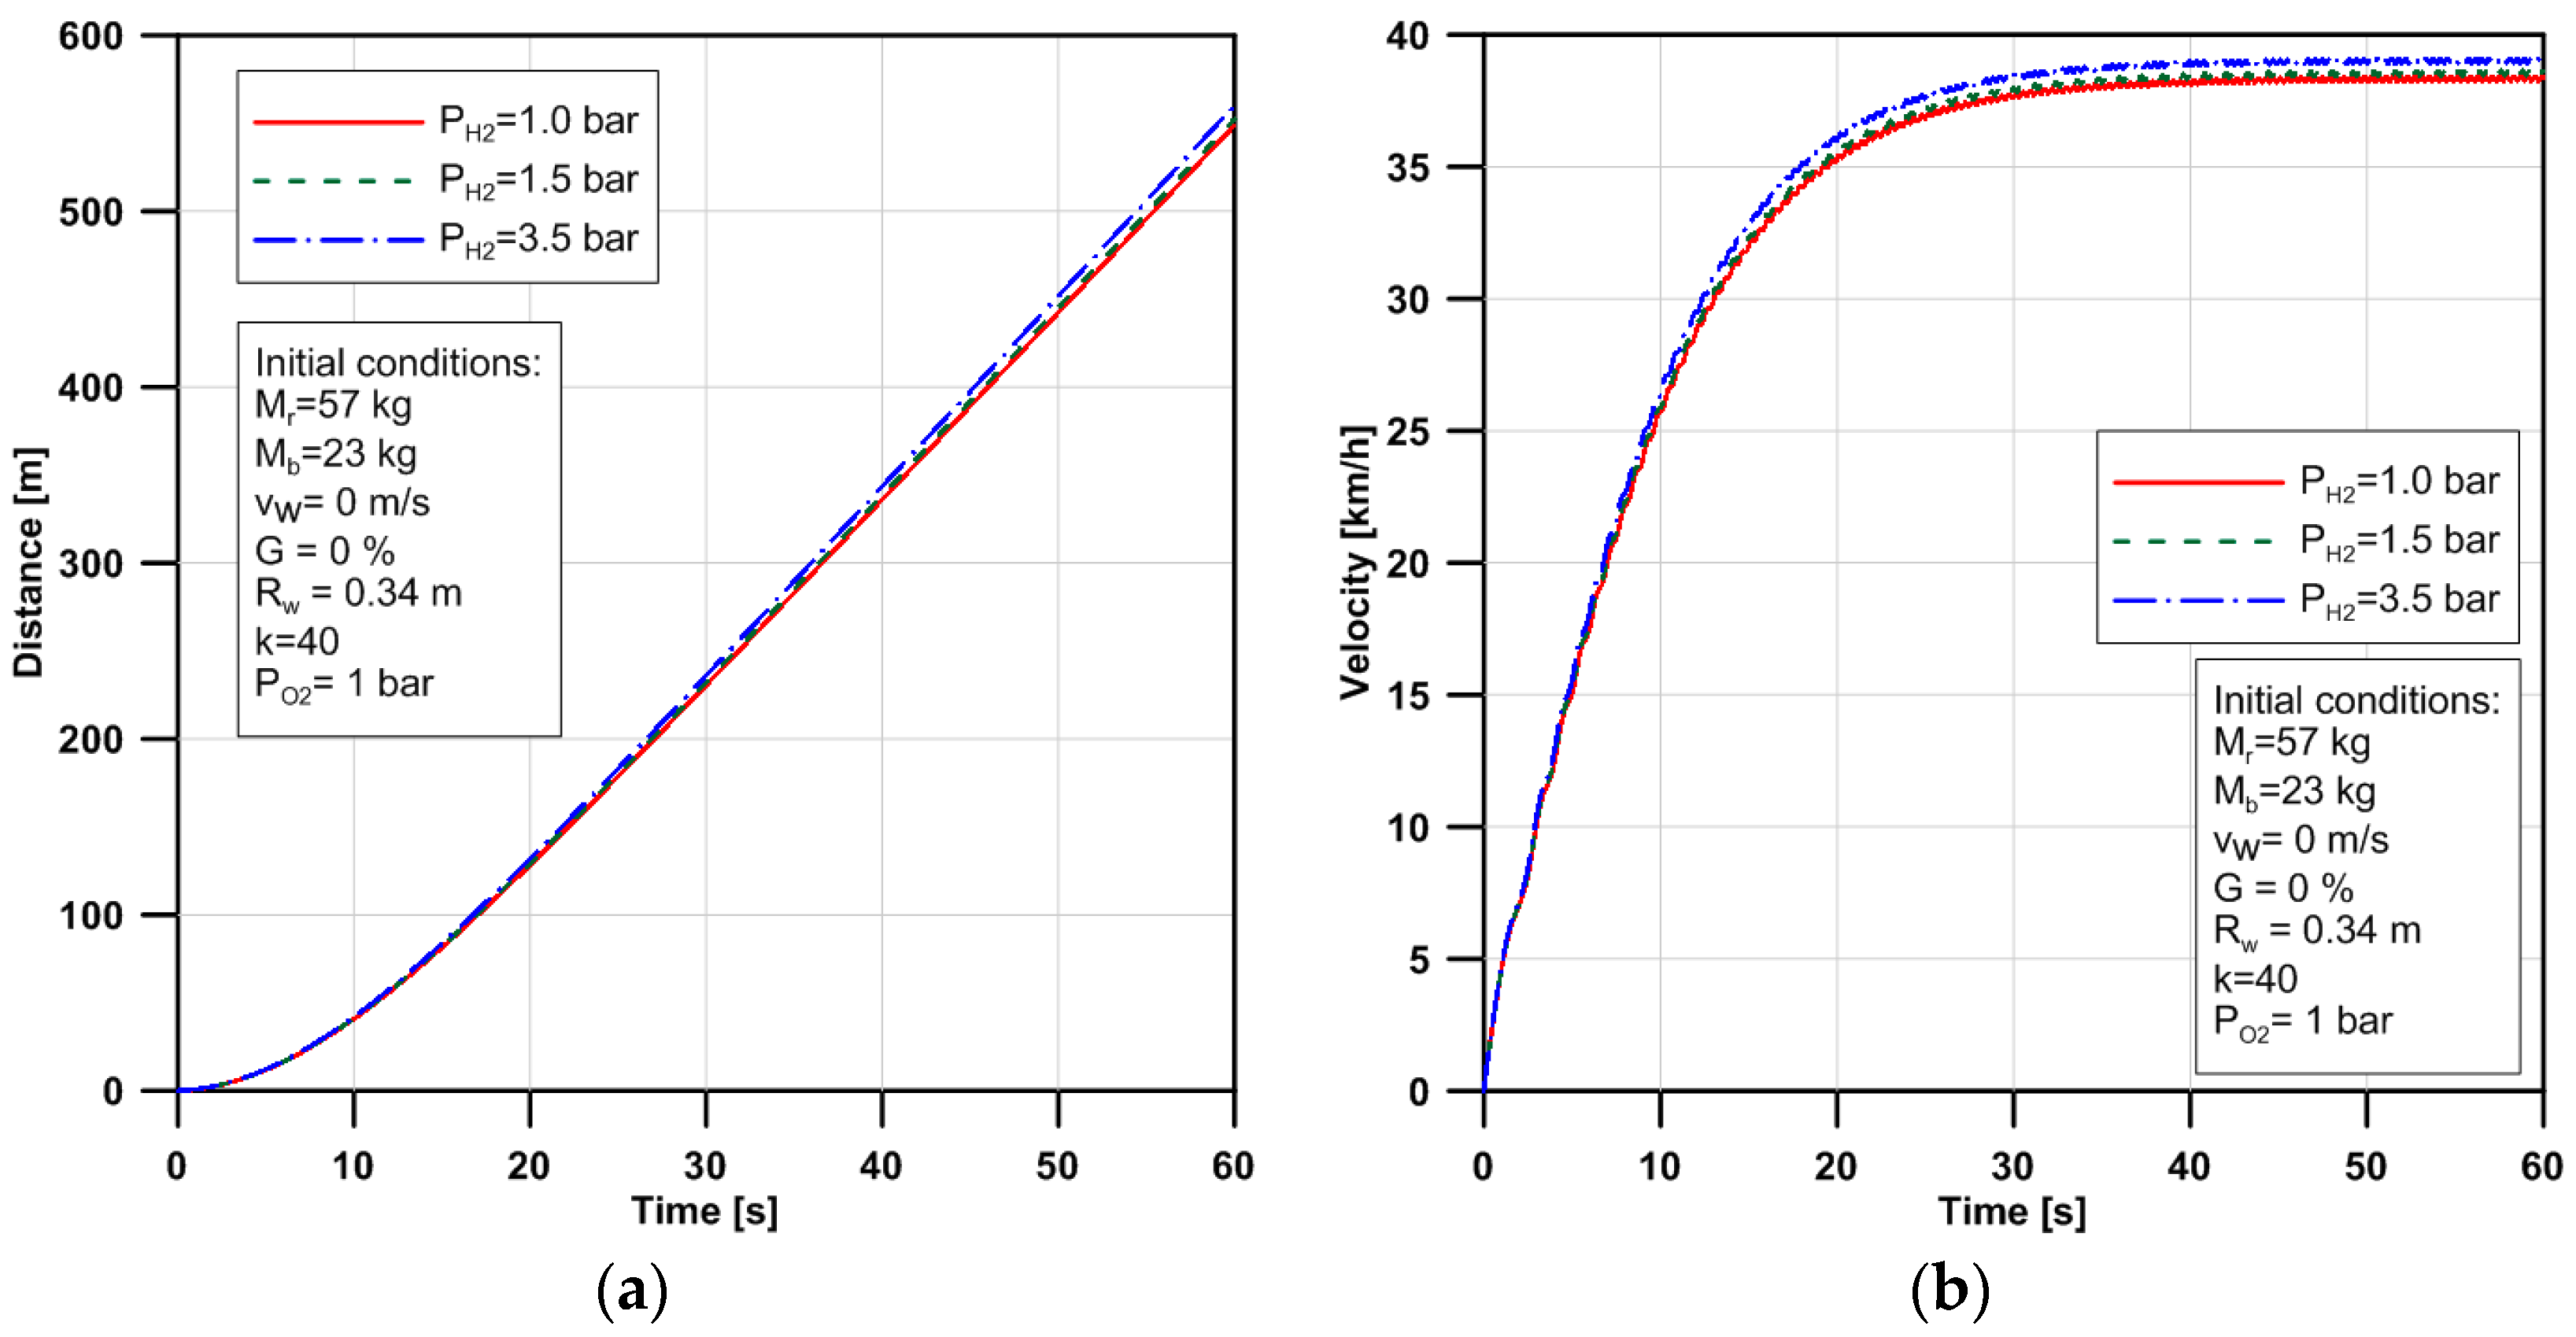
3.3. Effects of Hydrogen Fuel Supply Pressure

Hydrogen pressure supply to the fuel cell stack is denoted by PH2, as shown in Equation (15). Effects of hydrogen pressure on the power of fuel cell are described in Figure 7. The other initial conditions were kept constant, in which the number of cells was kept at 40, optimized in Section 3.2.
As shown in Figure 7, when hydrogen fuel pressure is adjusted from 1 to 3.5 bar, the power of fuel cell is increased from 328.0 to 364.6 W, respectively. This is due to the increase in Enernst when increasing hydrogen fuel pressure, which is shown by Equation (15).
When hydrogen fuel pressure is adjusted from 1.0 to 3.5 bar, the propulsion force of the PAB is increased from 72.9 to 76.3 N, respectively, as shown in Figure 8. The increase in the propulsion force led to the increase in moving distance and velocity of the PAB, as shown in Figure 9. Unlike the effects of number of cells, the effects of hydrogen fuel pressure on the motion characteristics of the PAB were not significant, due to the small change in propulsion force. Namely, when the hydrogen fuel pressure is adjusted from 1.0 to 3.5 bar, the maximum distance and velocity is slightly increased by 2.0% and 1.7%, respectively.

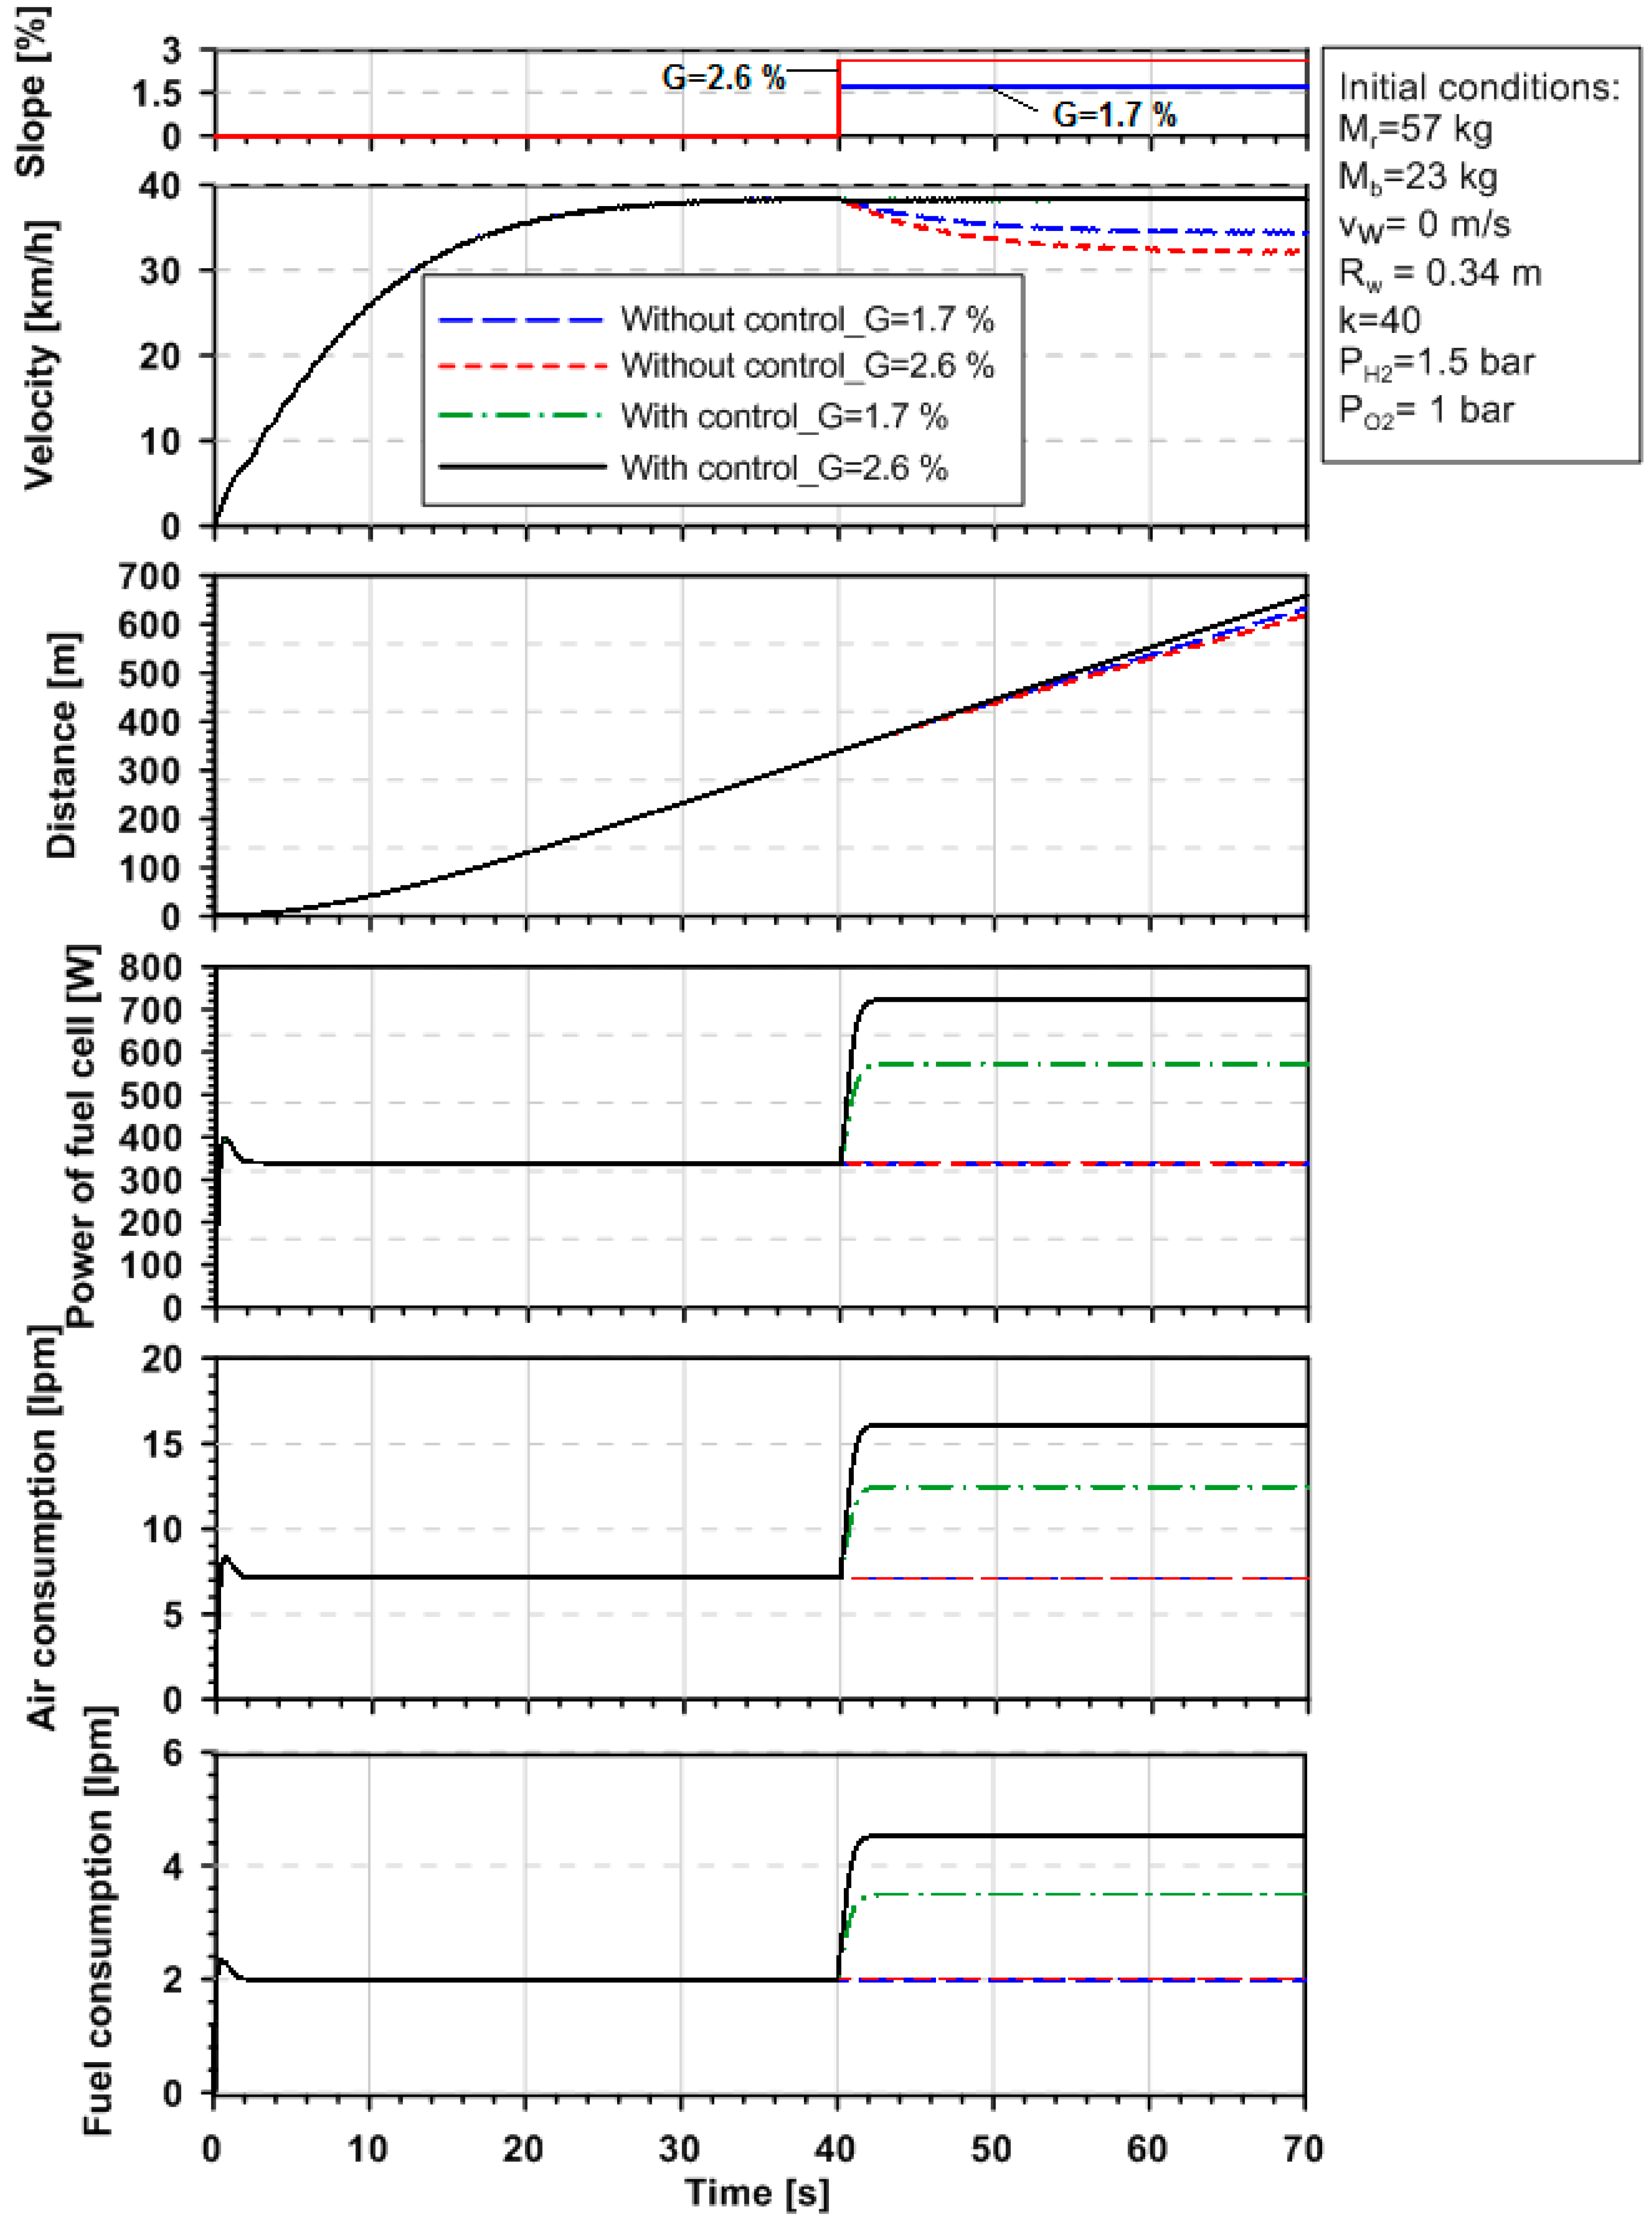
3.4. Effects of Slope Grade

Slope grade (G) has a relationship with the resistance force caused by a slope, as described in Equations (1) and (2), thus it directly affected the motion of the PAB. In the first stage, the PAB was moved on a flat terrain with G = 0%, until its velocity obtained a stable value. In the second stage, slope grade was changed after the PAB moved for 40 s, as described in Figure 10. The purpose of this change was to examine the operating characteristics of the PAB and fuel cell based on the influences of slope grade.
The simulation results were compared in two cases: without and with fuel cell control. A proportional-integral (PI) controller [20] was used to control output voltage, as well as air and fuel consumptions in the stack of fuel cell.
Figure 10 shows motion characteristics of the PAB and operating performance of fuel cell under the effects of slope grade in the two cases: without and with fuel cell control. It can be seen that if the fuel cell is not controlled, the velocity of PAB is reduced as slope grade increases. In addition, when slope grade was changed from 1.7% to 2.6%, the velocity of the PAB was reduced by 10.7% and 16.7%, respectively, when compared with its maximum value just before increasing slope grade. This was caused by the influences of the slope resistance force, which is described in Equation (2). The moving distance of PAB decreased as a result of the reduced velocity, as shown in Figure 10.
In the case of controlling fuel cell, the velocity of PAB maintained a stable value, in spite of changing slope grade, as shown in Figure 10. In other words, the fuel cell was controlled to provide a higher power aim to supplement additional energy, as well as retain the stable value of PAB velocity.
Figure 10 shows that when slope grade increased from 0% to 1.7% and 2.6%, the power of fuel cell was increased from 339.2 to 571.2 and 722 W, respectively. As a result, air and fuel consumptions in the stack of fuel cell were increased to supplement additional power when slope grade was increased, as shown in Figure 10. Namely, the air consumption was increased from 7.1 liter per minute (lpm) to 12.5 and 16.1 lpm, while the fuel consumption was increased from 1.98 to 3.5 and 4.5 lpm, when slope grade increased from 0% to 1.7% and 2.6%, respectively.

4. Conclusions

Operation of a PAB powered by fuel cell was modeled and simulated using a combination of bicycle dynamic, electric motor and fuel cell models. The simulation models were validated by comparing the simulation results with experimental results of PAB motion characteristics. Effects of design parameters of fuel cell, including number of cells and hydrogen fuel pressure, on the operating characteristics of the PAB were investigated. The influences of slope grade on the operating characteristics of the PAB and fuel cell were examined in two cases: without and with fuel cell control. Simulation results showed that:
(1)
Operating performance of the PAB was significantly improved by increasing the number of cells in the stack.
(2)
The increase in hydrogen fuel pressure also contributed to improving the operating performance of the PAB; however, this contribution was not significant.
(3)
Fuel cell power and propulsion force of the PAB obtained the highest values of 364.6 W and 76.3 N, respectively, when the number of cells and hydrogen fuel pressure were optimized at 40 and 3.5 bar, respectively.
(4)
In the case of controlling the fuel cell to maintain a stable velocity of the PAB, the power of fuel cell was increased from 339.2 to 571.2 and 722 W, when slope grade was increased from 0% to 1.7% and 2.6%, respectively.
(5)
Air and fuel consumption in the stack of fuel cell was also significantly increased along with the increase in fuel cell power.
The simulation results obtained could be a useful reference for researchers to develop the PAB using fuel cell. In future works, experimental and simulation studies of the PAB using fuel cell will be conducted to evaluate the influences of working conditions of the fuel cell, such as entry air temperature, air pressure and stack temperature, on the fuel cell power and operating performance of the PAB.

Author Contributions

Conceptualization, N.B.H. and O.L.; methodology, N.B.H.; software, N.B.H.; validation, N.B.H.; formal analysis, N.B.H.; investigation, N.B.H.; resources, N.B.H.; data curation, N.B.H.; writing—original draft preparation, N.B.H. and O.L.; writing—review and editing, N.B.H. and O.L.; visualization, N.B.H.; supervision, O.L.; project administration, O.L.; funding acquisition, O.L. Both authors have read and agreed to the published version of the manuscript.

Funding

This work was supported by Upbringing Business with Innovative Urban Public Institutions by the Ministry of Trade, Industry and Energy (MOTIE, Korea) [Project Name: Establishment of Battery/Ess-Based Energy Industry Innovation Ecosystem].

Conflicts of Interest

The authors declare no conflict of interest.

References

  1. Kim, E.S.; Heo, E.N. Key Drivers behind the Adoption of Electric Vehicle in Korea: An Analysis of the Revealed Preferences. Sustainability 2019, 11, 6854. [Google Scholar] [CrossRef] [Green Version]
  2. Yang, Y.; Tan, Z. Investigating the Influence of Consumer Behavior and Governmental Policy on the Diffusion of Electric Vehicles in Beijing, China. Sustainability 2019, 11, 6967. [Google Scholar] [CrossRef] [Green Version]
  3. Wolf, S.; Korzynietz, R. Innovation Needs for the Integration of Electric Vehicles into the Energy System. World Electr. Veh. J. 2019, 10, 76. [Google Scholar] [CrossRef] [Green Version]
  4. Kihm, A.; Trommer, S. The new car market for electric vehicles and the potential for fuel substitution. Energy Policy 2014, 73, 147–157. [Google Scholar] [CrossRef]
  5. Buekers, J.; Holderbeke, M.V.; Bierkens, J.; Panis, L.I. Health and environmental benefits related to electric vehicle introduction in EU countries. Transp. Res. Part D Transp. Environ. 2014, 33, 26–38. [Google Scholar] [CrossRef]
  6. Erdelić, T.; Carić, T. A Survey on the Electric Vehicle Routing Problem: Variants and Solution Approaches. J. Adv. Transp. 2019, 2019. [Google Scholar] [CrossRef]
  7. Moon, H.B.; Park, S.Y.; Jeong, C.; Lee, J. Forecasting electricity demand of electric vehicles by analyzing consumers’ charging patterns. Transp. Res. Part D Transp. Environ. 2018, 62, 64–79. [Google Scholar] [CrossRef]
  8. Pielecha, J.; Merkisz, J.; Jasinski, R.; Gis, W. Real Driving Emissions Testing of Vehicles Powered by Compressed Natural Gas; SAE Technical Paper; SAE: Warrendale, PA, USA, 2015. [Google Scholar]
  9. Hung, N.B.; Lim, O. The effects of operating conditions and structural parameters on the dynamic, electric consumption and power generation characteristics of an electric assisted bicycle. Appl. Energy 2019, 247, 285–296. [Google Scholar] [CrossRef]
  10. Jones, T.; Harms, L.; Heinen, E. Motives, perceptions and experiences of electric bicycle owners and implications for health, wellbeing and mobility. J. Transp. Geogr. 2016, 53, 41–49. [Google Scholar] [CrossRef] [Green Version]
  11. Langford, B.C.; Cherry, C.R.; Bassett, D.R., Jr.; Fitzhugh, E.C.; Dhakal, N. Comparing physical activity of pedal-assist electric bikes with walking and conventional bicycles. J. Transp. Health 2017, 6, 463–473. [Google Scholar] [CrossRef]
  12. Bourne, J.E.; Sauchelli, S.; Perry, R.; Page, A.; Leary, S.; England, C.; Cooper, A.R. Health benefits of electrically-assisted cycling: A systematic review. Int. J. Behav. Nutr. Phys. Act. 2018, 15, 116. [Google Scholar] [CrossRef] [PubMed]
  13. Hung, N.B.; Sung, J.; Lim, O. A simulation and experimental study of operating performance of an electric bicycle integrated with a semi-automatic transmission. Appl. Energy 2018, 221, 319–333. [Google Scholar] [CrossRef]
  14. Morchin, W.C.; Oman, H. Electric Bicycles—A Guide to Design and Use; Wiley-IEEE Press: Hoboken, NJ, USA, 2006. [Google Scholar]
  15. Kheirandish, A.; Kazemi, M.S.; Dahari, M. Dynamic performance assessment of the efficiency of fuel cell-powered bicycle: An experimental approach. Int. J. Hydrogen Energy 2014, 39, 13276–13284. [Google Scholar] [CrossRef]
  16. Hwang, J.J.; Wang, D.Y.; Shih, N.C.; Lai, D.Y.; Chen, C.K. Development of fuel-cell-powered electric bicycle. J. Power Sources 2004, 133, 223–228. [Google Scholar] [CrossRef]
  17. Cardinali, L.; Santomassimo, S.; Stefanoni, M. Design and realization of a 300 W fuel cell generator on an electric bicycle. J. Power Sources 2002, 106, 384–387. [Google Scholar] [CrossRef]
  18. Yildiz, A.B. Electrical equivalent circuit based modeling and analysis of direct current motors. Electr. Power Energy Syst. 2012, 43, 1043–1047. [Google Scholar] [CrossRef]
  19. Ramos-Paja, C.A.; Bordons, C.; Romero, A.; Giral, R.; Salamero, L.M. Minimum Fuel Consumption Strategy for PEM Fuel Cells. IEEE Trans. Ind. Electron. 2009, 56, 685–696. [Google Scholar] [CrossRef]
  20. O’Dwyer, A. Handbook of PI and PID Controller Tuning Rules; World Scientific: Singapore, 2006; Volume 26, pp. 92–93. [Google Scholar]
Figure 1. Power-assisted bicycle (PAB) dynamic model.
Sustainability 12 04684 g001
Figure 2. Fuel cell modeling integrated on the PAB.
Sustainability 12 04684 g002
Figure 3. Comparison results of PAB for (a) distance of movement and (b) velocity.
Sustainability 12 04684 g003
Figure 4. Effects of number of cells in the stack on power of fuel cell.
Sustainability 12 04684 g004
Figure 5. Effects of number of cells in the stack on propulsion force.
Sustainability 12 04684 g005
Figure 6. Effects of number of cells in the stack on (a) distance of movement and (b) velocity of PAB.
Sustainability 12 04684 g006
Figure 7. Effects of hydrogen fuel pressure on power of fuel cell.
Sustainability 12 04684 g007
Figure 8. Effects of hydrogen fuel pressure on propulsion force.
Sustainability 12 04684 g008
Figure 9. Effects of hydrogen fuel pressure on (a) distance of movement and (b) velocity of PAB.
Sustainability 12 04684 g009
Figure 10. Effects of slope grade on the operating characteristics of PAB and fuel cell.
Sustainability 12 04684 g010
Table 1. PAB specifications.
ParametersValues
EAB mass, kg23
Length of crank, m0.175
Radius of wheel, m0.34
Number of teeth on front gear44
Number of teeth on rear gear11
Power of electric motor, W250
Table 2. Simulation parameters of the fuel cell.
ParametersValues
Number of cells10 ÷ 40
Nominal stack efficiency48%
Operating temperature, °C55
Fuel supply pressure, bar1.5 ÷ 3.5
Air supply pressure, bar1.0

