Review

Road Trauma in Regional and Remote Australia and New Zealand in Preparedness for ADAS Technologies and Autonomous Vehicles

1
Accident Research Centre, Monash University, 21 Alliance Ln, Clayton VIC, 3800 Melbourne, Australia
2
Department of Mechanical and Aerospace Eng., Monash University, 17 College Walk, Clayton VIC, 3800 Melbourne, Australia
*
Author to whom correspondence should be addressed.
Sustainability 2020, 12(11), 4347; https://doi.org/10.3390/su12114347
Submission received: 28 April 2020 / Revised: 21 May 2020 / Accepted: 22 May 2020 / Published: 26 May 2020
(This article belongs to the Special Issue Sustainable Rural Transport)

Abstract

:
Achieving remote and rural road safety is a global challenge, exacerbated in Australia and New Zealand by expansive geographical variations and inconsistent population density. Consequently, there exists a rural-urban differential in road crash involvement in Australasia. New vehicle technologies are expected to minimise road trauma globally by performing optimally on high quality roads with predictable infrastructure. Anecdotally, however, Australasia’s regional and remote areas do not fit this profile. The aim of this study was to determine if new vehicle technologies are likely to reduce road trauma, particularly in regional and remote Australia and New Zealand. An extensive review was performed using publicly available data. Road trauma in regional and remote Australasia was found to be double that of urban regions, despite the population being approximately one third of that in urban areas. Fatalities in 100 km/h + speed zones were overrepresented, suggestive of poor speed limit settings. Despite new vehicle ownership in regional and remote Australasia being comparable to major cities, road infrastructure supportive of new vehicle technologies appear lacking, with only 1.3–42% of all Australian roads, and 67% of all New Zealand roads being fully sealed. With road quality in regional and remote areas being poorly mapped, the benefits of Advanced Driver-Assistance Systems (ADAS) technologies cannot be realised despite the fact new vehicles with these technologies are penetrating the fleet. Investments should be made into sealing and separating roads but more importantly, for mapping the road network to create a unified tracking system which quantifies readiness at a national level.

1. Introduction

Globally and nationally, rural road trauma is a disproportionately large burden [1]. Despite Australia and New Zealand being two of the world’s most urbanised countries, their rural roads are typically unforgiving of road user error and claim the lives of up to four times as many road users as urban roads [2,3]. This conflicts with the image of rural and regional roads being considered Australia’s biggest single factor for business efficiency, domestic and export market success, social connectedness and community safety [4]. While over 70% of the Australian population reside in major cities and metropolitan areas [5], over 50% of road deaths occur on roads that are regional or remote [6]. In New Zealand, 86% of the population reside in urban areas [7], while 80% of road fatalities are recorded on regional and remote roads [3].
Remote and regional road trauma was identified as a major concern in Australia during the early 1990s. In June 1996, the then Australian Transport Council endorsed the Australian Rural Road Safety Action Plan in recognition that gains in road safety in rural areas were not consistent with those made in urban areas [8,9]. Since this time, there have been extensive innovative efforts and programs in Australia and New Zealand to reduce remote and regional trauma [10,11]. However, since 1996, annually, over 1000 and up to 1765 lives in Australia, and approximately 330 lives in New Zealand have been lost on the road network [6,12]. Introduced in 2011, Australia’s National Road Safety Strategy (NRSS) targeted a reduction of at least 30% in those killed and seriously injured (KSI) by 2020, relative to the baseline period 2008–2010 [13]. In 2019, however, 1182 individuals have been killed on Australian roads [14], indicating a reduction of only 17% in annual road transport deaths against the national baseline target (2019 SI statistics were unavailable), as shown in Figure 1. In December 2019, New Zealand released their road safety strategy which set a 40% reduction target in KSI by 2030 (compared to 2018 base levels; 377 deaths, 8866 injuries, [15]).
Neither Australia’s nor New Zealand’s ambitious road safety targets concentrate efforts on rural and remote road safety specifically. Data from 2016 show that 65% (n = 837) of all road crash fatalities occurred on regional and remote roads in Australia while 78% (n = 257) occurred on New Zealand’s rural roads, with a multitude of factors shown to contribute towards the rural-urban differential in road crash involvement [17,18]. With Australia’s and New Zealand’s annual population growth projected to be 1.7% [19] and 1.4–2.0% [20] respectively, it is important to consider the sustainability and safety of the Australasian road transport system.
Evidence suggests that the Safe System (SS) road safety approach, which dictates that roads should be designed and managed so that death and serious injury are avoidable, has not effectively penetrated to the regional and rural road network in practical terms despite Australia’s and New Zealand’s road safety strategies and visions being grounded in the Safe System (SS) [13,21]. The SS framework is based on the belief that the protection of the human within the transport system is central because of his/her fallibility or vulnerability. It therefore places the road user’s biomechanical injury tolerance as the central governing principle underpinning road safety policy decisions [22]. Providing forgiving roads and roadsides, and driving conditions allowing for road user error is paramount. Despite this, neither New Zealand nor Australia have adopted the recommended Safe System speed limits at a national or state level [23]. The default maximum speed limit in non-built-up areas in New Zealand and all Australian states (other than Western Australia—where the default speed limit is 110 km/h), is 100 km/h [24,25], where safety infrastructure is often absent and human errors can therefore be fatal. Recommendations to achieve SS compliance through speeds are rarely enforced. Based on the inherent safety of a well-designed car being able to survive a frontal impact at 70 km/h, Safe System recommendations state that vehicles should not mix with slower forms of traffic at speeds higher than 30 km/h, intersections should not be traversed at speeds higher than 50 km/h so that side impact collisions occur at less than 50 km/h, and oncoming traffic should not approach at speeds above 70 km/h without a form of physical separation [26,27,28]. Instead, remote and regional roads in Australasia are characterised by high speed limits, limited physical separation, unforgiving roadsides, low speed enforcement and typically poor-quality roads.
Despite this, concurrent with poor rural road safety trends in Australia and New Zealand, is a sensationalised view that fully autonomous vehicles can transform the nature of transportation and provide new impetus for social and economic change [29]. With human error thought to contribute to up to 90% of road accidents independent of rurality [30], various Advanced Driver-Assistance Systems (ADAS) are being fitted into new vehicles to assist drivers to mitigate crashes. When integrated with connectivity, ADAS technologies give rise to the fully connected autonomous vehicle (CAV), predicted by some original equipment manufacturers (OEMs) to reduce crash likelihood by 50–80% [31,32,33]. The Society of Automobile Engineers (SAE) divides vehicle autonomy into six levels from being fully conventional vehicles (requiring total driver input, ‘SAE 0′) to fully CAV (driverless, ‘SAE 6′) vehicles (Table 1).
Based on European data and technology deployment patterns, it is predicted that it will be at least 2040 before half of all new vehicles purchased are autonomous, and at least 2050 before half of the vehicle fleet is autonomous [31]. Optimistic prediction or not, vehicles fitted with ADAS systems (Levels 1–3) are likely to be part of the current Australasian vehicle fleet soon. During 2018, for example, 31% of the new vehicle market in Australia offered Autonomous Emergency Braking (AEB) as standard [36]. However, since AEB and other ADAS technologies are dependent on the presence of specific public funded infrastructure, the advent of these technologies brings about the need for significant policy and planning implications [37,38]. On-road trials of autonomous vehicles in Australasia point to worrying evidence that existing urban, and particularly rural roads, may struggle to support autonomous or semi-autonomous vehicles [39,40,41]. Sensors embedded into autonomous vehicles are highly reliant on the presence of specific infrastructure and street furniture [42,43], Table 2. With the transition of conventional vehicles to automated vehicles, the demand on Australian and New Zealand’s roads to be future-ready is becoming increasingly urgent.
Independent of the current state of roads, fully autonomous vehicles have been predicted to appear sometime between 2020 [46] to 2040–2070 [31,34]. Given such predictions, ambitious estimates have been made regarding the potential safety benefits that ADAS technologies offer, and more so, what they could bring to all road users globally, and by extension, Australasia. While some predict reductions of approximately 25% of all crashes (with the right infrastructure being present), predictions made by others are more conservative [47]. Europe’s leading road safety authority, Euro NCAP and road authority, Euro RAP noted the potential problems that fully autonomous vehicles are likely to encounter given the current infrastructure deficiencies [48]. The European Commission notes that “a true SAE level 5 vehicle may not be possible given comprehensive infrastructure support will likely never cover the entire road network” [49]. Various researchers have, therefore, estimated the benefits that individual ADAS technologies can provide. Logan and colleagues [32] estimated the benefits of a suite of ADAS technologies at 100% fleet penetration in Australia and New Zealand. Reductions of 25–40% in run-off road and head-on crashes (due to Lane Keep Assist) and reductions of 35–50% in same direction impacts (due to AEB and Forward Collision Warning) were predicted. Budd and colleagues estimated the potential of over fifteen active safety technologies to reduce the crash injury burden by analysing the 2006–2016 crash trends of the light vehicle fleet in five Australian states [50]. They predicted that assuming the latest crashes were used in each projected year (with only the penetration of vehicle safety technologies changing), by 2030, 207 fatal crashes, almost 3400 serious injury crashes, and approximately 8500 minor injury crashes would be prevented due to the additional penetration of active safety technologies alone. With the right infrastructure and road quality, new vehicle technologies are likely to bring significant gains to road safety in Australasia. Exactly how we approximate these benefits, however, is highly dependent on available data related to road readiness in these regions.
While independent road agencies collect data about road fatalities in Australia and New Zealand, and some on-road trials of CAVs have been conducted, little is known about how these vehicles will benefit road safety in rural and remote areas, or how prepared rural and regional roads in Australasia are to support CAVs.
This study set out to investigate the sources and causes of the current road trauma burden in regional and remote areas in Australia and New Zealand, in order to identify the extent to which ADAS technologies can be of benefit in reducing road trauma given the current state of roads. To address the study aim, urban areas will be compared to regional and remote areas in terms of:
  • Distribution of speed limits, in light of the role that speed plays in supporting CAVs
  • Crash type composition
  • Fleet composition and
  • Road attributes such as road surface and road separation
In doing this, Australasia’s preparedness for autonomous vehicles will be determined and the sustainability of Australasia’s transport network quantified. While recommendations will be provided regarding where targeted investments are required in order to maximise road safety gains offered by ADAS-equipped vehicles, this study will also identify gaps in record keeping which has serious implications in terms of accurately quantifying the predicted and expected benefits of autonomous vehicles.

2. Materials and Methods

Existing data from various road and traffic authorities within Australia and New Zealand were sourced from the appropriate State Transport Offices. All data sources have been cited and acknowledged appropriately.

2.1. Population Data

Australian population data was obtained from the Australian Bureau of Statistics, 2016 Census [5]. New Zealand population data was based on urban area population projections based on the 2013 New Zealand Census [51]. To describe remoteness in Australia, existing remoteness categories including “Major Cities”, “Regional Australia” (representing both Inner Regional Australia and Outer Regional Australia) and “Remote Australia” (representing both Remote Australia and Very Remote Australia) were used, as per the ARIA Index [52]. Remoteness in New Zealand was defined where possible using the New Zealand Standard Areas Classification 1992 (NZSAC92), 2001 Rural/Urban classification [53]. Using this, population and land area has been labelled Main Urban Areas (i.e., areas centred on a city or major urban area with a minimum population of 30,000), Secondary Urban Areas (i.e., areas centred on large regional centres with a population between 10,000 and 29,999), Minor Urban Areas (i.e., areas centred on smaller towns with a population between 1000 and 9999), Rural Centres (i.e., rural settlements or townships with population between 300 and 999) and Other Areas (i.e., areas not classified as urban or rural centres with population under 300). The categories outlined in Table 3 have been used to classify and compare remoteness levels in Australia and New Zealand.

2.2. Road Fatality Data

Fatal crash data (2016–2019) published by the Bureau of Infrastructure, Transport and Regional Economics (BITRE) [54] via the Australian Road Deaths Database and published by the New Zealand Transport Agency [55] via the Crash Analysis System (CAS) were accessed online. While BITRE provides the remoteness of the crash location in the dataset, NZ Transport Agency does not make this publicly available. Therefore, the Territorial Local Authority (TLA) boundary listed for each fatal crash in New Zealand was categorised as ‘Main Urban’, ‘Secondary Urban’ ‘Minor Urban’ or ‘Rural or Other’ based NZSAC92 using 2013 population data. These categories were then renamed ‘Major cities’, ‘Regional areas’ and ‘Remote areas’ respectively in order to compare Australian fatal crash statistics to those of New Zealand (as per Table 3).

2.3. Vehicle Fleet Data

Australian vehicle fleet statistics were obtained from the Federal Chamber of Automotive Industries (FCAI) while vehicle registration data was obtained from the Australian Bureau of Statistics (ABS), Motor Vehicle Census at 31 January 2019 [56]. To determine the current age of the vehicle fleet in Australia with respect to the remoteness, each registered vehicle’s year of manufacture (YOM) and the postcode at which the vehicle was registered was mapped to remoteness levels using correspondences generated by the ABS [57].
While the New Zealand Transport Authority provides open access to their vehicle fleet database, it only provides data regarding the Territorial Authority (TLA) within which the vehicle is registered. Since the TLA cannot be directly linked to remoteness level, the NZ Transport Agency were contacted privately to obtain motor vehicle registration data pertaining to vehicle YOM and place of registration data. This data was kindly provided by the NZ Transport Agency.

2.4. Road Infrastructure Data

Roads and infrastructure data was obtained from various sources within Australia but mainly the Ministry of Transport and NZ Transport Agency for New Zealand [58], and the Bureau of Infrastructure, Transport and Regional Economics for Australia [59,60]. Road infrastructure data was verified using data provided by road authorities in Queensland [61], South Australia [62], and Tasmania [63,64]. No data could be obtained from the relevant road authorities in Australia or New Zealand regarding what percentage of the roads are delineated with centrelines and/or have edgelines since this information, if maintained, is done so by the local road authorities. New Zealand road infrastructure data includes the lengths of Special Purpose roads (by definition, roads and other carriageways that have received or continue to receive high funding [65]).

2.5. Data Analysis

Excel Microsoft Office Professional Plus 2016 and IBM SPSS Statistics V. 25 were used to extract various data and obtain descriptive statistics to identify trends. Statistical significance of differences between proportions have been tested using the Chi-square tests.
This study (Project ID 21784) has received Ethics Approval from the Monash University Human Research Ethics Committee (MUHREC), October 2019.

3. Results

3.1. Overview of Population and Road Trauma by Remoteness

The population of Australia (2016) and New Zealand (2018), relative to land area of both nations, is presented in Table 4. Despite Australia’s population being 4.7 times greater than New Zealand’s population, the proportion of the population residing in major cities was comparable (71% in Australia, 73% in New Zealand). Remote areas in New Zealand, however, are relatively more populated than those in Australia (14% vs. 2% of the population, respectively) although this may be due to differences between how remoteness levels are defined (discussed later).
In Australia, while 70% of the population reside in 0.3% of the land area (major cities), only 2% of the population reside in remote areas which comprise 86% of the land area. This difference is a little less skewed in New Zealand, but a similar trend exists (70% population over 0.3% land area in Australia vs. 70.7% population over 11.5% land area in New Zealand, p < 0.0001).
Not surprisingly, the population density in certain Australian inner city areas exceeds 10,000 people per km2 and certain New Zealand towns exceeds 4000 people per km2, while remote areas can have population densities of less than 1 person per km2 [66,67]. Given such discrepancies, difficulties can arise when allocating funding for resources and road infrastructure investments.
Between 2016 and 2018, 3666 individuals were killed on Australian roads [6,68,69] and 1082 were killed on New Zealand roads [12]. In the most recent publication investigating regional road safety, fatal crash statistics by remoteness for 2016 specifically was analysed by Austroads (Table 5) to highlight the road safety problem in regional and remote areas [3].
Although thirty percent of Australasia’s population reside in regional and remote areas, they are dispersed across more than 89% of the land and experience a road trauma fatality rate five times higher than that of their city-dwelling counterparts (2.6 vs. 12.2 per 100,000 population in Australia). Those residing in remote and regional areas, by the very definition of remoteness indices are identified as populations who are disadvantaged according to various measures (i.e., distance to goods and services, provisions, etc.). However, if infrastructure funding is always sought by and allocated to regions where the population is greater (these by definition being major cities), then those who reside in remote and regional areas will always be disadvantaged by the lack of infrastructure funding.

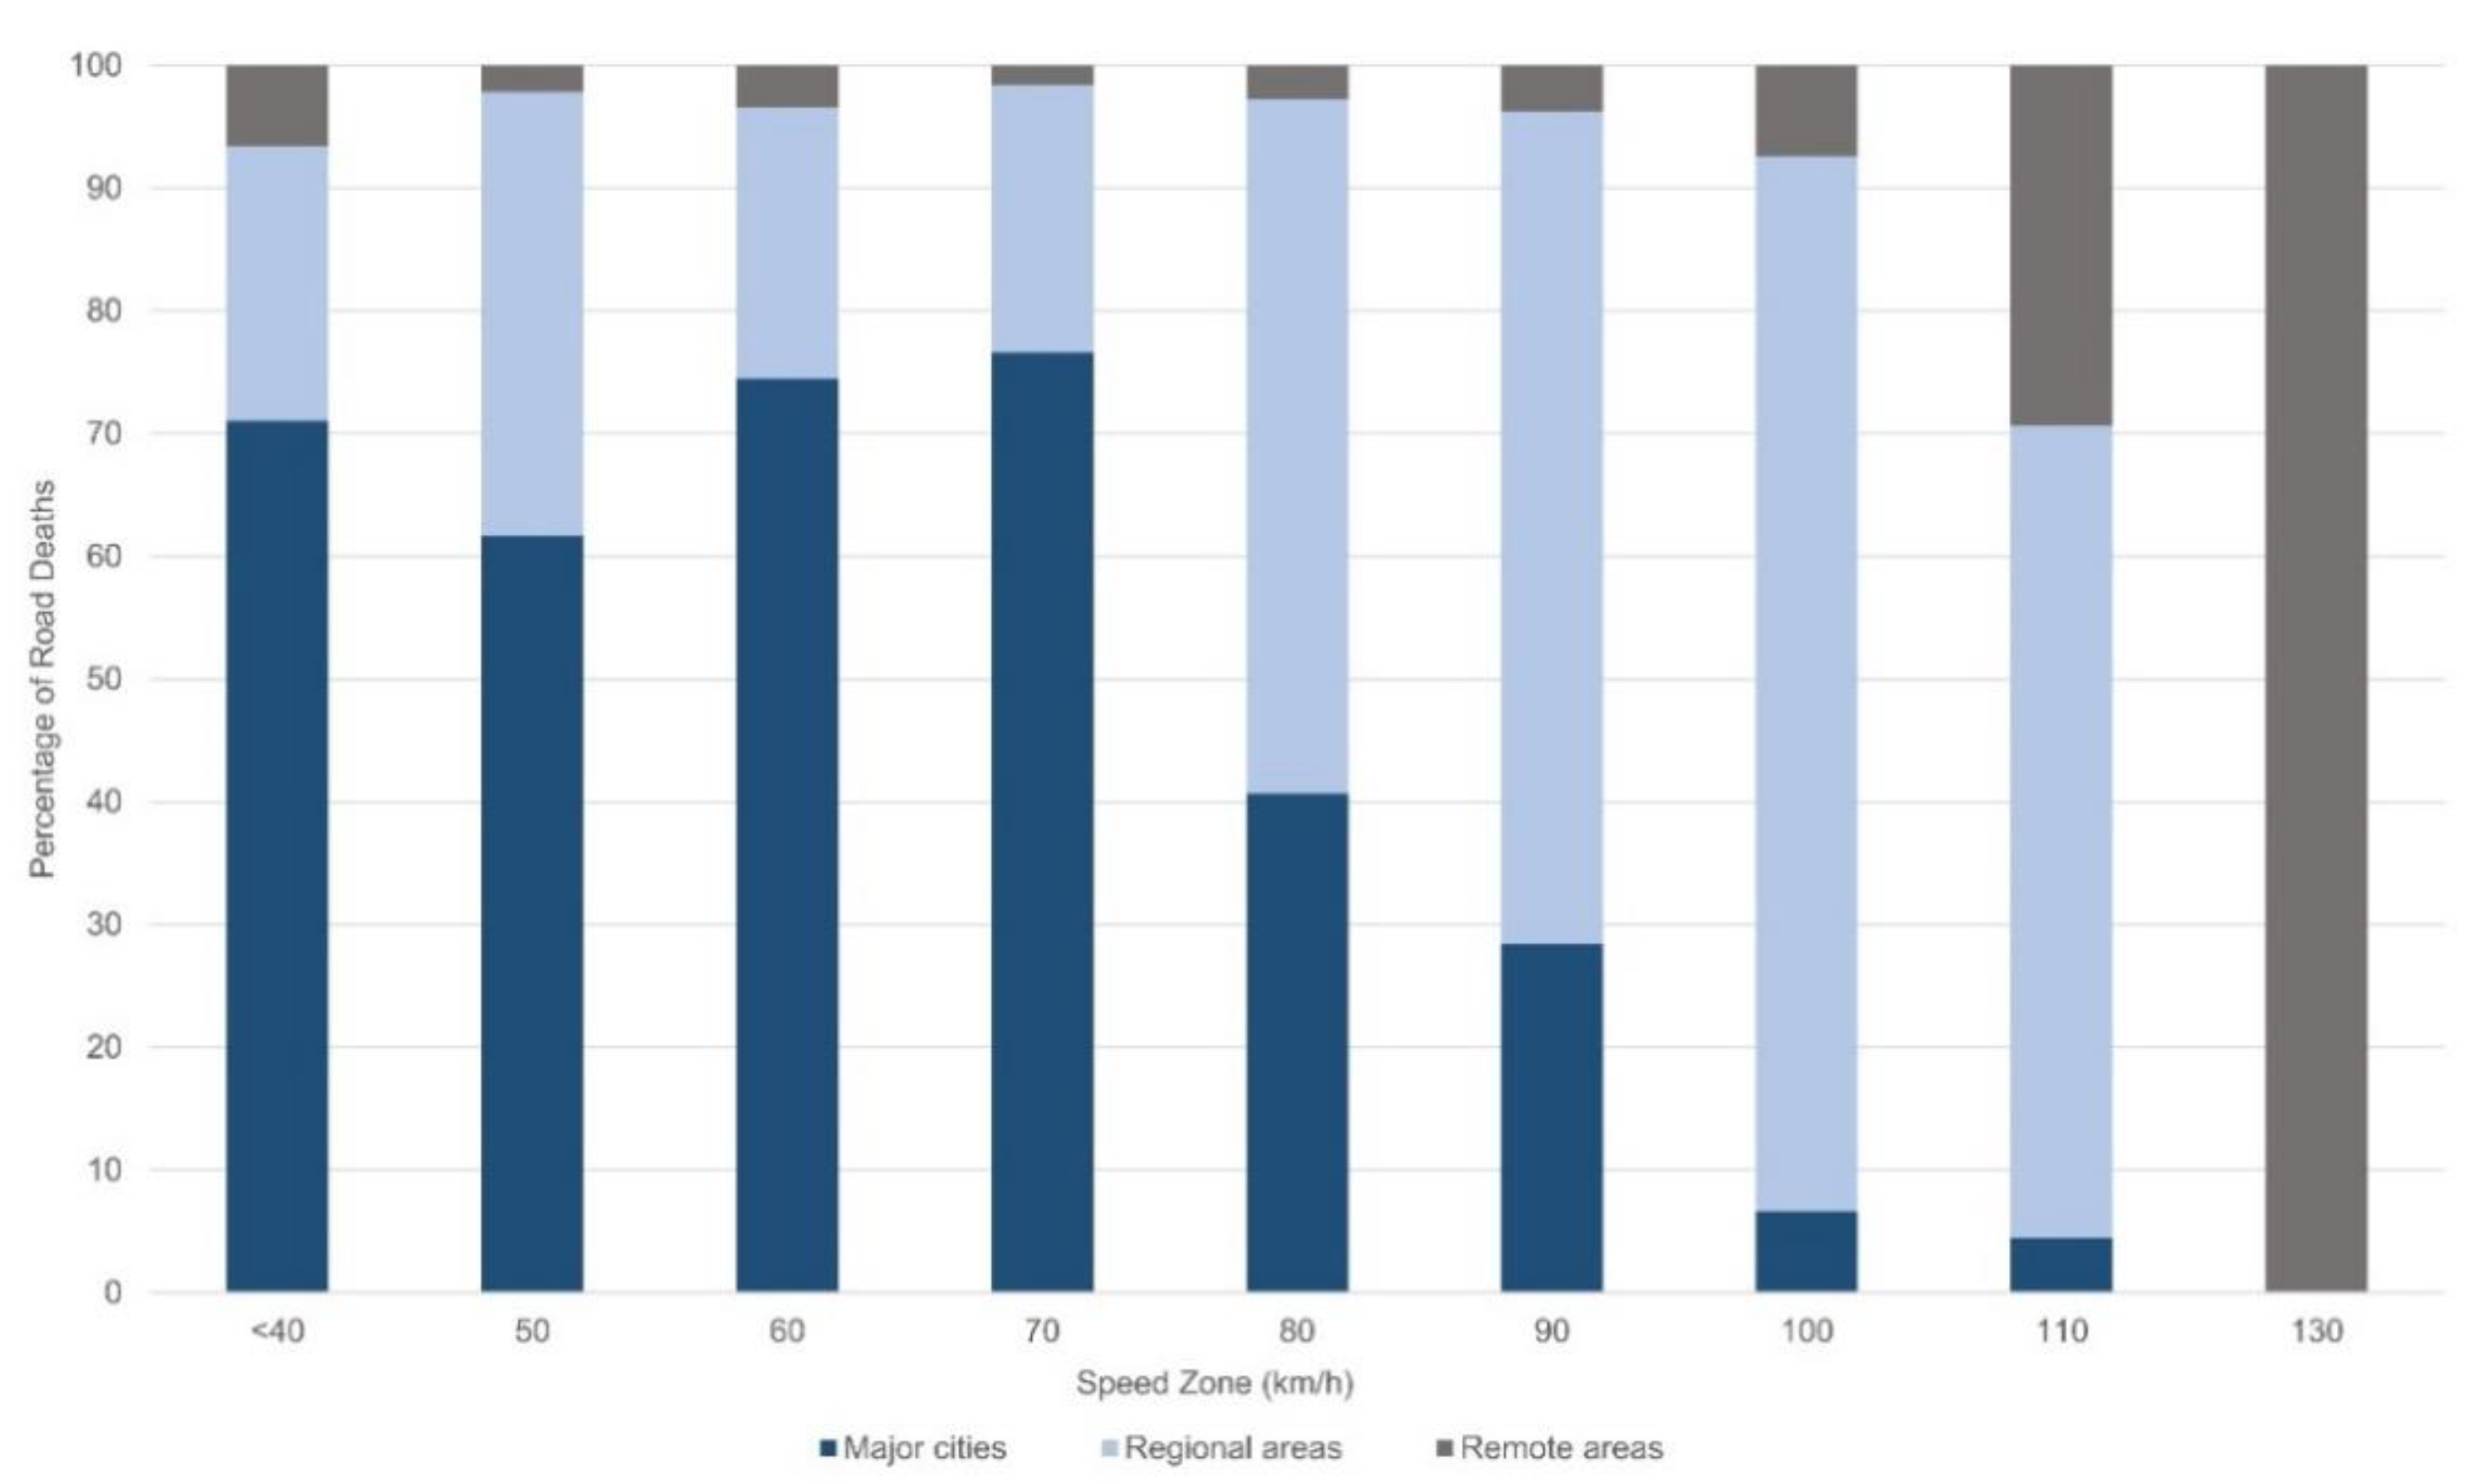
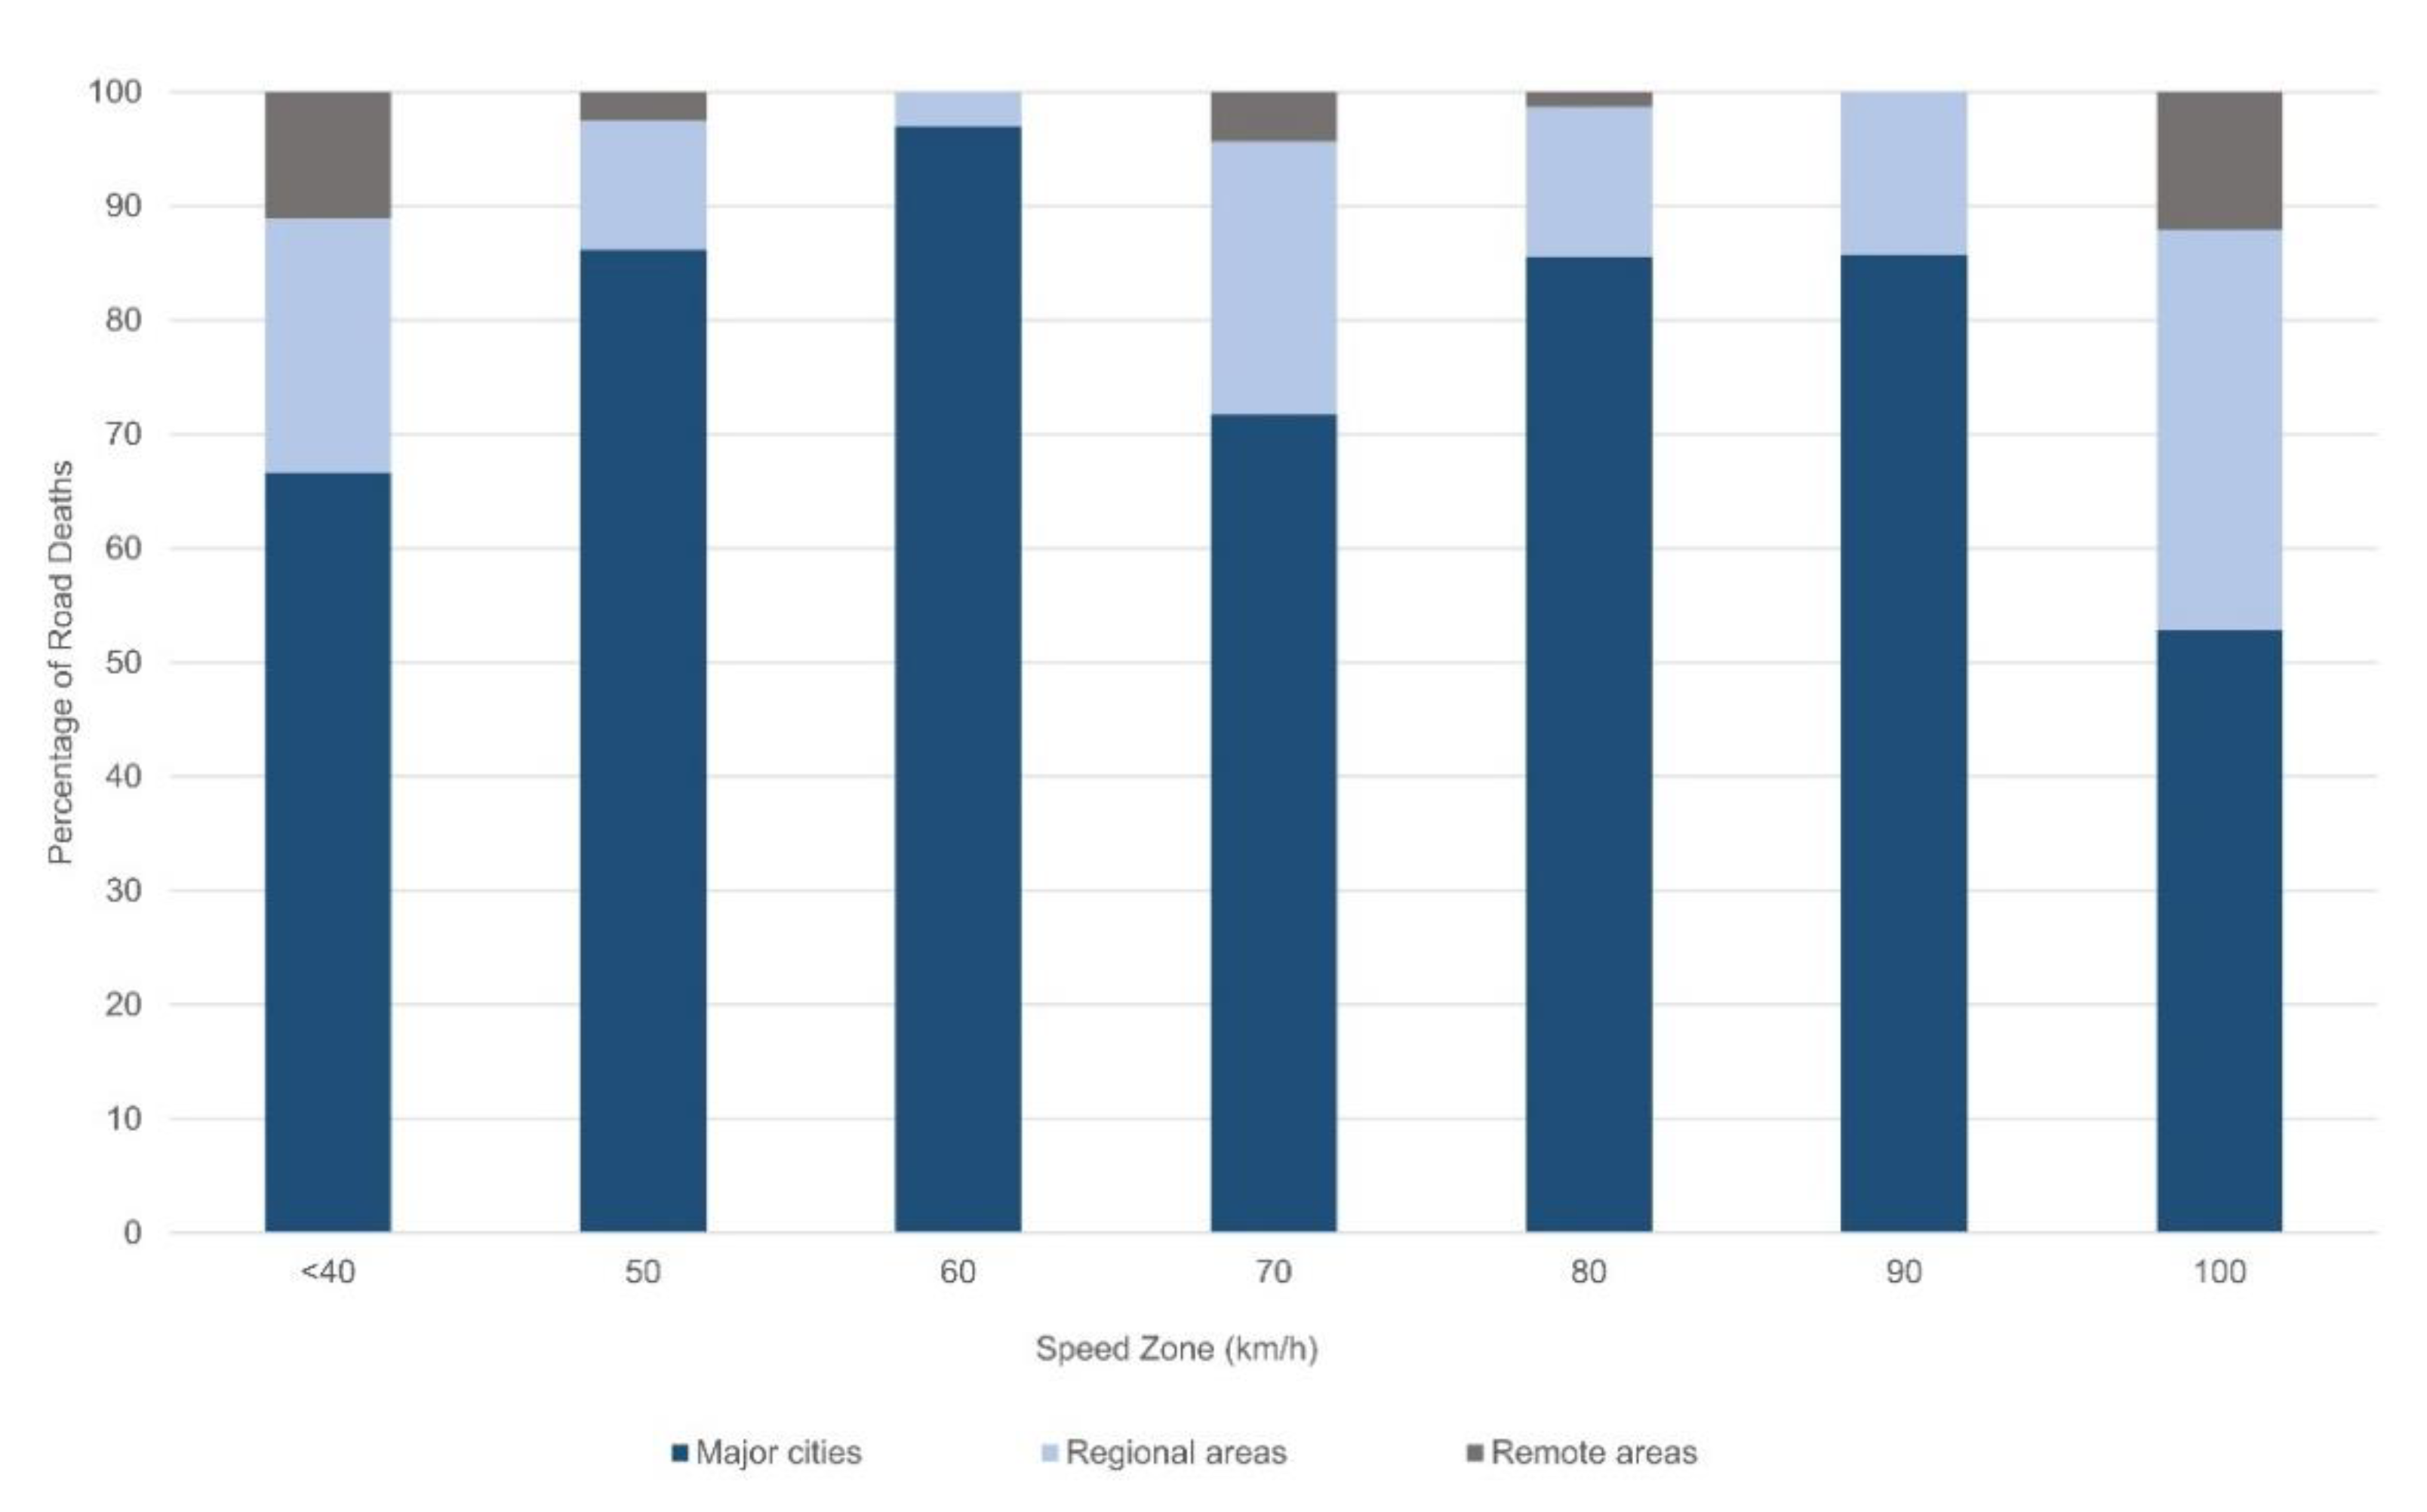
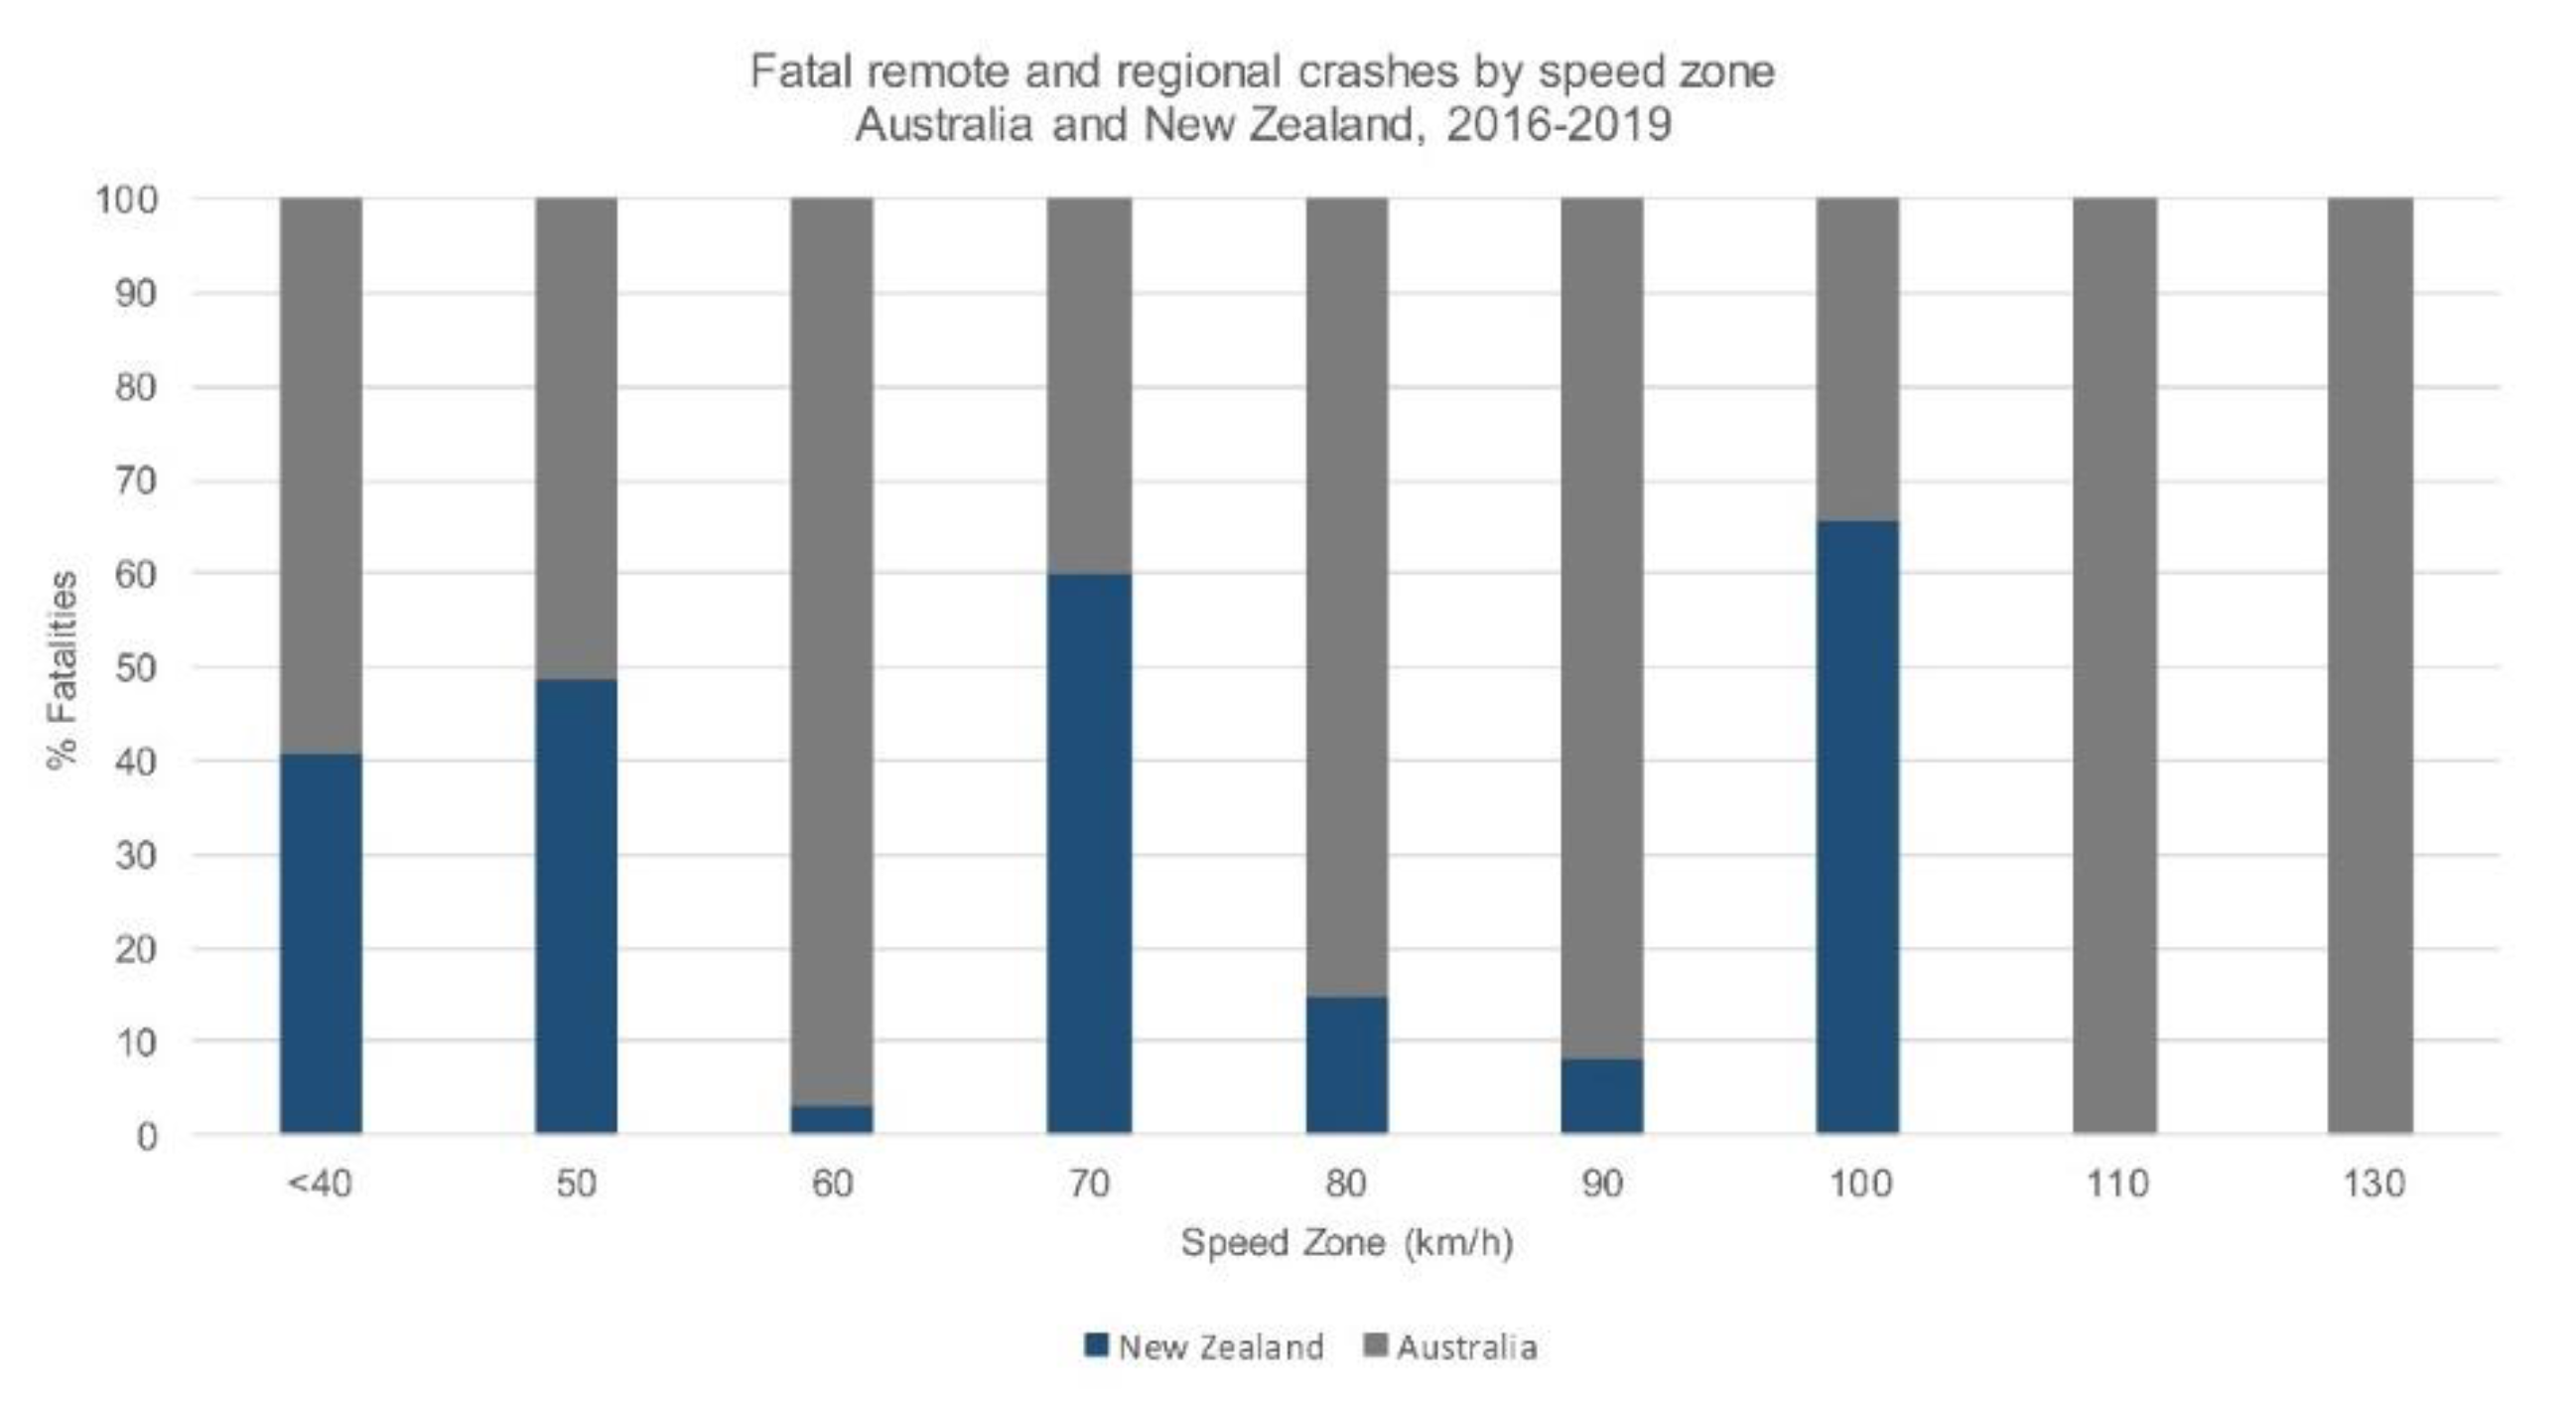
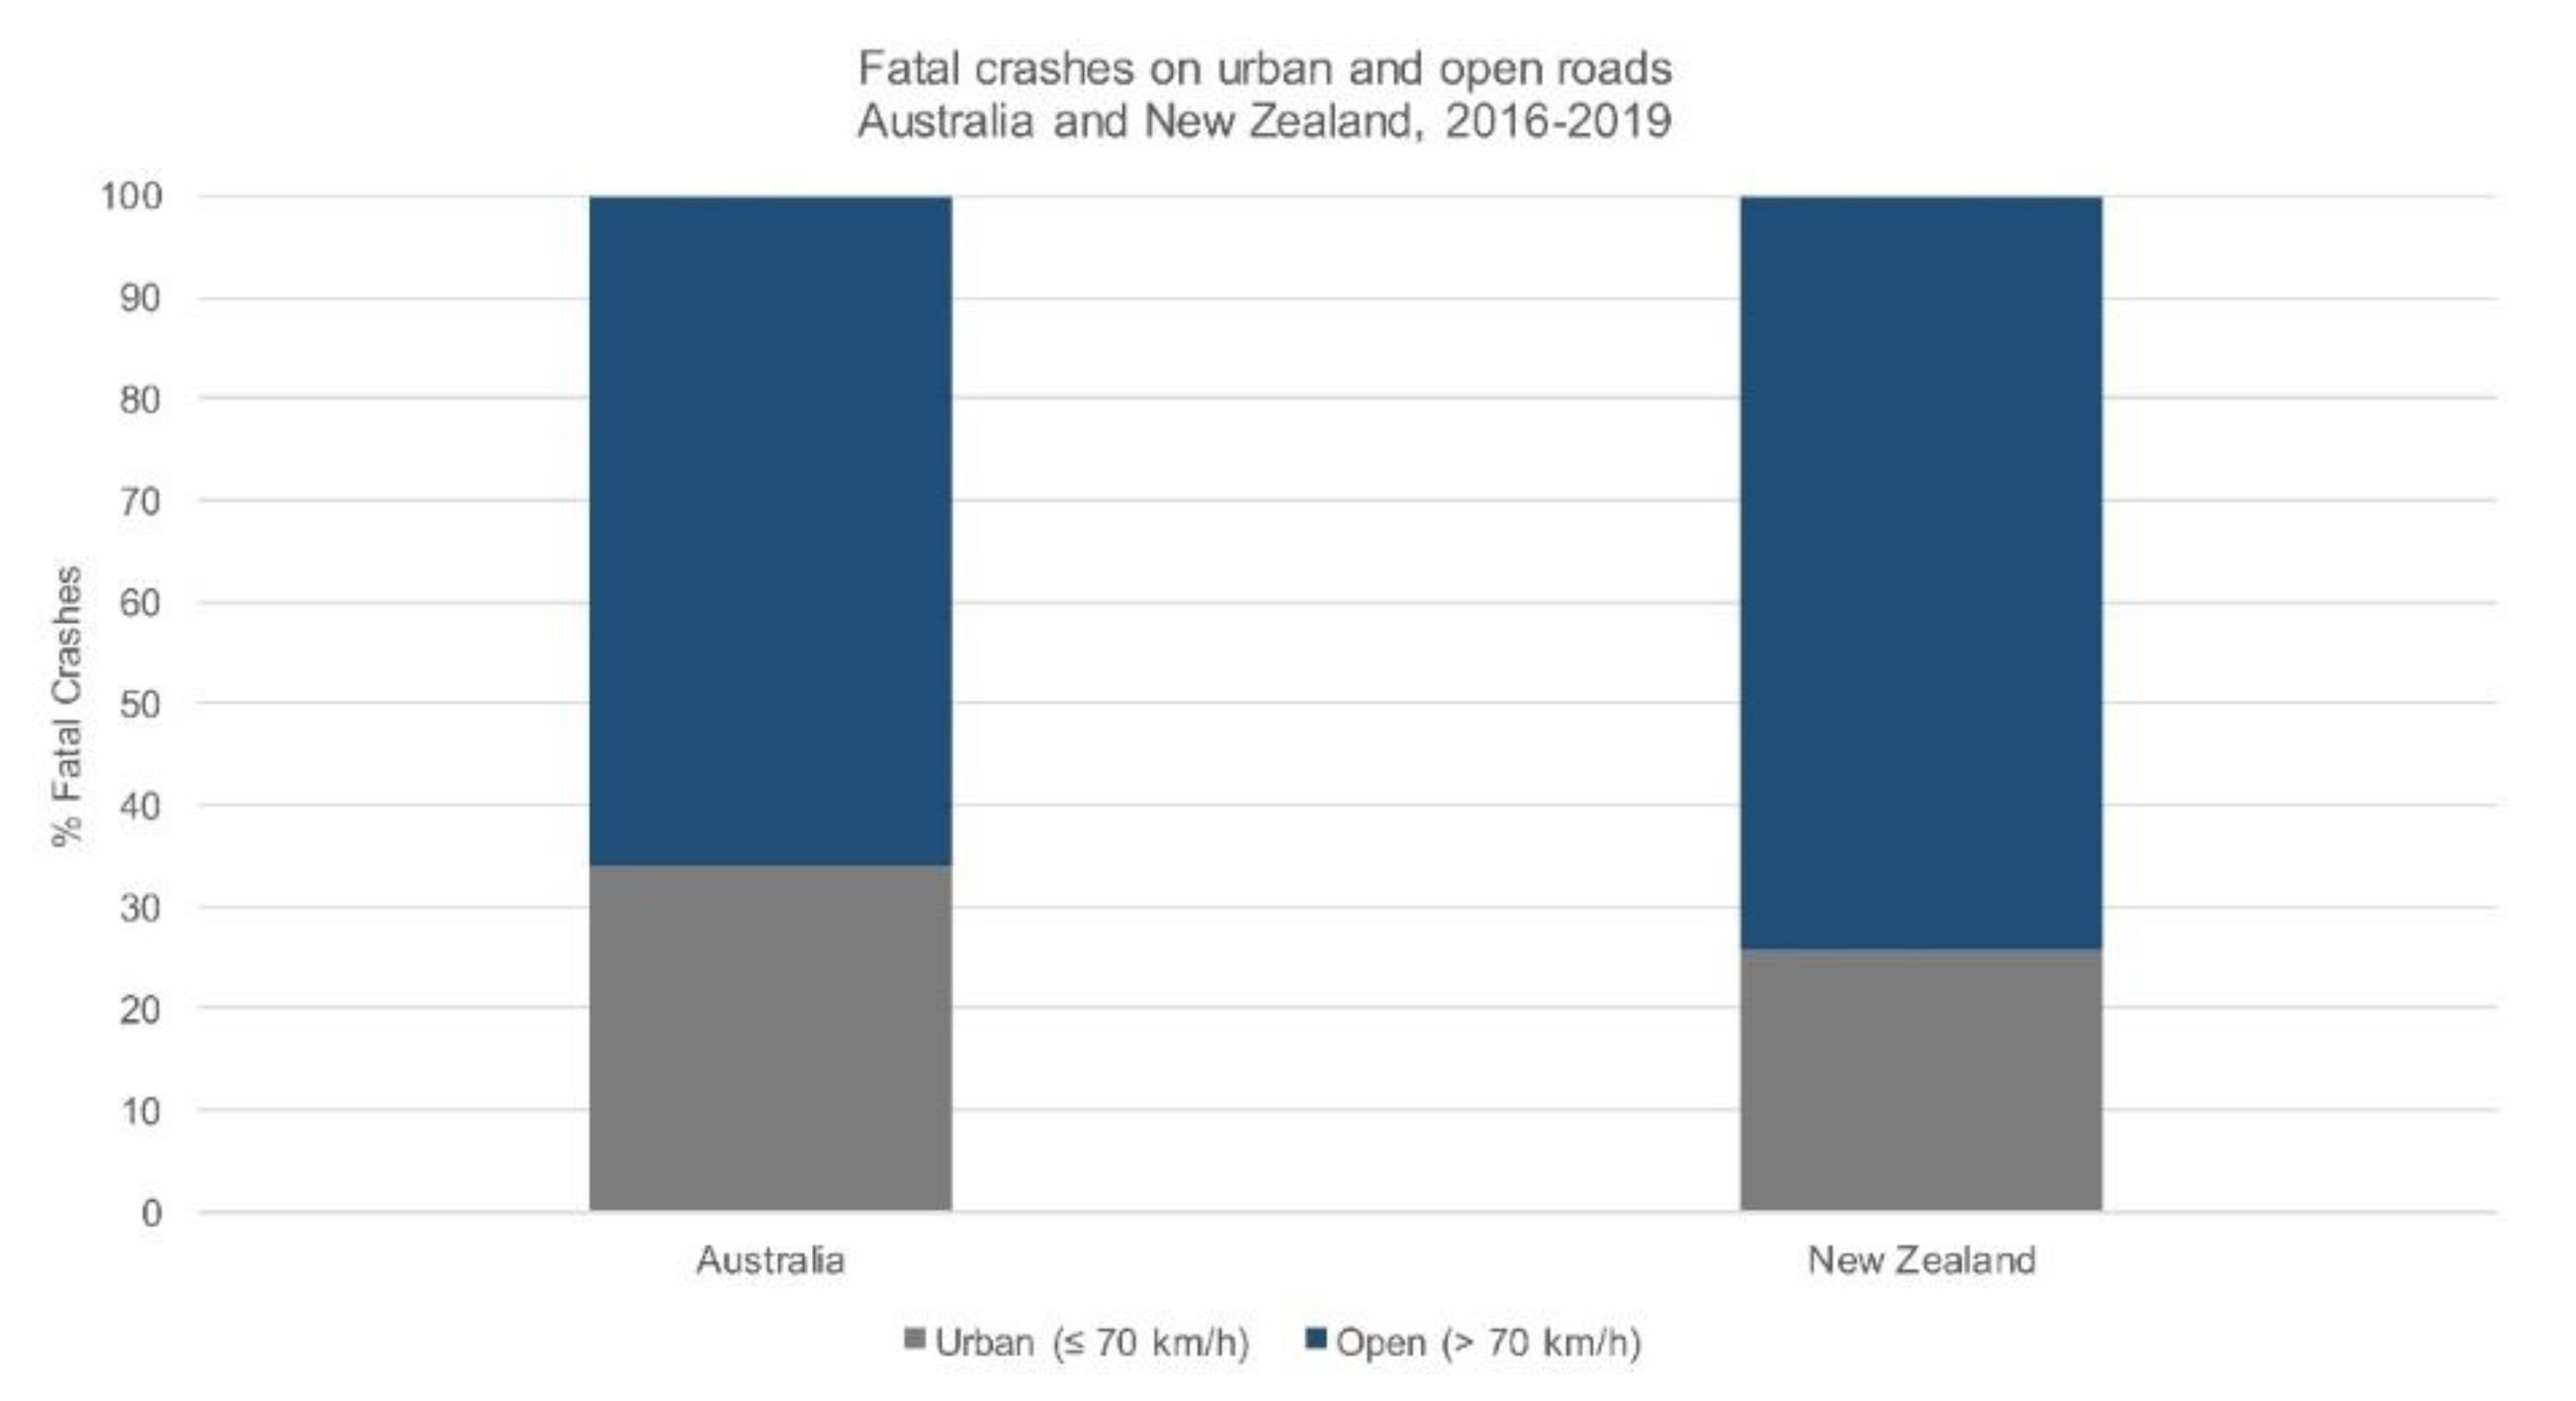
3.2. Fatal Crashes by Speed Zone and Remoteness

Over the 5-year period investigated (2016–2019), there were approximately 4733 fatal crashes on Australian roads. The remoteness level was identified and recorded in 3739 of these crashes, Figure 2. While one third of fatal crashes occurred in major cities, rural and regional areas accounted for 66% or two thirds of all road fatalities. Independent of remoteness levels, 49% of all fatal crashes occurred in zones signed above 90 km/h; 32% of all fatal crashes occurred in zones signed at 100 km/h. Of the road fatal crashes that occurred in major cities, close to 90% occurred at speeds below 90 km/h. Seventy two percent of all fatal crashes in major cities occurred at speeds of 70 km/h or below. In regional and remote regions, fatal crashes in speed zones under 90 km/h accounted for only 30% and 16% of the fatalities, respectively, highlighting the burden associated with high speed limit settings in non-urban areas. The large number of fatalities that occur in major cities at speeds of 70 km/h highlights that further investments should be made to make the network fully Safe System compliant so that the high volumes of traffic can be safely accommodated in spite of errors made by drivers.
Over the same time period in New Zealand, 37% of all fatal crashes occurred in regional and remote areas when analysed by TLA (Figure 3) with the majority of crashes occurring in 100 km/h speed zones. Over 65% of all fatal crashes occurred in zones signed at or above 90 km/h, independent of remoteness level. Over the period investigated, less than four crashes were recorded in 60, 90, 110 and 130 km/h zones in regional and remote New Zealand (compared with 762 fatalities in Australia in these speed zones). While it is likely that there are differences in the application of speed limits between the two countries, there are also differences in the distribution of road fatalities by remoteness level and speed zone. For example, while fatal crashes in major cities in Australia occur mainly in 40–80 km/h zones, no such distinction is seen in the New Zealand data, where fatalities in major cities occur in 50 km/h zones but more so in 100 km/h speed zones, highlighting the fact that speed plays a large role in the outcome of crashes, independent of remoteness level. Supportive of this, is the trend that the majority of fatalities in regional and remote areas in both countries appear to be concentrated in 100 km/h zones.
Fatal crashes in regional and remote areas in Australia and New Zealand were compared by speed zones (Appendix A, Figure A1) to determine what proportion occurred in speed zones in excess of 70 km/h where Safe System infrastructure is often lacking. It was found that over 85% fatalities in New Zealand and 65% of fatalities in Australia, occur in speed zones of 100 km/h or above, reinforcing the association between risk of fatality and high speed. Fatal crashes in urban areas (speed limit ≤ 70 km/h) was compared to fatal crashes on open roads (speed limit > 70 km/h) as per the definition of urban and rural roads used by the NZ Transport Authority (see Appendix A, Figure A2); however, this also reinforced that in both countries, at least two thirds of all road fatalities occur in remote and regional areas (66% and 74% fatalities occur on open roads in Australia and New Zealand respectively). The proportion of crashes that occurred in regional areas (compared to urban areas) was statistically significantly higher in New Zealand and Australia.

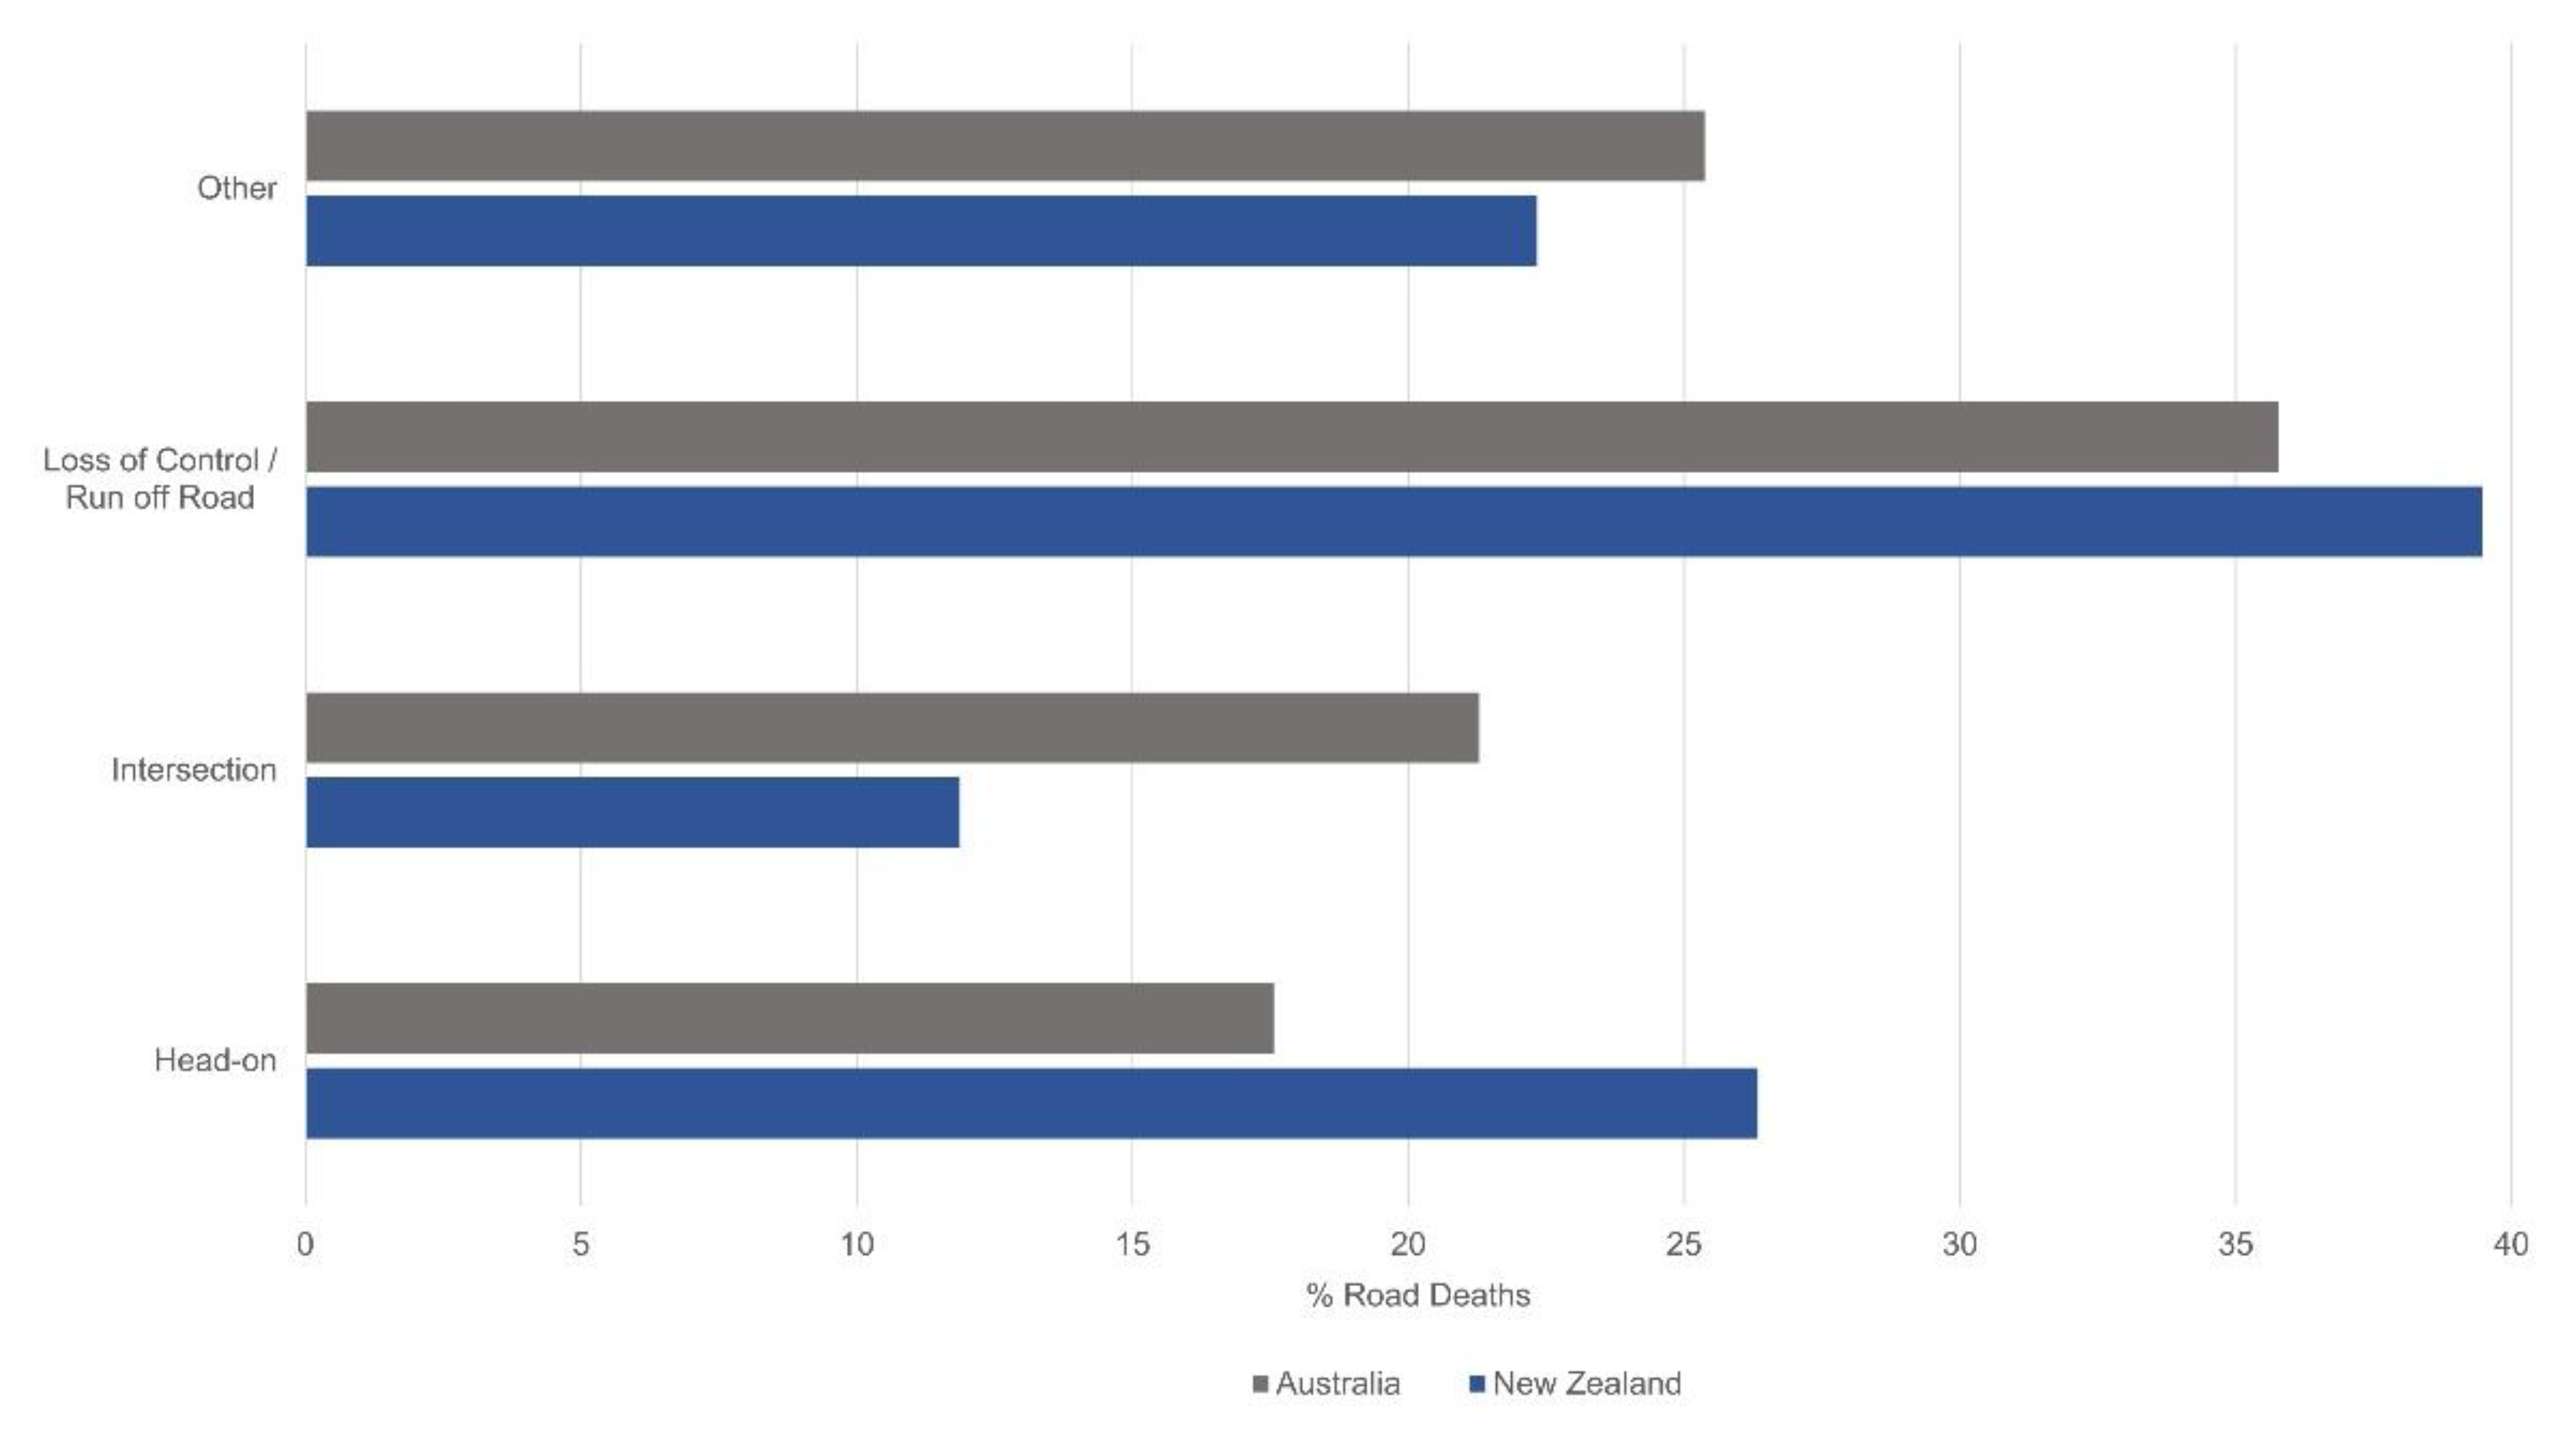
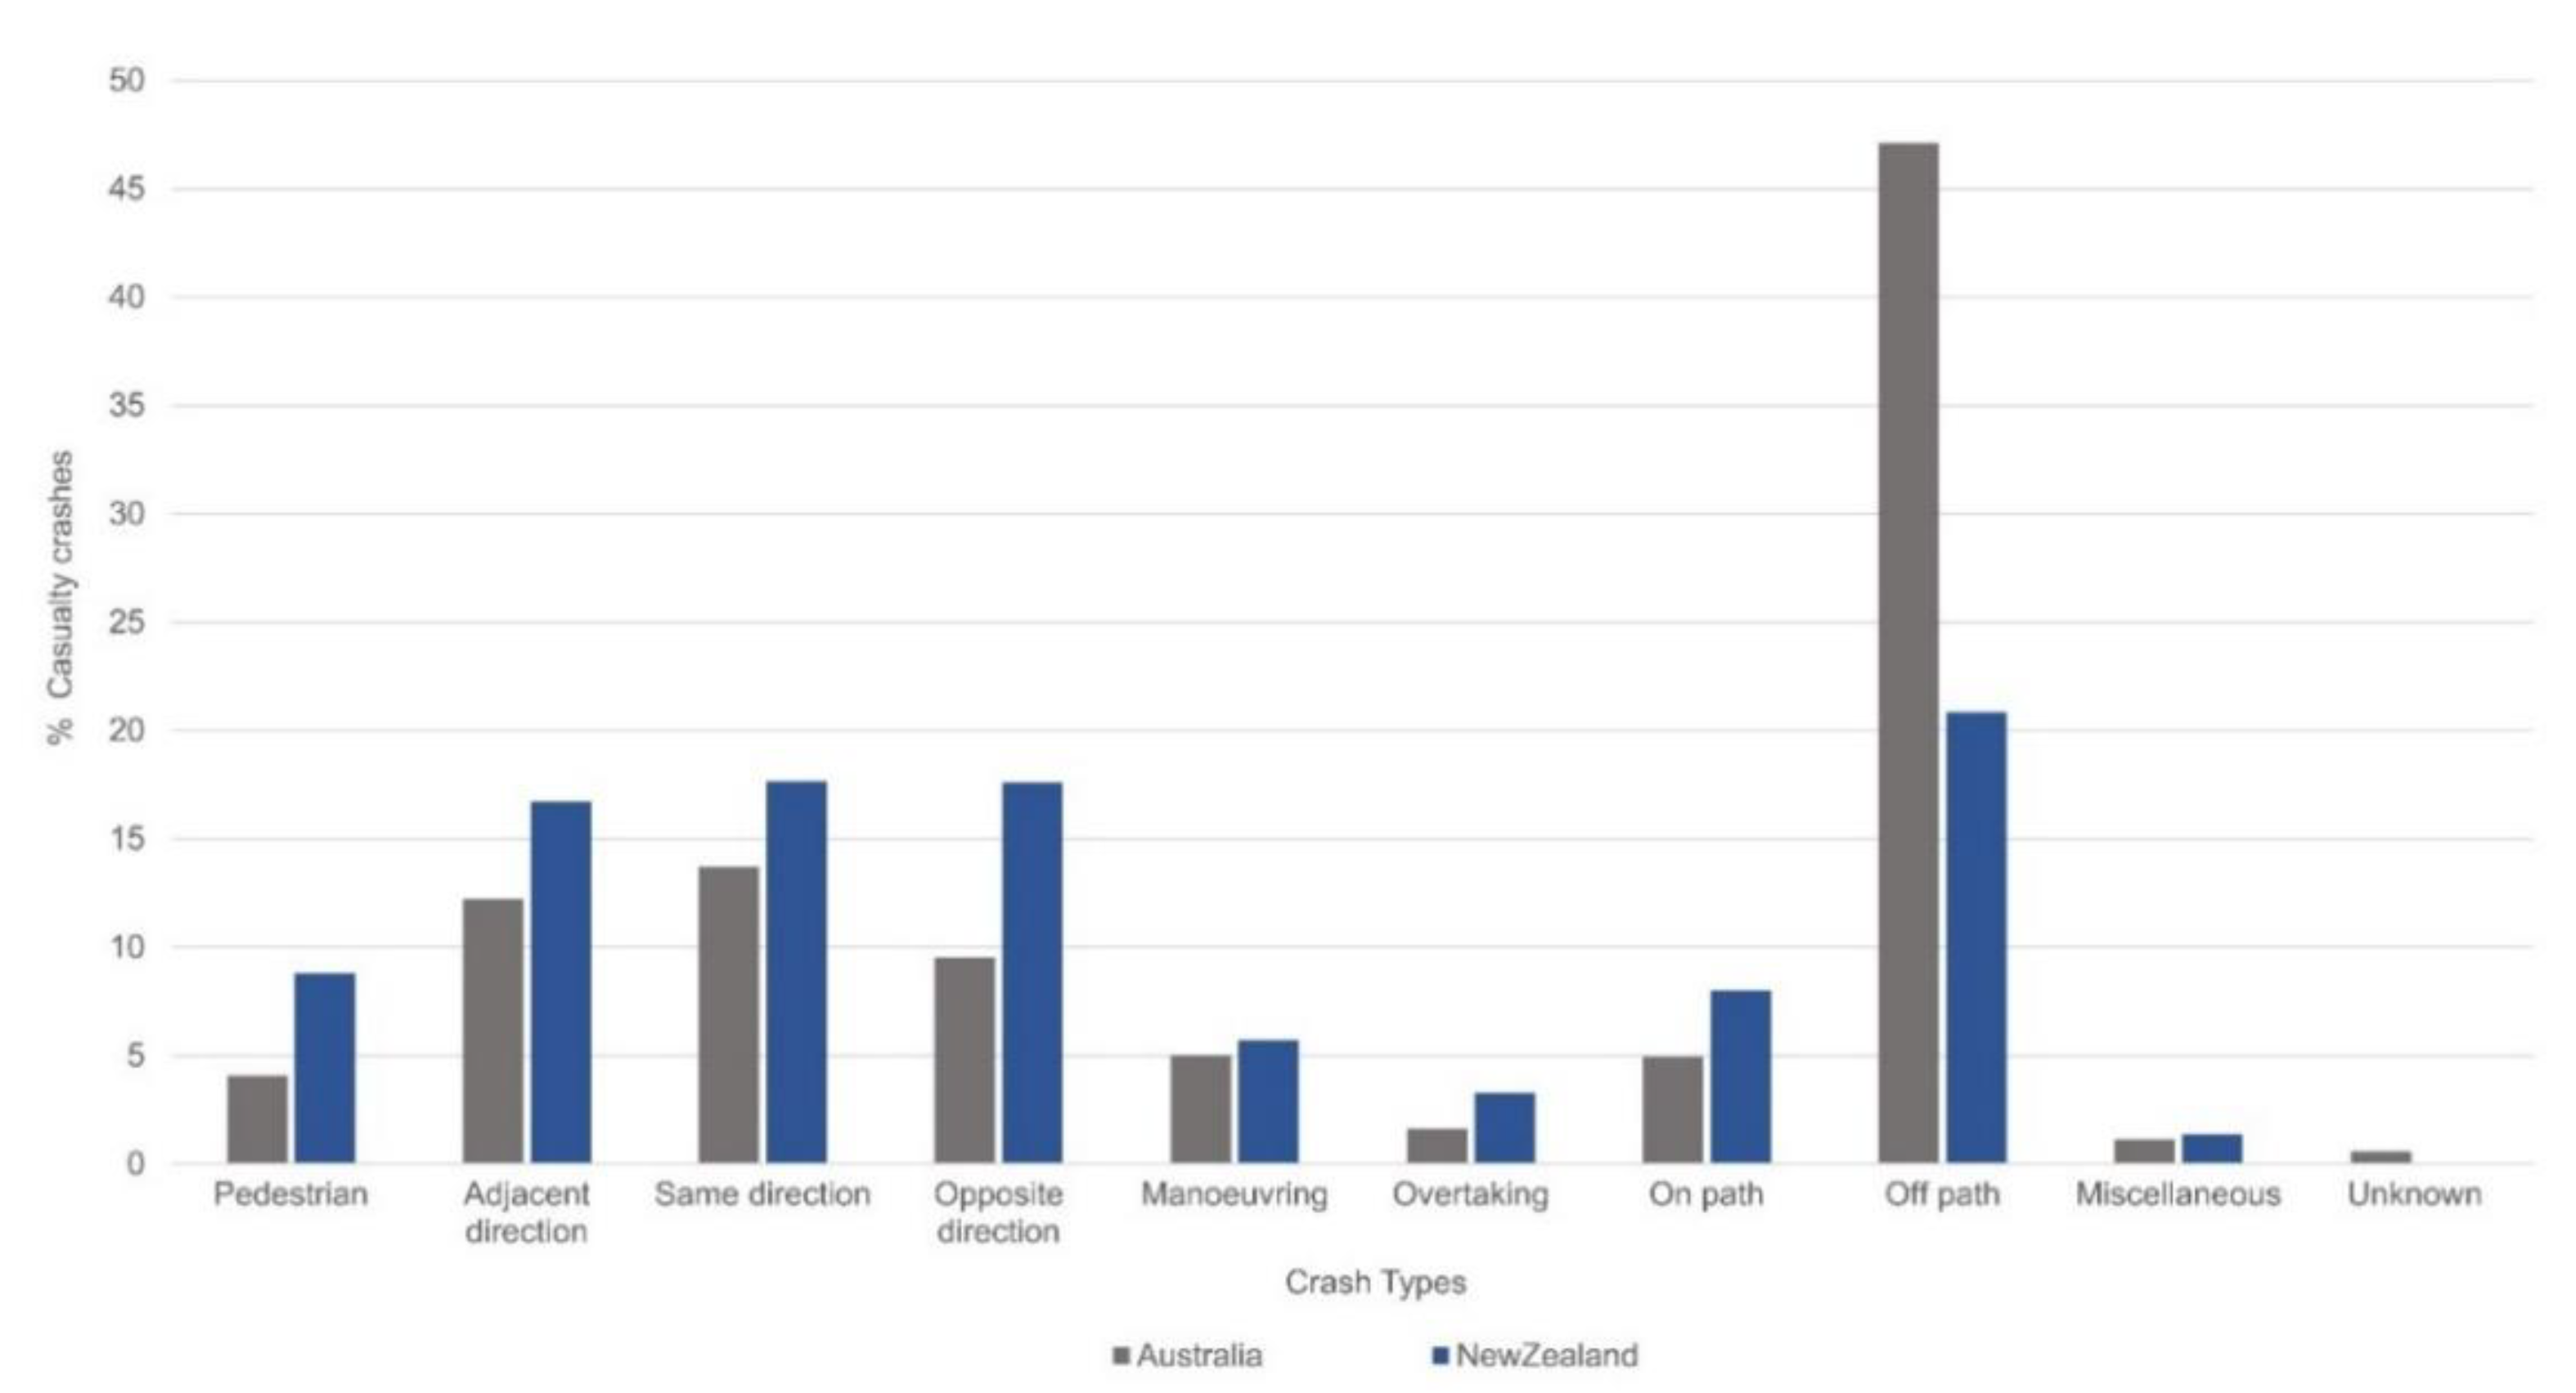
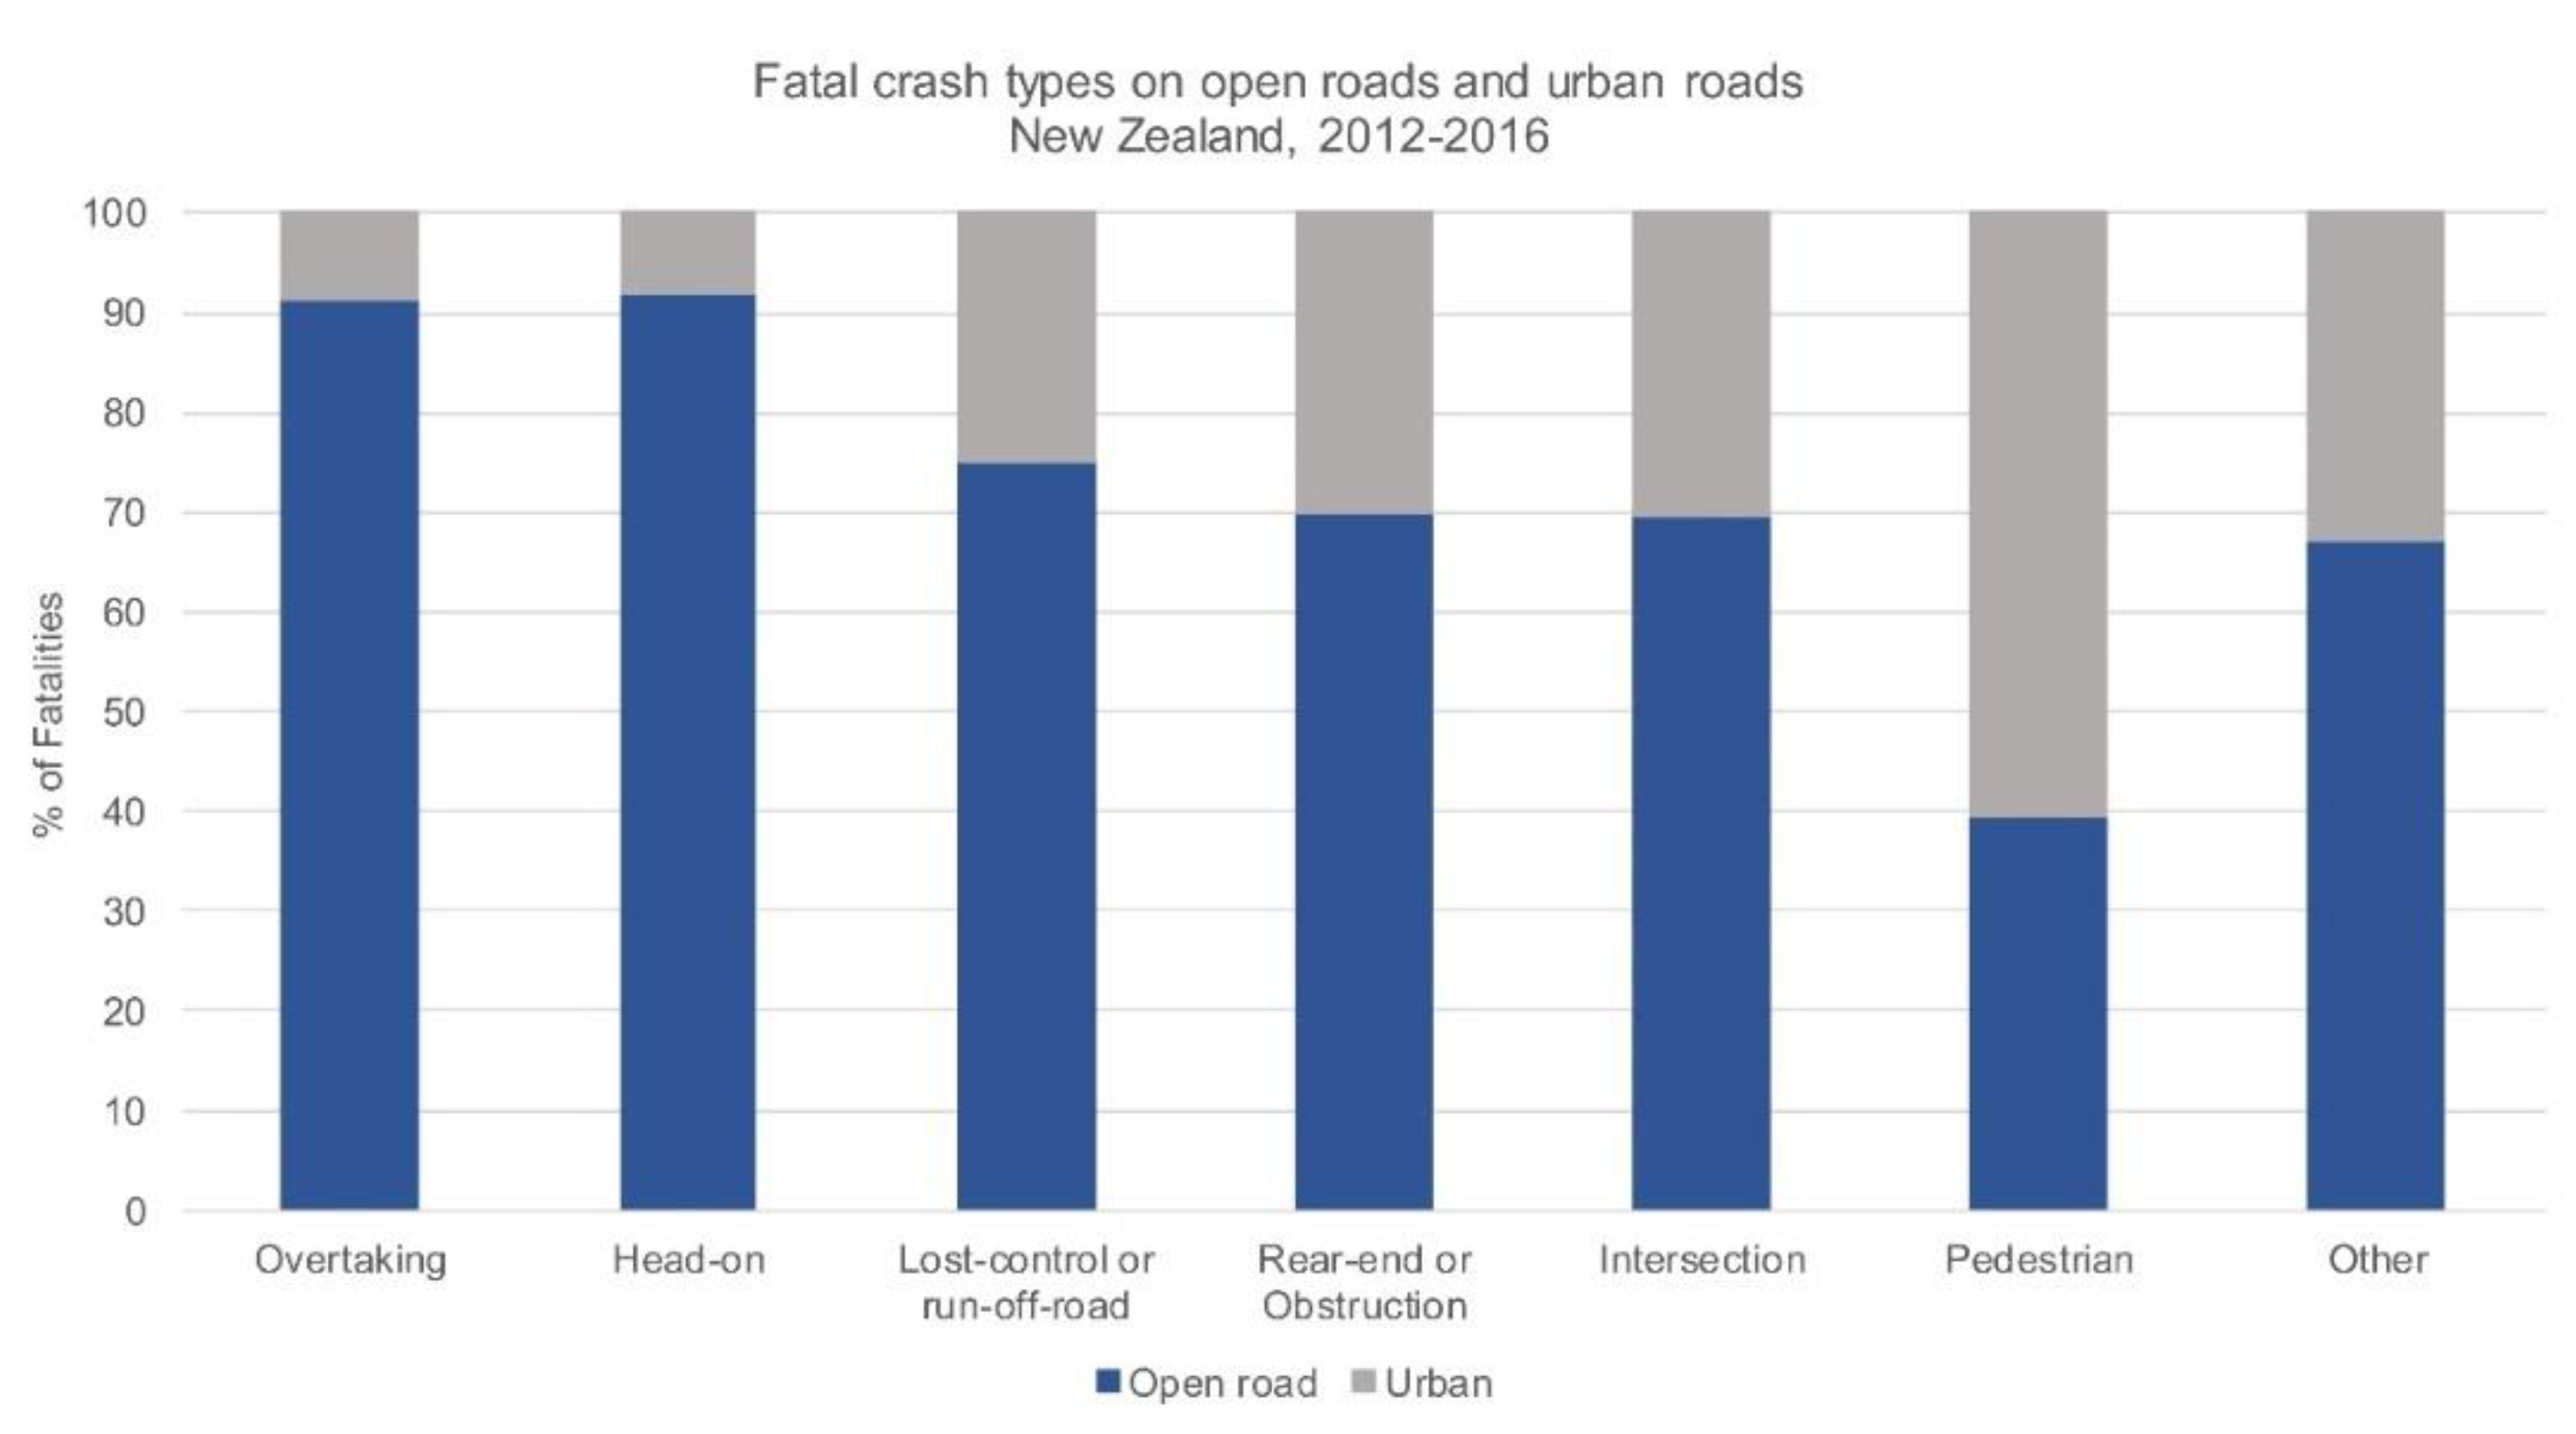
3.3. Fatal Crashes by Crash Type

Fatal impact configurations in Australia and New Zealand could not be distinguished using the BITRE Australian Road Deaths Database or the New Zealand Transport Agency’s CAS database and therefore, fatal impact configurations by remoteness level could not be identified. While this data is recorded by road and traffic authorities within each Australian state and by the New Zealand Transport Agency and can be accessed via private application, this was outside the scope of this research which is solely based on publicly available data sources. Instead, fatal crash types across Australia (2013–2017) and New Zealand (2012–2016), independent of remoteness level, are presented in Figure 4. Data on fatal crash types in Australia and New Zealand were obtained from reports published by BITRE [6] and the New Zealand Transport Agency [70] respectively.
Loss of control crashes were responsible for the majority of fatalities in New Zealand (40%) and Australia (35%). Lane keep assist technologies with the aid of autonomous emergency braking, electronic stability control and traction control technologies are likely to prevent such crashes, should the correct infrastructure be present. While head-on impacts accounted for 27% of the fatal crashes in New Zealand, cross-traffic or intersection crashes were responsible for many of the deaths in Australia (22% of fatalities).
Figure 5, reproduced from Austroads (2019b) with permission, compares casualty crash types in regional and remote Australia and New Zealand (p < 0.0001). Here, data has not been restricted to fatal crashes. Consistent with the data in Figure 4, off-path crashes (often resulting from loss of control) appear to be the most frequent, being almost three times greater in proportion in Australia than the second most frequent crash type in Australia (same direction crashes), and almost double the proportion of off-path fatal crashes in New Zealand. Based on Figure 4 and Figure 5, it can be assumed that in New Zealand, a greater number of fatalities (as opposed to casualty crashes) occur as a result of run-off road impacts (39% vs. 21%). While run-off road crashes were the predominant casualty crash type in regional and remote New Zealand, the percentage of casualty crashes resulting from other crash types was comparable to those occurring as a result of run-off road. While the proportion of adjacent direction (right-hand against turns/cross traffic crashes), same direction (rear impacts) and opposite direction crashes (head-on impacts) were roughly equal across both countries (approximately 10–15% in Australia; 15–20% in New Zealand), the proportion of pedestrian crashes in remote and regional New Zealand was double that seen in remote and regional Australia.
Predominant crash types were also identified in rural and urban New Zealand by the New Zealand Transport Agency using the ‘urban road (speed limit ≤ 70 km/h) vs. open road (speed limit > 70 km/h)’ definition (presented in Appendix A, Figure A3). Using this alternative definition, there were three times as many loss of control crashes on open roads compared to urban roads, and almost 14 times as many head-on crashes on open roads compared to urban roads. Independent of the analysis method used, loss of control crashes and head-on crashes appear to be the predominant crash types in remote and regional areas or ‘open roads’, where speeds are high, and the biomechanical tolerance of humans are compromised.

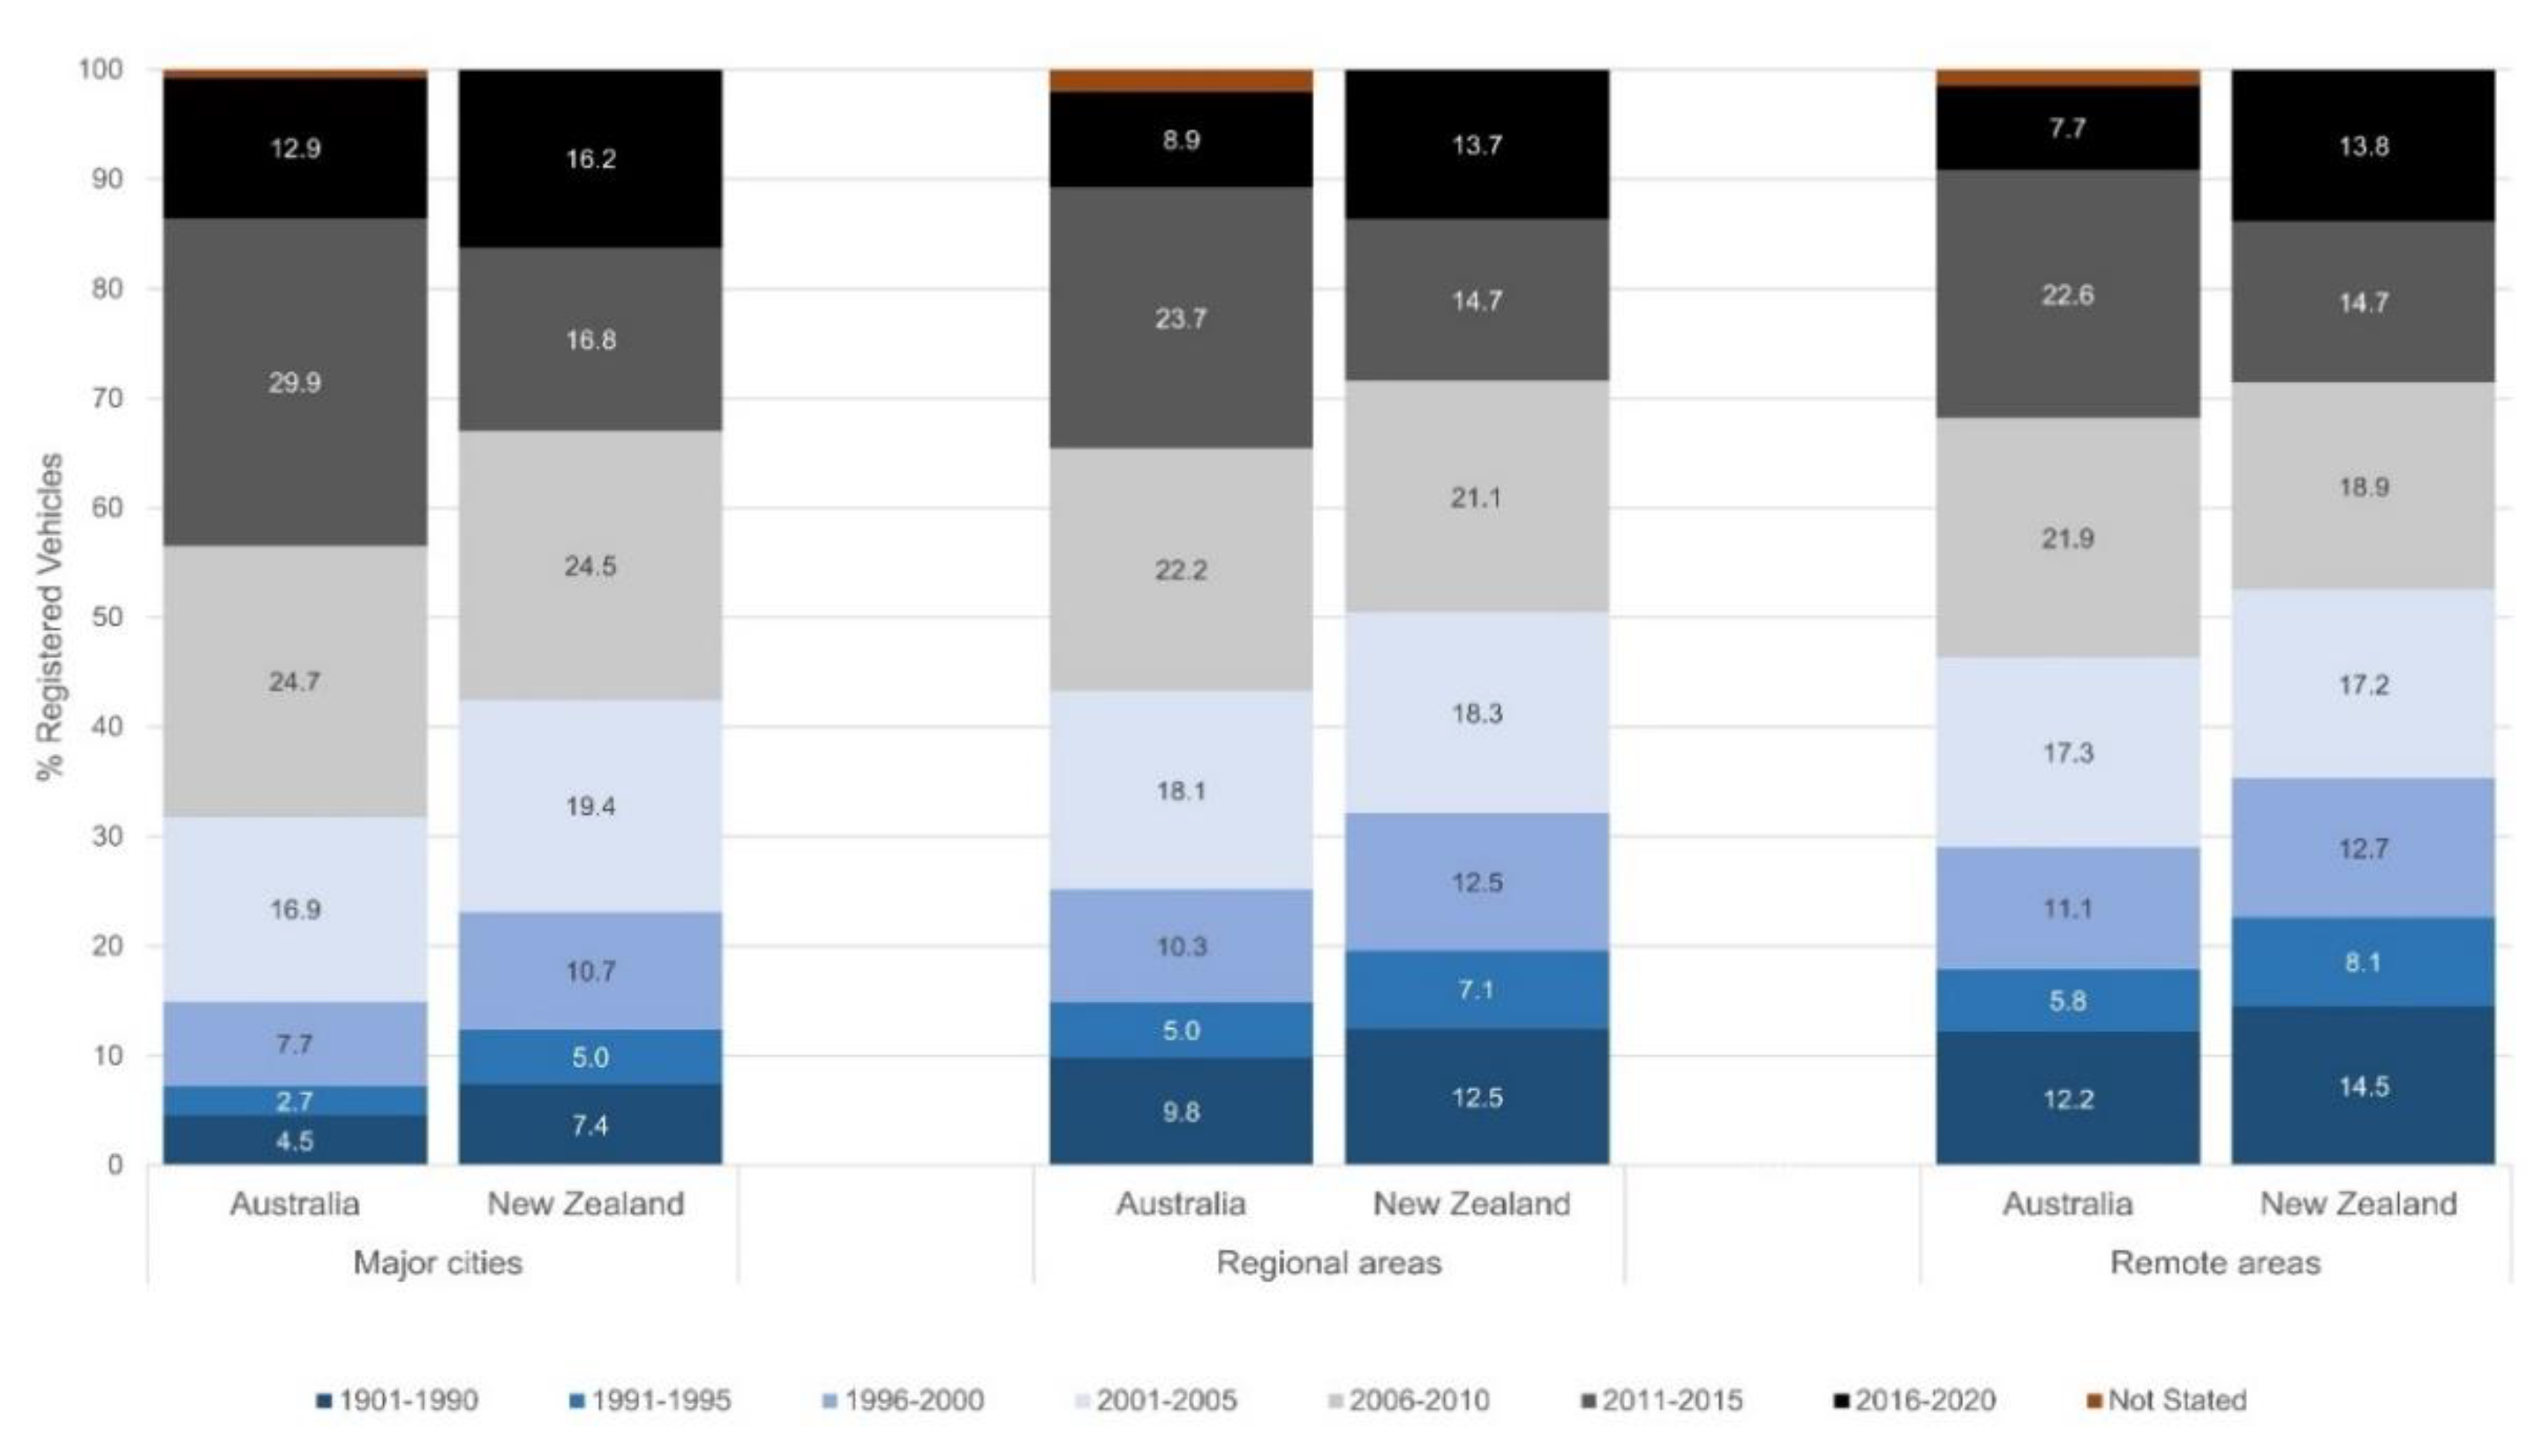
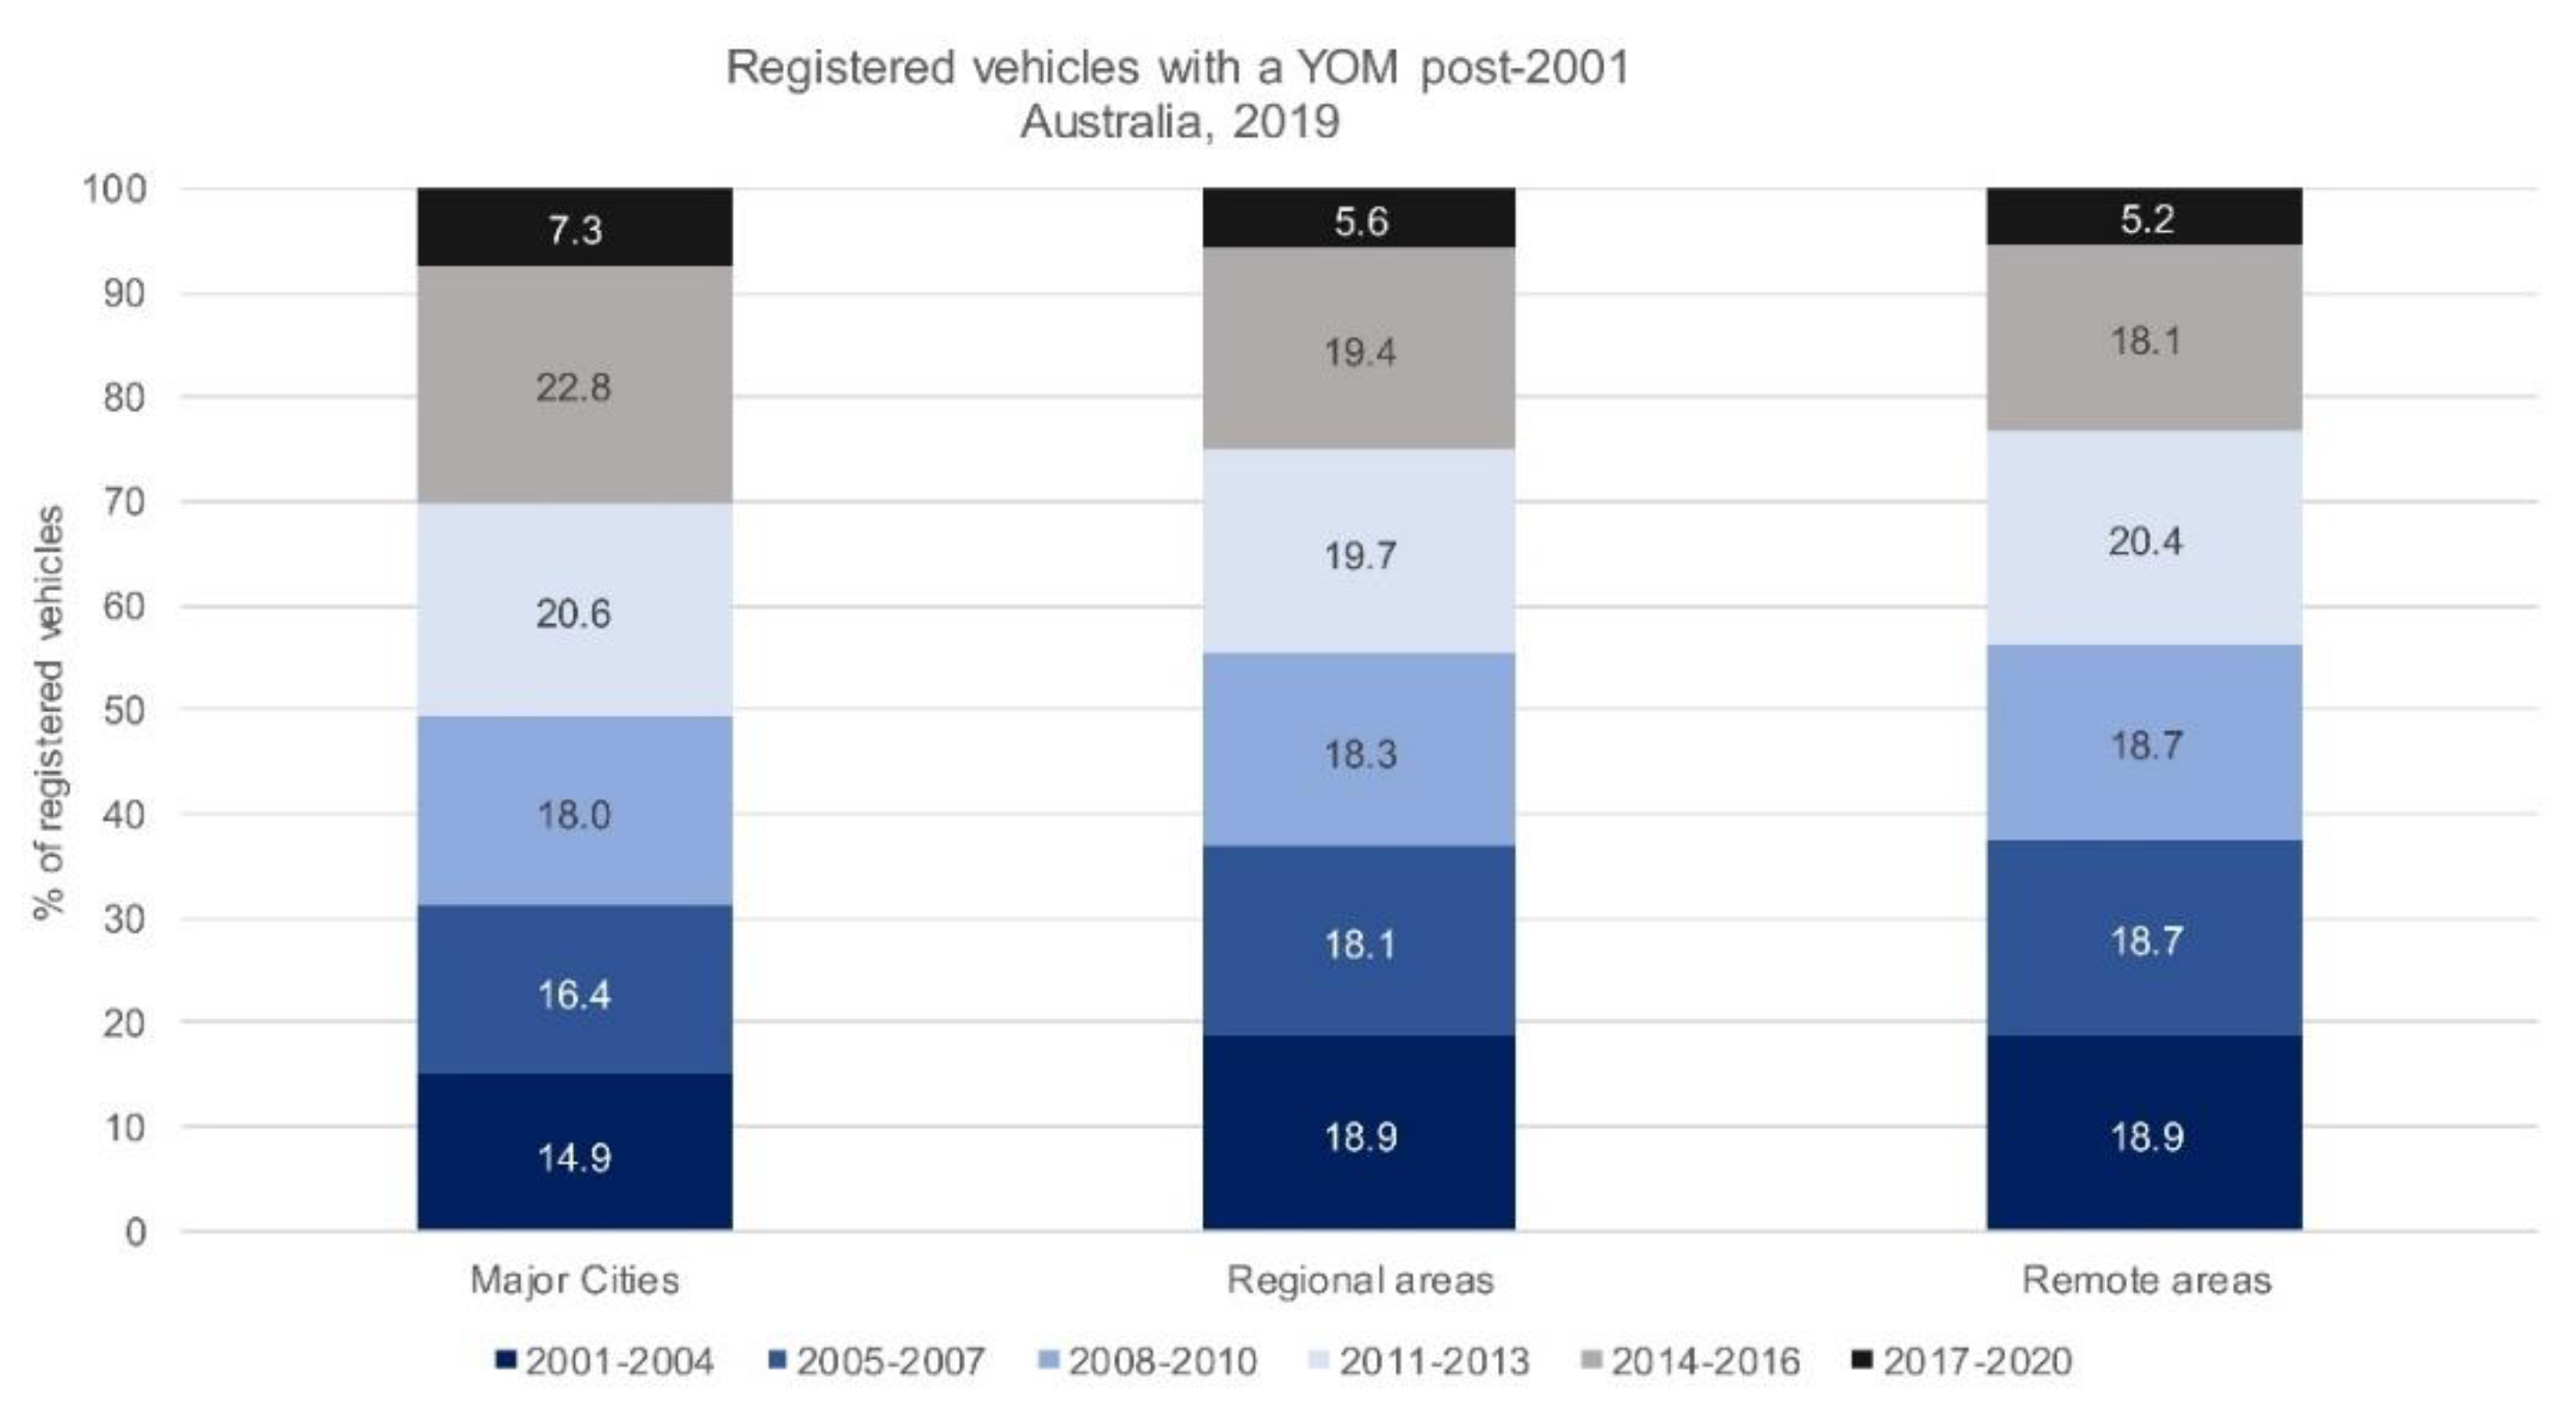
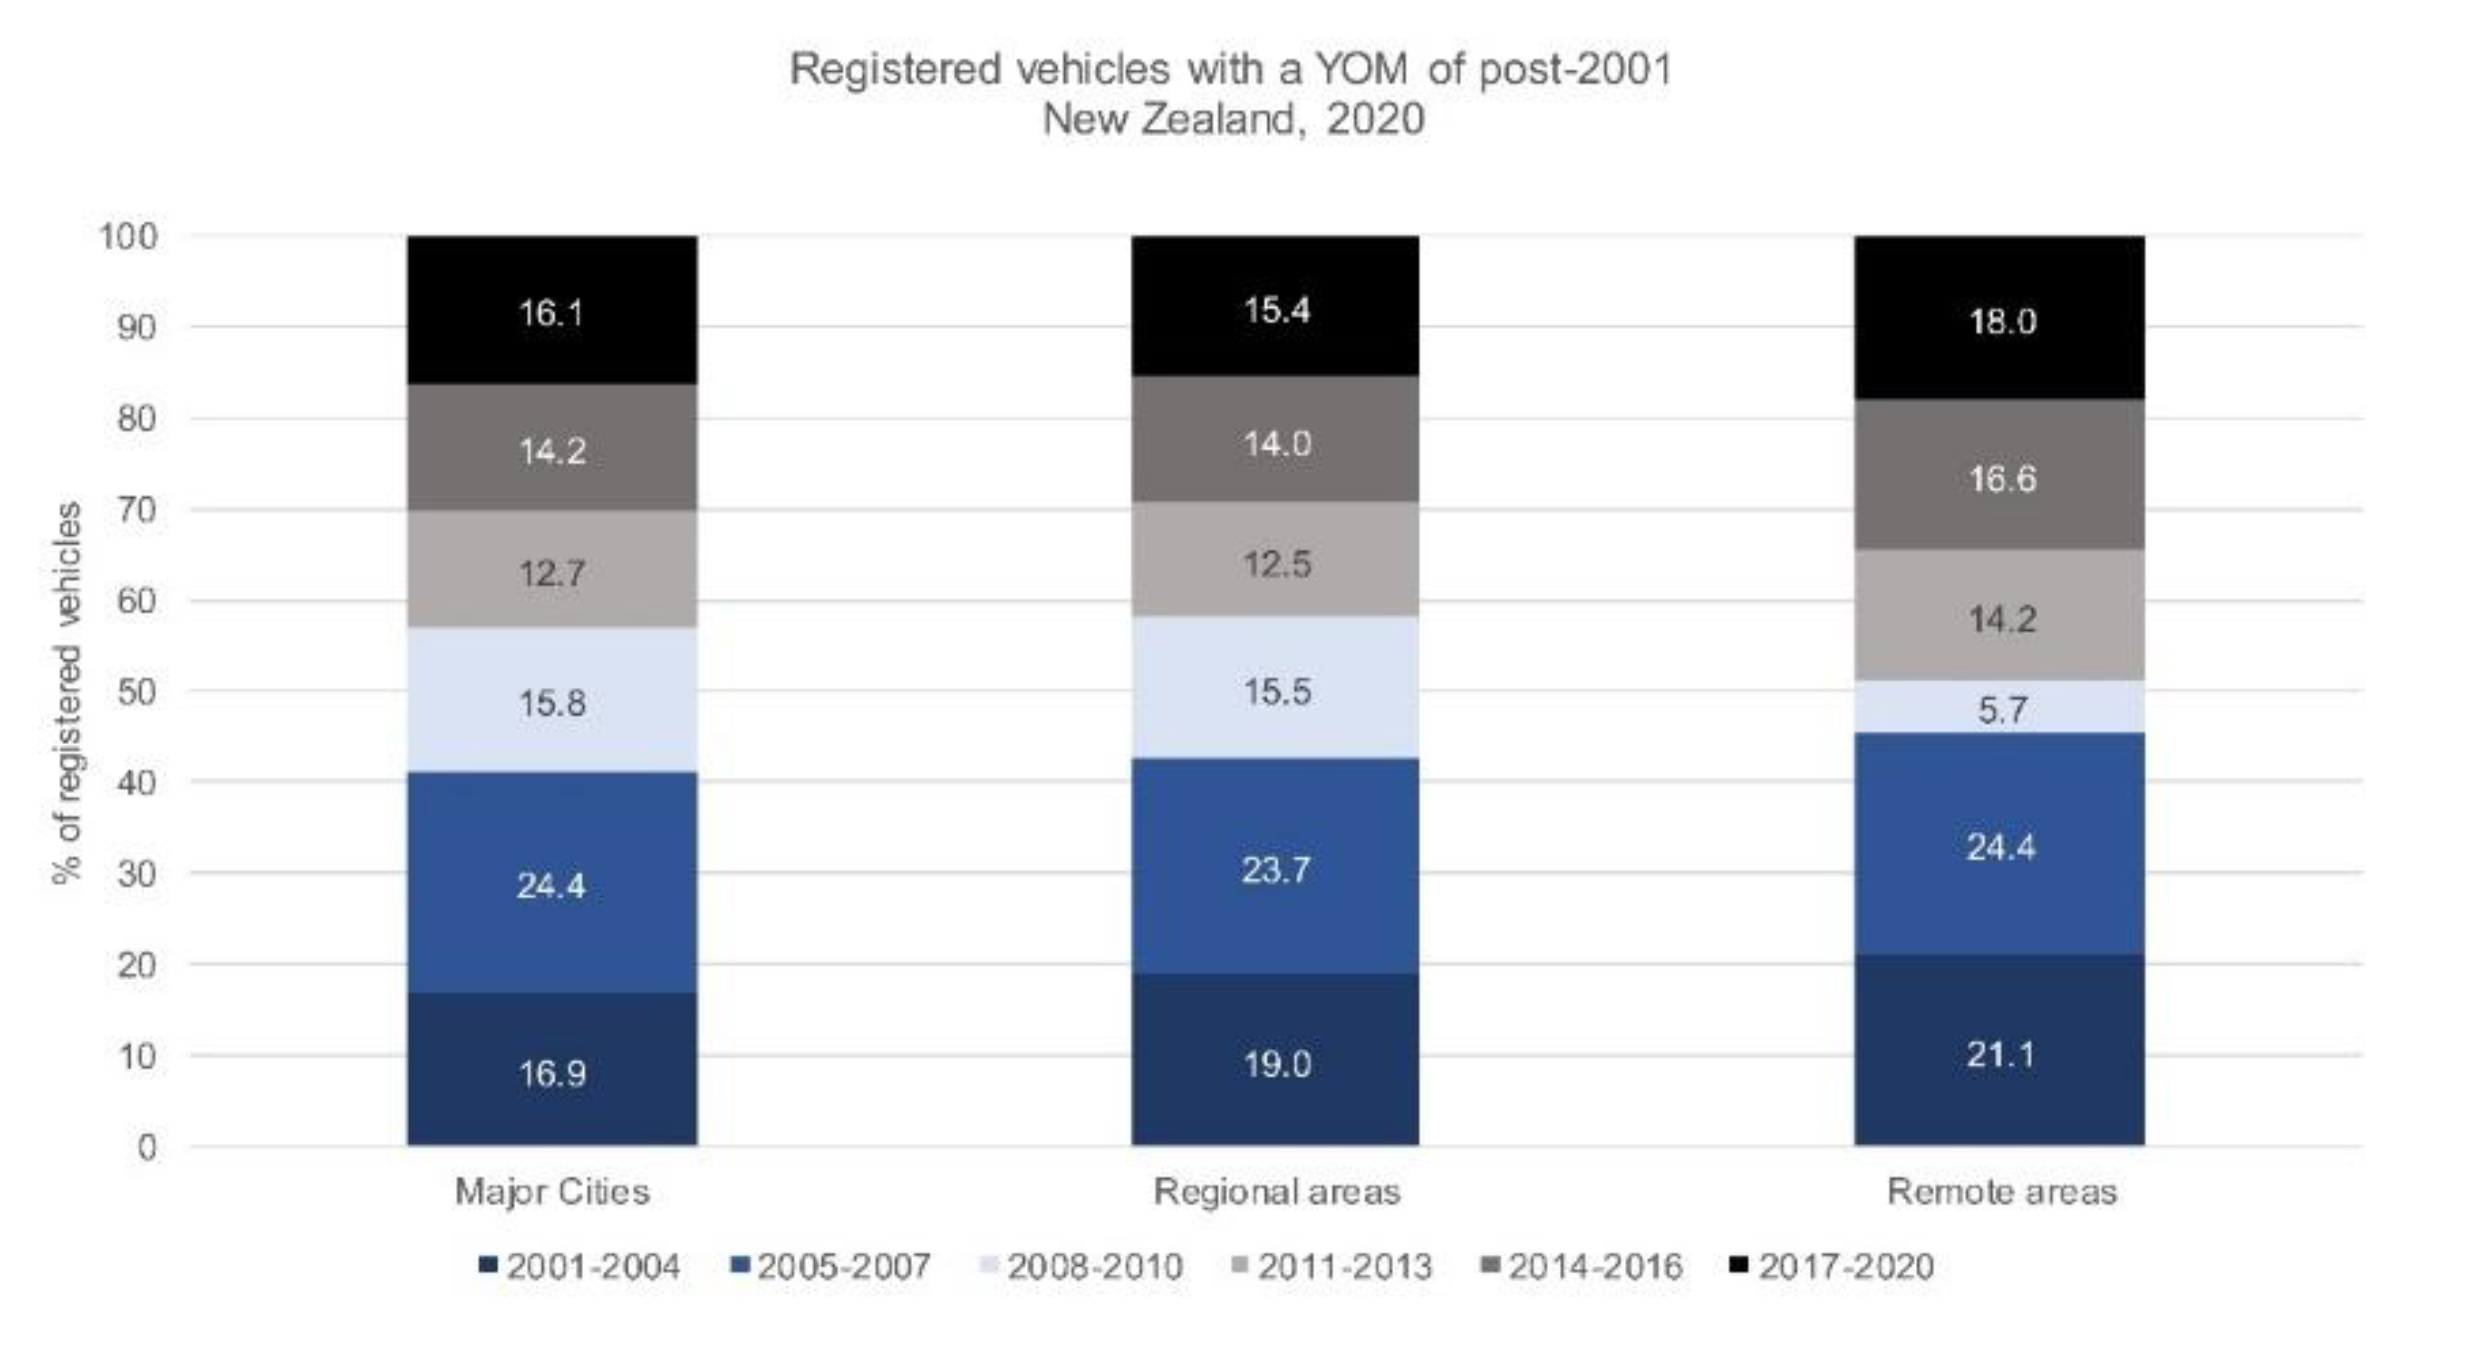
3.4. Vehicle Fleet Data

Despite vehicle safety technologies improving annually, road trauma statistics are not [16]. With the average age of the vehicle fleet in Australia being 10.1 years [71] and New Zealand being 14.4 years [12], the deployment of the new safety technologies is not as widespread as it could be.
According to the 2018 Australian Motor Vehicle Census [56], of the 22.8 million vehicles registered in Australia (including vehicle types not otherwise included in publicly reported registered vehicle counts), 64% of all vehicles were registered in major cities, while 33.6% were registered in regional areas in Australia and 2.4% were registered in remote Australia. Figure 6 presents a distribution of registered vehicles by remoteness and year of manufacture (YOM) in Australia and New Zealand. Within Australia, in major cities, while 15% of vehicles have a YOM date pre-2000, in regional areas and remote areas, 25% and 29% of all registered vehicles were manufactured pre-2000. Conversely, while 42% of vehicles registered in major cities were manufactured in or after 2011, only 30% of registered vehicles in remote areas were ‘new’. A more refined breakdown of YOM (for vehicles manufactured post-2000) is presented in the Appendix A (Figure A4 and Figure A5). The data shows ownership of newer vehicles by residents in regional and remote areas is comparable to their city-dwelling counterparts.
Year of manufacture trends in New Zealand are similar to that in Australia (Figure 6). While 23% of vehicles in New Zealand’s major cities were manufactured pre-2000 (compared to 15% in Australia), over 32% and 35% of vehicles in regional and remote New Zealand were manufactured before 2000 (compared to 25% and 29% respectively in Australia’s regional and remote areas). In New Zealand, a greater number (i.e., 2.4% more) of newer vehicles (YOM 2016–2020) were registered in major cities compared to remote areas. Most surprising was that there were a greater percentage of vehicles with a YOM 2006–2015 in major cities (41.3%) compared to regional areas (35.9%) and remote areas (33.6%), indicating that even though there is a greater percentage of older vehicles in regional and remote areas, there is a greater percentage of ‘not so new vehicles’ (i.e., 5–15 years old) in major cities (p < 0.0001). Interestingly, a more refined breakdown of vehicles manufactured post-2000 in New Zealand (Appendix A, Figure A5), shows that 18% of vehicles registered in remote areas have a YOM 2017–2020, while only 16.1% in major city areas are this new. Remote areas have a greater percentage of vehicles manufactured after 2010 overall (49%) compared to major cities (43%).

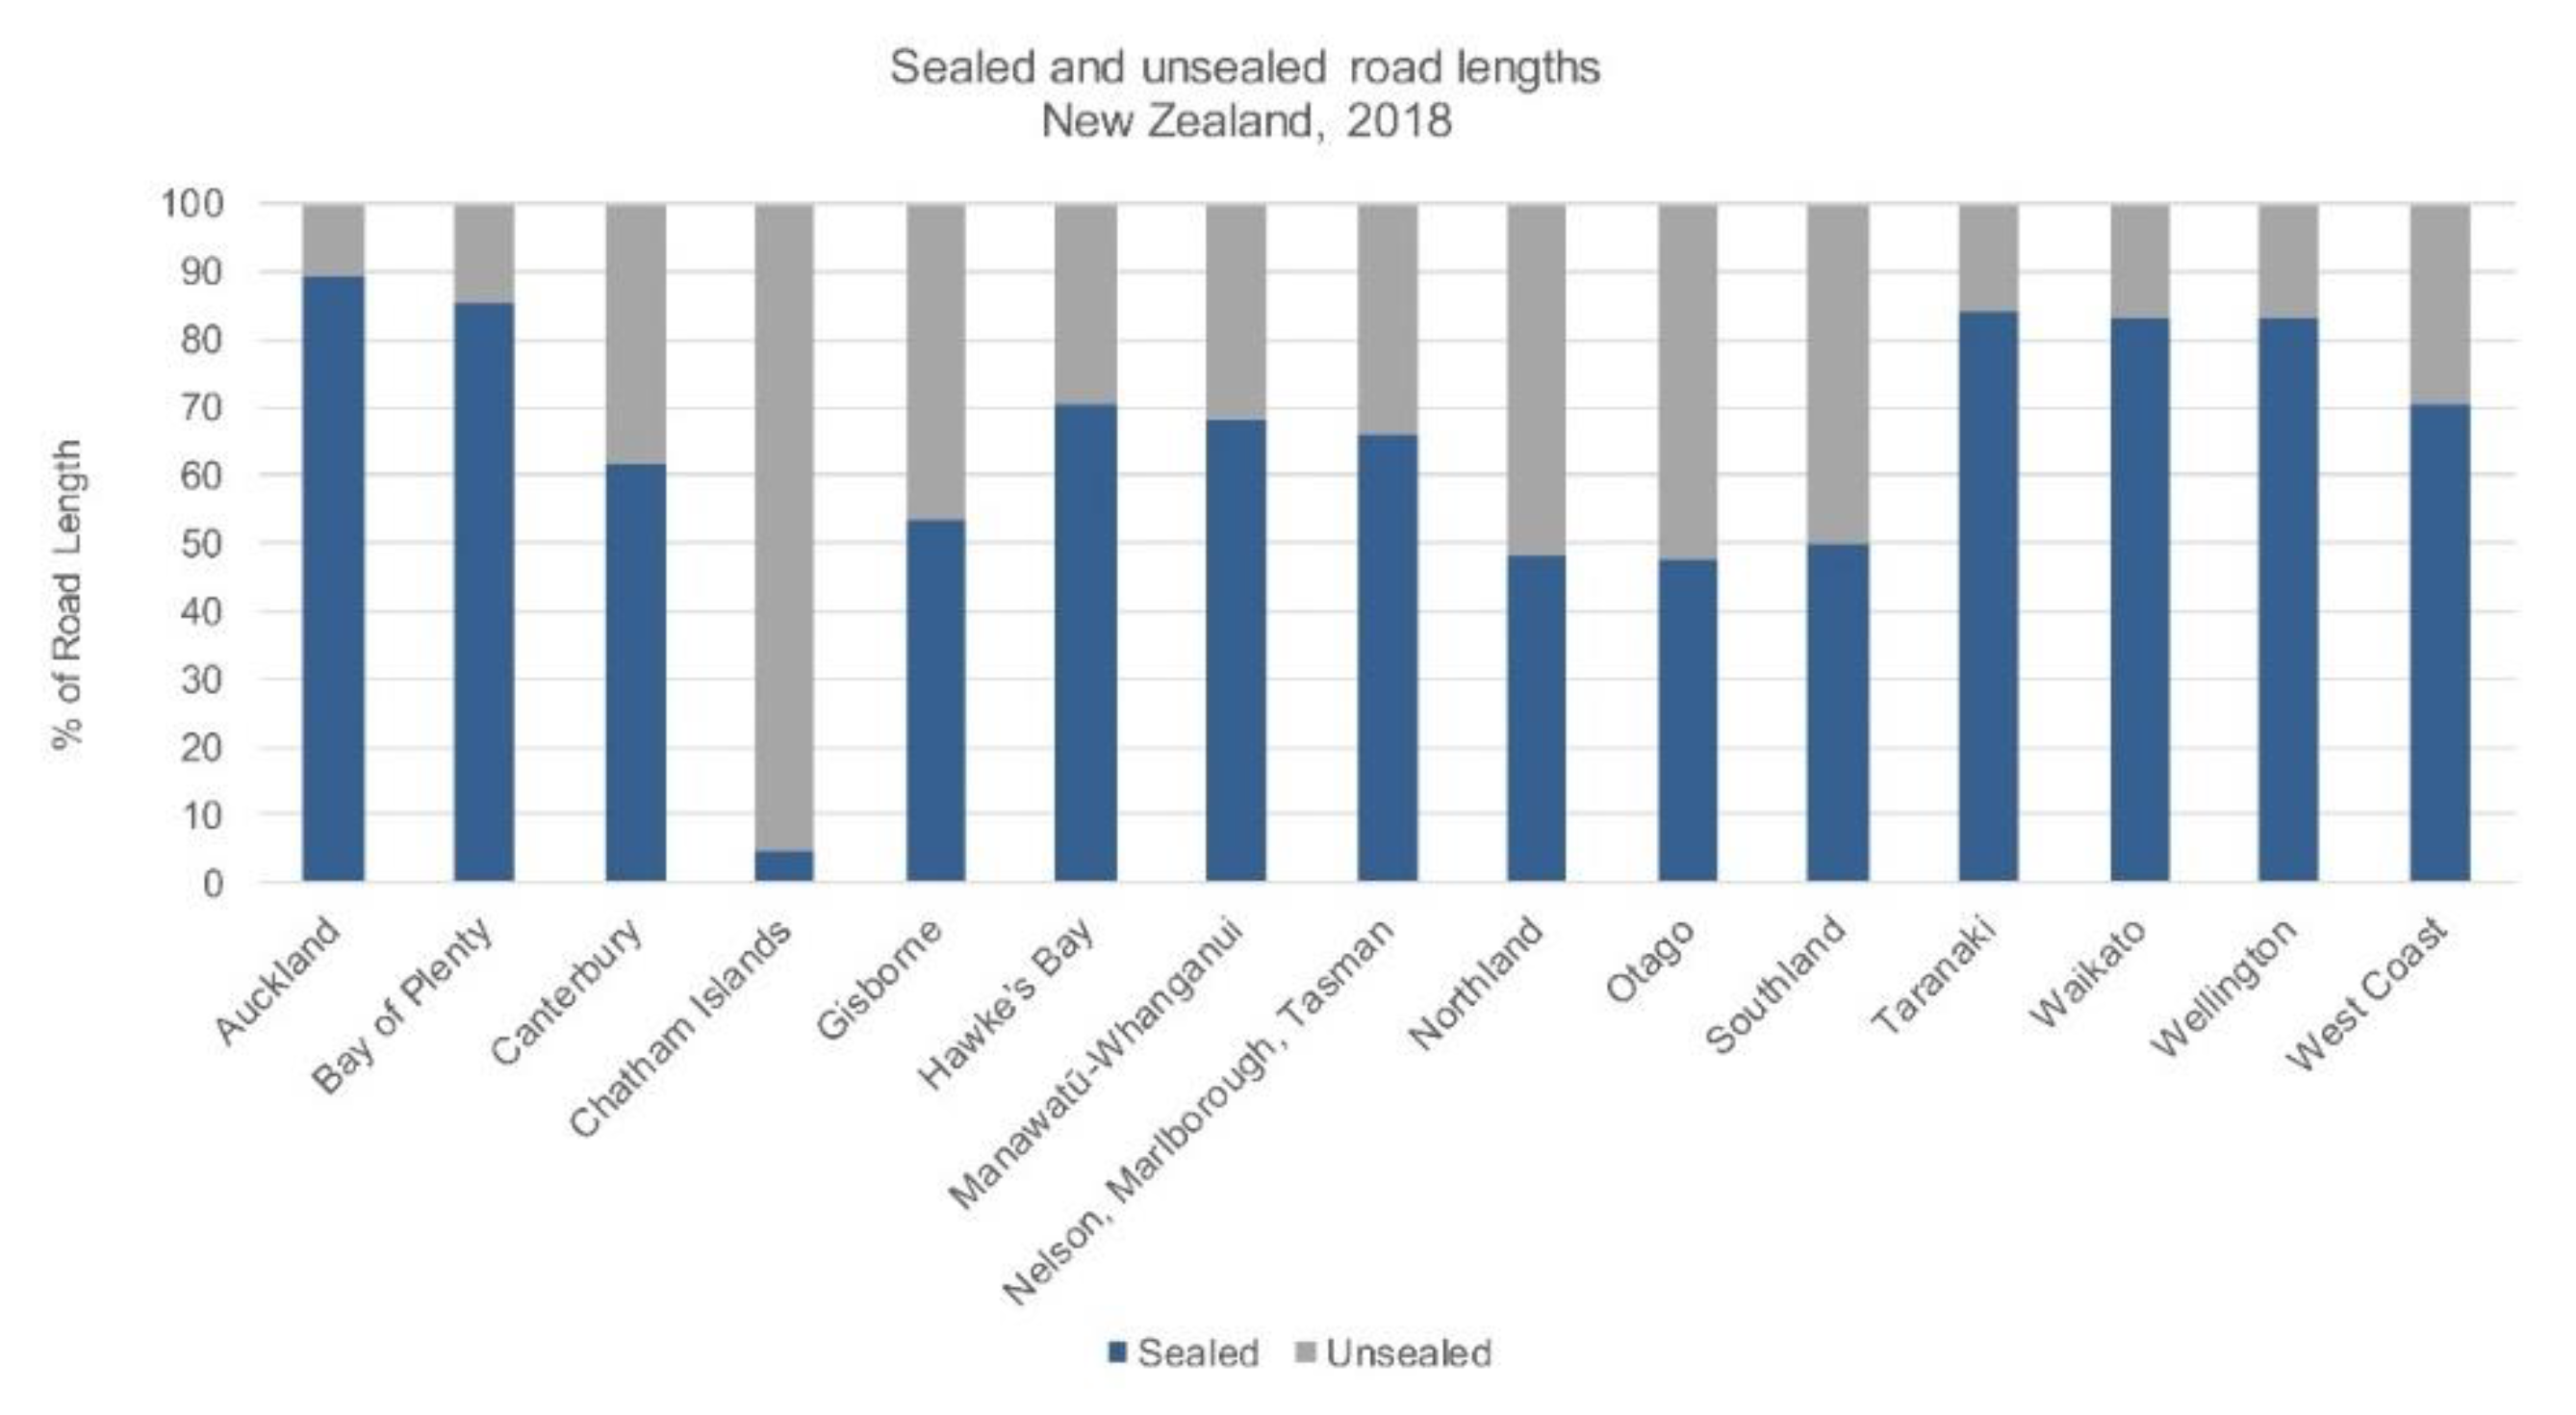
3.5. Road Infrastructure Data

Australia has approximately 877,000 km of roads, of which approximately 80–82% are rural [60,73,74]. In New Zealand, the road network consists of approximately 95,400 km of road length. The surface of these roads (sealed and unsealed) has been presented by region in Figure A6, Appendix A. In total, New Zealand has close to 64,200 km (67%) of sealed roads and 31,200 km (33%) of unsealed roads [58]. Table 6 presents road lengths by road use and road type in New Zealand. While almost all of New Zealand’s highways and local (urban and rural) roads were considered sealed, 35% of local roads were unsealed. No data could be found regarding the quality of bitumen on “sealed roads”, or the degree of sealment. In New Zealand, 524 km of the entire state highways were divided carriageways, or roads with a guardrail, concrete barrier or wire rope barrier in the median [75]. No data was available regarding the length of rural roads which were physically separated specifically, or data on local roads.
Data pertaining to road quality by remoteness level was not available for Australia and so sealed and unsealed roads in major cities could not be compared to figures in regional and remote areas despite the importance of this in determining Australia’s preparedness for autonomous vehicles. A breakdown of road type in urban and non-urban areas is presented in Table 7; these data have been obtained from BITRE [59] and confirmed using data sourced independently from various state road authorities.
Data suggests that of the 877,651 km of road length in Australia, highways, arterial roads, and busways make up only 26.7% while local roads make up the remaining 73.3%. Table 8 shows that the majority of roads in Australia are not sealed or paved.
No data could be found specifically relating to road characteristics of regional and remote roads in Australia. Further to this, no data could be found from New Zealand nor any state in Australia regarding the state of road delineation. When road authorities were contacted, they suggested that edgeline data is often not collected, or if a road is sealed, it can be assumed to be delineated. Applying this assumption means that only 1.3% of the Australian road network is fully sealed, delineated and physically separated while up to 42% of roads are sealed and potentially delineated (but may not be physically separated).

3.6. Predicted Benefits of Autonomous Vehicles and ADAS Technologies

Autonomous vehicles and ADAS technologies are predicted to bring about great societal gains. In 2010, the Insurance Institute for Highway Safety predicted that nearly a third of crashes and fatalities could be prevented if all vehicles had crash avoidance technologies such as forward collision and lane-departure warning, blind spot assist, and adaptive headlights [77,78,79]. Various estimates of the potential benefits of ADAS technologies have since been released. Forward collision systems, for example, have been estimated to prevent up to 27% of rear end impacts [80,81] while lane departure warning systems are estimated to reduce crashes by up to 26% [82] and intersection assist is predicted to prevent up to 23–59% of straight crossing path crashes [83]. Such estimates are based on assumptions regarding the rate of penetration of autonomous vehicles, the level of automation (SAE 0–5), the existing crash type data relevant to the specific country in discussion, and their roads having the appropriate infrastructure to support the technologies [81,84,85,86,87]. Table 9 outlines the predicted reduction of various crash types that are currently observed in Australia and New Zealand. The reduction values used here were made by EuroRAP using Great Britain crash data, and the predicted gains are based on the assumption that half of the vehicles in the fleet are completely autonomous, and all roads (rural and urban) are supportive of new technologies [47]. The higher end of the predicted benefit range has been used for the estimates. In regional and remote Australasia, run-off road impacts, head-on impacts and intersection crashes were the most frequently occurring fatal crash types. Based on the crash reduction figures, road trauma in regional and remote areas are likely to benefit most from ADAS technologies.

4. Discussion

This review set out to quantify the extent of road trauma in Australasia and determine the extent to which ADAS technologies can be of benefit to road users in light of the current road network. Over 70% of roads in Australia were found to be local roads and at least 50% of the almost 880,000 km network were composed of gravel or formed sections. Data relating to bitumen quality or delineation availability, and the quality of the paved sections of roads in Australia and New Zealand, could not be immediately sourced and this compromised the ability to accurately quantify Australasia’s preparedness for not only the available suite of ADAS technologies, but autonomous vehicles. Despite this, predicted gains from new vehicle technologies in Australasia, and globally, almost always assume high quality roads and good infrastructure. The implications of such predictions need to be intrepreted with care, particularly in regional and remote areas where crash rates are high, infrastructure is often absent, and data is sparse. Fatal crash type data, viewed with respect to limited road infrastructure details, suggest that the overrepresented trauma levels in regional and remote areas are at least partly due to the roads in these regions being of poor quality and being incapable of physically separating vehicles from roadside objects or oncoming traffic. Precise road data collected in view of emerging vehicle technologies are urgently needed. It is only with high quality data that effective and intelligent infrastructure investment can be made in order to reduce the disproportionate road trauma burden observed in regional and remote Australasia.

4.1. Death Rates in Urban vs. Regional Areas

This study confirmed that road deaths in regional and remote Australasia are grossly overrepresented. Regional and remote areas are typically sparsely populated with only 30% of the population in both countries residing in these areas, which make up 85% of Australia’s and 65% of New Zealand’s liveable land area [19,20]. These regions are typically characterised “… by fewer employment opportunities, higher costs of goods and services, poor infrastructure for public transport, communications, housing, poorer education and educational outcomes” [90,91]. For these reasons, road trauma rates in regional and remote Australasia are dire, with 6 times more people killed per 100,000 population compared to those in major cities (Table 5). New Zealand’s urban and regional fatality statistics are comparable. While it is acknowledged that regional and rural roadways are a global problem and not unique to Australasia [48,92,93], it is noteworthy that Australasia has one of the most expansive road networks, with the number of people per kilometre of road being one of the lowest amongst developed countries [94]. The expansive road network and disproportional population distribution has funding and policy implications, reflected in poor regional and remote road trauma statistics [95,96]. Either through funding, policy changes, road safety incentives or education, efforts should be made to close the gap that currently exists in disproportionate trauma trends between well-developed urban areas and substandard non-urban regions throughout Australasia.

4.2. The Role of Speed Zones

A more detailed analysis of fatal crashes by speed zone demonstrated that high speed crashes are particularly problematic in regional and remote areas. Specifically, over 70% of road deaths in Australia and almost 85% of deaths in New Zealand during the 5-year period investigated, occurred in speed zones of 90 km/h or above, a finding supported independently by New Zealand’s Transport Authority [97]. Gee (2019) noted that 87% of New Zealand’s roads have speed limits that are excessive for the road conditions: a concern equally noted by the most recent Austroads report on regional road safety [3,97]. Also concerning was that in Australia, of all deaths where speed zone was known, approximately one third (36%, n = 1310) occurred in zones signed at 70 km/h or less (independent of remoteness level); theoretically, the biomechanically tolerable travel speed in the presence of Safe System compliant infrastructure and 5-star rated vehicle design [27,28,98,99,100].
Two thirds (n = 918, 70%) of fatalities that occurred in zones signed 70 km/h (or less) in Australia, occurred in major cities where it is expected that infrastructure is Safe System compliant. Although it could not be determined how many of the fatal crashes occurred to occupants of 5-star-rated vehicles, the trauma figures highlight, firstly, the incompatibility between existing infrastructure and vehicle design, and secondly, that the Safe System framework on which Australasia’s road safety strategies are based is insufficiently implemented [101].
Therefore, independent of the potential benefits that ADAS technologies and autonomous vehicles are envisaged to bring, concerted efforts should initially be made to support the current fleet of conventional vehicles with a particular focus on Safe System compliant speed limit setting. Concurrent to this, new vehicle technologies should be optimised for high speed environments. Of the ADAS systems currently rated by vehicle assessment programmes, only speed assistance systems are tested at speeds of 100 km/h and above. These tests are conducted on high quality bitumen tracks, with good line markings and where street furniture can be clearly read by the vehicles’ sensors [102]. The ability of safety technologies to assist drivers at speeds above 70 km/h with limited infrastructure such as on regional and remote roads, is not well documented. These findings point to the need for an urgent review on Safe System compliant speed setting throughout Australasia, as well as for technological investments to ensure that emerging technologies perform optimally on high speed roads.

4.3. The Role of Road Delineation

The ability of autonomous vehicles and ADAS technologies to assist drivers at high speeds is paramount if road trauma is to decline given the existing speed limits. Analysis of Australasian crash data showed the majority of fatal impacts to be a result of ‘loss of control’, contributing to more than 35% of fatal crashes in both countries, a finding consistent with a recent more detailed analysis conducted by Keall and Newstead [103]. While several older publications, including those by Tziotis and colleagues [104] and Siskind and colleagues [105], make reference to the most prevalent crash types in rural and remote Australia being run-off road crashes (i.e., loss of control; off-path straight; off-path curve), Australasian data specifically highlighting rural crash types could not be sourced for this review. Instead, here we found that loss of control crashes and run-off road crashes were overrepresented overall in fatalities in Australasia.
Data published by Austroads regarding casualty crashes confirmed that in regional and remote Australia, ‘off-path’ crashes were the predominant crash type (47% of the annual average casualty crashes, 2012–2016). This trend was not seen in regional and remote New Zealand [3]. With poor delineation estimated to increase crash risk by up to 20% for conventional vehicles, improvements to road markings alone are likely to benefit all vehicles, independent of the automation level [47]. While lane keep assist technologies are likely to prevent run-off road crashes with the appropriate infrastructure available, the ability of such a technology to function at excessive speeds in the absence of well delineated roads could not be established. Therefore, while the loss of control crashes are most problematic nationally, in regional and remote Australia, the ability of ADAS technologies to prevent these at present will be limited, providing further impetus for investments to be made towards ensuring good quality delineation on all roads and again, high speed testing of emerging technologies.

4.4. The Vehicle Fleet in Urban vs. Regional Areas

A review of vehicle registration data demonstrated that new vehicles are entering the vehicle fleet at a similar rate across all levels of remoteness throughout Australasia (Figure 6), despite the socioeconomic differences that are perceived to exist between major cities and regional and remote areas. Here, it was demonstrated that the penetration of new vehicles into the fleet in regional and remote Australasia was (roughly) comparable to that of major cities, with an average difference in new vehicle ownership (YOM 2016–2020) of 4.6% and 2.5%, between those in remote and regional areas and those in major cities, in Australia and New Zealand respectively. More disconcerting, however, was that only 15% (approximately) of the major city dwelling population in Australasia (12.9% in Australia, 16.2% in New Zealand) during 2019 owned vehicles manufactured on or after 2016, where the inclusion of advanced safety features is more likely.
Passenger vehicles comprise over 75% and 85% of the national vehicle fleet in Australia and New Zealand, respectively [106,107], despite the Australian Government being urged to use levers to reduce the vehicle fleet age in light of the productivity, environmental and safety benefits that a younger fleet can bring [71]. Australia and New Zealand have one of the oldest fleets within the OECD countries with average vehicle fleet ages of 10.1 years and 14.4 years, respectively [56,71,107]. Further, given that the single most effective means of accelerating the uptake of vehicle safety technologies into a vehicle fleet is by reducing the average age of the vehicle fleet [50,71,108], it appears that Australasia has some time before the benefits of ADAS technologies and eventually, autonomous vehicles, can be realised on both urban and rural roads in the absence of special attention and investment.

4.5. Availability of Road Infrastructure Data

The most surprising finding in this review was the lack of road infrastructure data collected and maintained by road agencies, particularly regarding the length and location of roads with delineation, the quality and level of delineation, road bitumen quality and the quality and adequacy of signage. Based on publicly available data, it could not be ascertained what percentage of regional and remote roads in Australasia are sealed, sealed and delineated, and sealed, delineated and physically separated, compared to those in major cities—features critical for proper ADAS functioning and quantifying road readiness. The ability to obtain this data is hindered by the fact that there is no single custodian of this data at a national level, potentially due to the fact that there is no single national road classification system through Australasia, but rather, roads are being managed at Federal, State and Local government levels depending on the hierarchical classification of the road (ICSM 2006). Further, while the Australian Government assists with funding of key routes, road responsibilities are devolved to local government councils by States and Territories in Australia, both influencing and complicating how road quality is measured and recorded [94].
While research organisations are, at present, experimentally attempting to capture the adequacy of the Australian road network in preparation for autonomous vehicles [39,41,109], there is no single registry of the quality of roads on the Australasian network. This is despite the importance of high-quality road markings and signage for a future-ready road transport system, being highlighted in multiple international documents [48,49,110]. While organisations such as AusRAP and KiwiRAP map the trauma risks on major highways and motorways in Australia and on state highways in New Zealand, these programmes do not quantify the road infrastructure capacity for infrared, radar, LIDAR sensors and vehicle cameras to function optimally on the road network. A unified, national approach for collecting and recording high quality road and infrastructure data is paramount if the Australasian road network is to prepare for autonomous vehicles.

4.6. Study Strengths and Limitations

This is the first review, to our knowledge, to use existing road trauma and infrastructure data to ascertain Australasia’s preparedness for advanced driver assist technologies and vehicle autonomy. While studies have attempted to quantify the future benefits of ADAS technologies [111,112,113,114,115,116,117] and autonomous vehicles [118,119,120], none of these investigations have considered the suitability of the entire road network with respect to the vehicle technologies. This review is also the most current investigation of road trauma on regional and rural roads in Australasia.
The findings in this review are subject to two noteworthy limitations; the use of publicly accessible data and the definitions of remoteness that were used to compare urban with rural trends. First, while various agencies were approached for data, it was not the intention of this review to seek data which required data agreements. Therefore, this study was not able to determine which specific infrastructure measures were lacking at the fatal crash locations. More comprehensive fatality and serious injury data would have added a valuable dimension to this research, particularly regarding the road quality at crash sites. Second, the comparisons made between remoteness levels are limited by the definitions of the remoteness levels used in Australia and New Zealand. There is not an internationally recognised definition of what constitutes a rural area. Rural areas are often considered to be residual locations excluded from the urban definition [121]. Speed limits [122,123,124], population counts [1,125], road function [126] and other definitions [3] have been used elsewhere to distinguish urban from rural road networks. Here, the five remoteness areas classified by the ARIA index were used to describe levels of rurality in Australia [52], while in New Zealand, population counts and TLAs were used where possible, or if necessary, a 70 km/h speed limit was used as the threshold to identify urban and rural road statistics [124]. Neither of these classification systems ensures that remoteness is accurately quantified consistently as there are anomalies due to road conditions not always being reflective of the population within a town; the varying quality of roads; the serviceability of the roads; and its distance to goods and services [91,127]. The comparisons made between remote, regional and major cities throughout this review, should therefore be intrepreted with some caution, given that the true remoteness of an area may not be captured based on the definitions used.

4.7. Research Directions

Future research will focus on determining existing infrastructure at crash locations (using crash data) to gain a more comprehensive image of problematic regions within the Australasian road network, as well as determining how vehicle assessment protocols can better reflect all roads. Given their cost to society and importance in achieving NRSS targets, serious injuries will also be used as a measure to quantify trauma levels in future research. A more comprehensive understanding can thus be gained regarding the limitations associated with the road network, and infrastructure investments can be targeted accordingly to achieve the greatest reductions in deaths and serious injuries.

5. Conclusions

The results of this study demonstrate that Australasia’s road trauma problem is concentrated heavily in regional and remote areas, particularly in high speed regions where all road users are especially vulnerable. While concerted efforts need to be expended to improve regional and remote safety, the limited road infrastructure data available makes it a challenge to identify how and where investments should be directed to reduce the social and economic burden born as a result of rural road trauma. While new vehicle technologies and, in time, autonomous vehicles are predicted to bring significant road safety gains extending to remote and regional areas, the ability of these technologies to perform optimally on all Australasian roads needs to be verified. However, this is also hindered by the limited road and infrastructure data available at present, and so Australasia’s preparedness for autonomous vehicles cannot be readily quantified. Nonetheless, these limitations and those identified throughout this review can be overcome. Significant investment should primarily focus on establishing a uniform, national data collection and recording system whereby the quality of road bitumen, delineation details, and signage quality and consistency are noted, independent of remoteness level, road hierarchy or road management authority. Notwithstanding the difficulties associated with accessing expansive terrain in Australia and New Zealand, knowing road quality is the only means of accurately identifying the improvements that are necessary to reduce rural road trauma, prepare the road network systematically for ADAS technologies, and ensure that autonomous vehicles can perform optimally on all roads in both countries when they do arrive. While it is imperative that policy makers prepare Australasia’s roads and infrastructure for the anticipated penetration of autonomous vehicles, road authorities should review speed limit settings in regional and rural areas in light of the Safe System framework as an immediate means of reducing road trauma. Consideration should also be given to testing the suite of emerging technologies in high speed and sub-standard conditions, given that new vehicles are marketed, sold and driven in remote and regional areas where the roads are not always reflective of assessment conditions. At present, road safety gains predicted by new vehicle technologies need to be extended to remote and rural regions with caution. The establishment of a robust national road and infrastructure quality database is fundamental for ensuring that all of Australasia’s road network, and regional and remote roads in particular, benefit from the life-saving technologies that new vehicles promise, and that Australasia’s transport system is a sustainable one which caters for autonomous vehicles.

Author Contributions

Conceptualization, B.F., J.B.-G., B.C. and S.P.; methodology, S.P. and J.B.-G.; formal analysis, S.P. and J.B.-G.; investigation, S.P.; resources, B.F., J.B.-G. and B.C.; data curation, S.P.; writing—original draft preparation, S.P. and J.B.-G.; writing—review and editing, J.B.-G., B.F. and B.C.; visualization, B.F., J.B.-G. and B.C.; supervision, B.F., J.B.-G. and B.C.; project administration, S.P. All authors have read and agreed to the published version of the manuscript.

Funding

This research received no external funding.

Acknowledgments

The authors would like to acknowledge the contributions made by the statistical analysis team at the Australian Bureau of Statistics, Ministry of Health (NZ), the data custodians at the New Zealand Transport Agency, roads consultants and road data managers within each of Australia’s States and Territories, as well as Austroads for granting permission to use their data in this research.

Conflicts of Interest

The authors declare no conflict of interest.

Appendix A

Figure A1. Fatal crashes in regional and remote areas within Australia (01/2016–11/2019) and New Zealand (01/2016–06/2019), compared by speed zone. Australian fatal data from [49], accessed 14 January 2020 and New Zealand fatal data from [50], accessed 14 January 2020.
Sustainability 12 04347 g0a1
Figure A2. Fatal crashes in urban Australia (i.e., major cities) and rural Australia (regional and remote areas) compared with urban roads (speed limit ≤ 70 km/h) and open roads (speed limit > 70 km/h) in New Zealand, Data 01/2016–12/2018. Australian Fatal Data from BITRE [117], accessed 14 January 2020 and New Zealand fatal data from NZ Transport Agency Crash Analysis System (CAS) data [50], accessed 14 January 2020.
Sustainability 12 04347 g0a2
Figure A3. Crash types on urban roads (speed limit ≤ 70 km/h) and open roads (speed limit > 70 km/h) in New Zealand compared. Data from the New Zealand Transport Agency [65].
Sustainability 12 04347 g0a3
Figure A4. Vehicles registered in major cities, regional and remote Australia with a year of manufacture that is post-2000 based on 2019 Motor Vehicle Census Data, [51].
Sustainability 12 04347 g0a4
Figure A5. Age of registered vehicles in New Zealand (presented as year of manufacture) compared by remoteness level [67].
Sustainability 12 04347 g0a5
Figure A6. Surface type of roads in New Zealand, 2018. Data from NZ Transport Agency, accessed 17 February 2020, through Figure NZ [71].
Sustainability 12 04347 g0a6

References

  1. FHWA. Local and Rural Road Safety Program. Available online: https://safety.fhwa.dot.gov/local_rural/ (accessed on 8 January 2020).
  2. Aitken, C. The Road Toll—Trends and Possible Solutions. Available online: https://www.westernalliance.org.au/2018/04/the-road-toll-trends-and-possible-solutions (accessed on 8 January 2018).
  3. Austroads. Guide to Road Safety Part. 5: Road Safety for Regional and Remote Areas; Austroads Publication No. AGRS05-19; Austroads: Sydney, Australia, 2019; p. 66. [Google Scholar]
  4. Australian Rural Road Group Inc. About the Australian Rural Road Crisis. Available online: http://austwideruralroadsgroup.com/index.php/australias-rural-roads-crisis/ (accessed on 5 July 2019).
  5. ABS. ABS 2016—Census Community Profiles; Australian Bureau of Statistics: Canberra, Australia, 2016.
  6. BITRE. Road Trauma Australia 2018 Statistical Summary; Bureau of Infrastructure, Transport and Regional Economics: Canberra, Australia, 2019; pp. 1–70.
  7. Statistics New Zealand. 2013 census of population and dwellings. In Urban/Rural Area of Usual Residence for the Census Usually Resident Population; Mair, R., Ed.; Statistics New Zealand: Auckland, New Zealand, 2013; p. 1. [Google Scholar]
  8. Austroads. National View on Regional and Remote Road Safety; Austroads Publication No. AP-R603-19; Austroads: Sydney, Australia, 2019; p. 163. [Google Scholar]
  9. Federal Office of Road Safety. Australia’s Rural Road Safety Action Plan; Monograph 9; Federal Office of Road Safety: Canberra, Australia, 1996; p. 4.
  10. Department of Infrastructure Regional Development and Cities. National Road Safety Action Plan. 2018–2020; Transportation and Infrastructure Council: Canberra, Australia, 2018; p. 32.
  11. New Zealand Transport Agency. High.-Risk Rural Roads Guide September 2011; New Zealand Transport Agency: Wellington, New Zealand, 2011; p. 149. ISSN 978-0-478-38039-2.
  12. Ministry of Transport New Zealand. Annual Number of Road Deaths Historical Information. Available online: https://www.transport.govt.nz/mot-resources/road-safety-resources/road-deaths/annual-number-of-road-deaths-historical-information/ (accessed on 7 January 2020).
  13. Australian Transport Council. National Road Safety Strategy 2011–2020; Australian Transport Council: Canberra, Australia, 2011; pp. 1–122.
  14. Collie, S.; CarAdvice.com Pty Limited. Australian Road Toll Rises in 2019. Available online: https://www.caradvice.com.au/816943/australian-road-toll-rises-in-2019/ (accessed on 4 January 2020).
  15. Ministry of Transport NZ 2018 Road Deaths. Available online: https://www.transport.govt.nz/mot-resources/road-safety-resources/road-deaths/2018-road-deaths/ (accessed on 31 December 2019).
  16. Australian Automotible Association. Reviving Road Safety: Federal Priorities to Reduce Crashes and Save Lives; Perry, E., Ed.; Australian Automotible Association: Canberra, Australia, 2019; pp. 1–11. [Google Scholar]
  17. Eiksund, S. A geographical perspective on driving attitudes and behaviour among young adults in urban and rural Norway. Saf. Sci. 2009, 47, 529–536. [Google Scholar] [CrossRef]
  18. Sticher, G. An investigation of attitudes towards risk factors, personal driving ability and road safety information among rural and remote road users. In Proceedings of the Australian Institutes of Transport Research, Brisbane Australia, 7–9 December 2005. [Google Scholar]
  19. ABS. 3222.0—Population Projections, Australia, 2017 (Base)—2066. Available online: https://www.abs.gov.au/ausstats/abs@.nsf/0/5A9C0859C5F50C30CA25718C0015182F?Opendocument (accessed on 19 November 2019).
  20. Statistics New Zealand. Subnational Population Estimates: At 30 June 2016 (Provisional). Available online: http://archive.stats.govt.nz/browse_for_stats/population/estimates_and_projections/SubnationalPopulationEstimates_HOTPAtJun16.aspx (accessed on 5 January 2020).
  21. New Zealand Government. New Zealand’s Road Safety Strategy 2020–2030; New Zealand Government: Wellington, New Zealand, 2019; pp. 1–68.
  22. Mooren, L.; Grzebieta, R.; Job, S. Safe system—Comparisons of this approach in Australia. In Australasian College of Road Safety National Conference; Australasian College of Road Safety: Melbourne, Australia, 2011. [Google Scholar]
  23. Mooren, L.; Grzebieta, R.; Job, R.S. Speed limit setting and the safe system principle. In 2014 Australasian Road Safety Research, Policing & Education Conference; Australasian College of Road Safety: Melbourne, Australia, 2014; pp. 1–11. [Google Scholar]
  24. New Zealand Transport Agency. The Official New Zealand Road Code. Available online: https://www.nzta.govt.nz/resources/roadcode/about-limits/speed-limits (accessed on 12 March 2020).
  25. Trent, L. Speed Limits in Australia. Available online: https://www.ltrent.com.au/blog/speed-limits-in-australia/ (accessed on 12 March 2020).
  26. Janssen, W.H.; Claessens, F.M.M.; Muermans, R.C. Vormgeving Van Duurzaam Veilige Wegcategoriee¨n: Evaluatie Van ‘Self-Explaining’ Kenmerken [Design of Sustainably Safe Road Categories: Evaluation of ‘Self-Explaining’ Characteristics]; Report TM-99-C016; TNO: Soesterberg, The Netherlands, 1999. [Google Scholar]
  27. Stigson, H. Evaluation of safety ratings of roads based on frontal crashes with known crash pulse and injury outcome. Traffic Inj. Prev. 2009, 10, 273–278. [Google Scholar] [CrossRef] [PubMed]
  28. Tingvall, C.; Haworth, N. Vision zero: An ethical approach to safety and mobility. In Proceedings of the 6th ITE International Conference Road Safety & Traffic Enforcement: Beyond 2000, Melbourne, Australia, 6–7 September 1999; pp. 1–5. [Google Scholar]
  29. Liu, Y.; Tight, M.; Sun, Q.; Kang, R. A Systematic Review: Road Infrastructure Requirement for Connected and Autonomous Vehicles (CAVs); Journal of Physics: Conference Series; IOP Publishing: Bristol, UK, 2019; p. 042073. [Google Scholar]
  30. Singh, S. Critical Reasons for Crashes Investigated in the National Motor Vehicle Crash Causation Survey; Report No. DOT HS 812 115; NHTSA’s National Center for Statistics and Analysis: Washington, DC, USA, 2015; pp. 1–2.
  31. Litman, T. Autonomous Vehicle Implementation Predictions Implications for Transport. Planning; Victoria Transport Policy Institute: Victoria, BC, Canada, 2020; pp. 1–40.
  32. Logan, D.B.; Young, K.; Allen, T.; Horberry, T. Safety Benefits of Cooperative ITS and Automated Driving in Australia and New Zealand; Publication No: AP-R551-17; Austroads: Sydney, Australia, 2017; pp. 1–59. [Google Scholar]
  33. McGoogan, C. Elon Musk: Tesla’s Autopilot is Twice as Safe as Humans. The Telegraph. 2016. Available online: https://www.telegraph.co.uk/technology/2016/04/25/elon-musk-teslas-autopilot-makes-accidents-50pc-less-likely/ (accessed on 15 February 2020).
  34. Smith, B.W.; Svensson, J. Automated and Autonomous Driving: Regulation Under Uncertainty; International Transport Forum; OECD: Paris, France, 2015; pp. 1–32. [Google Scholar]
  35. SAE. Taxonomy and Definitions for Terms Related to Driving Automation Systems for On-Road Motor Vehicles; Society of Automotive Engineers: Warrendale, PA, USA, 2016; Volume J3016, pp. 1–35. [Google Scholar]
  36. ANCAP. Standard Inclusion of Autonomous Emergency Braking Increases Ten-Fold. 2018, pp. 1–6. Available online: https://www.ancap.com.au/media-and-gallery/releases/standard-inclusion-of-autonomous-emergency-braking-increases-ten-fold (accessed on 12 December 2019).
  37. Papa, E.; Ferreira, A. Sustainable accessibility and the implementation of automated vehicles: Identifying critical decisions. Urban Sci. 2018, 2, 5. [Google Scholar] [CrossRef] [Green Version]
  38. Speck, J. Autonomous Vehicles. United Conference of Mayors; Speck & Associates: Brookline, MA, USA, 2018. [Google Scholar]
  39. ARRB. Eastlink Operational Deployment of Semiautomated Vehicles: Phase 1 Summary of Findings; ARRB: Melbourne, Australia, 2018; pp. 1–6. [Google Scholar]
  40. Austroads. Infrastructure Changes to Support. Automated Vehicles on Rural and Metropolitan Highways and FreewaysAudit Specification (Module 1); Austroads: Sydney, Australia, 2019; p. 39. [Google Scholar]
  41. Transurban. NSW Partially Automated Vehicle Trials. Stage One—Sydney Orbital Network; Transurban: Sydney, Australia, 2018; p. 26. [Google Scholar]
  42. Guanetti, J.; Kim, Y.; Borrelli, F. Control of connected and automated vehicles: State of the art and future challenges. Annu. Rev. Control. 2018, 45, 18–40. [Google Scholar] [CrossRef] [Green Version]
  43. Pendleton, S.; Andersen, H.; Du, X.; Shen, X.; Meghjani, M.; Eng, Y.; Rus, D.; Ang, M. Perception, planning, control, and coordination for autonomous vehicles. Machines 2017, 5, 6. [Google Scholar] [CrossRef]
  44. Shimada, H.; Yamaguchi, A.; Takada, H.; Sato, K. Implementation and evaluation of local dynamic map in safety driving systems. J. Transp. Technol. 2015, 5, 102. [Google Scholar] [CrossRef] [Green Version]
  45. Parrish, K. Under the Hood: Tech Behind Autonomous Vehicles; SXSW Presentation; Austin Convention Center: Austin, TX, USA, 2015. [Google Scholar]
  46. Stradling, S. Semi-autonomous vehicles on our roads: What could possibly go wrong? In Local Transport. Today; Transport Research Institute: Washington, DC, USA, 2015. [Google Scholar]
  47. Lawson, S. Roads that Cars Can Read: Report III—Tackling the Transition to Automated Vehicles; International Road Assessment Programme: Basingstoke, Hampshire, 2018; p. 40. [Google Scholar]
  48. Dawson, J.; Ratigen, M.V. Roads that Cars Can Read: A Consultation Paper; EuroRAP and EuroNCAP: Leuven, Belgium, 2011; pp. 1–13. [Google Scholar]
  49. European Commission. C-ITS Platform: Phase II (Final Report); European Commission: Brussels, Belgium, 2017; pp. 1–127. [Google Scholar]
  50. Budd, L.; Newstead, S.; D’Elia, A. Identifying Future Vehicle Safety Priority Areas in Australia for the Light Vehicle Fleet; Monash University Accident Research Centre Report: Melbourne, Australia, 2020; in press. [Google Scholar]
  51. Statistics New Zealand. Urban Area Population Projections, by Age and Sex, 2013 (Base)—2043 Update. Available online: http://nzdotstat.stats.govt.nz/OECDStat_Metadata/ShowMetadata.ashx?Dataset=TABLECODE7563&ShowOnWeb=true&Lang=en (accessed on 4 March 2020).
  52. ABS. The Australian Statistical Geography Standard (ASGS) Remoteness Structure: Map of the 2016 Remoteness Areas for Australia. Available online: https://www.abs.gov.au/websitedbs/D3310114.nsf/home/remoteness+structure (accessed on 13 September 2019).
  53. Statistics New Zealand. Statistical Standard for Geographic Areas 2018. Available online: http://archive.stats.govt.nz/methods/classifications-and-standards/classification-related-stats-standards/geographic-areas/pg8.aspx (accessed on 5 March 2020).
  54. BITRE. Australian Road Deaths Database; The Department of Infrastructure, Transport, Cities and Regional Development: Canberra, Australia, 2019.
  55. NZ Transport Agency. Crash Analysis System (CAS) Data: Open Data; NZ Transport Agency, Ed.; Open.Data_NZTA: Wellington, New Zealand, 2019. [Google Scholar]
  56. ABS. 9309.0—Motor Vehicle Census, Australia, 31 Jan 2019. Available online: https://www.abs.gov.au/ausstats/abs@.nsf/mf/9309.0 (accessed on 6 February 2020).
  57. ABS. Microdata: Australian Statistical Geography Standard (ASGS) Correspondences. Available online: https://www.abs.gov.au/websitedbs/D3310114.nsf/home/Correspondences (accessed on 12 February 2020).
  58. NZ Transport Agency. RD002 Length of Road Network by Region (km). Available online: https://www.transport.govt.nz/mot-resources/transport-dashboard/2-road-transport/rd001-length-of-road-network-sealed-and-unsealed-km/rd002-length-of-road-network-by-region-km/ (accessed on 18 February 2020).
  59. BITRE. Yearbook 2018: Australian Infrastructure Statistics: Statistical Report; Department of Infrastructure, Regional Development and Cities: Canberra, Australia, 2018.
  60. BITRE. Growth in the Australian Road System; Gargett, D., Ed.; BITRE: Canberra, Australia, 2017; Information Sheet 92.
  61. Maclean, E. WE77455 Paved Roads in Queensland; CCN RQ201911261042113466/WE77455; Peiris, S., Ed.; Department of Transport and Main Roads: Brisbane, Queensland, 2019.
  62. DPTI. Sealed and Unsealed Roads and the Length and Road Type; Peiris, S., Ed.; Department of Planning, Transport and Infrastructure: Adelaide, Australia, 2020.
  63. Department of State Growth Tasmania. Roads for Our Future: State of Our Roads 2014; Department of State Growth Tasmania: Hobart, Tasmania, 2014; p. 22.
  64. Kregor, M. State Owned Roads in Tasmania; Peiris, S., Ed.; Department of State Growth: Hobart, Tasmania, 2020.
  65. New Zealand Transport Agency. Funding Assistance Rates (FAR) Review: Special Purpose Roads History; New Zealand Transport Agency: Wellington, New Zealand, 1997; pp. 1–52.
  66. ABS. 3218.0 Regional Population Growth, Australia, 2016–2017. Available online: http://www.abs.gov.au/ausstats/abs@.nsf/mf/3218.0 (accessed on 5 January 2020).
  67. Statistics New Zealand. Mapping Trends in the Auckland Region. Available online: http://archive.stats.govt.nz/browse_for_stats/Maps_and_geography/Geographic-areas/mapping-trends-in-the-auckland-region/population-density.aspx#Notes (accessed on 10 March 2020).
  68. BITRE. Road Trauma Australia 2016 Statistical Summary; Department of Infrastructure, Transport, Cities and Regional Development: Canberra, Australia, 2017; pp. 1–71.
  69. BITRE. Road Trauma Australia 2017 Statistical Summary; Department of Infrastructure, Transport, Cities and Regional Development: Canberra, Australia, 2018; pp. 1–85.
  70. New Zealand Transport Agency. Regional Road Safety Reports; Ministry of Transport New Zealand: Auckland, New Zealand, 2020. Available online: https://www.transport.govt.nz/mot-resources/road-safety-resources/roadcrashstatistics/regionalroadsafetyissues/ (accessed on 4 February 2020).
  71. Potterton, P.; Ockwell, A.; Cross, J.; Newstead, S.; Pekol, A. Benefits of Reducing the Age of the Australian Light Vehicle Fleet: Report for the Australian Automobile Association; Australian Automobile Association: Hall, Australia, 2017; pp. 1–97. [Google Scholar]
  72. NZ Transport Agency. Registered Vehicles by Urban/Rural Classification, As at 25 February 2020; Personal Communication with Peiris, S.; New Zealand Transport Agency: Auckland, New Zealand, 2020.
  73. Bartlett, R. Comparative Geometrics: Road Classification in Australia. Available online: https://comparativegeometrics.wordpress.com/2013/02/21/road-classification-in-australia/ (accessed on 22 November 2019).
  74. Gargett, D. Explanation of Data in BITRE 2017 ‘Growth in the Australian Road System’; Peiris, S., Ed.; BITRE: Canberra, Australia, 2020.
  75. Foster, A. Length of Divided Roads in New Zealand; Peiris, S., Ed.; NZ Transport Agency: Wellington, New Zealand, 2020.
  76. New Zealand Transport Agency. Physical statistics: Roads 2018. In By Road Surface Type, June 2009 & 2018, Kilometres; Figure NZ—Attribution 4.0 International (CC BY 4.0); New Zealand Transport Agency: Wellington, New Zealand, 2018; Volume 2019. [Google Scholar]
  77. Anderson, J.M.; Kalra, N.; Stanley, K.D.; Sorensen, P.; Samaras, C.; Oluwatola, T.A. Autonomous Vehicle Technology: How to Best Realize Its Social Benefits. 2014. Available online: https://www.rand.org/pubs/research_briefs/RB9755.html?utm_source=t.co&utm_medium=rand_social (accessed on 16 May 2020).
  78. Jermakian, J.S. Crash avoidance potential of four passenger vehicle technologies. Accid. Anal. Prev. 2011, 43, 732–740. [Google Scholar] [CrossRef] [PubMed]
  79. Halvorson, B. IIHS: Avoidance Systems Could Cut Fatal Crashes By One-Third. 2010. Available online: https://www.thecarconnection.com/news/1045508_iihs-avoidance-systems-could-cut-fatal-crashes-by-one-third (accessed on 16 May 2020).
  80. Kusano, K.D.; Gabler, H.C. Safety benefits of forward collision warning, brake assist, and autonomous braking systems in rear-end collisions. IEEE Trans. Intell. Transp. Syst. 2012, 13, 1546–1555. [Google Scholar] [CrossRef]
  81. Insurance Institute for Highway Safety. Real-World Benefits of Crash Avoidance Technologies; Highway Loss Data Institute, Ed.; IIHS: Washington, DC, USA, 2019; p. 1. [Google Scholar]
  82. Scanlon, J.M.; Kusano, K.D.; Sherony, R.; Gabler, H.C. Potential safety benefits of lane departure warning and prevention systems in the US vehicle fleet. In Proceedings of the 24th International Technical Conference on the Enhanced Safety of Vehicles (ESV), Gothenburg, Sweden, 8–11 June 2015. [Google Scholar]
  83. Scanlon, J.M.; Sherony, R.; Gabler, H.C. Injury mitigation estimates for an intersection driver assistance system in straight crossing path crashes in the United States. Traffic Inj. Prev. 2017, 18 (Suppl. 1), S9–S17. [Google Scholar] [CrossRef] [PubMed]
  84. Lari, A.; Douma, F.; Onyiah, I. Self-driving vehicles and policy implications: Current status of autonomous vehicle development and minnesota policy implications. Minn. JL Sci. Tech. 2015, 16, 735. [Google Scholar]
  85. Silberg, G.; Wallace, R.; Matuszak, G.; Plessers, J.; Brower, C.; Subramanian, D. Self-driving cars: The next revolution. KPMG LLP Cent. Automot. Res. 2012, 9, 36. [Google Scholar]
  86. Woldeamanuel, M.; Nguyen, D. Perceived benefits and concerns of autonomous vehicles: An exploratory study of millennials’ sentiments of an emerging market. Res. Transp. Econ. 2018, 71, 44–53. [Google Scholar] [CrossRef]
  87. NHTSA. Automated Driving Systems 2.0: A Vision for Safety; Published by the U.S Department of Tranportation, DOT HS 812 442; NHTSA: Washington, DC, USA, 2017; p. 36.
  88. Phipps, P. Road Deaths by Crash Type (Movement Code Categories), 2016–2018; Personal Communication with Peiris, S.; Data Reference no. C20200127D; New Zealand Transport Agency: Wellington, New Zealand, 2020.
  89. BITRE. Common crash type (sub-groups) for fatal crashes 2015–2017 (Table 2.9). In Road Trauma Australia 2018 Statistical Summary—Table Index; Department of Infrastructure and Regional Development, Ed.; BITRE: Canberra, Australia, 2018. [Google Scholar]
  90. National Rural Health Alliance Ltd. Income Inequality Experienced by the People of Rural and Remote Australia; National Rural Health Alliance Ltd.: Deakin West, Australia, 2014; pp. 1–9. [Google Scholar]
  91. Fatovich, D.M.; Jacobs, I.G. The relationship between remoteness and trauma deaths in Western Australia. J. Trauma Acute Care Surg. 2009, 67, 910–914. [Google Scholar] [CrossRef] [PubMed]
  92. Taylor, M.C.; Baruya, A.; Kennedy, J.V. The Relationship Between Speed and Accidents on Rural Single-Carriageway Roads; Tranport Research Laboratory: Crowthorne, UK, 2002; Volume 511.
  93. NHTSA. Traffic Safety Facts 2001: Rural/Urban Comparison; National Highway Traffic Safety Administration; National Center for Statistics and Analysis; US Department of Transportation: Washington, DC, USA, 2002.
  94. Austroads. RoadFacts 2005: An Overview of the Australian and New Zealand Road Systems; AP 05/G18; Austroads: Sydney, Australia, 2005. [Google Scholar]
  95. Australian Government. Budget 2019–2020: Investing in Our Community; Australian Government: Parkes, Australia, 2019.
  96. Austroads. Reforming Remote and Regional Road Funding in Australia; Research Report AP-R526-16; Austroads Ltd.: Sydney, Australia, 2016; p. 103. [Google Scholar]
  97. Gee, S. Backlash Against Plan to Lower Speed Limits Across New Zealand Highways. 2019. Available online: https://www.stuff.co.nz/national/117065405/backlash-against-plan-to-lower-speed-limits-across-new-zealand-highways (accessed on 4 January 2020).
  98. Wismans, J.; Thynell, M.; Lindberg, G. Economics of road safety—What does it imply under the 2030 agenda for sustainable development? In Proceedings of the Intergovernmental Tenth Regional Environmentally Sustainable Transport (EST) Forum in Asia, Vientiane, Laos, 14–16 March 2017; United Nations Centre for Regional Development: Vientiane, Lao People’s Democratic Republic, 2017; pp. 1–59. [Google Scholar]
  99. Turner, B.; Tziotis, M.; Cairney, P.; Jurewicz, C. Safe System Infrastructure National Roundtable Report; Research Report ARR 370; ARRB: Melbourne, Australia, 2009; pp. 1–36. [Google Scholar]
  100. PIARC. Road Safety Manual—A Guide for Practitioners; World Road Association: Paris, France, 2019; pp. 1–36. [Google Scholar]
  101. Road Safety Taskforce. Review of National Road Safety Governance Arrangements, Final Report; INFRA3987; Australian Government: Canberra, Australia, 2019.
  102. ANCAP. ANCAP assessment protocol: Safety assist v8.0.2. In Assessment of Speed Assist Systems; Australasian New Car Assessment Program: Manuka, Australian Capital Territory, Australia, 2018; Volume v8.0.2, pp. 1–24. [Google Scholar]
  103. Keall, M.; Newstead, S. Relative Vehicle Safety, Road Environment and Crash Type; Monash University Accident Research Centre Report 337: Melbourne, Victoria, 2018; pp. 1–19. [Google Scholar]
  104. Tziotis, M.; Mabbott, N.; Edmonston, C.J.; Sheehan, M.C.; Dwyer, J. Road safety in rural and remote areas of Australia. In 22nd ARRB Conference—Research into Practice; Austroads: Canberra, Australia, 2006; pp. 1–24. [Google Scholar]
  105. Siskind, V.; Steinhardt, D.; Sheehan, M.; O’Connor, T.; Hanks, H. Risk factors for fatal crashes in rural Australia. Accid. Anal. Prev. 2011, 43, 1082–1088. [Google Scholar] [CrossRef] [PubMed] [Green Version]
  106. AADA. National Vehicle Fleet—Key Facts. 2017. Available online: https://www.aada.asn.au/news/industry-report-feature-national-vehicle-fleet-key-facts/ (accessed on 29 November 2019).
  107. Ministry of Transport New Zealand. Annual Fleet Statistics 2018; Ministry of Transport, New Zealand: Wellington, New Zealand, 2019; pp. 1–28.
  108. Austroads. National View on Regional and Remote Road Safety; Webinar-Originally Presented at Australasian Road Safety Conference; Watts, M., Wundersitz, L., Eds.; Austroads: Canberra, Australia, 2019; p. 40. [Google Scholar]
  109. Tuhi, A. New Zealand’s First 5G-Connected Driverless Car Tested on Auckland Streets. 2019. Available online: https://www.sparknz.co.nz/news/5G_connected_driverless_car/ (accessed on 4 April 2020).
  110. European Commission Mobility and Transport: eCall. Available online: https://ec.europa.eu/transport/road_safety/specialist/knowledge/esave/esafety_measures_unknown_safety_effects/ecall_en (accessed on 8 October 2018).
  111. Leslie, A.J. Analysis of the Field Effectiveness of General Motors Production Active Safety and Advanced Headlighting Systems; University of Michigan, Ann Arbor, Transportation Research Institute: Ann Arbor, MI, USA, 2019. [Google Scholar]
  112. Sugawara, T.; Altmannshofer, H.; Kakegawa, S. Applications of road edge information for advanced driver assistance systems and autonomous driving. In Advanced Microsystems for Automotive Applications 2017; Springer: New York, NY, USA, 2018; pp. 71–86. [Google Scholar]
  113. Tigadi, A.; Gujanatti, R.; Gonchi, A.; Klemsscet, B. Advanced driver assistance systems. Int. J. Eng. Res. Gen. Sci. 2016, 4, 151–158. [Google Scholar]
  114. Yue, L.; Abdel-Aty, M.; Wu, Y. The crash avoidance effectiveness of advanced driver assistance systems in real-world environment. In Proceedings of the International Conference on Transportation and Development 2019: Innovation and Sustainability in Smart Mobility and Smart Cities, Alexandria, VA, USA, 9–12 June 2019; American Society of Civil Engineers Reston: Reston, VA, USA; pp. 41–51. [Google Scholar]
  115. Yue, L.; Abdel-Aty, M.A.; Wu, Y.; Farid, A. The practical effectiveness of advanced driver assistance systems at different roadway facilities: System limitation, adoption, and usage. IEEE Trans. Intell. Transp. Syst. 2019. [Google Scholar] [CrossRef]
  116. Yue, L.; Abdel-Aty, M.; Wu, Y.; Wang, L. Assessment of the safety benefits of vehicles’ advanced driver assistance, connectivity and low level automation systems. Accid. Anal. Prev. 2018, 117, 55–64. [Google Scholar] [CrossRef] [PubMed]
  117. Zaccarin, L.; Sozzi, N. Advanced Driver-Assistance Systems (ADAS): A Model to Assess the Expected Societal Benefits in Italy. Master’s Thesis, Politecnico di Milano , Milan, Italy, 2019. [Google Scholar]
  118. Ernst, C.-P.H.; Reinelt, P. Autonomous Car Acceptance: Safety vs. Personal Driving Enjoyment. In Proceedings of the Twenty-third Americas Conference on Information Systems, Boston, MA, USA, 10–12 August 2017. [Google Scholar]
  119. Hussain, R.; Lee, J.; Zeadally, S. Autonomous cars: Social and economic implications. IT Prof. 2018, 20, 70–77. [Google Scholar]
  120. Tettamanti, T.; Varga, I.; Szalay, Z. Impacts of autonomous cars from a traffic engineering perspective. Period. Polytech. Transp. Eng. 2016, 44, 244–250. [Google Scholar] [CrossRef] [Green Version]
  121. Statistics New Zealand. Defining Urban and Rural New Zealand. Available online: http://archive.stats.govt.nz/browse_for_stats/Maps_and_geography/Geographic-areas/urban-rural-profile/defining-urban-rural-nz.aspx (accessed on 10 January 2020).
  122. Steinhardt, D.A.; Sheehan, M.C.; Siskind, V. The effectiveness of using a simple ARIA based geographical classification to identify road crash patterns in rural and urban areas of Queensland. In Proceedings of the 2009 Road Safety Research, Policing and Education Conference, Sydney, Australia, 10–13 November 2009. [Google Scholar]
  123. Federal Office of Road Safety. Trends in Fatal Crashes on Rural Roads; Federal Office of Road Safety: Canberra, Australia, 1995; p. 2.
  124. Ministry of Transport New Zealand. Monthly Road Crash Statistics Update: December Road Deaths (2018); Ministry of Transport New Zealand: Wellington, New Zealand, 2019; pp. 1–4.
  125. Government UK Collection: Rural Urban Classification, last updated 21 July 2016 (Open Government Licence v3.0). Available online: https://www.gov.uk/government/collections/rural-urban-classification (accessed on 19 November 2019).
  126. Transport Canada. Canadian Motor Vehicle Traffic Collision Statistics: 2017; Transport Canada: Ottawa, ON, Canada, 2017.
  127. Australian Institute of Health and Welfare (AIHW). Rural, Regional and Remote Health: A Guide to Remoteness Classifications; AIHW: Canberra, Australia, 2004.
Figure 1. Australia’s National Road Safety Strategy progress to June 2019 showing the actual road fatality trend compared to the targeted reduction. Reproduced with permission from C. Newland, 25 March 2020 [16] (p. 5).
Sustainability 12 04347 g001
Figure 2. Australian fatal road user data (01/2016–11/2019) compared by speed limit of road and remoteness level [69].
Sustainability 12 04347 g002
Figure 3. New Zealand fatal road user data (01/2016–11/2019) compared by speed limit of road and remoteness level [55].
Sustainability 12 04347 g003
Figure 4. Crash types in Australia (2013–2017) and New Zealand (2012–2016). ‘Other’ crash type refers to those which involve overtaking, rear-end crashes and obstruction.
Sustainability 12 04347 g004
Figure 5. Average annual casualty crash types (2012–2016) in regional and remote areas compared, Australia and New Zealand. Image reproduced with permission from Gardner (26 March 2020), in Austroads: Guide to Road Safety Part 5: Road Safety for Regional and Remote Areas (Publication No. AGRS05-19), Sydney NSW [3] (p. 9).
Sustainability 12 04347 g005
Figure 6. Age of registered vehicles in Australia (data to 2019, [56]) and New Zealand (data to 2020, [72]), presented as year of manufacture compared by remoteness level.
Sustainability 12 04347 g006
Table 1. Levels of driving automation as defined by the SAE (Society of Automobile Engineers). Figure adapted from OECD International Transport Forum, 2015 [34] and SAE Standard J3016 [35].
DescriptionSteering Acceleration DecelerationMonitoring Driving EnvironmentFall Back Performance (Driving Task)System Capability
Human monitors environment0No Automation
All aspects of the driving task (full-time) are performed by the human driver, even if assisted by warnings and vehicular interventions
DriverDriverDriverNot applicable
1Driver Assistance
Driver may use assistance systems (steering or acceleration/deceleration) with the expectation that the human driver performs all remaining aspects of the dynamic driving task
Driver and systemDriverDriverLimited
2Partial automation
Driver may use one or more assistance systems (steering and acceleration/deceleration) with the expectation that the human driver performs all remaining aspects of the dynamic driving task
SystemDriverDriverLimited
System monitors environment3Conditional automation
All aspects of the dynamic driving task can be performed by the system via automated performance with the expectation that the human driver will respond appropriately to a request to intervene
SystemSystemDriverLimited
4High automation
All aspects of the dynamic driving task can be performed by the system via automated performance with the expectation that the human driver does not have to respond appropriately to a request to intervene
SystemSystemSystemLimited
5Full automation
All aspects of the dynamic driving task can be performed by the system via automated performance under all roadway and environmental conditions that can be managed by a human driver
SystemSystemSystemUnlimited
Table 2. Sensor requirements of an autonomous vehicle and for various driver assist technologies. Adapted from [44,45].
Autonomous Vehicle
Sensor Types
InfraredShort-Mid Range RadarLong-Range RadarUltra-SoundCameraLIDARGNSS
Functional requirements
  • Appropriate speed limits
  • Adequate lane markings
  • Appropriate speed limits
  • Appropriate weather
  • Adequate lighting
  • Appropriate speed limits
  • Appropriate weather
  • Adequate lighting
  • Appropriate speed limits
  • Adequate lighting
  • Appropriate speed limits
  • Appropriate weather
  • Adequate lighting
  • Adequate lane markings
  • Uniform signage
  • Appropriate speed limits
  • Appropriate weather
  • Adequate lighting
• Maps
Dependent technology
  • Pedestrian detection
  • Bicycle detection
  • (in poor weather/lighting)
  • Cross traffic alert
  • Blind spot detection
  • Rear collision warning
• Adaptive cruise control• Park assists
  • Traffic sign recognition
  • Lane departure warning
  • Surround view
  • Park assistance
  • Emergency braking
  • Pedestrian detection
  • Collision avoidance
• GPS Location
Table 3. Remoteness structure of Australia (using the ARIA Index) and New Zealand (as per NZSAC92) used for comparative purposes in text.
AustraliaNew ZealandTerm Used in Text
Remoteness
Labels
Major CitiesMain Urban AreasMajor Cities
Inner Regional AustraliaSecondary Urban AreaRegional Areas
Outer regional Australia
Remote Australia
Very remote Australia
Minor Urban AreaRemote Areas
Rural Centres
Other Areas
Table 4. Land area compared to the 2016 resident population in Australia [5] and the 2018 resident population in New Zealand [51].
AustraliaNew Zealand
Land Area (sq.km)Land Area %PopulationPopulation %Land Area (sq.km)Land Area %PopulationPopulation
%
Major cities19,9660.316,238,00070.730,72511.53,554,90073.1
Regional areas1,054,67513.76,247,00027.262,92723.5647,10013.3
Remote areas6,613,48486.0469,0002.1174,36965.1662,60013.6
Total7,688,125 22,954,000 268,021 4,864,600
Table 5. Fatality rate in regional and remote areas with respect to the total population (as a percentage) and 100,000 population in Australia and New Zealand, 2016. Data from Austroads [3].
Population
%
Fatalities
%
Annual Fatality Rate
per 100,000 Population
AustraliaMajor Cities72.735.32.6
Regional and Remote27.364.712.2
New ZealandMajor Cities57.921.62.6
Regional and Remote42.178.413
Table 6. New Zealand road network showing road use and road type [76].
State HighwaysLocal RoadsTotal
Urban
km
Open
km
%Urban
km
Open
km
%Length
km
Sealed10,937099.718,77134,653 a63.463,984
Unsealed3200.333730,543 b36.630,786
Total10,9690 19,10865,197
a Includes 377.7 km of ‘special purpose’ roads, assumed to be open. b Includes 126.3 km of ‘special purpose’ roads, assumed to be open.
Table 7. Lengths of highways, arterials, local roads and busways in urban and non-urban Australia [59].
UrbanNon-Urban
HighwaysArterialsLocalBuswayTotal UrbanHighwaysArterialsLocalBuswayTotal Non-Urban
Length
km
648816,372126,906127149,89445,496166,084515,9926727,578
Length
%
4.310.984.70.1100.06.322.870.90.0100.0
Table 8. Length of paved roads compared to unsealed roads in Australia [59].
Paved UndividedPaved DividedPaved Freeway/TunnelPaved TotalGravelFormedOtherTotal Unsealed
Length
km
369,76984702944381,183283,841139,49369,624492,958
Length
%
42.31.00.3-32.516.08.0-
Table 9. Predicted crash reductions based on crash types assuming 50% of the vehicle fleet are fully autonomous. Predicted benefits (based on crash data from Great Britain, 2015—Urban, Rural and Inter-Urban Roads) have been applied to Australian and New Zealand fatality data [47].
Crash TypeNew Zealand Fatal Data [88]
2016 to 2018
Australia Fatal Data [89]
2015–2017
Predicted Benefits aCrash Reductions Likely b
New Zealand Fatal Data
2016 to 2018
Australia Fatal Data
2015–2017
Run-off road377
Includes ‘Lost Control-Straight’, ‘Lost Control-Bends’, ‘Collision with Obstruction’
791
Includes ‘Off carriageway at right bend’, ‘Off carriageway at left bend’
60–80%−302−633
Rear-end shunts21206
Includes ‘Rear end’, ‘Same direction-Side swipe’
60–80%−17−165
Head-on crashes406
Includes ‘Head-on’ and ‘Overtaking’
702
Includes ‘Opposing direction-Right through’, ‘Opposing direction-Head-on’
40–60%−244−421
Vulnerable Road Users101
Includes ‘Pedestrians crossing road’ and ‘Pedestrians-Other’
44920–40%−40−180
Intersection crashes136
Includes ‘Turning versus same direction’, ‘Crossing not turning’, ‘Crossing (vehicle turning)’, ‘Right turn against’
908
Includes ‘Non-collision straight, off left’, ‘Non-collision straight, off right’, ‘Adjacent directions-cross traffic’ and ‘Adjacent directions-right near’
20–40%−54−363
Other42370
Includes ‘On path’, ‘Miscellaneous’ and ‘Unknown’ crash types
20–40%−17−148
Total Fatalities10833426 −674−1910
a Ignores other potentially negative consequences resulting from the interaction between autonomous and conventional vehicles. b Crash reductions assumed to apply at the high end of each of the ranges.

