Article

Impact of Biogas and Waste Fats Methyl Esters on NO, NO2, CO, and PM Emission by Dual Fuel Diesel Engine

by
Wojciech Golimowski
1,
Paweł Krzaczek
2,*,
Damian Marcinkowski
3,
Weronika Gracz
3 and
Grzegorz Wałowski
4
1
Department of Agriculture Engineering and Quality Analysis, Institute of Chemistry and Food Technology, Wroclaw University of Economics, 118-120 Komandorska, 53-345 Wroclaw, Poland
2
Department of Power Engineering and Transportation, Faculty of Production Engineering University of Life Science, 13 Akademicka, 20-950 Lublin, Poland
3
Department of Biomass Processing Technologies, Inst. Technology and Life Sciences, 3. Al. Hrabska, 05-090 Raszyn, Poland
4
Department of Renewable Energy Sources, Inst. Technology and Life Sciences, 3. Al. Hrabska, 05-090 Raszyn, Poland
*
Author to whom correspondence should be addressed.
Sustainability 2019, 11(6), 1799; https://doi.org/10.3390/su11061799
Submission received: 21 February 2019 / Revised: 21 March 2019 / Accepted: 22 March 2019 / Published: 25 March 2019
(This article belongs to the Special Issue Sustainable Energy and Biorefineries from Biowastes)

Abstract

:
The aim of this study was to perform a comparative analysis of the unit gas emission value in the exhaust of a dual fuel diesel engine. The results of the effects of a diesel engine’s applications in biogas plants and the method for calculating mass gas emissions per unit of produced electricity are shown. The test was performed using a two-cylinder, naturally aspirated, liquid-cooled diesel engine. The diesel engine powered a generator connected to the grid. The engine was fed with liquid fuels—waste cooking oil methyl ester (UCOME) and diesel fuel (DF)—and with a gas fuel, biogas (BG). The engine ran at a constant rotational speed (2000 rpm ± 30 rpm) with variable load. The gas analyzer measured the amount of CO, NO, NO2, and PM (particulate matter) in exhaust gas. This gas content share was then converted to mass per engine generated energy unit. This experiment showed the effect of BG introduced to the intake manifold on fuel combustion, as well as an increase in CO and NO2 emission and decrease in NO and PM. In terms of dependence of exhaust emissions on the type of liquid fuel used, the use of UCOME as opposed to diesel fuel resulted in PM reduction and increase of NO emissions.

1. Introduction

Diesel engines have many uses, from transportation to powering electrical generators [1,2,3]. Due to their emissions, they have a negative impact on the natural environment. However, due to their high thermal efficiency and small size, diesel engines have found a wide range of applications [4,5,6]. Alternative fuels are being sought to reduce emissions of harmful components from exhaust gases [7,8,9,10,11,12,13]. In response to the depletion of natural energy resources and an increase in CO2 emissions resulting from the combustion of fossil fuels, research on biomass fuel production is carried out worldwide [14,15,16,17,18,19,20,21,22,23]. The resulting different quality biodiesel liquid fuels [24,25,26,27,28], as well as biogas [29,30] nevertheless constitute a significant source of energy [31,32,33,34,35], especially for small farms. In such situations, a dual fuel combustion engine powering a generator [36,37] offers an attractive alternative, significantly limiting a farm’s demand for energy from external sources and increasing level of independence of the indicated energy sources.
Combustion engines are the main power source in transport [5,38]. Diesel engines in relation to spark-ignition engines are characterized by higher efficiency, associated with lower consumption of diesel fuel, [39,40,41] but higher PM and NOx emissions. Because of this, the research tilts biogas (BG) compression ignition engines [42]. The pilot dose is diesel fuel (DF) and the main fuel is biogas [42,43]. It was found that the proportion of BG in fuel has a positive effect on the level of harmful gas emissions but slightly lowers the efficiency of the engine at full load [44,45,46,47,48]. Studies on the simultaneous combustion of liquid and gas biofuels [44,49] have been conducted. Research has been carried out where spark ignition engines are used for research [50], as well as with compression ignition, often in the form of power generators [51,52]. As a fuel, raw biogas is used in laboratory tests [53,54], as well as in long-term operational research [52]. Because the biogas obtained in practice is characterized by the variable content of methane, carbon dioxide, and hydrogen sulphide, research is conducted in which the gas composition is simulated in order to discover phenomena and dependences having a significant impact on toxic exhaust components [55,56,57,58]. However, after analyzing the literature [42,43,59,60], one cannot get an unambiguous answer to the question of whether the solution is pro-ecological.
In light of high interest in the use of compression ignition engines for BG combustion in biogas plants, this study was undertaken to determine the impact of the BG additive, co-combusted with DF and biodiesel, on the unit emission of exhaust gases.

2. Materials and Methods

The tests were carried out using a two-cylinder diesel engine (Table 1) intended to drive a power generator, whose construction was not adapted to burning gaseous fuels. The introduced modifications of the engine in the form of two gas injectors placed in the intake manifold allowed the engine to be powered by biogas as well. Such actions correspond to the situation when an entity producing biogas (a biogas plant) attempts to use the obtained biogas to produce electricity using a power generator. Considering the economic aspect, an enterprise (a biogas plant) usually acquires a diesel engine (higher efficiency than spark-ignition engines) in this type of activity or modifies an already possessed one and adapts it to its own needs without interfering with the engine control system. In most cases these are older generation engines, usually controlled by a mechanical speed regulator.
In the experimental engine, an electronic biogas injection control system was used and applied to the intake manifold, which, depending on the assumed biogas proportion and engine operation parameters, regulated the opening time of the gas injectors. Diesel or biodiesel (liquid fuel) was injected into the engine pre-chamber and its quantity was controlled by a mechanical regulator of the inline injection pump. Changing the opening time of the biogas injector caused an automatic correction of the liquid fuel dose by the injection pump regulator. The measurements made with the use of various fuels were preliminary tests, the assumption of which was the lack of interference in the systems regulating the operation of the engine driving the power generator. The tests verified the effect of biogas addition mainly on unit CO, NO, NO2, and PM emissions in the exhaust gases of the engine fueled by commercial diesel fuel and methyl esters of the used frying oil. It should be emphasized that in the studies of many authors [5,38,61,62,63], the total amount of nitrogen oxides was investigated independently of the studied fuels and combustion systems. However, two of the most dangerous nitrogen oxides, NO and NO2, often occurring together, have been measured in the experimental studies—of which nitrogen dioxide is considered the most dangerous due to its impact on human health and other living organisms [59,60].
Standard commercial diesel fuel (DF) was used in the study as the reference fuel, whereas the biodiesel waste cooking oil methyl ester (UCOME) and crude biogas (BG) were employed as research fuels. In order to determine the unitary emission of exhaust gases, the tests were carried out in four engine power configurations: DF—100%, UCOME—100%, DF + BG—50/50 (m/m), and UCOME + BG—50 (m/m). In contrast, to assess the effect of the amount of the added biogas on the emissions of CO, NO, NO2, and PM, the percentage of biogas was changed from 40% to about 70–80% at constant engine speed and at various engine load levels, i.e., until the knock was clearly detected in the engine under investigation.
In order to characterize the composition of the tested liquid fuels, measurements were made in accordance with the PN-EN 14103 norm (Table 2), fuel density tests were carried out using a hydrometer in accordance with PN-EN ISO 3675 norm, kinematic viscosity with a capillary was measured in accordance with PN-ISO 3104 norm (Table 3), and the calorific value was determined by means of the IKA C 200 calorimeter (IKA®-Werke GmbH & Co. KG, Staufen, Germany). On the other hand, the biogas for testing was taken directly from the installation for its production and pressed using a 100 bar compressor for the cylinder, from which a sample was taken for analysis. The composition of BG was determined using the GA2000 (LumaSense Technologies GmbH, Frankfurt, Germany) gas composition analyzer (Table 4), and the density and calorific value were calculated based on the composition of biogas, the molar mass of the mixture of methane and carbon dioxide, and the calorific value of methane.
The test stand consisted of a two-cylinder diesel engine (Table 1) with a pre-chamber, 9 kW, cooled with liquid. The engine was equipped with a fuel supply system by indirect injection with an inline injection pump. The engine was connected permanently via a relay shaft with an asynchronous motor, controlled by an automatic control and measurement system. The electrical energy generated by the asynchronous motor was sent directly to the power grid. The experimental stand is a compact whole and is used for simulation research (Figure 1).
The DE is permanently connected to the AM. Liquid fuels are supplied by DM to the injection pump. The regulating strip in the injection pump is mechanically adjustable, and the strip injection pump corrected engine speed for each measurement. The gas fuel was injected into the IM through two injectors in GSI. The amount of BG was adjusted by the time the injector was opened, and the flow of BG was measured with GSI at a constant pressure of 2 bar. The EPM was placed in an EP with a diameter of 10 cm and a distance of 100 cm from the ES. EP was connected to a flexible tube with a diameter of 12 cm and 50 cm, removing the exhaust gases behind the building. The composition of the air and the flow at the inlet to the engine were not measured. The CS was used for temperature measurement, BG flow, mass flow of liquid fuels, amount of BG injection, and conversion of electric energy into network energy parameters. Nearly the whole CS was controlled by a PC with the exception of liquid fuels. Parameters of the CS were presented on a current basis on the CSM. EA type MPM4 (MAHA Maschinenbau Haldenwang GmbH & Co. KG, Haldenwang, Germany,) was calibrated by the manufacturer before the measurement.
The tested combustion engine operated at a constant speed of 2000 rpm ± 30 rpm, which was regulated by the injection pump settings and by the injection pump regulator depending on the engine load generated by the control and measuring system of the asynchronous motor. The tests were started after heating up the engine so that the temperature of the engine oil exceeded 70 °C. The measurement was performed at six measuring points, for which the load figures of the torque were, respectively: 0, 4.5, 8, 12, 16, and 20 Nm. After each parameter configuration change, the engine worked for 30 min in order to stabilize the work parameters. The operating parameters of the measurement system, which were recorded automatically, were: Instantaneous consumption of liquid fuel, instantaneous consumption of gaseous fuel as well as composition, and the temperature and level of the exhaust gas flow. All tested fuels, both liquid and gas, were introduced into the engine at an ambient temperature of 20 °C ± 2 °C, maintaining air parameters—humidity 46% ± 10% and pressure 995 hPa ± 2 hPa.
Each time the test stand was brought to the assumed thermal conditions, the test plan at first included measurements for DF as a reference fuel for the assumed 6 load points at the rotated speed of 2000 rpm. Next, GSI injection control system was started for each load value in succession and biogas was fed in an amount from 40–80% w/w in relation to DF. In the CS were recorded energetic and emission parameters that formed the basis for further analyses and calculations. In the next step of the test plan, after switching the source tank, the engine was powered by UCOME. For this fuel, analogous stages of conducting the tests were carried out, i.e., the measurements were started for a clean biofuel (100% UCOME). Biogas was then fed through the GSI system from 40–80% w/w for each load point.
The proportions of gases NO, NO2, PM, and CO, were quantified in relation to the mass of exhaust gases. A certain simplification was introduced for the expression of exhaust mass emissions. The exhaust gas was a perfect gas model and consisted of a mixture of oxygen, nitrogen, and dioxide, omitting the presence of trace amounts of other gases. To determine the mass amount A* of gases, the Clapeyron equation (1) was used.
A   =   V p T R   [ k m o l h ] .
where V*—exhaust gases flow m3 in normal conditions per hour [m3·h−1], p—pressure in the exhaust manifold [Pa], T—exhaust gases temperature [K], R—universal gas constant [J·kg−1·K−1].
The quantitative exhaust gas stream was converted into the mass stream on the basis of the molar mass of O2, N2, and CO2 gas mixtures. The proportion of gases was measured using an exhaust gas analyzer, with the exception of nitrogen. The mass stream x for NO, NO2, PM, and CO were calculated from equation (2) relative to the exhaust mass.
X   =   n   =   1 3 ( M i · y i ) · A · B x   [ m g h ]
where M—the molar mass of the i-th gas [kg·kmol−1], y—quantitative share of the i-th gas [-], B—share of x-th gas (CO, NO, NO2) in the exhaust [mg·kg−1], i—O2; CO2; N2.
For the mass stream of the emission of gases in exhaust gases, separately for DF and UCOME, an ANOVA univariate severity test was carried out, where the share of BG in fuel and the type of fuel supplying the engine were assumed to be an independent variable. The correlation analysis was performed for dependent cases. Then, the analysis of unitary emission of harmful gases was performed only for the 50% BG share in fuel.

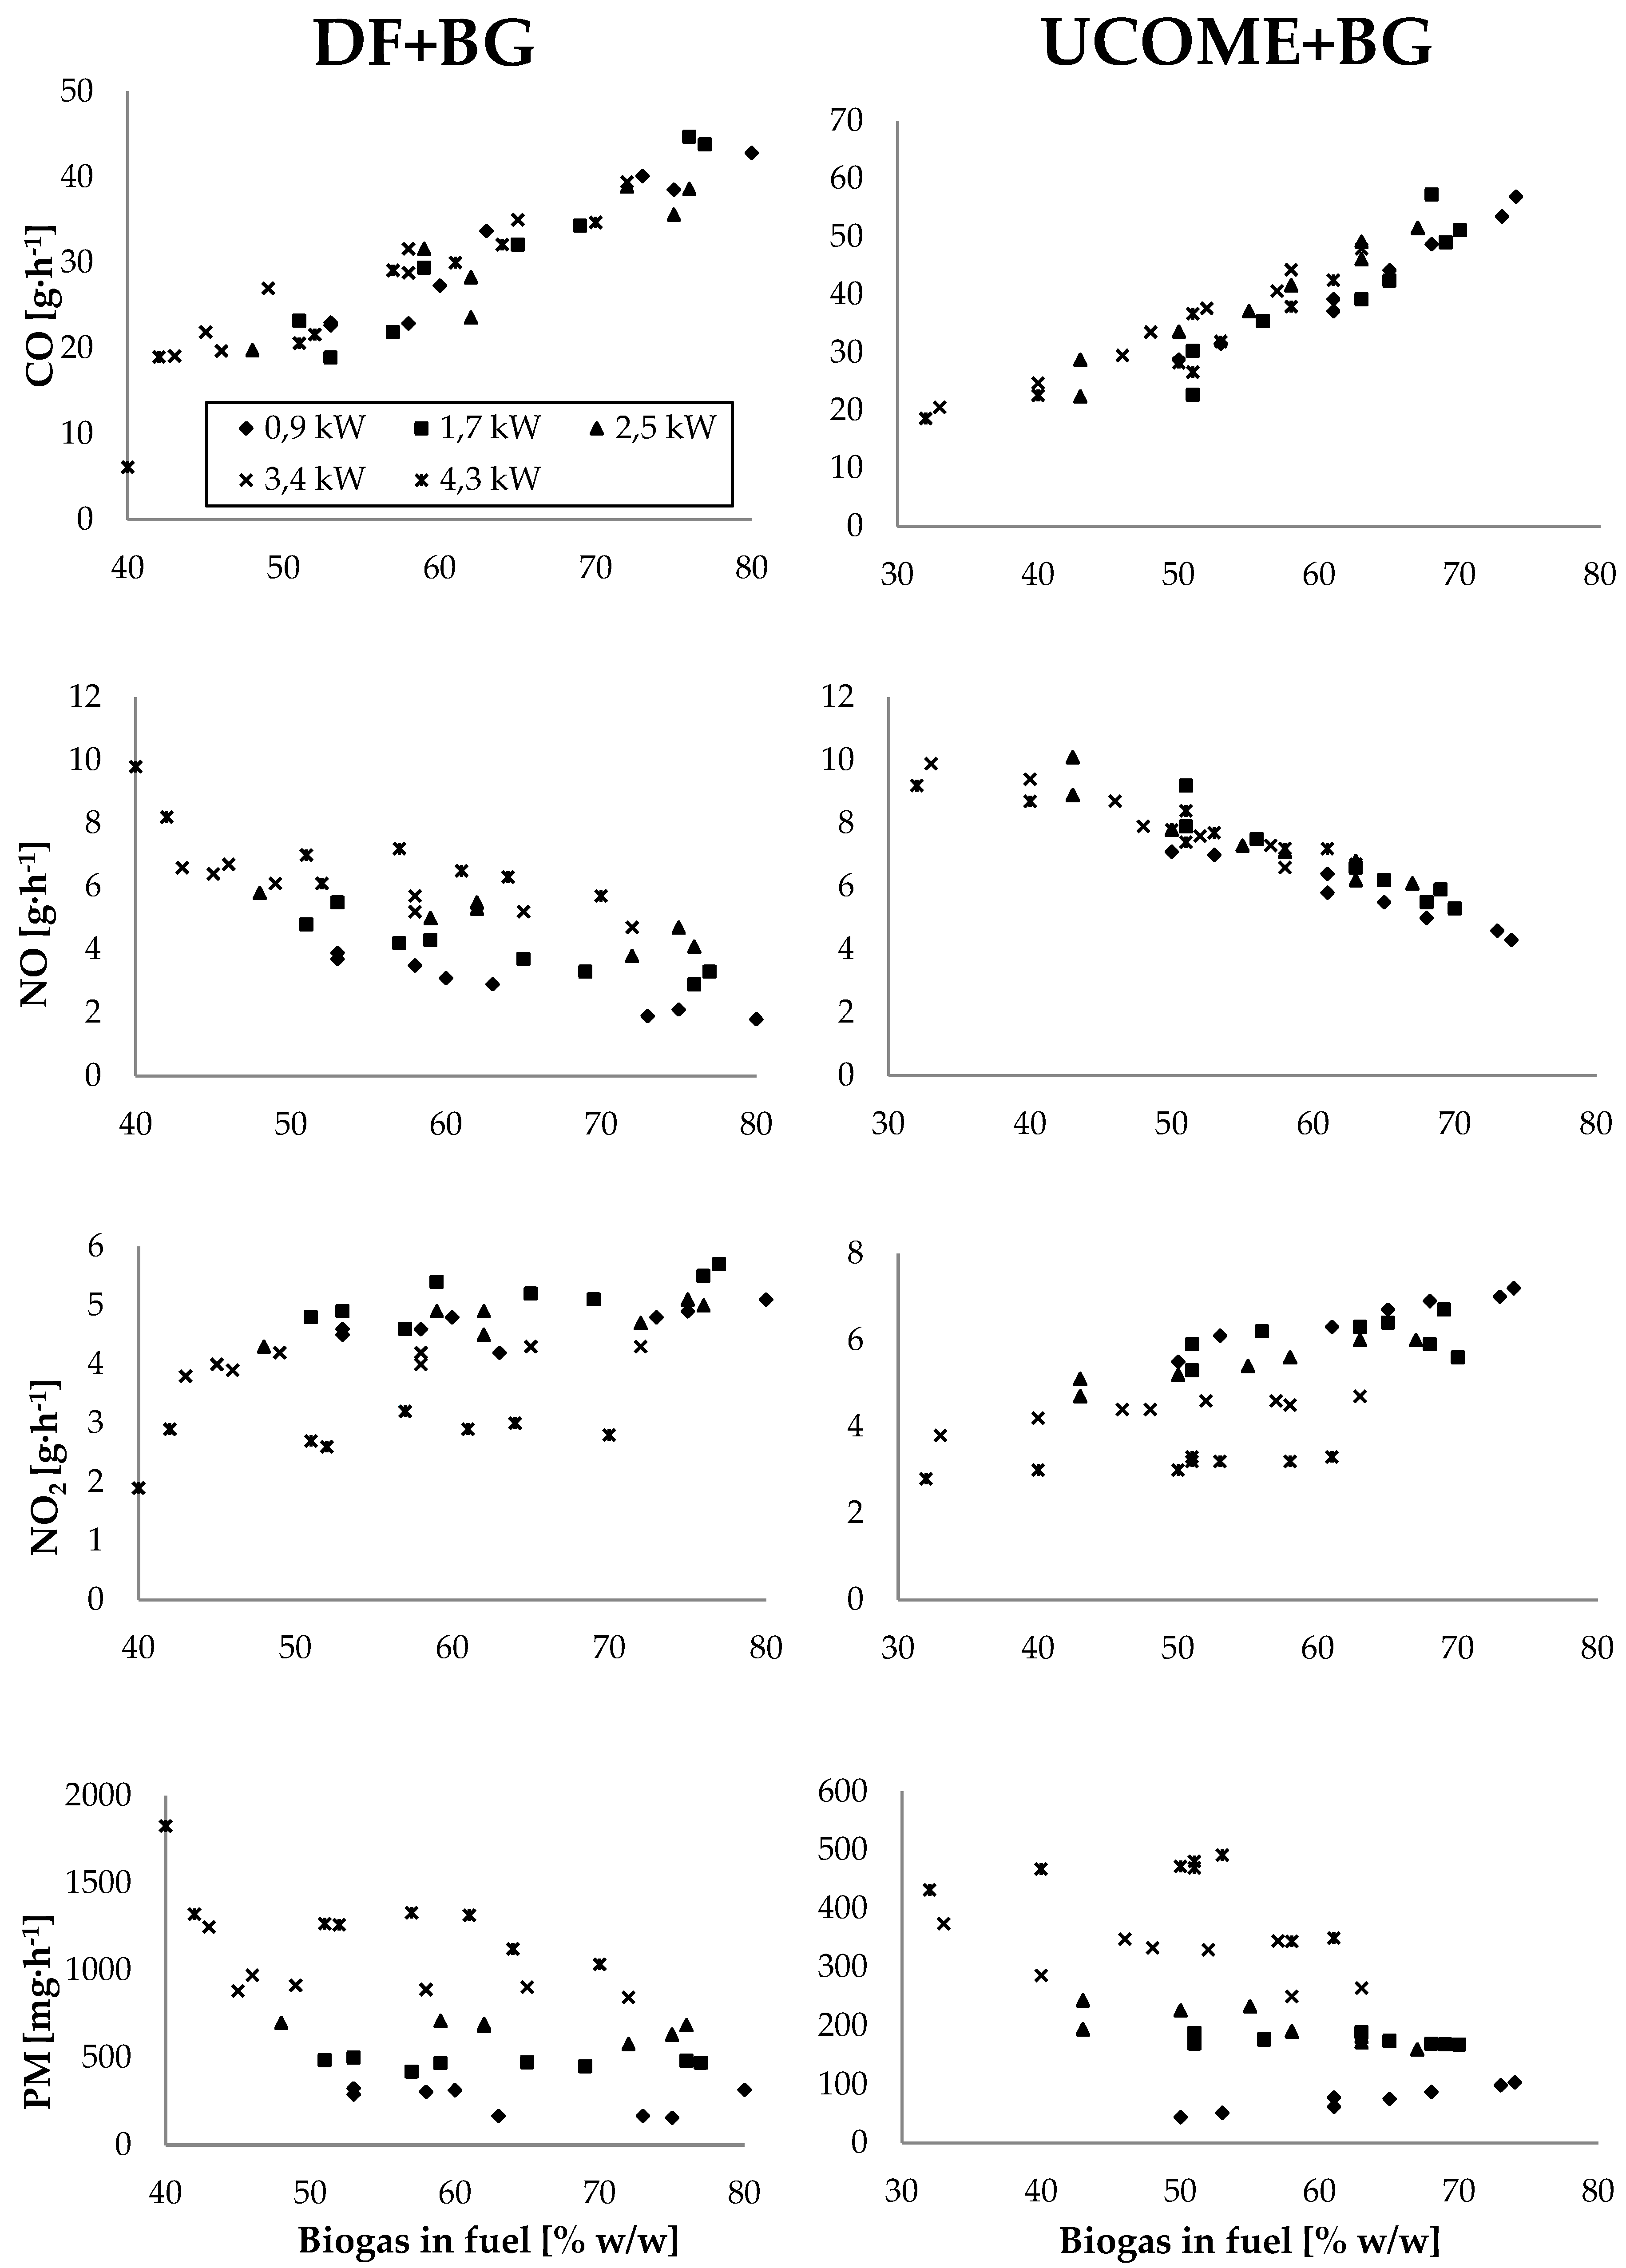
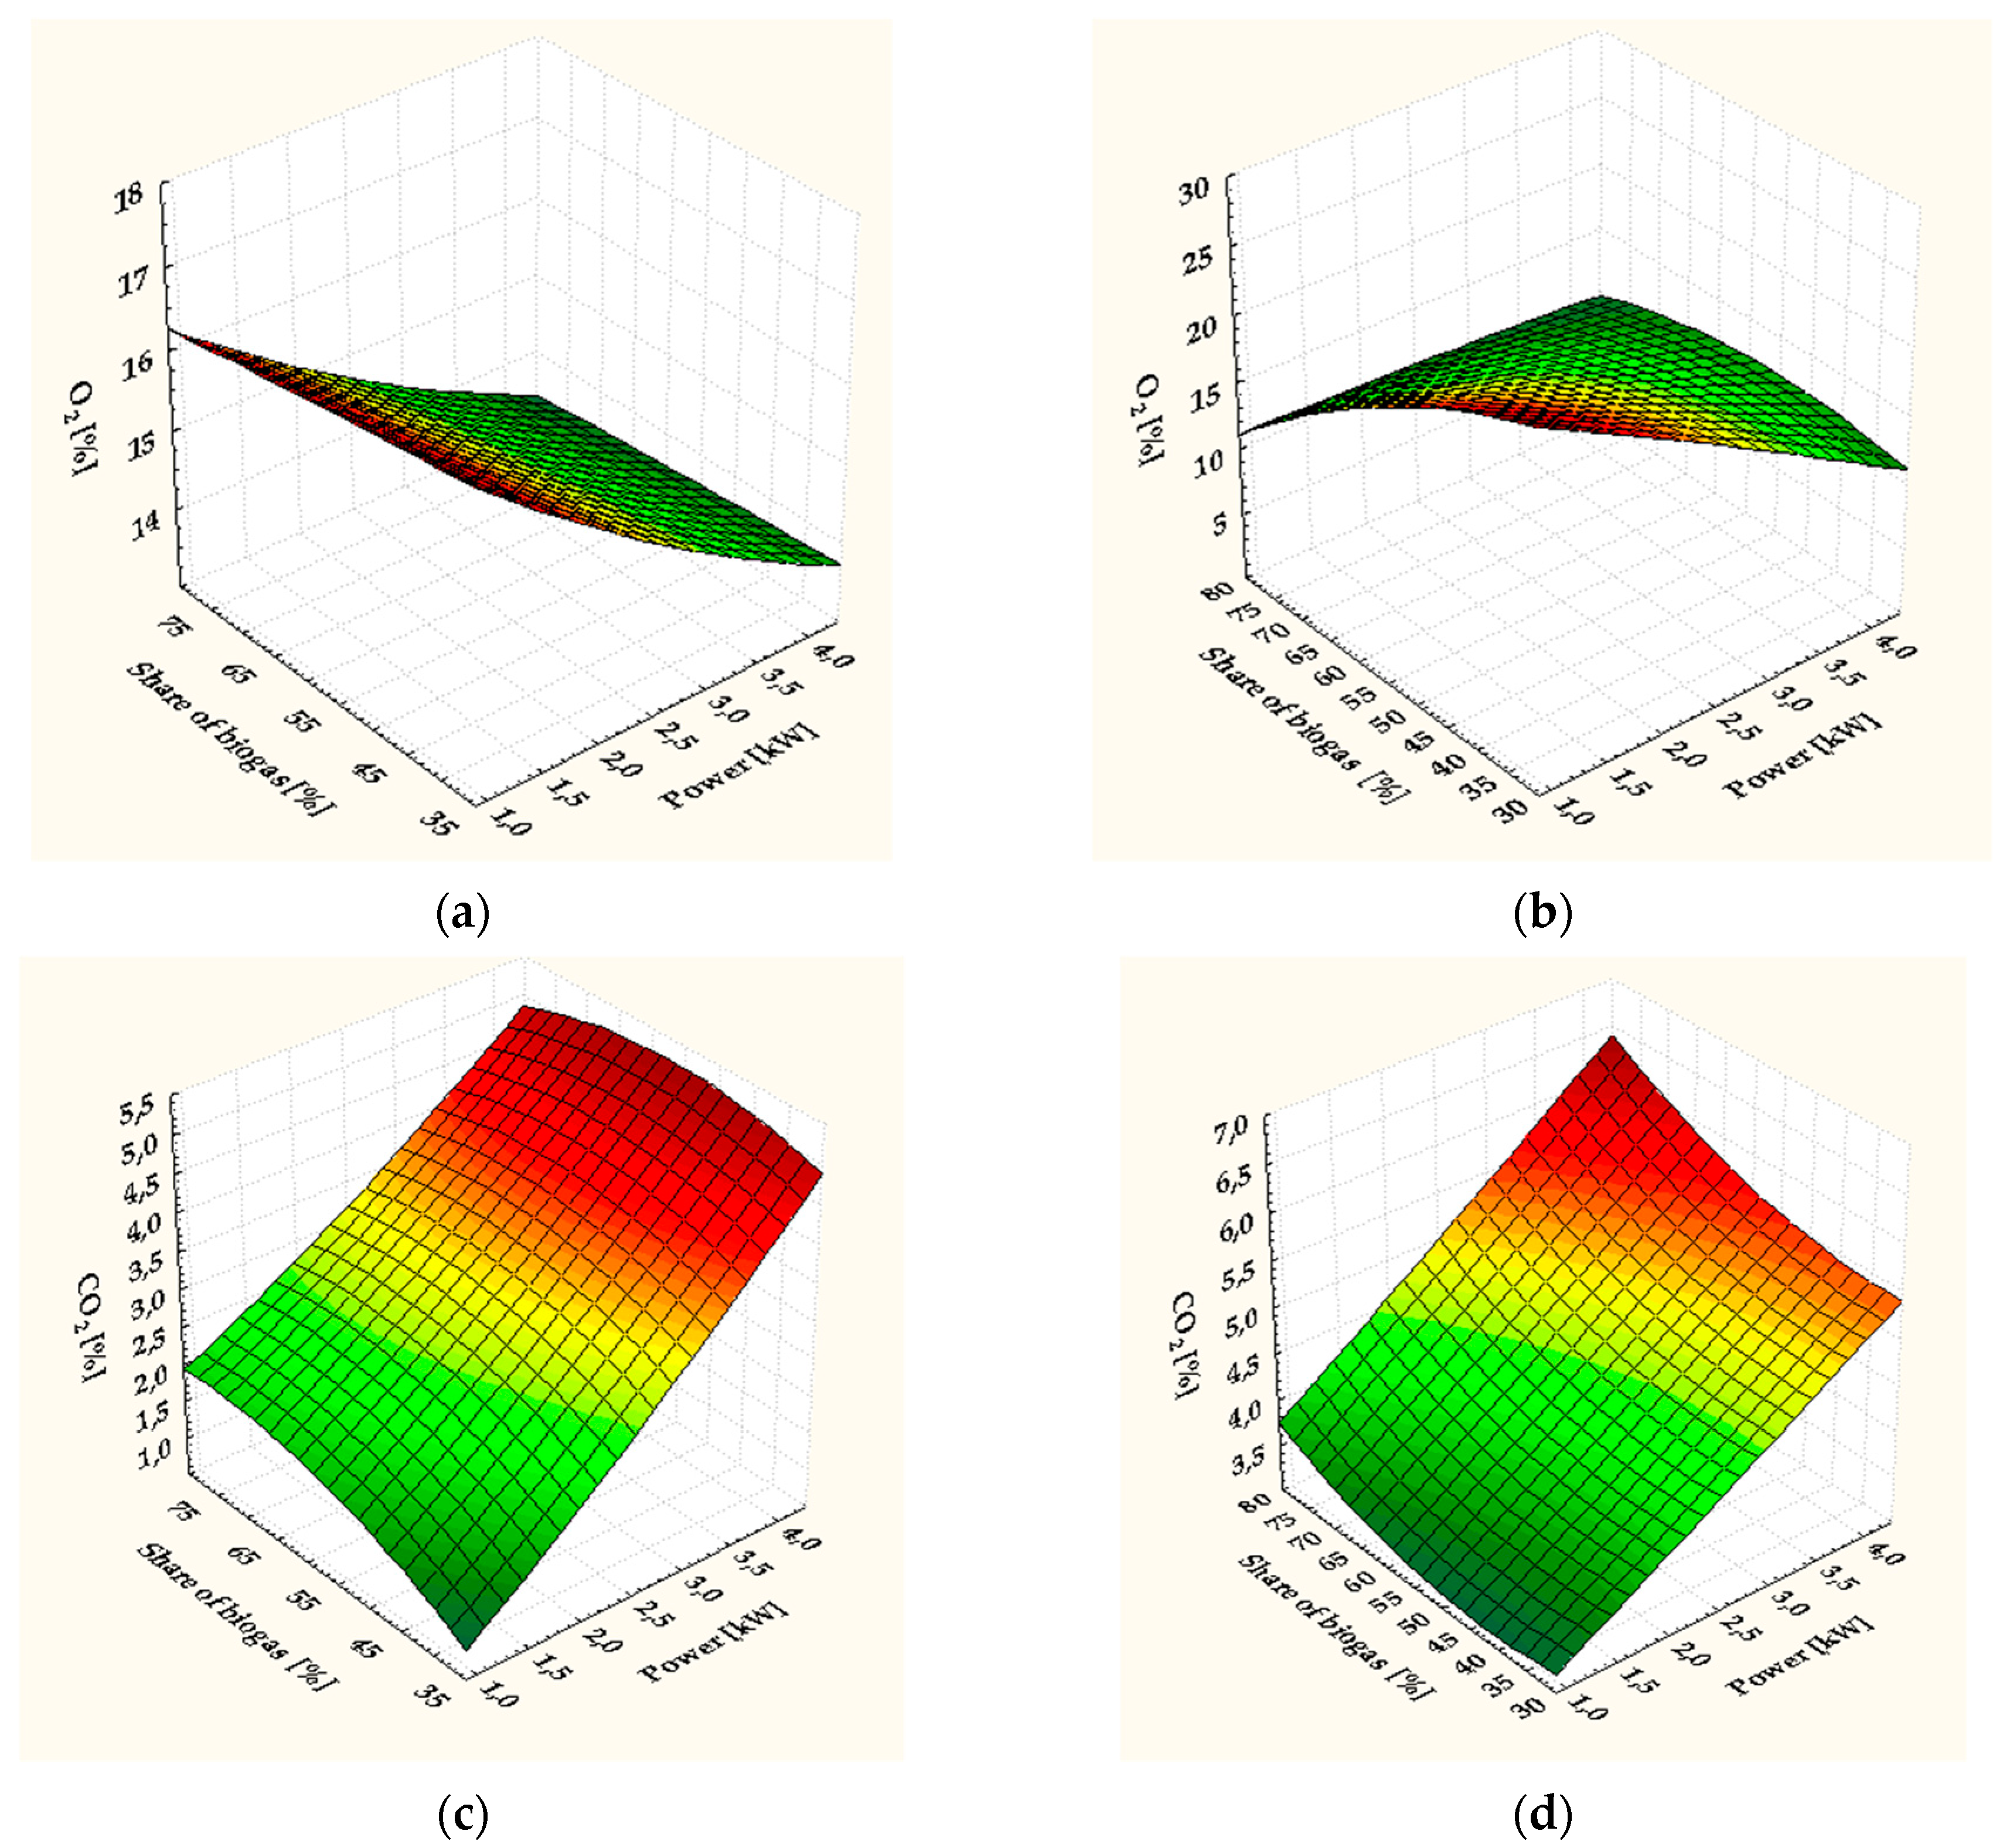
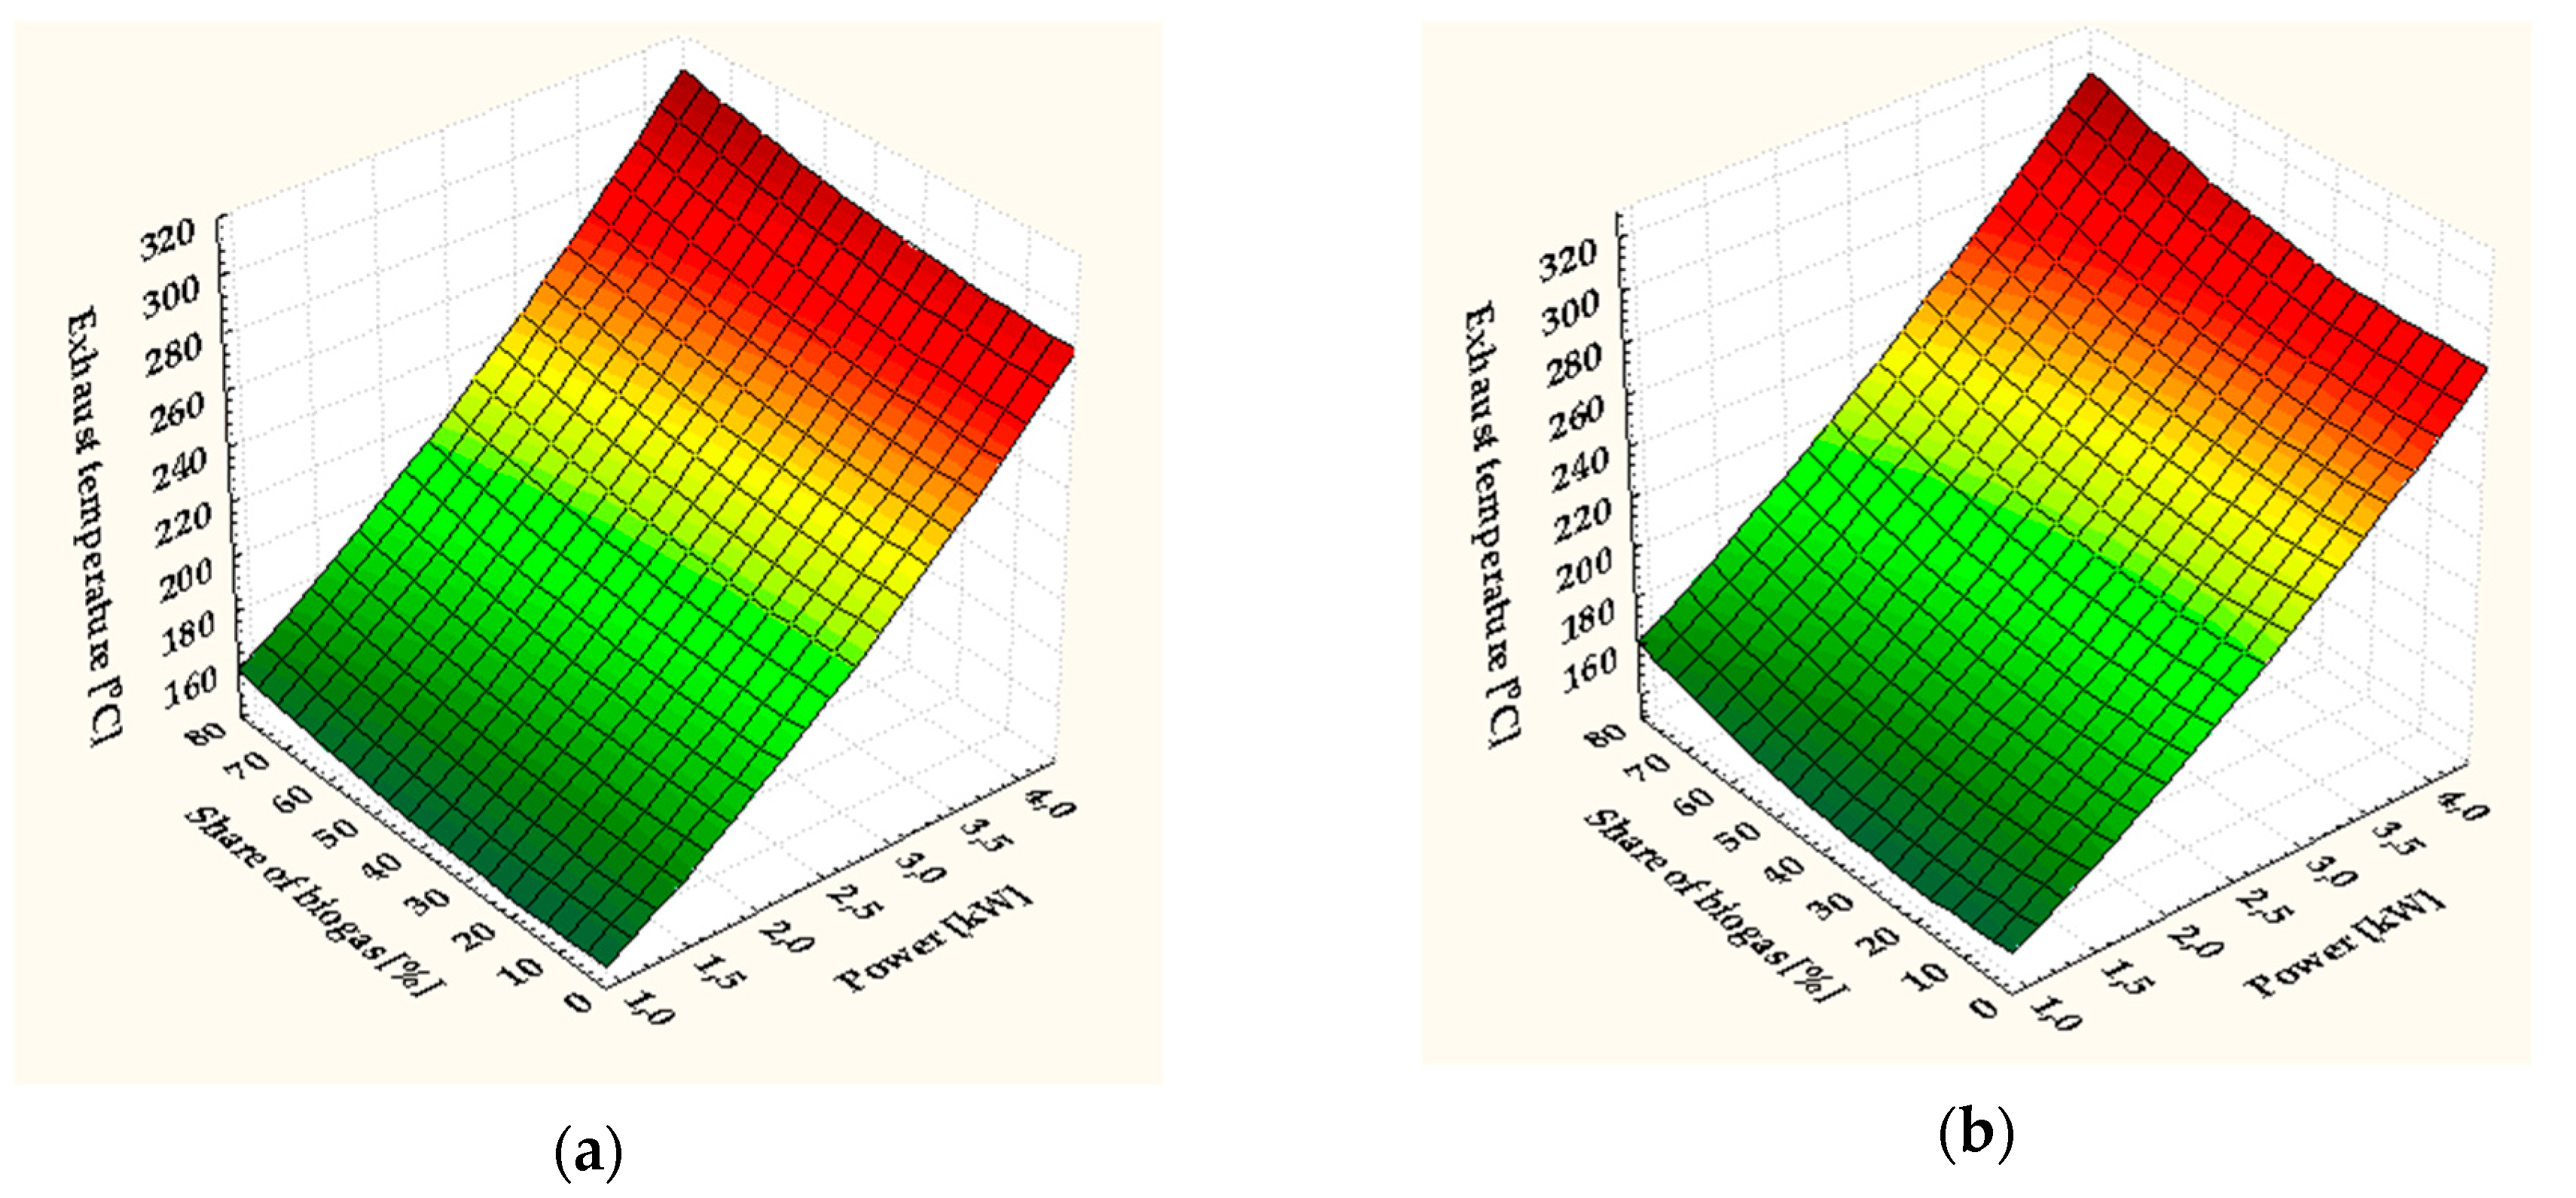
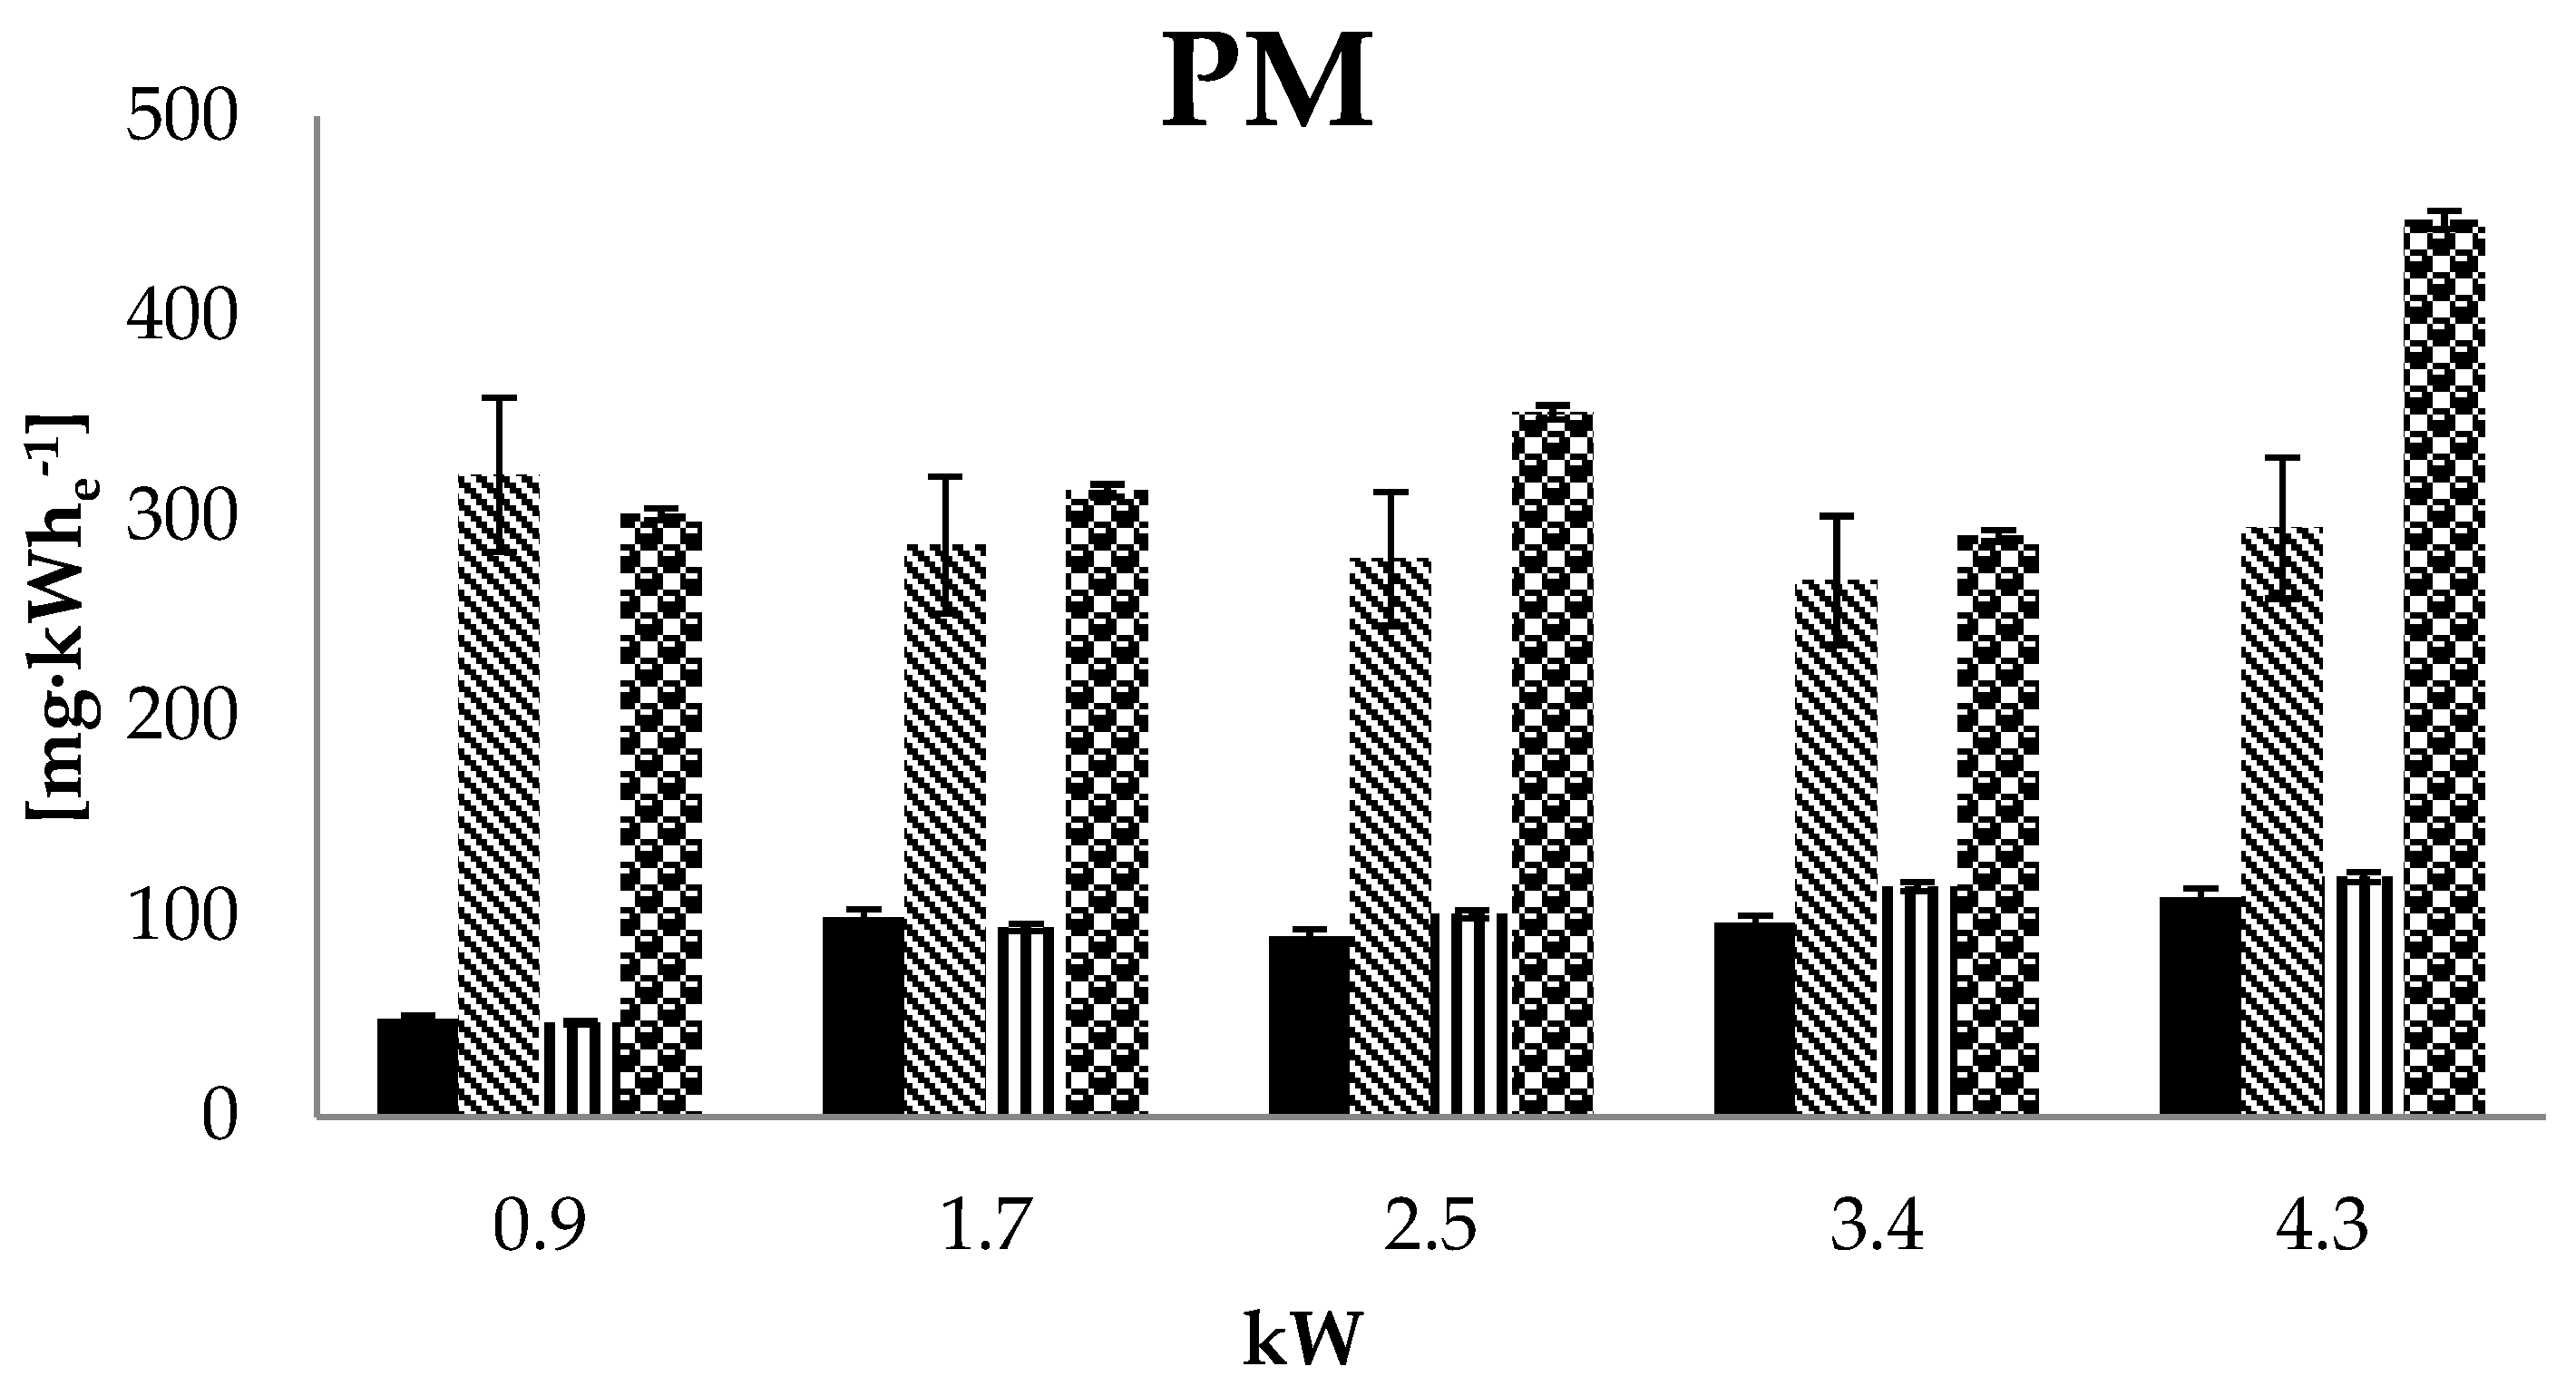
3. Results and Discussion

The results of research on the impact of the amount of biogas added to the electricity generator supply system on CO, NO, NO2, and PM emissions are shown in Figure 2. Biogas was added both for the commercial DF power supply and for the UCOME fat waste esters power supply. In order to correctly interpret the obtained results, Figure 3 presents graphs of the oxygen and carbon dioxide content in the exhaust gas depending on the engine load and level of biogas contribution. In addition, Figure 4 shows the effect of flue gas temperature changes depending on engine load and biogas share.
When it comes to CO—using different ratios of the BG and DF fuel mixture—the emission level varies from about 20 g·h−1 ± 10% for 40% w/w of the BG share to over 35 g·h−1 with the BG share exceeding 70% w/w. The obtained results confirm the previous studies [42,46]. While the UCOME + BG generator power was used, the level of CO emission also rose proportionately with the increase in the proportion of BG. However, in the indicated case, the CO emission level was clearly higher than when DF was used as liquid fuel. This was mainly due to the presence of oxygen in the biodiesel and a sharp drop in its content with the increase of biogas share above 70%, as shown in Figure 3. The difference of carbon monoxide content with the proportion of BG exceeding 70% w/w is about 30%. When analyzing the impact of engine load on the level of CO for both liquid fuels, no significant differences were found between low and full engine load. Differences resulted only from the chemical composition of the liquid fuel used.
In the research, the analyzed emissions of nitrogen oxides were divided into NO and NO2, which occurred in the highest concentration. When the engine was powered by the mixture of DF + BG and UCOME + BG, the increase in the share of BG in the fuel mixture caused a proportional reduction of NO emissions. A particularly noticeable tendency can be seen in the graph of the dependence of NO emission on the share of BG for the UCOME + BG mixture. At the same time, there is a difference in the level of NO emission between mixtures of liquid fuels and biogas. The application of DF is more favorable in this respect than biofuels, for which emissions are 10–20% higher. The level of NO content in the exhaust gases was affected by the load level of the tested engine, shown in Figure 3a. As the load increases, on one hand the combustion temperature increases (Figure 4a) and on the other hand the oxygen content in the combustion chamber decreases. It is clearly visible that a rapid increase in the combustion temperature is a determining factor and causes an increase in the NO content in the exhaust. If the engine was powered with biogas and UCOME, no effect of the load on the NO content in the exhaust was found. The reduction of NOX emissions can also be obtained by injecting water into the cylinder, which is confirmed in the studies by Chybowski et al. [64]. However, this increased the risk of corrosion and the cost of manufacturing and operation of the engine.
Due to the high harmfulness, special attention was paid to NO2 emission. Unfortunately, the study found an increase in NO2 emission with an increase in the share of BG in the fuel mixture, independently of the liquid fuel used. Increasing the share of BG causes an increase in the proportion of CO2 in the mixture, limiting the amount of oxygen and formation of NO2 instead of NO, as shown in Figure 2; Figure 3c,d. However, the differences in the level of NO2 emission between mixtures of liquid fuels with biogas are not as pronounced as in the case of the emission of NO. In the power supplies of both the DF and UCOME test engines, it was noticed that with the increase of the load, the NO2 concentration in the exhaust gas decreased significantly, which is shown in Figure 2. This is mainly due to the increase in the fuel dose and oxygen content reduction (Figure 3a,b), which limits the formation of NO2 molecules.
Figure 2 additionally shows the impact of the amount of the added biogas on the emission of PM particulates. At first glance, one can observe a two- or three-fold decrease in PM emission levels when using UCOME compared to DF power supply. On the other hand, increasing the BG content in the fuel dose only slightly reduces the PM emission level, solely for loads of 3.4 and 4.3 kW. At lower load values, no significant differences were found in the PM emission level regardless of the liquid fuel used. Analyzing the effect of the load level both on the DF and UCOME supply, it was found that for a low load level, the PM emission value was significantly lower. However, for high loads, the concentration of PM in the spins increased significantly, which was associated with an increase in the amount of fuel fed and a decrease in the oxygen content in the combustion chamber (Figure 3). Analogous results were obtained by Kim et al. [65] (tests were conducted in a single-cylinder test engine), who demonstrated a significant influence of the level of oxygen content in the structure of fuel particles on the level of PM emission.
Figure 4 shows the dependence of flue gas temperature on engine load and biogas share. As predicted, the temperature increased with the load, independently of the fuels used, which was also indicated by Barik et al. [48]. Taking into account the entire area of the graphs, one can notice differences between the used liquid fuels. Flue gas temperature values are slightly (from 4–20 °C) lower when powered by UCOME. Analogous relations were found in the work of Barik et al. [48]. This is mainly due to the lower calorific value of biodiesel and the content of oxygen atoms in the construction of particles of this fuel. The additional oxygen content in the fuel causes, above all, a higher level of nitrogen oxides, especially at low loads. This confirms the level of nitrogen oxide emissions for the engine under test (Figure 5). With regard to PM emissions, the additional oxygen content has a positive effect on its level by shortening the time of ignition delay and extending the time for fuel particles to burn out in full (Figure 5). Similar results were obtained by Aklouche et al. [47] and Barik et al. [48].
Taking into account the BG add-on to the engine’s fuel system, the proportions of carbon to hydrogen are changed. The physical properties of the fuel mixture and its decomposition in the combustion chamber also change. In the case of the tested BG engine, it is fed into the inlet manifold, which results in better mixing of gas and air. However, BG has a higher self-ignition temperature, and an increase in its amount in the combustion chamber results in the ignition delay of the fuel mixture. At the same time, the combustion of BG has a violent nature due to the size of the methane particles and its dispersion. This causes a delay in combustion and an increase in temperature in the combustion chamber, especially exhaust gas temperature, which can be seen in Figure 4. For both graphs, it can be seen that the increase in the share of BG causes an increase in the temperature of exhaust gases, and consequently an increase in nitrogen oxide emissions, especially at low engine loads (Figure 4).
Analyzing the dependence of CO, NO, NO2, and PM emissions on the BG content in the fuel mixture, it can be stated that—irrespective of the liquid fuel used—the most favorable proportion of BG and liquid fuel is constituted by the 50/50 biogas mass share. This can be justified by the fact that with the share of more than 50% w/w of BG, despite the decrease in NO concentration and with a relatively constant level of PM emission, the emission level of CO and of particularly dangerous NO2 is clearly on the rise. Therefore, in the further analyses, the share of biogas on the level of 50% w/w of BG in the fuel mixture was taken into account.
Figure 5 presents the changes in the unit emission level of the tested exhaust components CO, NO, NO2, and PM depending on the load and the type of fuels used. Analyzing the results, it can be concluded that the change in the engine load did not have a significant impact on the change in the CO emission level (Figure 5). On the other hand, the increase of the engine load level had a significant effect on the unit CO emission in relation to the amount of energy generated. The contribution of BG 50/50 during the UCOME engine supply resulted in a 9-fold increase in CO emissions and an 8-fold increase during the DF engine power supply (Figure 5).
NO and NO2 emissions were analyzed separately. The use of BG 50/50 during the combustion of liquid fuels results in a reduction of NO emission of about 50%, regardless of the type of liquid fuels, and a 3-fold increase in NO2 emissions (Figure 5). The analysis of current research shows that the presence of BG in fuel causes a reduction of total NOx emission [42,46]. With the power of 4.3 kWe generated by the engine, there was a NO reduction from 3 g·kWhe−1 to 1.8 g·kWhe−1 for UCOME and from 2.8 to 1.6 g·kWhe−1 for DF, resulting from a 50% share of BG in fuel. At the same time, regardless of the type of liquid fuel used, NO2 emission level increased from 0.3 g·kWhe−1 to 0.6 g·kWhe−1.
Based on the PM unit emission analysis, there is a clear reduction after the addition of BG only at 4.3 kW from 450 to 290 mg·kWhe−1. In other cases, the share of BG had a negligible impact on the volume of PM emission. On the other hand, a significant difference in PM emission was found with the use of various liquid fuels. The substitution of DF by UCOME resulted in a 4-fold reduction in PM emission (Figure 5).
As can be seen from the statistical analysis of the univariate variance on the emission level expressed in mg·h−1, where the independent variables were the type of fuel: 100% DF, 100% UCOME, 50/50 (w/w) DF + BG, 50/50 (w/w) UCOME + BG, and a change in the proportion of BG in liquid fuels in the range of 40–80% (w/w), a significant impact on the mass stream of the emitted CO in all studied cases was observed. The emission of NO2 was impacted only by the addition of BG, whereas PM was influenced by the type of liquid fuel (Table 5).
On the basis of statistical analysis, it can be concluded that the share of BG and the type of liquid fuel had a significant impact on the mass stream of the emitted CO. The correlation analysis shows that the increase in the proportion of BG in fuels reduces NO and PM but increases the emission of CO and NO2.

4. Conclusions

This study investigated the influence of the addition of BG co-combusted with liquid fuels, diesel oil, and biodiesel on unit emissions of CO, NO, NO2, and PM in engines used to drive power generators for biogas plants. In order to introduce BG to the engine fuel supply, two gas injectors were installed in the intake manifold of the engine. As a biofuel, methyl esters of higher fatty acids produced from WCO (waste cooking oil) were used. The research engine connected to the power generator was run at variable but stabilized conditions without modifications to the engine control system. The results have revealed the complex nature of the influence of level of BG additive on emissions of toxic exhaust components, with particular regard to NO and NO2 emissions. The findings of this study are summarized below.
  • With the increase of the BG share in the engine fuel supply, the amount of carbon oxides increases significantly. It is caused by the change of parameters of the engine fuel supply at constant operating parameters. A change in the injection angle may result in CO emission reduction; however, the reduction is slight in relation to the engine emission powered solely by DF, as evidenced in other tests [42,45,47,49]. The place and method of BG injection is also important, i.e., the injection into the inlet manifold. The use of multi-point or even direct injection could clearly reduce CO emission.
  • The presence of BG in the engine feed mixture significantly reduces NOx. However, if we analyze the emission of NO and NO2 separately, we can see a clear increase in the emission of NO2 toxic particles. It follows that the presence of BG in fuels has a negative impact on the qualitative and quantitative composition of nitrogen oxides emitted in exhaust fumes.
  • Replacing DF with UCOME fuel reduces both NO and NO2. The use of UCOME + BG mixture in comparison to the engine power supply with DF + BG fuel shows a negligible reduction in the amount of NO2.
  • A three- to four-times reduction of PM emission was detected when the liquid fuel DF was replaced by UCOME. On the other hand, the presence of BG had no significant effect on the amount of PM in the exhaust fumes, regardless of the liquid fuel used.
  • The improvement of the composition of exhaust emissions can also be performed using other constructions of a diesel engine. The use of a turbocharged engine will result in better reduction of exhaust gases or the introduction of water into the combustion chamber.
The results of the research show the consequences of using a typical diesel engine in an agricultural biogas plant. Ignition of a diesel engine working on biogas must be initiated with liquid fuels, therefore the dual fuel unit was tested. The presented test results are preliminary tests for long-term operational tests of biogas plants using a dual fuel engine. The tests are planned for the spring of 2019.

Author Contributions

W.G. and P.K. designed the experiments; P.K. and W.G. prepared the methodology; G.W., D.M., and W.G. prepared the test stand; W.G., P.K., and D.M. performed the experiments; P.K., W.G., D.M. performed data processing; W.G. and P.K. analyzed the data and discussed the observed data trends; W.G. performed the statistical analyses. All authors contributed to writing the paper.

Funding

The work carried out under this project was financed by the National Center for Research and Development implemented in the BIOSTRATEG program, contract No. BIOSTRATEG1/269056/5/NCBR/2015 dated 11/08/2015. The participation of PK in the publication was funded by appropriations of the Faculty of Production Engineering University of Life Sciences in Lublin within the framework of grants to maintain the research potential.

Conflicts of Interest

The authors declare no conflict of interest. The funders had no role in the design of the study—in the collection, analyses, or interpretation of data, in the writing of the manuscript, or in the decision to publish the results.

List of Symbols and Acronyms

A*mass amount of gases, kmol·h−1
AFair filter
AMsynchronous engine
Bshare of x gas (CO, NO, NO2) in the exhaust, mg·kg−1
BGbiogas
BGTbiogas tank
CFPPcold filter plugging point
CH4methane
COcarbon monoxide
CO2carbon dioxide
CScontrol system
CSMcontrol system monitor
DEdiesel engine
DFdiesel fuel
DFTdiesel fuel tank
DMdiesel (liquid fuel) mass flow meter
EAemission analyzation system
EPexhaust pipe
EPMmeasurement probe for exhaust gases
ESexhaust silencer
FTfuel temperature measurement
GCgas pressure regulator and flow control value
GSIgas injector control system
H2Shydrogen sulfide
IMintake manifold
kWheelectricity unit
Mmolar mass of the i-th gas, kg·kmol−1
NOnitric oxide
NO2nitrogen dioxide
NOxoxides of nitrogen
O2oxygen
Ppressure in the exhaust manifold, Pa
PCcomputer
PMparticulate matter
Runiversal gas constant, J·kg−1·K−1
Texhaust gases temperature, K
UCOused cooking oil
UCOMEuse cooking oil methyl ester
UCOMETwaste cooking oil methyl ester tank
V*exhaust gases flow, in normal m3·h−1
WCOwaste cooking oil
WSweather station
Xmass stream for NO, NO2, PM, and CO, mg·h−1
yquantitative share of the i-th gas

References

  1. Li, H.; Shi, L.; Deng, K. Development of turbocharging system for diesel engines of power generation application at different altitudes. J. Energy Inst. 2016, 89, 755–765. [Google Scholar] [CrossRef]
  2. Shelar, M.N.; Bagade, S.D.; Kulkarni, G.N. Energy and Exergy Analysis of Diesel Engine Powered Trigeneration Systems. Energy Proc. 2016, 90, 27–37. [Google Scholar] [CrossRef]
  3. Seifi, M.R.; Hassan-Beygi, S.R.; Ghobadian, B.; Desideri, U.; Antonelli, M. Experimental investigation of a diesel engine power, torque and noise emission using water-diesel emulsions. Fuel 2016, 166, 392–399. [Google Scholar] [CrossRef]
  4. Mikulski, M.; Wierzbicki, S. Numerical investigation of the impact of gas composition on the combustion process in a dual-fuel compression-ignition engine. J. Nat. Gas Sci. Eng. 2016, 31, 525–537. [Google Scholar] [CrossRef]
  5. Wasilewski, J.; Krzaczek, P. Emission of toxic compounds from combustion of biodiesel: A report from studies. Przem. Chem. 2014, 93, 343–346. [Google Scholar] [CrossRef]
  6. Zając, G.; Węgrzyn, A. Analysis of work parameters changes of diesel engine powered with diesel fuel and faee blends. Eksploat. Niezawodn. 2008, 38, 17–24. [Google Scholar]
  7. Hoseini, S.S.; Najafi, G.; Ghobadian, B.; Mamat, R.; Sidik, N.A.C.; Azmi, W.H. The effect of combustion management on diesel engine emissions fueled with biodiesel-diesel blends. Renew. Sustain. Energy Rev. 2017, 73, 307–331. [Google Scholar] [CrossRef] [Green Version]
  8. Asokan, M.A.; Senthur prabu, S.; Kamesh, S.; Khan, W. Performance, combustion and emission characteristics of diesel engine fuelled with papaya and watermelon seed oil bio-diesel/diesel blends. Energy 2018, 145, 238–245. [Google Scholar] [CrossRef]
  9. Hossain, F.M.; Rainey, T.J.; Ristovski, Z.; Brown, R.J. Performance and exhaust emissions of diesel engines using microalgae FAME and the prospects for microalgae HTL biocrude. Renew. Sustain. Energy Rev. 2018, 82, 4269–4278. [Google Scholar] [CrossRef]
  10. Zhang, Z.; Zhang, Z.; Jiaqiang, E.; Deng, Y.; Pham, M.H.; Zuo, W.; Peng, Q.; Yin, Z. Effects of fatty acid methyl esters proportion on combustion and emission characteristics of a biodiesel fueled marine diesel engine. Energy Convers. Manag. 2018, 159, 244–253. [Google Scholar] [CrossRef]
  11. Gopal, K.; Sathiyagnanam, A.P.; Kumar, B.R.; Saravanan, S.; Rana, D.; Sethuramasamyraja, B. Prediction of emissions and performance of a diesel engine fueled with n-octanol/diesel blends using response surface methodology. J. Clean. Prod. 2018, 184, 423–439. [Google Scholar] [CrossRef]
  12. Bhuiya, M.M.K.; Rasul, M.G.; Khan, M.M.K.; Ashwath, N.; Azad, A.K.; Hazart, M.A. Prospects of 2nd generation biodiesel as a sustainable fuel—Part 2: Properties, performance and emission characteristics. Renew. Sustain. Energy Rev. 2016, 55, 1129–1146. [Google Scholar] [CrossRef]
  13. Czechlowski, M.; Golimowski, W.; Sęk, T.; Szymanowicz, J. Exhaust opacity in a diesel engine powered with animal fats. Eksploat. Niezawodn. 2015, 7, 49–53. [Google Scholar] [CrossRef]
  14. Canakci, M.; Sandli, H. Biodiesel production from various feedstocks and their effects on the fuel properties. J. Ind. Microbiol. Biotechnol. 2008, 35, 431–441. [Google Scholar] [CrossRef]
  15. Rehan, M.; Gardy, J.; Demirbas, A.; Rashid, U.; Budzianowski, W.M.; Pant, D.; Nizami, A.S. Waste to biodiesel: A preliminary assessment for Saudi Arabia. Bioresour. Technol. 2018, 250, 17–25. [Google Scholar] [CrossRef]
  16. Sander, A.; Košćak, M.A.; Kosir, D.; Milosavljević, N.; Vuković, J.P.; Magić, L. The influence of animal fat type and purification conditions on biodiesel quality. Renew. Energy 2018, 118, 752–760. [Google Scholar] [CrossRef]
  17. Bhuiya, M.M.K.; Rasul, M.G.; Khan, M.M.K.; Ashwath, N.; Azad, A.K.; Hazart, M.A. Prospects of 2nd generation biodiesel as a sustainable fuel—Part 1: Selection of feedstocks, oil extraction techniques and conversion technologies. Renew. Sustain. Energy Rev. 2016, 55, 1109–1128. [Google Scholar] [CrossRef]
  18. Cubas, A.L.V.; Machado, M.M.; Pinto, C.R.S.C.; Moecke, E.H.S.; Dutra, A.R.A. Biodiesel production using fatty acids from food industry waste using corona discharge plasma technology. Waste Manag. 2016, 47, 149–154. [Google Scholar] [CrossRef] [PubMed]
  19. Corro, G.; Sánchez, N.; Pal, U.; Bañuelos, F. Biodiesel production from waste frying oil using waste animal bone and solar heat. Waste Manag. 2016, 47, 105–113. [Google Scholar] [CrossRef] [PubMed]
  20. Lin, L.; Ying, D.; Chaitep, S.; Vittayapadung, S. Biodiesel production from crude rice bran oil and properties as fuel. Appl. Energy 2009, 86, 681–688. [Google Scholar] [CrossRef]
  21. Lu, H.; Liu, Y.; Zhou, H.; Yang, Y.; Chen, M.; Liang, B. Production of biodiesel from Jatropha curcas L. oil. Comput. Chem. Eng. 2009, 33, 1091–1096. [Google Scholar] [CrossRef]
  22. Mekhilef, S.; Siga, S.; Saidur, R. A review on palm oil biodiesel as a source of renewable fuel. Renew. Sustain. Energy Rev. 2011, 15, 1937–1949. [Google Scholar] [CrossRef]
  23. Qiu, F.; Li, Y.; Yang, D.; Li, X.; Sun, P. Biodiesel production from mixed soybean oil and rapeseed oil. Appl. Energy 2011, 88, 2050–2055. [Google Scholar] [CrossRef]
  24. Matwijczuk, A.; Zając, G.; Kowalski, R.; Kachel-Jakubowska, M.; Gagoś, M. Spectroscopic studies of the quality of fatty acid methyl esters derived from waste cooking oil. Pol. J. Environ. Stud. 2017, 26, 2643–2650. [Google Scholar] [CrossRef]
  25. Marcinkowski, D.; Rukowicz, B.; Golimowski, W.; Czechlowski, M.; Krzaczek, P.; Piekarski, W. Effect of selected depressants on cold filter plugging point for methyl esters obtained from transesterification of waste vegetable and animal fats. Przem. Chem. 2017, 96, 1927–1930. [Google Scholar] [CrossRef]
  26. Krzaczek, P.; Rybak, A.; Bochniak, A. The impact of selected biofuels on the performance parameters of the Common Rail power system in the utility engine. In Proceedings of the BulTrans-2018—10th International Scientific Conference on Aeronautics, Automotive and Railway Engineering and Technologies, Sozopol, Bulgaria, 15–17 September 2018. [Google Scholar] [CrossRef]
  27. Szmigielski, M.; Piekarski, W.; Andrejko, D.; Ślaska-Grzywna, B.; Masłowski, A.; Zając, G.; Sagan, A.; Jaśkiewicz, T.; Rachańczyk, I. Recovery of fatty substances from post-frying waste materials by extraction with hexane. Przem. Chem. 2014, 93, 649–651. [Google Scholar] [CrossRef]
  28. Giakoumis, E.G.; Sarakatsanis, C.K. A Comparative Assessment of Biodiesel Cetane Number Predictive Correlations Based on Fatty Acid Composition. Energies 2019, 12, 422. [Google Scholar] [CrossRef]
  29. Muradin, M.; Foltynowicz, Z. Potential for Producing Biogas from Agricultural Waste in Rural Plants in Poland. Sustainability 2014, 6, 5065–5074. [Google Scholar] [CrossRef] [Green Version]
  30. Yontar, A.A.; Doğu, Y. Investigation of the effects of gasoline and CNG fuels on a dual sequential ignition engine at low and high load conditions. Fuel 2018, 232, 114–123. [Google Scholar] [CrossRef]
  31. Budzianowski, W.M.; Budzianowska, D.A. Economic analysis of biomethane and bioelectricity generation from biogas using different support schemes and plant configurations. Energy 2015, 88, 658–666. [Google Scholar] [CrossRef]
  32. Nitsche, M.; Hensgen, F.; Wachendorf, M. Energy Generation from Horse Husbandry Residues by Anaerobic Digestion, Combustion, and an Integrated Approach. Sustainability 2017, 9, 358. [Google Scholar] [CrossRef]
  33. Szymańska, D.; Lewandowska, A. Biogas Power Plants in Poland—Structure, Capacity, and Spatial Distribution. Sustainability 2015, 7, 16801–16819. [Google Scholar] [CrossRef] [Green Version]
  34. Akbarian, E.; Najafi, B. A novel fuel containing glycerol triacetate additive, biodiesel and diesel blends to improve dual-fuelled diesel engines performance and exhaust emissions. Fuel 2019, 236, 666–676. [Google Scholar] [CrossRef]
  35. Cucui, G.; Ionescu, C.A.; Goldbach, I.R.; Coman, M.D.; Marin, E.L.M. Quantifying the Economic Effects of Biogas Installations for Organic Waste from Agro-Industrial Sector. Sustainability 2018, 10, 2582. [Google Scholar] [CrossRef]
  36. Pillay, A.; Molki, A.; Elkadi, M.; Manuel, J.; Bojanampati, S.; Khan, M.; Stephen, S. Real-Time Study of Noxious Gas Emissions and Combustion Efficiency of Blended Mixtures of Neem Biodiesel and Petrodiesel. Sustainability 2013, 5, 2098–2107. [Google Scholar] [CrossRef] [Green Version]
  37. Basavarajappa, Y.H.; Banapurmath, N.R.; Pradeep, G.; Vinod, R.; Yaliwal, V. Performance and emission characteristics of a CNG-Biodiesel dual fuel operation of a single cylinder four stroke CI engine. IOP Conf. Ser. Mater. Sci. Eng. 2018, 376, 012028. [Google Scholar] [CrossRef]
  38. Duda, K.; Wierzbicki, S.; Śmieja, M.; Mikulski, M. Comparison of performance and emissions of a CRDI diesel engine fueled with biodiesel of different origin. Fuel 2018, 212, 202–222. [Google Scholar] [CrossRef]
  39. Wu, D.; Zhang, F.; Lou, W.; Li, D.; Chen, J. Chemical characterization and toxicity assessment of fine particulate matters emitted from the combustion of petrol and diesel fuels. Sci. Total Environ. 2017, 605–606, 172–179. [Google Scholar] [CrossRef] [PubMed]
  40. Lozhkina, O.V.; Lozhkin, V.N. Estimation of nitrogen oxides emissions from petrol and diesel passenger cars by means of on-board monitoring: Effect of vehicle speed, vehicle technology, engine type on emission rates. Transp. Res. D 2016, 47, 251–264. [Google Scholar] [CrossRef]
  41. Oczkowski, E.; Wong, A.; Sharma, K. The impact of major fuel retailers on regional New South Wales petrol prices. Econ. Anal. Policy 2018, 57, 44–59. [Google Scholar] [CrossRef]
  42. Verma, S.; Das, L.M.; Bhatti, S.S.; Kaushik, S.C. A comparative exergetic performance and emission analysis of pilot diesel dual-fuel engine with biogas, CNG and hydrogen as main fuel. Energy Convers. Manag. 2017, 151, 764–777. [Google Scholar] [CrossRef]
  43. Mikulski, M.; Wierzbicki, S.; Piętak, A. Numerical studies on controlling gaseous fuel combustion process of diesel pilot dose in a dual-fuel engine. Chem. Process. Eng. 2015, 36, 225–238. [Google Scholar] [CrossRef]
  44. Barik, D.; Murugan, S.; Samal, S.; Sivaram, N.M. Combined effect of compression ratio and diethyl ether (DEE) port injection on performance and emission characteristics of a DI diesel engine fueled with upgraded biogas (UBG)-biodiesel dual fuel. Fuel 2017, 209, 339–349. [Google Scholar] [CrossRef]
  45. Ibrahim, M.M.; Narasimhan, J.V.; Ramesh, A. Comparison of the predominantly premixed charge compression ignition and the dual fuel modes of operation with biogas and diesel as fuels. Energy 2015, 89, 990–1000. [Google Scholar] [CrossRef]
  46. Bora, B.J.; Saha, U.K.; Chatterjee, S.; Veer, V. Effect of compression ratio on performance, combustion and emission characteristics of a dual fuel diesel engine run on raw biogas. Energy Convers. Manag. 2014, 87, 1000–1009. [Google Scholar] [CrossRef]
  47. Aklouche, F.Z.; Loubar, K.; Bentebbiche, A.; Awad, S.; Tazerout, M. Experimental investigation of the equivalence ratio influence on combustion, performance and exhaust emissions of a dual fuel diesel engine operating on synthetic biogas fuel. Energy Convers. Manag. 2017, 152, 291–299. [Google Scholar] [CrossRef]
  48. Barik, D.; Murugan, S. Experimental investigation on the behavior of a DI diesel engine fueled with raw biogas–diesel dual fuel at different injection timing. J. Energy Inst. 2016, 89, 373–388. [Google Scholar] [CrossRef]
  49. Kalsi, S.S.; Subramanian, K.A. Effect of simulated biogas on performance, combustion and emissions characteristics of a bio-diesel fueled diesel engine. Renew. Energy 2017, 106, 78–90. [Google Scholar] [CrossRef]
  50. Kim, Y.; Kawahara, N.; Tsuboi, K.; Tomita, E. Combustion characteristics and NOX emissions of biogas fuels with various CO2 contents in a micro co-generation spark-ignition engine. Appl. Energy 2016, 182, 539–547. [Google Scholar] [CrossRef]
  51. Luijten, C.C.M.; Kerkhof, E. Jatropha oil and biogas in a dual fuel CI engine for rural electrification. Energy Convers. Manag. 2011, 52, 1426–1438. [Google Scholar] [CrossRef]
  52. Tippayawong, N.; Promwungkwa, A.; Rerkkriangkrai, P. Long-term operation of a small biogas/diesel dual-fuel engine for on-farm electricity generation. Biosyst. Eng. 2007, 98, 26–32. [Google Scholar] [CrossRef]
  53. Bedoya, I.D.; Arrieta, A.A. Francisco Javier Cadavid. Effects of mixing system and pilot fuel quality on diesel–biogas dual fuel engine performance. Bioresour. Technol. 2009, 100, 6624–6629. [Google Scholar] [CrossRef] [PubMed]
  54. Bora, B.J.; Saha, U.K. Optimisation of injection timing and compression ratio of a raw biogas powered dual fuel diesel engine. Appl. Therm. Eng. 2016, 92, 111–121. [Google Scholar] [CrossRef]
  55. Barik, D.; Murugan, S. Simultaneous reduction of NOx and smoke in a dual fuel DI diesel engine. Energy Convers. Manag. 2014, 84, 217–226. [Google Scholar] [CrossRef]
  56. Cacua, K.; Amell, A.; Cadavid, F. Effects of oxygen enriched air on the operation and performance of a diesel-biogas dual fuel engine. Biomass Bioenergy 2012, 45, 159–167. [Google Scholar] [CrossRef]
  57. Kim, Y.; Kawahara, N.; Tomita, E.; Oshibe, H.; Nishikawa, K. Effect of Bio-Gas Contents on SI Combustion for a Co-Generation Engine; SAE Technical Paper 2015-01-1946; SAE: Warrendale, PA, USA, 2015. [Google Scholar] [CrossRef]
  58. Yoon, S.H.; Lee, C.S. Experimental investigation on the combustion and exhaust emission characteristics of biogas–biodiesel dual-fuel combustion in a CI engine. Fuel Process. Technol. 2011, 92, 992–1000. [Google Scholar] [CrossRef]
  59. Koszałka, G.; Hunicz, J. Detailed speciation of emissions from a diesel engine fuelled with canola methyl ester. In Proceedings of the BulTrans-2018—10th International Scientific Conference on Aeronautics, Automotive and Railway Engineering and Technologies, Sozopol, Bulgaria, 15–17 September 2018. [Google Scholar] [CrossRef]
  60. Koszałka, G.; Hunicz, J.; Niewczas, A. A Comparison of Performance and Emissions of an Engine Fuelled with Diesel and Biodiesel. SAE Int. J. Fuels Lubr. 2010, 3, 77–84. [Google Scholar] [CrossRef]
  61. Hunicz, J.; Krzaczek, P. Detailed speciation of emissions from low-temperature combustion in a gasoline HCCI engine. Pol. J. Environ. Stud. 2016, 25, 137–145. [Google Scholar] [CrossRef]
  62. Bueschke, W.; Wisłocki, K.; Pielecha, I.; Skowron, M.; Cieślik, W. Influence of the distance between gas injector and intake valve on combustion indicators and NOx emission in dual fuel CI engine. J. Mech. Transp. Eng. 2017, 69. [Google Scholar] [CrossRef]
  63. Kuranc, A. Exhaust emission test performance with the use of the signal from air flow meter. Eksploat. Niezawodn. 2015, 17, 129–134. [Google Scholar] [CrossRef]
  64. Chybowski, L.; Laskowski, R.; Gawdzińska, K. An overview of systems supplying water into the combustion chamber of diesel engines to decrease the amount of nitrogen oxides in exhaust gas. J. Mar. Sci. Technol. 2015, 20, 393. [Google Scholar] [CrossRef]
  65. Kim, H.; Kim, Y.; Lee, K. An Experimental Study on the Spray, Combustion, and Emission Characteristics of Two Types of Biodiesel Fuel. Energy Fuel 2013, 27, 5182–5191. [Google Scholar] [CrossRef]
Figure 1. The schematic diagram of the experimental setup for biogas diesel engine where: CS—control system; PC—computer; EA—emission analyzation system; IM—intake manifold; BGT—biogas tank; DFT—diesel fuel tank; UCOMET—waste cooking oil methyl ester tank; AF—air filter; WS—weather station; AM—asynchronous engine; DE—diesel engine; ES—exhaust silencer; EP—exhaust pipe; DM—diesel (liquid fuel) mass flow meter; FT—fuel temperature measurement; EPM—measurement probe for exhaust gases; GSI—gas injector system control; GC—gas pressure regulator and flow control value; CSM—control system monitor.
Sustainability 11 01799 g001
Figure 2. The effect of biogas addition on the emission of CO, NO, NO2, and PM into the atmosphere.
Sustainability 11 01799 g002
Figure 3. Oxygen and carbon dioxide content in the exhaust gases depending on the load and biogas share: (a) O2 content when fed with DF and BG; (b) O2 content when fed with UCOME and BG; (c) CO2 content when fed with DF and BG; (d) CO2 content when fed with UCOME and BG.
Sustainability 11 01799 g003
Figure 4. Effect of engine load and biogas content in fuel dose on exhaust gas temperature: (a) When supplying DF and BG; (b) when supplying UCOME and BG.
Sustainability 11 01799 g004
Figure 5. Influence of the type of fuels on the unit emission of CO, NO, NO2, and PM into the atmosphere.
Sustainability 11 01799 g005aSustainability 11 01799 g005b
Table 1. Research engine specifications.
ParameterEngine
Engine type/modelVertical in-line diesel engine
Application Power generator
No. of cylinders2
Rated speed (rpm)3600
Rated power (kW)9.76 @ 3600 rpm
Rated torque (Nm)30 @ 2600 rpm
Displacement (cm3)570
Aspiration system
Combustion system
Natural
Ball-type swirl chamber
Injection systemIDI Engine
Table 2. The chemical composition of the tested biofuel, waste cooking oil methyl ester (UCOME).
Common Name of Fatty Acids UCO (Used Cooking Oil)(%)
Myristic(C 14:0)0.23
Palmitic(C 16:0)8.56
Palmitoleic(C 16:1)0.42
Stearic(C 18:0)2.11
Oleic(C 18:1)61.72
Linoleic(C 18:2)18.18
Linolenic(C 18:3)6.0
Arachidic(C 20:0)-
Eicosenoic(C 20:1)-
Other 2.78
Table 3. Physical properties of liquid fuels.
Fuel PropertyUnitUCOMEDFBG
Viscosity @ 40 °C mm2·s−14.792.91-
Density @ 15 °C kg·m−3884.9836.71.25
Calorific value MJ·kg−138.242.617.15
CFPP°C−2−22-
Cetane number-5752-
Octane number---110 [48]
Flash point°C24459630 [48]
Table 4. The chemical composition of biogas (BG).
Component ContentUncertainty Level
Hydrogen sulfideH2S28 ppm± 10%
MethaneCH459.9% (v/v)± 3%
Carbon dioxideCO241.7% (v/v)± 3%
OxygenO20.7% (v/v)± 1%
Table 5. Analysis of the significance level and the correlation coefficient of BG and liquid fuel combusted to the level of emitted exhaust pollution.
Emission [mg·h−1]The Impact of BiogasDF/UCOME
DF+BGUCOME+BG
CO+0.93+0.93+
NO+(−0.72)+(−0.93)+
NO2+0.52−0.51+
PM−(−0.48)−(−0.57)+
“+”, 0.05 > p; “−“, 0.05 < p.

