Article

Container Sea Ports and Dry Ports: Future CO2 Emission Reduction Potential in China

1
School of Economics & Management, Beijing Jiaotong University, Beijing 100044, China
2
LUT Kouvola, LUT University, Kouvola 45100, Finland
3
Department of E-Commerce, Luoyang Normal University, Luoyang 471934, China
*
Author to whom correspondence should be addressed.
Sustainability 2019, 11(6), 1515; https://doi.org/10.3390/su11061515
Submission received: 28 January 2019 / Revised: 28 February 2019 / Accepted: 6 March 2019 / Published: 13 March 2019
(This article belongs to the Special Issue Dry Ports and Sustainable Futures)

Abstract

:
Nowadays, China dominates logistics volumes, and its container logistics is associated with the largest sea ports, such as Shanghai, Shenzhen, and Ningbo. However, China’s coastal line is long and contains numerous million-container-handling sea ports. Current leading sea ports are located mostly in the south or at the middle point of the coastal line. Volumes are rather concentrated in these few areas. Despite the fact that China’s vast population is well-spread throughout the coastal line, major cities are also located in the hinterlands. Apart from some regions (e.g., the Pearl and the Yangtze River Delta) where there are many cities that are very close to each other, distances between cities are rather long in general. Therefore, this research examines the CO2 emission reduction potential of using a larger number of sea ports (such as distribution hubs), as well as the interaction of these with analytically chosen dry ports. Results of the hypothetical country level container transportation model, using linear integer programming concerning 51 cities (largest hinterland and container sea port cities), showed that better and more equal use of sea ports serving the major cities will result in considerable emission reductions. This is the case, even if hinterland transport is completely based on road transports. However, in a situation where the dry port structure with railways is further applied, the results showed that it should be concentrated on a few hinterland points first, but also assure that most remote, million-people city locations get priority for the railway.

1. Introduction

For a long time in the world, under globalization effects, trade and transportation logistics were seen as truly beneficial and factors that should be further supported. Due to growing trade and transport, economies grew significantly and investment programs were secured. However, due to the negative externalities of logistics and increasing amounts of transport, new limitations on emissions of this sector emerged [1]. These took place not only in the European Union, but also globally, as nations agreed to follow the United Nations’ CO2 emission reduction targets of 2030 and 2050 [1,2]. Globally, countries have also agreed on sulphur reduction programs for diesel oils used in sea vessels, which could show a significant effect after 2020. Nitrogen reduction has also been agreed upon, which concerns sea transport fuels, as well as discussions on significant reductions on ship-based CO2 emissions prior to 2030 and 2050. Countries are not only interested in more green transport, due to environmental reasons, but also in having greater trade deficits to oil-producing countries. This concerns not only Europe, but also North America and China [3]. In an oil dependency questions, focus is often on hinterland transports, where dominating road transports typically tie the country to continuously increasing use of diesel. One serious alternative to tackling oil dependency and CO2 emissions is the use of more railway transports and developing inland terminals in the hinterlands to serve nearby cities and regions. These inland terminals are typically called dry ports [4,5], however, there are other terms that are also used, like freight villages or intermodal centers [6].
In China, the hinterland transportation system, like at sea ports that handle containers or cargo, has to deal with massive volumes. In addition, the population is huge, as there exist 15 so-called megacities (population of above 10 million) and 23 very large metro areas (population ranging from 5 to 10 million). Based on the Organisation for Economic Co-operation and Development (OECD) [7] research, there were 127 cities with a population above 1.5 million in the year of 2010. The following 165 smaller cities were also significantly sized, as compared to other countries, e.g., in developed economies, ranging from 0.5–1.5 million inhabitants living in them. Urbanization is advancing in China. It is estimated that 70%–80% of the entire population will be urbanized by 2040–2050 [7,8]. The population has become concentrated and the macro-economy has developed in recent decades, mostly in the coastal areas [9], but the hinterland is playing an increasing role in manufacturing and in economic programs. In addition to these, railways have typically served (based on Reference [10,11,12]) the purpose of passenger transports (in 2017, share of railways for passenger transports was as high as 41%) and traditional product groups like coal, petroleum, steel, iron, and metal ores in cargo transport (these account still around 75 % from overall tons transported at rails). Therefore, it is understandable that container transport to and from sea ports has primarily been taken care of through road transport. Second to this is the river/waterway transports, and, as a third, the railways.
Based on national statistics [10,11,12] and overall container-handling volume at sea ports, in total, given by Unctad [13], we could estimate that at the country level, the railway share from the overall sea port-container handling is somewhere around 6–8% (assuming that Twenty foot Equivalent Unit, TEU container weighs 10 tons, on average,). In TEU container terms, railways transported nearly 17.7 million TEU in 2017, and this amount has been increasing annually in the last 4 years (nearly doubling in amounts). However, it should be taken into account that the railway’s container volume included also land-bridge transports to other Central Asian countries, Russia, and Europe (these have been booming in recent years; see References [14,15]). Therefore, the estimates from the overall sea port hinterland transports could actually be, on average, a bit lower than the given range, even if container transports by hinterland land-bridges to other locations is, at maximum, a few hundred thousand TEU. Jiang et al. [16] provided estimates for China’s largest container sea port, Shanghai—the railway share from hinterland transports was 3%, while river transports comprised 10%. The remaining majority (87%) was for road transports. Based on recent information [17] from the Shenzhen sea port (second largest container sea port in China), the railway share was below 1%; however, the port has numerous programs to expand the railway share. Even if the hinterland railway land-bridges from China could erode the railway’s market share of the domestic hinterland transportation, on the other hand leading container sea ports in China have increased their position in transshipment traffic (as container hubs), which in turn would increase the sea port handling numbers (same container is handled in the hubs as well as in the regional sea ports). Therefore, as both railway container transports and sea port container handling are positively biased in volume terms, the railway share from hinterland transport should in real-life be below 10%.
Although there is a growing interest and numerous existing dry ports in China that serve the railway container transports [18,19], in the short- and medium-term, road transport is going to dominate at container sea ports. Emission reduction strategies should take this into account. In this research, using linear integer programming models, we have illustrated that in the 51 cities and in the numerous larger scale sea ports along the long coastal line of China, the sea port system contains a hidden emission reduction potential (sea ports acting like dry ports [20] and differences in the dry port system analyzed in Reference [21]). In emission reduction programs, numerous sea ports could be seen as an asset, which provide the potential to reach consumers and exporting industries with short hinterland transport needs. This, of course, requires that sea ports are more equally used and major hubs do not dominate the branch as they used to. Even if railway transport is arguably much lower emitting than road transport, larger container ships with 8000 or above containers nearly reach the railway’s emission levels [3]. Therefore, having a longer sea journey to the closer container sea port and using still road within hinterland transports, could be much more environmentally friendly than the current situation (of few hub sea ports and longer hinterland transport amounts). This research will also illustrate after using sea ports as dry ports that hinterland dry ports implemented in this system will bring additional emission reductions. Overall, they are together a powerful concept for any country having a longer coastal line, numerous container sea ports, and dry port development emphasis. It is of course so that in a country that has very few major container sea ports (like in USA, Germany, or Sweden), the emphasis should be on developing dry ports in the hinterland and adding high-quality railway services to these (volume and frequency; like illustrated in References [4,22]). Transportation systems do differ, and the proposal in this research work is fit for special circumstances. The situation in Europe is similar overall to China, with a long coastal line and numerous country level sea ports. In Europe (overall, not in Germany or Sweden only), intermodal transport is still a phenomenon under development [23]. Research from the Russian situation [24] supports road dominance in hinterland operations of the largest country in the world (by geographical size).
This research is structured as follows: A literature review concerning Chinese dry ports is provided in Section 2. The research environment follows in Section 3—it introduces data sources as well as the optimization program being used. Section 4 provides the results of the study. Research work is concluded in Section 5, where further research avenues are also proposed.

2. Dry Ports in China

The idea of a dry port actually contains numerous positive factors. The first factor is to lower the use of diesel oil at transports and enable lower emissions [25,26]. Also, other factors play an important role, like supporting hinterland job development, providing lower costs for trade (as operations at hinterland are typically lower costs than at sea ports, which are often big cities), improving accessibility, and facilitating industrial investments [27]. Sea ports benefit from a lower land use and the ability to handle higher volumes in a shorter amount of time [28]. Dry ports emphasize the use of frequent rail connection from sea ports (numerous scheduled freight trains per week in both directions) to the inland terminal from where local economies (with factories, retail, e-commerce and other needs like the public sector) are connected with a dry port using road transports.
At the local level, it is important that dry ports have some basic volume from a factory or larger retail sector warehouse nearby, and then other logistics sub-groups could be built above these. Distance to sea ports also plays a role, and typically a longer distance is better (few hundred km). However, in Sweden and Europe, there exist examples that even shorter distance dry ports, which are viable, if they have a high connecting railway frequency to sea port [29,30]. Dry ports are often a mixture of public and private sector investments and involvement. For example, a vast network of Sweden would not be possible without public sector support. Similarly, in China, all dry ports have local municipalities and/or cities involved in investments [31,32]. Additionally, the internationalization of Chinese port-related companies deserves attention, which has taken place in recent years [33]. Operations are in most cases globally taken care of by the private sector, but often a landlord model exists in dry port operation contracts.
Like in other countries, interest in dry ports (especially for the geographic aspect [34]) gained a ground in China during the early 2000s [19]. The first linkage was from Beijing (Chaoyang District) to Tianjin sea port, which was opened in 2002 [18]. Development started to accelerate after 2007 [35]. As a result, dry ports have been opened in many places in this large country, and leading ones concerning their scale and success could be considered following: Yiwu ([19,32], capacity est. 0.6–1 million TEU per year), Xi’an [31,36] and Zhengzhou ([32,36] capacity est. 0.6 million TEU). Most often, these dry ports have importance for local economies in providing needed connections and offering value added services such as customs clearance.
Dry ports’ construction plan should be integrated into a comprehensive transportation system planning and should not be isolated or blind, especially in China [37]. Dry ports can use railway connections to reach sea ports, but previous research says that the most preferred transportation mode is that of a road [19,32]. Competition is high between dry ports and, frequently, different sea ports have their interest and ownership in these. It could be said that the dry port establishment process has been good and prompt, but they are not used in full-scale as considering their potential [32,38]. In addition, the role of railways needs further development. Research argues that the concept of block trains (or rail shuttle service; [19]) should be used more, which are container trains having defined weekly schedule (for some longer time period) and an entire train is only serving this connection between two points (e.g., sea port and dry port). Currently, too much rail transport is completed on an ad hoc basis [31]. This basically having container trains, if there is capacity available at a railway network after passenger transports (which is having a major share in China).
One special characteristic of China is its population spread among different cities and the size of these cities. Many cities have a population of 10 million or more, which makes capacity management difficult for hinterland dry ports. Based on earlier studies, handling capacities in TEU containers are at best 0.5–1 million per annum at the largest dry ports [19,32]. Typically, capacity is at the level of 0.1–0.3 million TEU. These are of course very good capacity amounts e.g., in the medium-sized European city, but in this context, they are just way too low to serve the majority of foreign container transportation needs. As the first issue, it was always mentioned in earlier research that railway connections and capacity at railway network is a challenge; however, in medium-term handling capacity at terminals and the size of these is also something which needs further caution.
Waterway (river) transports cannot be underestimated in China. Its share is largest from all modes as transportation activity is measured with ton-km. However, it should be emphasized that in container transports, the share of waterway transport is not that high [39]—from the overall transport volume of the waterway in 2006, containers comprised 6% as traditional bulk items dominated volumes (construction materials, coal, metal ore, cement, petrochemicals, and steel). This can be noted in Figure 1, as with transportation mode share measured in tons is making big share drop for waterways (as what its share is in ton-km), while road transportation more than doubles its importance. The share of the railway behaves similarly to the waterway, however, its share does not improve that much as measured with ton-km. Typically, the ton-km share is high, when the transportation mode is transporting high volumes within a longer distance and often transporting bulk cargo. In the most recent statistics concerning the year 2017, transportation mode shares are similar to Figure 1; however, road and railways have taken a bigger share and waterways have marginally lost (in both measures, [12]).
For dry port development in China, Figure 1 justifies that railways and waterways are nearly equally important hinterland transportation modes. Therefore, for hinterland locations, it would be beneficial, if the dry port would be able to serve both of these environmentally friendly modes. Li et al. [40] classified Chinese locations regarding grain handling in different cities by the ability to serve these two modes. Wu & Haasis [41] provided further details on this by analyzing the dry port of Xi’an. This location has excellent railway connections domestically, but also internationally to Kazakhstan, Russia, and Europe. However, the waterway transport option does not exist. Due to this, Xi’an dry port tries to perform customs clearance in the best possible manner and also gives support (platform) for tenants in the dry port area.

3. Research Environment: Describing the Data Sources and Optimization System

3.1. Research Design

The study utilizes a quantitative approach to solve the research problem [42]. Specifically, linear integer programming (LIP) has been used. In LIP, the objective function is linear and integer conditions are imposed on variables [43,44]. This type of programming is contrasted to non-linear programming, where objective function and constraints are non-linear; Yokota et al., [45]). Both approaches belong to the broader category of mathematical programming, which is related to the choice of action program during the process of solving problems.
Due to the fact that in various areas of human activity there is a need to make the choice of one of the possible ways of action (action programs), mathematical programming received applications in many spheres. For example, different tasks in logistics, economics, social science, and politics can be expressed in the form of linear integer optimization problems [46]. Such tasks include warehouse location problem, travelling salesman problem, decreasing costs and machinery allocation problem, and scheduling problems [47,48,49]. Abara [50] also used LIP to fleet the assignment problem, while Cheng et al. [51] applied this approach for solid waste management.
With an expansion of LIP applications, new classes of problems have been identified. The structure of new and particular problems allowed the opportunity to create special methods for solving them, which is favorably different from the methods of solving problems of a general nature. Thus, the section of transport problems appeared in linear programming [52]. The classical transport problem can be considered as the task of the optimal plan of transportation of goods from the point of departure to the point of consumption, with minimal transportation costs.
In the current integer programming model, the lowest amount of hinterland distribution to 51 cities and sea ports has been found. Therefore, below, the following objective function (minimizing the total distance and, in turn, emissions) was optimized with regard to meeting operational constraints (there was a requirement that each city should be served once). The results of this study are deterministic, because all initial information is considered completely certain. A general optimization model of this study is as follows:
Objective Function
m i n c = 1 51 s p = 1 15 d p = 1 2 D c , s p   O R   d p
where D is the distance to one of the largest city in China c within this study from sp = sea port potentially serving this largest city directly or dp = dry port providing services through it
Constraints
(each city going to be served at once)
C n : s p = 1 15 d p = 1 2 B S s p   O R   d p = 1
where BS is the binary number whether city Cn is going to be served by sea or dry port
(sea port based minimum amount of served cities)
s p n :   c = 1 51 B S c X s p n
where BS is the binary number whether city c is going to be served by sea port, and X is the minimum demanded amount of served cities from this particular sea port.
Despite the fact that, in nature, there are no completely random and completely deterministic processes, in the problem we are solving, the non-determinism of some factors is inessential, that is, we can get around it by solving a deterministic problem. Broadly speaking, there are processes that are randomly influenced by random factors, but there are processes where the influence of randomness is so small that it can be neglected [53]. For the purpose of current modelling, the stochastic models are also less appropriate, as they would be rational if the phenomenon under study was repeated several times, and the main goal would be to search for the controlling actions optimizing the functioning of the system, taking into account feedbacks [54].
In the considered model, it is assumed that container transportation need goes hand in hand with population amounts. A similar assumption was made (from container transports and population) in Henttu & Hilmola’s [55] dry port study concerning Finland, where hinterland transport volume was analyzed to have been caused by population (explaining 75%–80% from overall volume). There could be valid arguments that the population does not drive a larger city (or its urban) area size and transportation activity. Therefore, we gathered km2 of urban area and prefecture/municipality of each of the 51 cities (if they were available). Based on correlation analyses, population and area have a positive correlation with each other. However, the statistical significance of this relationship within these cities was just above 5% significance level (ranging from 6–8%). If one extreme observation of different datasets (concerning size) is taken away, statistical significance exists. For this reason, we justify the use of population as a key driver—it is not a perfect measure, but the most usable one.
On the whole, the deterministic type of tasks already has a well-established direction in the scientific research on mathematical programming. For deepening the deterministic (functional) analysis, for example, of some factors on which it is impossible to build a deterministic model, the stochastic (correlation) analysis can be applied [56]. Also, the situations associated with uncertainty, risk, or relativity of knowledge about the planning object can lead to stochastic programming models, where the degree of uncertainty increases as the planning period increases [57]. Therefore, the analysis of complex deterministic problems that require an excessively large search of options when planning or forecasting is sometimes advisable to represent it as the study of stochastic problems.
In further research, the so-called stochastic programming can be used: The extended model would be appropriate to solve a more complicated type of task in which the source information contains elements of uncertainty, or when some parameters of the problem are random with known probabilistic characteristics. However, this approach to the problem would require the fulfillment of important prerequisites for the applicability and the reliability of the results obtained. First and foremost being the ability to make a set of observations, i.e., the possibility of re-measuring the parameters of the same phenomenon in different conditions, which allows identifying the studied patterns with sufficient reliability and accuracy (modelled connections; [53,54]).

3.2. Data Collection
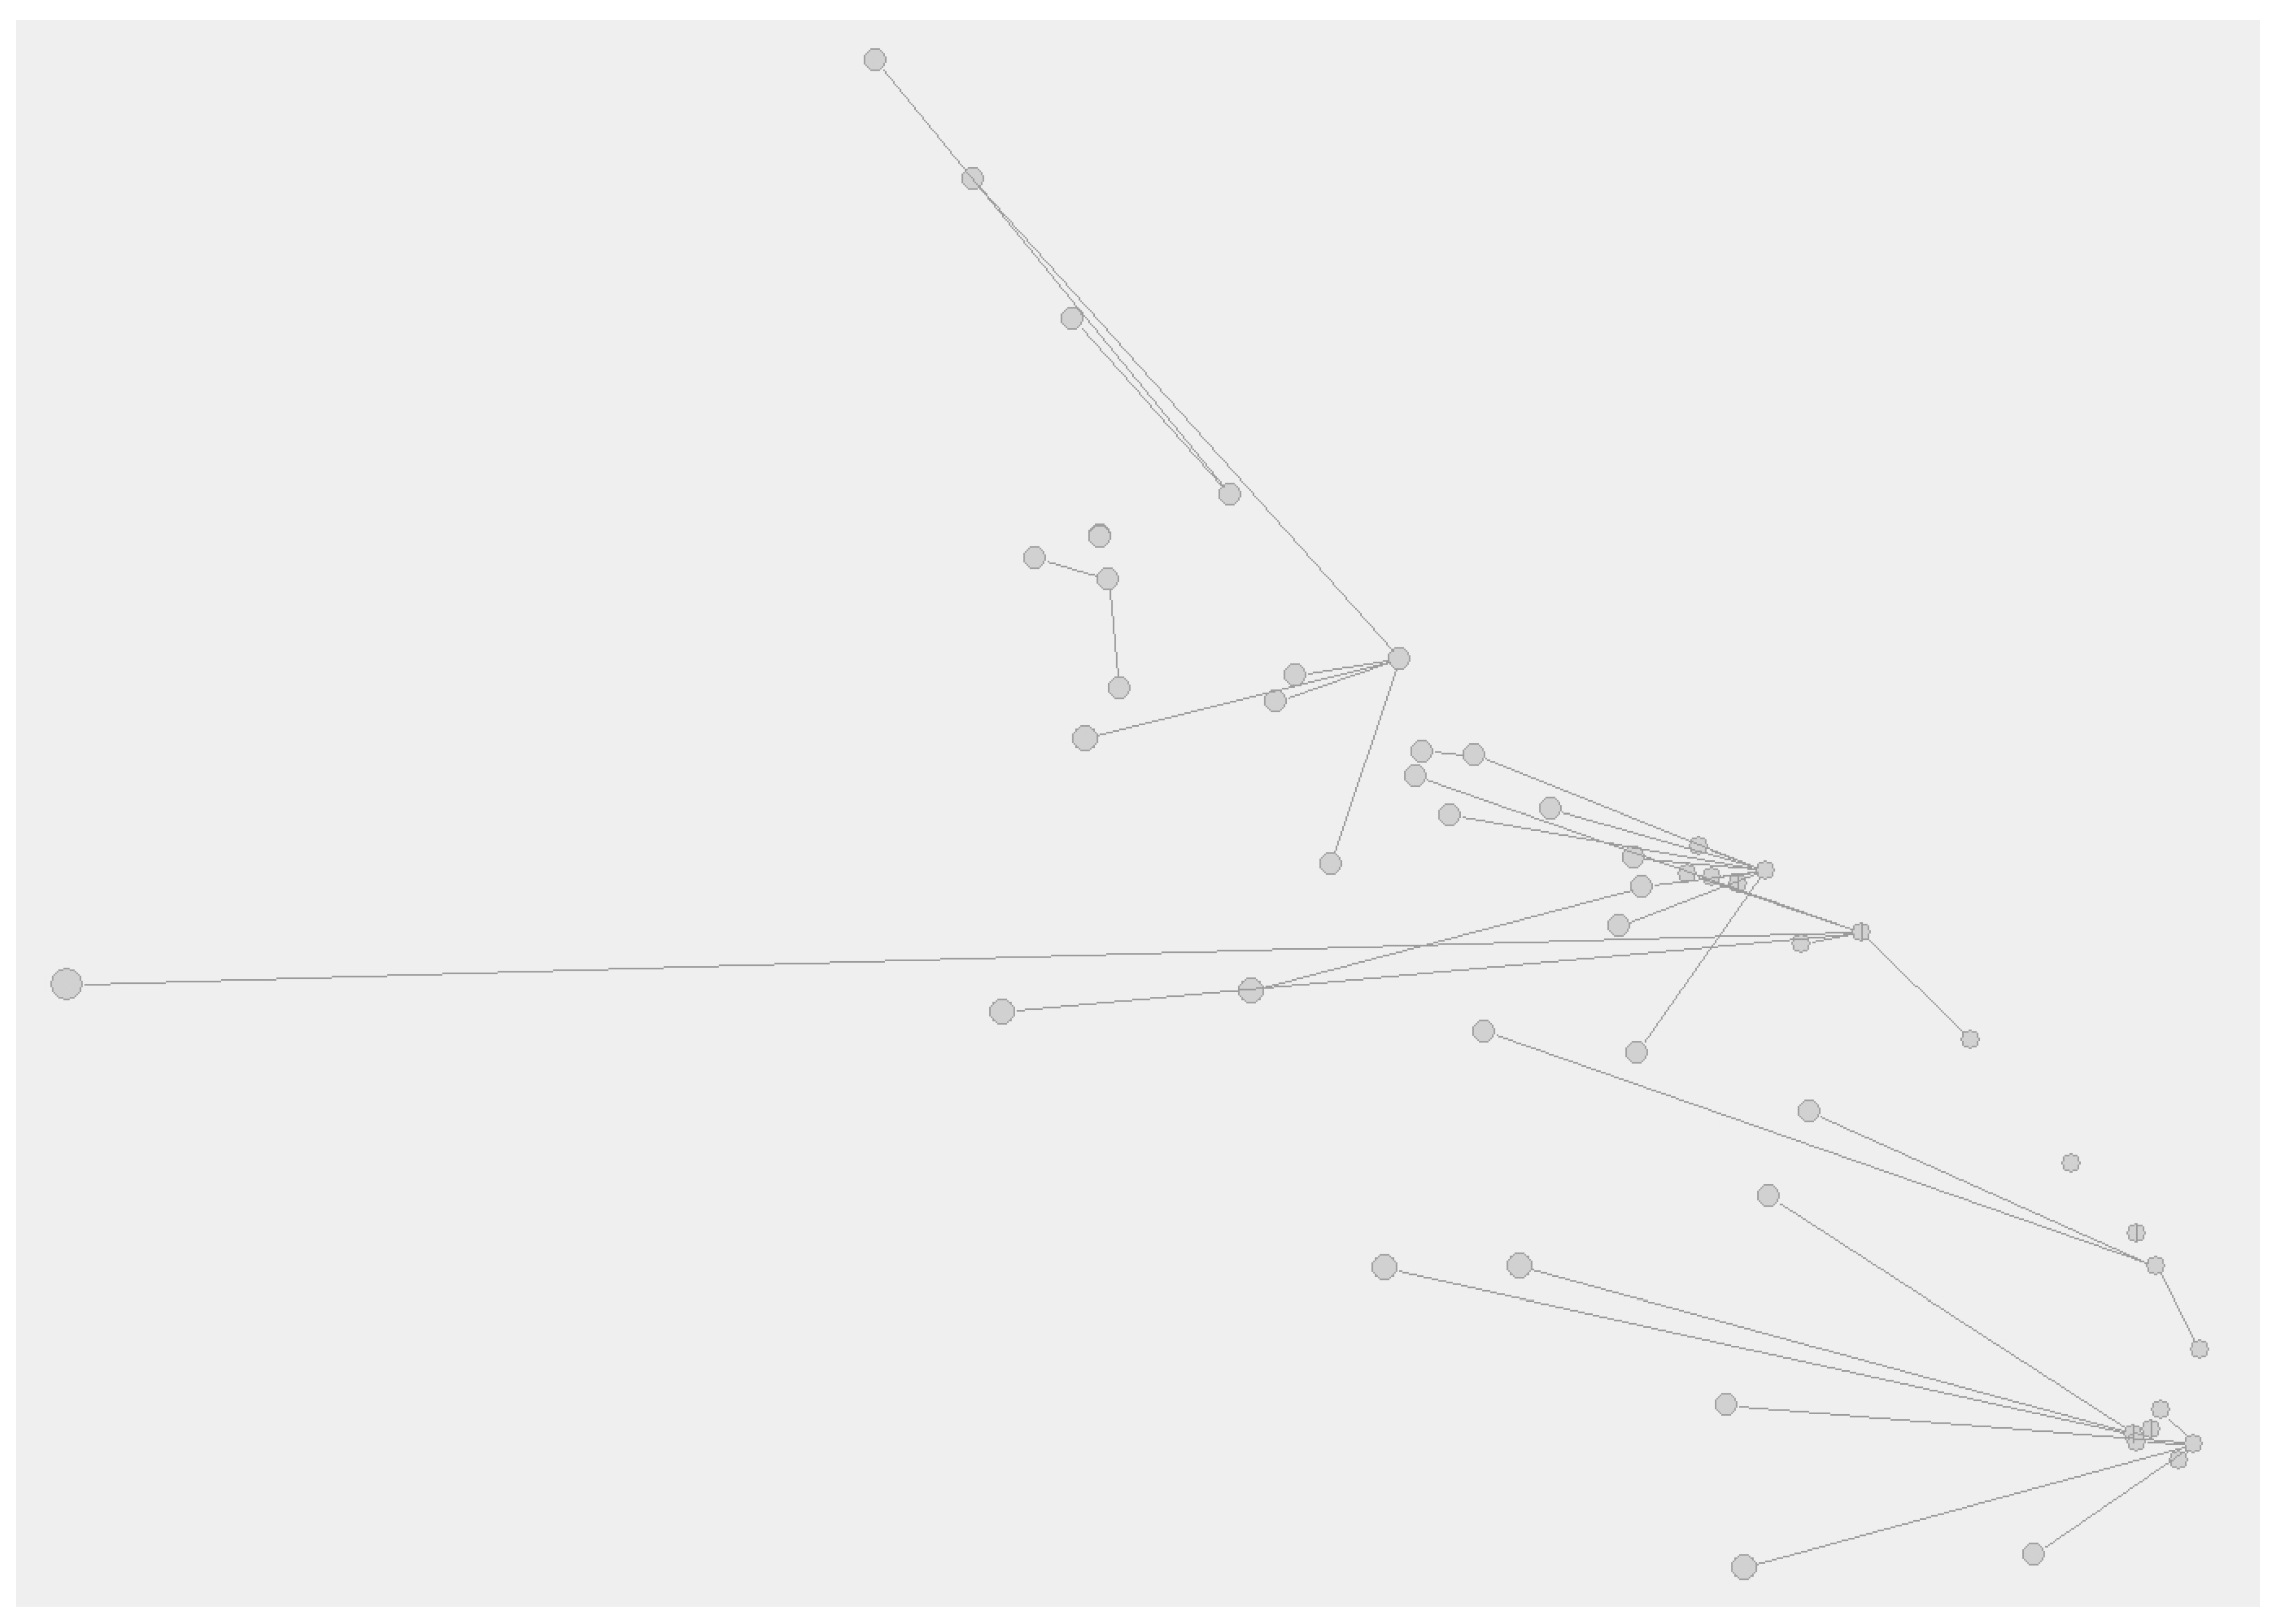
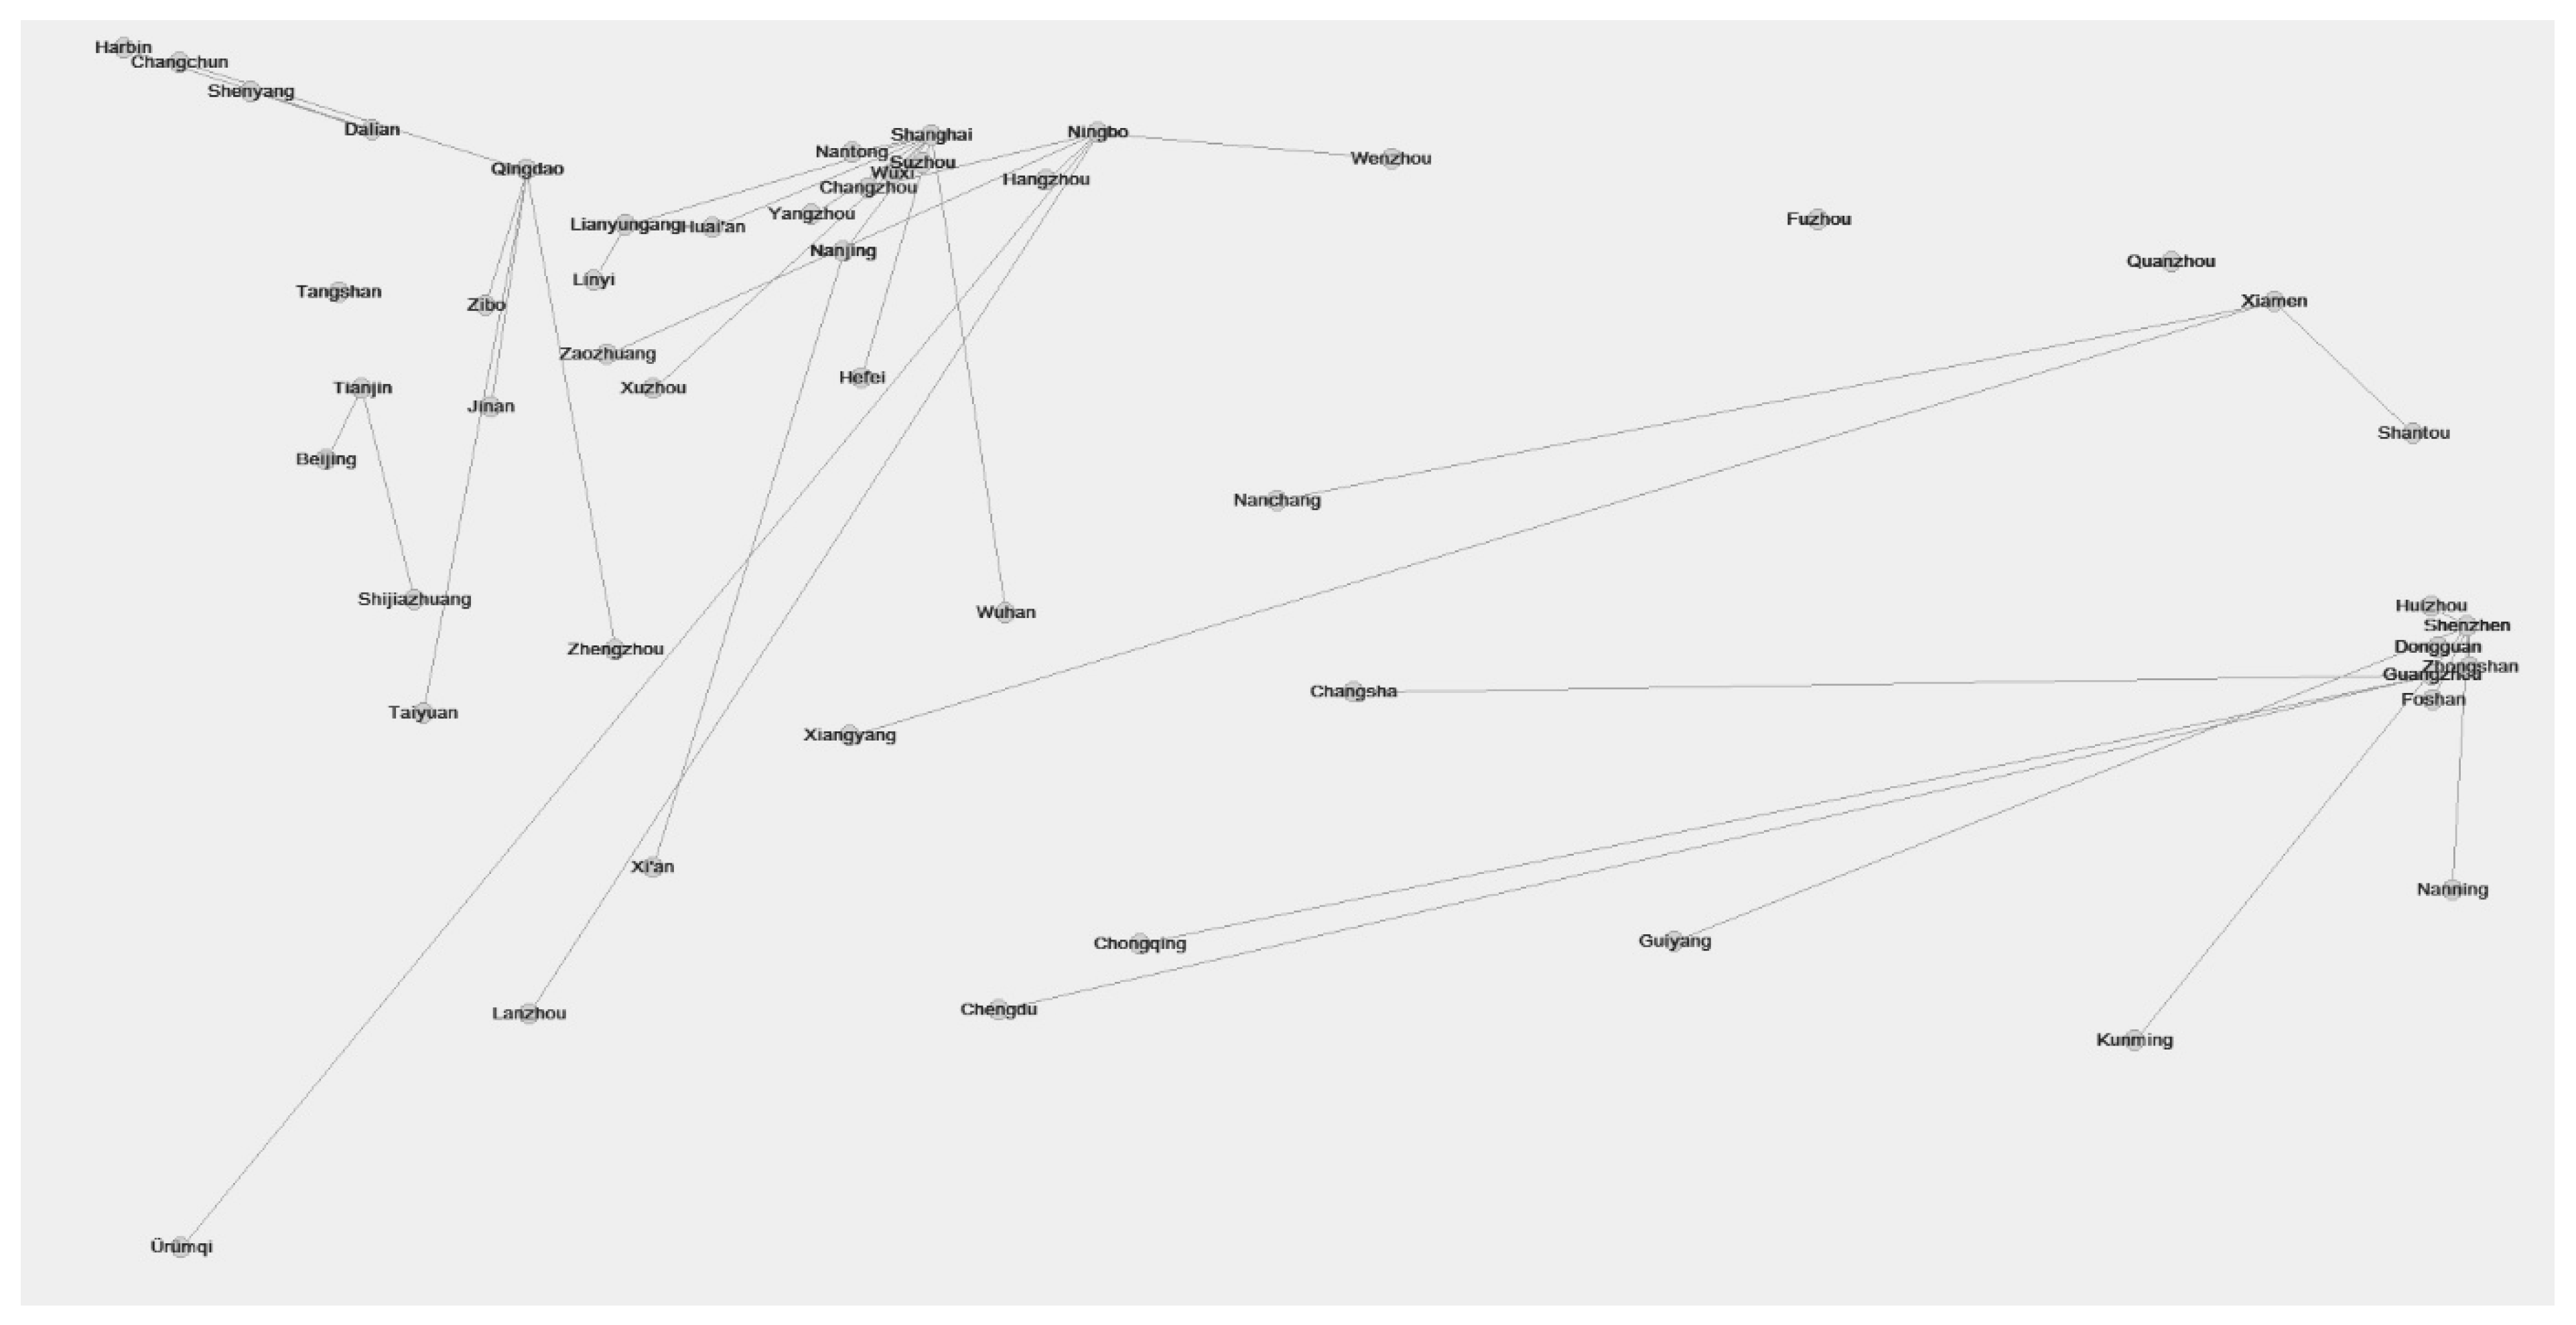
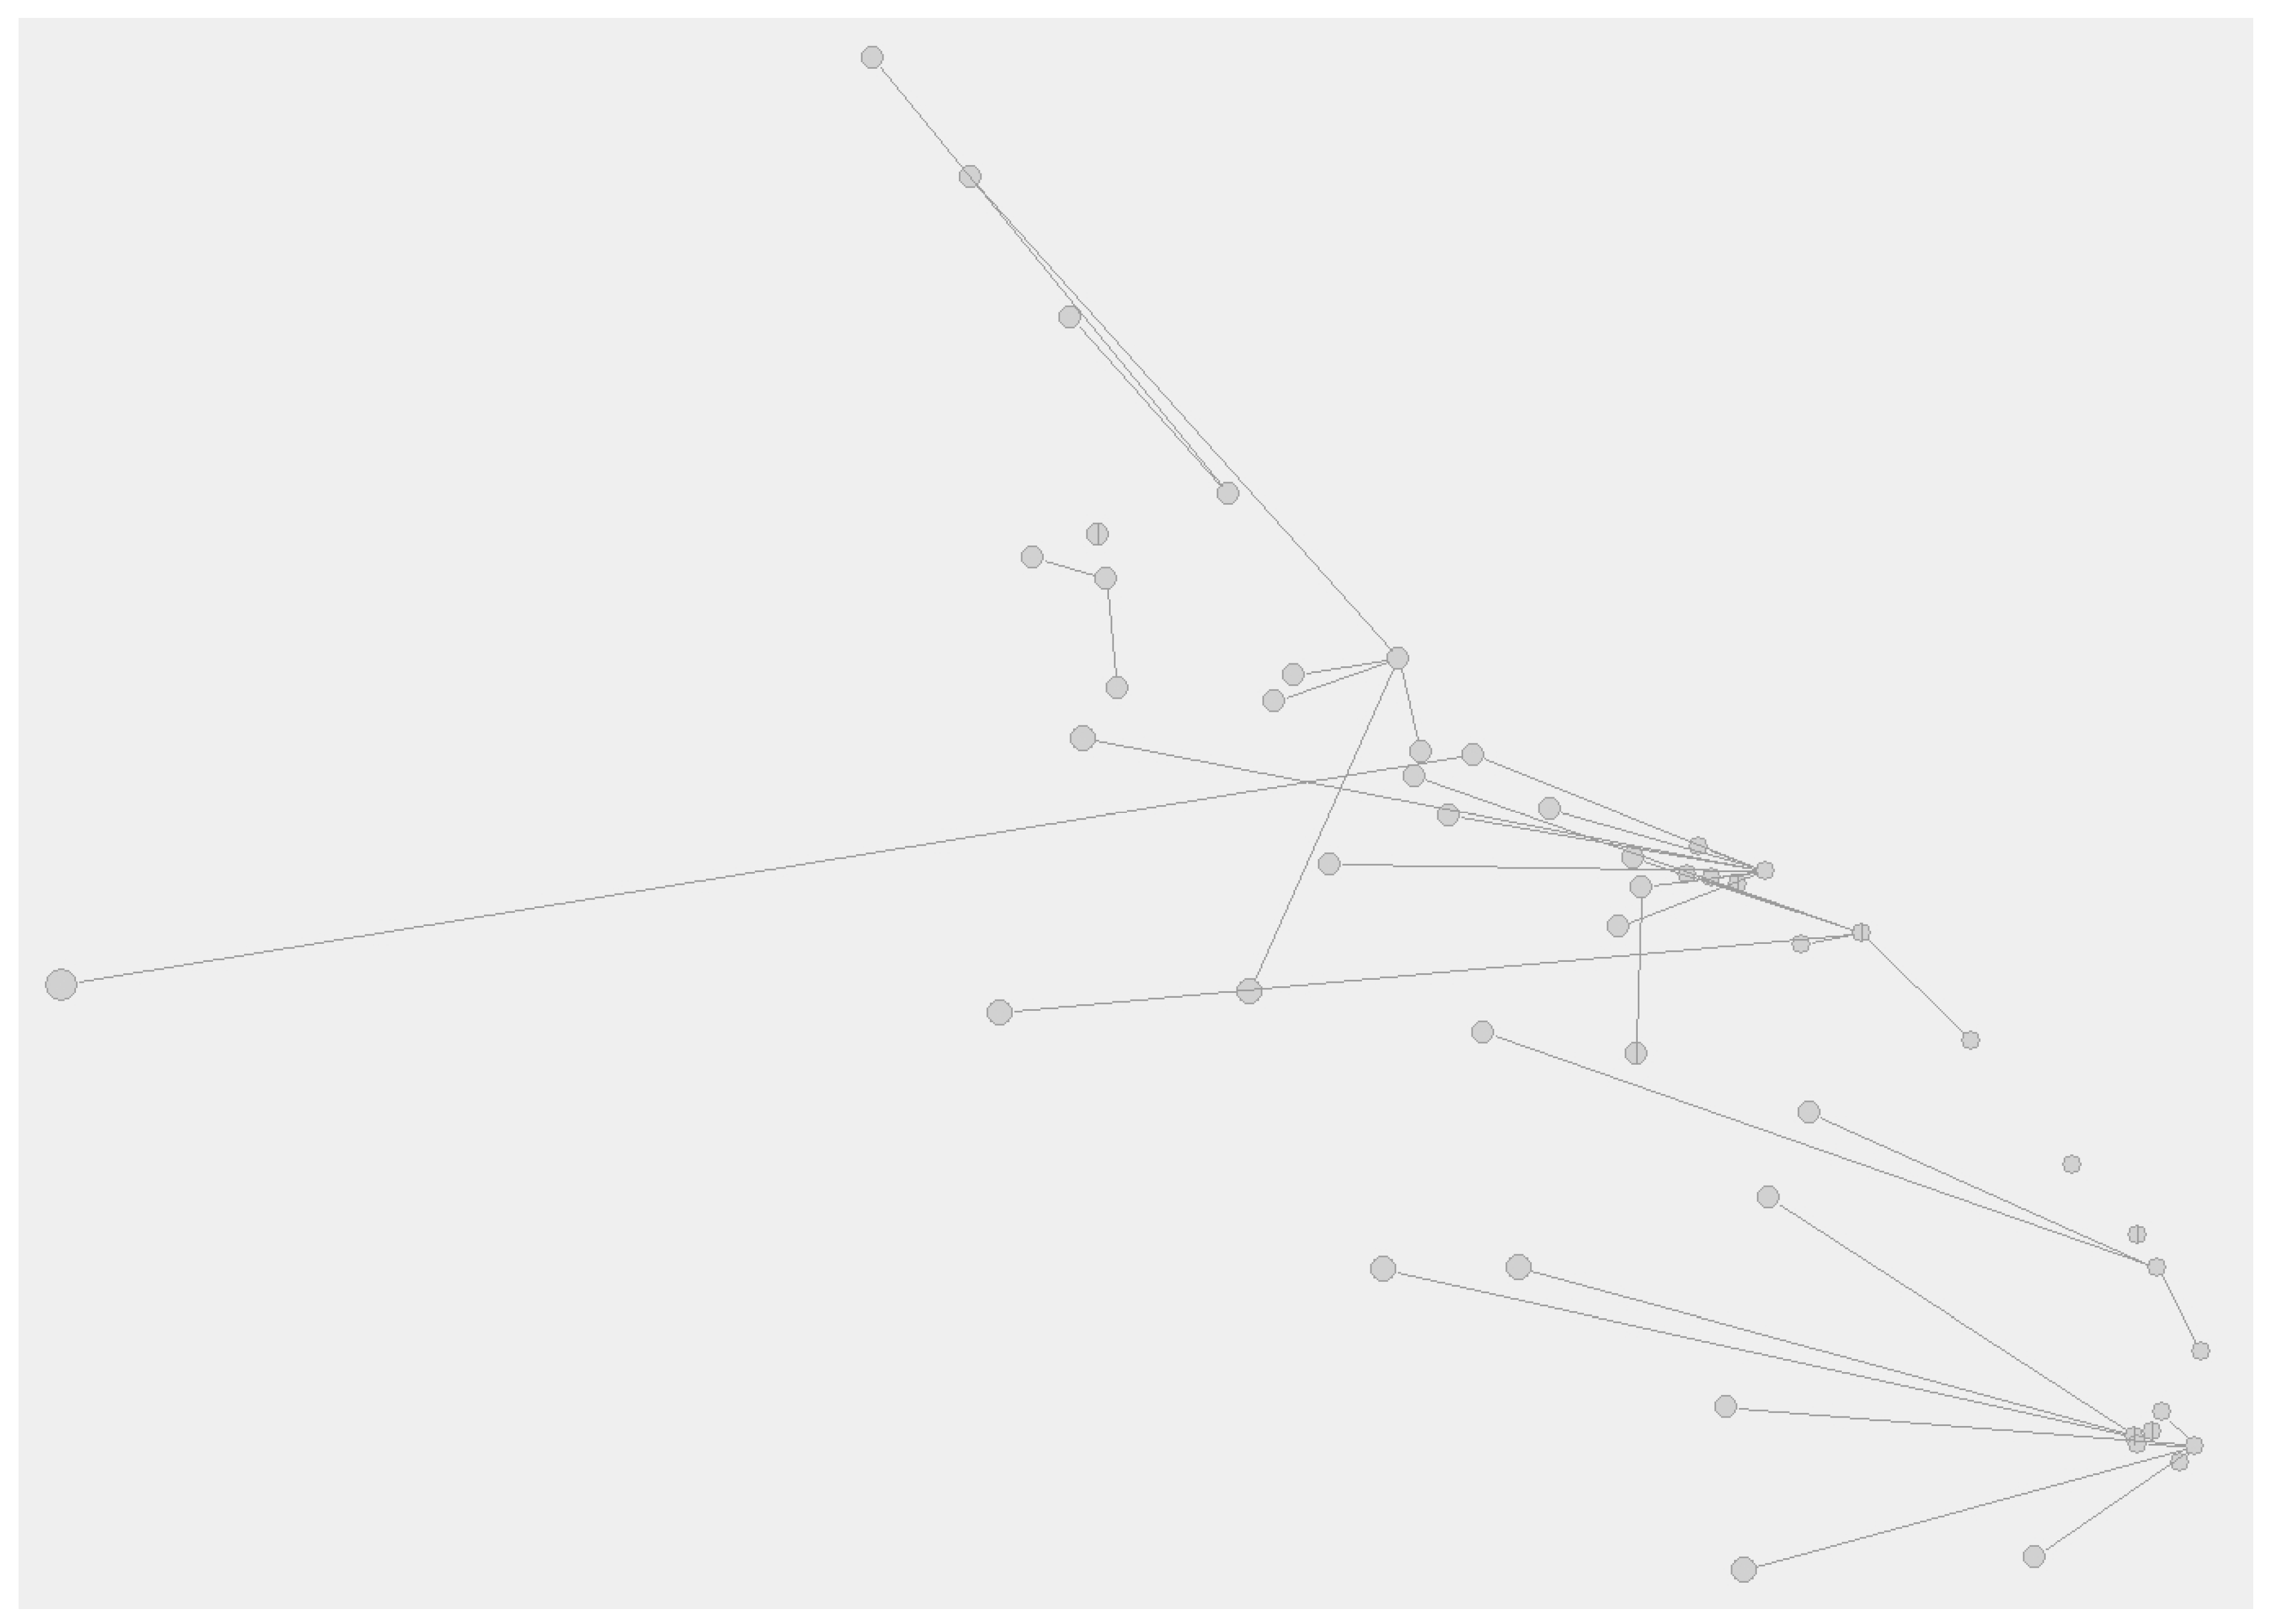
The first task was to find a comprehensive list of container sea ports in China and also top population cities in this country (50 largest). These are assumed to drive the export and consumption-based economy in this country (and be key places for container transports needs). The largest container sea ports are annually analyzed e.g., in United Nations [58] publication, but this concerns typically only the TOP 20 ports in the world (China has 50 container sea ports; Pan et al., 2014 [59]). Chinese sea ports are of course leading in volume and ranks in this analysis, and in recent years, Shanghai sea port has been a definite leader (followed in China by Shenzhen, Ningbo-Zhoushan, Hong-Kong and Guangzhou). For this research work, we selected all United Nations [58] top container sea ports from China, apart from that of Hong-Kong. The reason for this is that the Hong-Kong sea port is more transshipment in nature (of Chinese export and import), but also serves a local city demand. To enlarge the number of sea ports, other publications were used to access the smaller container sea ports of China through the annual top 50/100 container sea ports of the world [60,61]. Table 1 shows the sea ports used in this study to examine the potential to use more equally spread sea ports-based container volumes (sea ports as “dry ports”). The list does not include such sea ports as Yingkou (located in Northern China; 6.3 million TEU in 2017) and Taicang. First mentioned is a rapidly developing sea port, but which does not have that significant city-level population (yet, this could change in the future as a city is developing rapidly). The latter is in statistics included in the volumes of Suzhou, which is in the Table 1 list already. Sea ports in Table 1 are having significant part from overall Chinese container handling volume—in the year 2017 their share was 88.4%. It should be remembered that although Chinese container handling is already exceptionally high, it has been growing in 2010–2017, still nearly 6% p.a. (Unctad, [13]), and in 2017 handling volumes were 49.5% higher than in 2010 (this is apart from all economic uncertainty in the world, world trade and domestic economies in North America, Europe and Asia). In comparison, the 51 largest European Union [62] sea ports in 2016 handled 89.3 million TEU, and the USA in 2017 was able to achieve a level of 51.4 million TEU [13]. China is in container usage, and sea port handling the world’s definitive leader with the share of somewhat above one fourth from the world’s total sea port handling [13].
It is notable that not all containers of a particular port in Table 1 end to the hinterland operations from this particular port. For very large-scale sea ports, like Shanghai, Shenzhen, and Ningbo, transshipment traffic plays an important role in volumes. So, containers arrive with large ships e.g., from USA and Europe, but they are transshipped to smaller vessels, which reach other regional sea or river ports. The OECD [63] estimated that transshipment traffic in Shanghai is not as high as it is in Singapore or Hong Kong (proportionally), but it is one-fifth of the overall volume. Park & Lim [64] estimated that in the year 2007 transshipment volume of Shanghai was above 9 million TEU.
All sea ports in Table 1, except Lianyungang, are also part of the 50 largest Chinese cities (or city areas as these are so massive in size). Lianyungang was taken to be part of the analysis as it is an important northern sea port, which has significant volume and very good railway and road connectivity to such important hinterland locations, like cities of Zhengzhou and Xi’an (see Reference [18]). The population in Lianyungang is also large (surpassing rank 50 city, Zaozhuang), if measured with “Prefecture-level & sub-provincial city” numbers (4.39 million). These were the city population numbers, which were used in the actual analysis, but the list of largest cities was arranged in TOP 50 form with the metro/urban level population.
The population of Chinese cities is a difficult amount to estimate (OECD, [7]). First of all, as cities are so huge in population numbers, it is difficult to state where the city ends and another one begins. There are some commercial service organizations like Demographia [65], which are giving estimates from the city level population around the world. Another potential up-to-date population service is Wikipedia [66] and its city level webpages (these often are updated by the city government and they contain up-to-date population estimates). In this research work, we first developed the TOP 50 city list with the aid of Demographia [65] and Wikipedia [66] list of the largest Chinese cities. After examining these lists, we became confident that in Table 2, the presented list of cities is a rather accurate list of the largest cities in this country. It should be highlighted that population numbers of cities in Demographia [65] and Wikipedia [66] do differ, however, in about half of the cities, their difference is below 10%. In this research, we are using “Prefecture-level & sub-provincial city” population numbers, which are the largest and estimate the whole city catchment area.
In total, the selected cities in this study concern the population of well above 420 million persons (Table 2). This amount is around 30% of the entire Chinese population. Urbanization has been a rather strong trend in China in the recent decade, and the current level is so that nearly 60% live in cities and urban areas (it is estimated that this will be within the range of 70%–80% in the future; Dent, [8]; OECD, [7]). Therefore, from the current urban population of China, this study takes into account roughly half. In Table 2, cities are in order of population, if measured with metro/urban level population, but in this study, it was decided to include prefecture-level & sub-provincial city population, which increases the population of some city areas considerably (as they do not have any clear “center”, but numerous centers, which are well spread around). Regarding the topic of this research—lower emission distribution of import and export containers in China—it is important to notice that many larger cities have container sea ports which are included in the analysis of this study. This means that cities have the multi-million container handling capacity near-by. It gives hinterland distribution opportunity to be less polluting (as distances are much shorter). The largest 20 cities in Table 2 are basically the same as what was identified as the largest Chinese cities by OECD [7], only with the exception that Table 2 includes Quanzhou, which is not in the 2010 population measures based on the OECD [7] report. Table 2 is in descending order, based on the metro/urban area population, but this research used numbers of prefecture-level & sub-provincial city population.
After identifying 51 cities for this study, the next task was to gather information first regarding distances between these cities in the road network. This information was gathered from Google Maps [67] service, and it consisted of a search of 1275 pairs (it was assumed that the distance from city A to city B is the same as from B to A, reducing the search amount to half). Overall, the distance matrix of 51 cities consisted of 2601 cells of the distance information, wherein both sides of the matrix diagonal were basically the same (illustration of the matrix shown in Table 3). Distances inside of the cities themselves were assumed to be 0 km. Therefore, in this model, the value of distributing containers from own city sea ports was considered as most beneficial. It should be noted that other cities benefitted from distance measurement too as distances were taken from city to city (centers), not from sea port location of the city to another city. Railway distances used in this research work were taken from Huochepiao [68], but these distances were verified with the distance measurement of the Baidu Map [69]. Distances in China are long between cities, among the 51 cities of this study within the road network, on average this value is 1359 km (taking into account zero distances within cities themselves). The longest distance, in this research work, was from Shantou to Ürümqi, 4429 km.
Finding the desired minimized linear integer programming solution with 51 cities and 15 container sea ports, and in some situations with three railway dry ports, spreadsheet application OpenSolver [70] ver. 2.9.0 was used (see also Reference [71]). This add-in for the spreadsheet is similar to a typically free included Solver; however, it does not have any of the size restrictions of the built models. In this research work, the size restriction limit of the Solver became a challenge and, therefore, OpenSolver was used. This application has been used in numerous earlier research works (like References [72,73]). Finding a minimized pollution solution with the constraints considered took typically a few seconds, and solution time was not an issue in the following results.
Use of linear integer programming in the following varies based on the used models. In all models, it searches for which cities a particular sea port or dry port should serve, and this activity is either 1 (serving entirely, 100%) or 0 (not serving at all, 0%)—this is a common constraint and requirement in all models. This means as well that some locations are only 100% served by rails (or completely by rail to dry port, and using a road for local distribution), while others are 100% served by road. As a general constraint, in all models, we used the requirement that all 51 cities should be served by some sea port or dry port. In some models in the following, we were forced to use constraints, a minimum requirement for each sea port serving a number of cities that models were in the neighborhood of current container handling in the Chinese sea ports.

4. Results

In the linear integer programming model used, it was asked for the program to find the lowest amount of hinterland distribution to all 51 cities and sea ports (the latter were also consumption places based on population). The program was, therefore, minimizing the total distance times population within entire transportation system (51 cities); a minimum was searched for by changing sources (sea ports or latter dry ports) with binary numbers (either supplying or not). As one constraint, there was a requirement that each city should be served once.
In the beginning, it became apparent that current shares of different sea ports were difficult to reach without intervening in the initial model further. It was assumed that the population was driving container transportation needs (consumption, but also in manufacturing and export). Therefore, additional requirements (constraints) were added to the model that Shanghai would be leading container sea port (with a market share of 20–21%), followed by Shenzhen and Ningbo. In order to achieve this, were constraints added to the model that it was an only valid answer, if Shanghai was serving at least 10 cities, and Shenzhen as well as Ningbo, both at least seven cities. It was also required to add constraints that Qingdao was serving at minimum six, and Guangzhou as well as Xiamen four cities. For Tianjin and Dalian, it was necessary to require at least three cities. For the rest of the sea ports, it was required that they were used at least once (Nanjing, Lianyungang, Suzhou, Dongguan, Fuzhou, Tangshan and Quanzhou). With these additional constraints, the model started to produce similar kind of shares to what sea ports had in real-life (they proportionally served the same percentage share of the population, what their market share was in container handling in Table 1 from all Chinese container sea ports). Figure 2 illustrates the results in Chinese map coordinates (without city names)—coordinates were gained from GeoHack [74] service and these were transformed in the spreadsheet as the x- and y-coordinates of Pajek (64 bit, 5.06a) networking analysis software (used to produce Figure 2, Figure 3, Figure 4, Figure 5, Figure 6 and Figure 7). Better city-level interpretation could be made from Figure 3, where a network is turned 90 degrees and the upper part is a little bit magnified (to gain visibility to the Pearl and the Yangtze River Delta areas).
As could be noted in Figure 2 that constraints lead to some illogical situations in connectivity (however, this could be the case in real-life as some sea ports have needed frequency and connectivity which others cannot match). Ningbo has a very long-distance destination, Ürümqi. There would, of course, exist closer sea ports in the north, but the constraint ensuring high market share of currently dominating sea ports is asking to have the necessary amount of connections, and this solution does the least harm. Another inconsistency is that Qingdao is serving one of the very northern destinations, Changchun (this is even in a situation where all connections are based on road network distances, not using roro ferries by the coast). In addition to these, Shanghai is serving Lianyungang demand, even if this latter city also has its own sea port. Apart from these three, the given solution sounds possible. It should be highlighted that logistics routes and hinterlands of different sea ports are never “rational” as there is always competition involved, and other factors, like customers, frequency to reach customers, and given destinations play an important role.
The initial results were changed in a way that railway and dry port alternatives were offered to the linear integer programming to choose from, in order to minimize hinterland transportation amounts. The first change was such that for Ürümqi there was a railway connection from Lianyungang sea port, which offers the shortest proximity from all of the used sea ports. The railway distance was 2781 km, and it was multiplied by 40% to give the equivalent road distance of 1112.4 km (railways in the Defra [75] database are 60% less polluting than semi-trailer trucks; in one Chinese study, this difference was argued to be even higher in China, 80%; [16]). Railway connection to Ürümqi was offered due to the reason that this location is so remote, and there is clear emission saving potential just to decide to serve it with the lowest possible railway distance. The model assumes that Ürümqi does not offer dry port services to anywhere else, just for this city. However, two other locations were added, which were planned to offer dry port services for their own location and possible near-by locations. These were Wuhan (served by Nanjing, 512 km) and Xuzhou (served by Lianyungang, 200 km). With given constraints (mentioned earlier), this did not change results that much. As could be noted from Figure 4, Lianyungang is served with railway connection Ürümqi, and the dry port of Wuhan is just serving this city, nothing else.
Dry port locations were not chosen on an ad hoc basis, but with a gravitational model (similar to References [20,55] concerning Finland and aviation industry application [76]). All 51 cities were tested by calculating the total cost to serve these chosen cities (cost to a particular location is the distance to particular location times its population), to resemble location performance to serve the whole of China (overall results, see Appendix A). The lowest cost locations were Hefei, Xuzhou, Nanjing, Huai’an, Yangzhou, Zaozhuang, and Wuhan (the difference between the best performing Hefei vs. Wuhan was 5.4%, therefore being very minor). On the other end, distributing entire China from the city of Ürümqi would cost 280.7% higher amount as compared to Hefei. Following Ürümqi, the next high-cost locations would be Harbin (138.9% higher cost as compared to the minimum of Hefei) and Kunming (120.3% higher cost). This research ended up using Wuhan and Xuzhou due to the reason that they are low-cost distribution places (so they should have demand outside of their own city too) and they were not next to each other (Wuhan is serving potentially more south, and Xuzhou more north). Wuhan is a rather good dry port location as it also has an opportunity to use water transport by the Yangtze River (also used in grain distribution research of [40] Li et al., 2018).
If the optimizing program is given freedom to select any sea port city for distribution based on the lowest hinterland distribution activity (population times distance for each city), it changes the results dramatically in sea port, but within sub-regions, the changes are not so significant (see Figure 5). For example, the sea port of Shanghai is losing a lot of volume, but these mostly to the sea port rather than the near-by Nanjing (also Ningbo is somewhat in lower market share). Similarly, Shenzhen is losing volumes, but these are due to the near-proximity sea port of Guangzhou. Also, Qingdao is on the losing side; however, these volumes are mostly absorbed by Lianyungang (again in rather short proximity). In the northern parts, Dalian sea port is taking care of the three northern cities. Even if these changes in distances in each case are not so significant, they do play an important role in the overall results. With a vast population, distribution activity is of course lower. This could be concluded by examining Figure 5 in detail and comparing it to the two earlier Figure 2 and Figure 4.
The importance of Nanjing and Lianyungang only increases further if the railway connection to Ürümqi is brought to the optimization model together with the two dry port locations Wuhan and Xuzhou. In this situation, all of these options are used. As Figure 6 illustrates, Wuhan has six locations to serve (incl. itself), which are Changsha, Chengdu, Chongqing, Nanchang, Wuhan, and Xiangyang (Figure 7 is the same network with names visible). The overall population of Wuhan and these five other cities is really significant, 60 million. Therefore, the practicality of this solution is questionable. However, it could be tackled by adding numerous dry port locations in nearby cities. The location of Wuhan seems to be useful for dry port activities in this setting. Similarly, the proposed dry port of Xuzhou is attracting four locations including itself, Xi’an, Zaozhuang, and Zhengzhou. The total population to be served by this dry port is also big, 33.88 million. Again, in real-life, numerous other near-by dry ports are needed (these, of course, can be in these served cities as well).
The proposed solution shall also increase the handling volumes of the sea port of Nanjing and Lianyungang significantly; they would be, in this new situation, the largest volume container sea ports. Nanjing would be serving directly four cities and indirectly nine (through dry port), and its served population would be 80.67 million. Lianyungang, in turn, would be serving directly five cities and indirectly eight (through the dry port) having a total population of 56.6 million. As said, traditional and currently used sea ports would be losing in this scenario, where Guangzhou (serving six cities and 43 million population) and Tianjin (serving five cities and 55.9 million population) would be the most significant ones. It is evident that in practice this sea port volume from Nanjing and Lianyungang needs to be shared by close-by sea ports, like Suzhou and Shanghai (case of Nanjing) as well as Qingdao and Tianjin (case of Lianyungang).
In the comparison of these four scenarios, Figure 8 shows the performance concerning total transportation amounts (emissions as railway transports is converted with 60% lower emissions being comparable to “road transports”). Highest emission amounts are in the first scenario, which tries to replicate the current situation and sea port handling volumes. This situation could be improved somewhat with two dry port options and direct connection to the most remote city. The hinterland transportation amount shall decrease in our model by 4.6% using this strategy. Higher emission reductions are available, if a high number of sea ports are used in the best possible manner to reach the minimum hinterland transport need of 51 cities. Just using this strategy without dry ports shall decrease emissions by 18.9%. If two dry port options are added along with direct connection to the most remote city, this will reduce emissions even further. Actually, the emissions reduction amount in this situation is 31.4%.
Results of this study are static, and it assumes that the container transportation need goes hand in hand with population amounts. However, some regions and cities could have much better consumption power (through higher salaries earnt), which could make these more import-oriented. In turn, exports from lower consumption regions could be higher. So, all in all, these results act as a good proxy for future emission reduction plans.

5. Concluding Discussion

The argumentation of this research is that dry ports are important to be implemented in China, and used in large-scale to enable low carbon objectives. However, an at least equally important source of lower emissions exists in the use of different container sea ports. The Chinese container revolution started from the Pearl River Delta region and continued to the Yangtze River Delta region—both of these are very significant for the global trade and container transportation system. However, even with the data ending in 2010, Pan et al. [59] already identified that growth rates of these regions are not as high as they were before, and sea ports in North of China were actually showing promising growth. As an explanation, Pan et al. [59] stated that, in general, increasing salaries, lack of free land, and better export growth is elsewhere within China (than currently dominating container regions). This research supports a “shift” to the north in a Chinese container sea port system, and it is not only important for the purposes of economic growth, but for the sake of the environment and lower emissions. Cities, population and hinterland transport truly make a difference in overall system emissions.
Already dominating and big container sea port regions (the Pearl and the Yangtze River Delta) could do more to lower emissions as this research showed. These regions should think about more in terms of the hinterland service perspective and possibly locate container volumes on sea ports, which are better serving this objective (like found in this study, an opportunity of both Nanjing and Guangzhou). Currently dominating ports can continue their top positions, but these then with the higher amounts of transshipment services to better-positioned hinterland serving sea ports. Also, the dry port of Yiwu within the scale and successfulness could act as a benchmark for other locations.
Dry port locations are difficult to tackle, as a population is so significant in the largest Chinese cities. In this study, it was proposed that the “gravitational” center of China should be used to develop dry port locations. However, the served populations in Wuhan and Xuzhou dry ports of this hypothetical study were so big that additional dry ports close-by to these should be considered for practical reasons. For example, the existing cities of Jiujiang and Yueyang near to Wuhan. These also have waterway transportation mode use possibility [40] together with a railway. For proposed Xuzhou dry port location, additional places for dry ports could be the best possible gravitational city in this study, Hefei. Also, served locations of Xuzhou in this model, Zhengzhou and Xi’an, are attractive. Many of these mentioned locations already have dry ports, but their scale is not millions of TEUs per year—they are important; however, for environmental sense, their scale should be more significant. Also, using primarily the railway mode between a dry port and sea port would be required (waterway transports could, however, be a practical choice too).
For further research in this area, it would be interesting to continue working with the created model and application. Currently, the analysis consists of 51 cities, however, 100 to 200 cities should be incorporated with the population to get higher reliability in the analysis. This would also require gathering a lot of distance information between cities. China has 50 container sea ports in its long coastal line, and enlarging further possibly used sea ports would be an interesting further avenue for model development. Again, this would increase the number of cities analyzed and data gathered. This is merely a project of several years, but its outcomes with respect to lower emission opportunity should not be underestimated.

Author Contributions

Conceptualization, O.-P.H. and Y.P.; Methodology, Y.P. and O.-P.H.; Software, O.-P.H.; Validation, W.L., O.-P.H. and Y.P.; Formal Analysis, W.L., O.-P.H. and Y.P.; Investigation, W.L., O.-P.H. and Y.P.; Resources, W.L., O.-P.H. and Y.P.; Data Curation, O.-P.H.; Writing-Original Draft Preparation, W.L., O.-P.H. and Y.P.; Writing-Review & Editing, W.L., O.-P.H. and Y.P.; Visualization, O.-P.H. and Y.P.; Supervision, W.L.; Project Administration, O.-P.H.

Funding

This research received no external funding.

Conflicts of Interest

The authors declare no conflict of interest.

Appendix A

Distribution costs (by road, where cost is simply the distance to destination city times population in this destination city, and these all are summed together from one city at a time representing the distribution center) to 51 cities from a particular Chinese city (lowest cost first, thereafter ascending).
Table A1. Largest 51 cities of this study in ascending distribution cost order, if the entire country is being distributed from this one city alone.
CityDistribution CostDiff. (%)26Tianjin517,413.829.1%
1Hefei400,638.80.0%27Taiyuan520,261.429.9%
2Xuzhou406,854.61.6%28Beijing525,641.331.2%
3Nanjing407,055.31.6%29Xi’an530,248.832.4%
4Huai’an415,669.33.8%30Tangshan540,277.334.9%
5Yangzhou417,305.84.2%31Fuzhou567,117.641.6%
6Zaozhuang417,656.84.2%32Quanzhou600,946.850.0%
7Wuhan422,394.65.4%33Xiamen608,026.651.8%
8Changzhou426,597.56.5%34Huizhou614,013.853.3%
9Linyi427,086.06.6%35Guangzhou620,174.254.8%
10Lianyungang428,286.46.9%36Dongguan626,458.956.4%
11Zhengzhou430,098.47.4%37Chongqing628,868.057.0%
12Wuxi434,207.28.4%38Foshan629,854.657.2%
13Suzhou435,425.88.7%39Shantou635,818.758.7%
14Nantong441,301.410.1%40Shenzhen638,814.659.4%
15Jinan441,671.010.2%41Zhongshan653,010.063.0%
16Hangzhou443,966.910.8%42Guiyang688,030.171.7%
17Nanchang445,182.711.1%43Chengdu696,776.173.9%
18Xiangyang452,078.112.8%44Nanning729,202.382.0%
19Shanghai453,677.013.2%45Shenyang736,660.583.9%
20Zibo455,206.113.6%46Lanzhou748,440.686.8%
21Ningbo480,127.519.8%47Dalian800,653.299.8%
22Shijiazhuang480,624.120.0%48Changchun843,535.3110.5%
23Changsha482,875.820.5%49Kunming882,563.3120.3%
24Qingdao487,476.621.7%50Harbin957,175.4138.9%
25Wenzhou512,305.027.9%51Ürümqi1,525,155.9280.7%

References

  1. Romera, B.M. The Paris agreement and the regulation of international bunker fuels. Reciel—Rev. Eur. Community Int. Environ. Law 2016, 25, 215–227. [Google Scholar] [CrossRef]
  2. Hilmola, O.-P. The Sulphur Cap in Maritime Supply Chains: Environmental Regulations in European Logistics; Palgrave Macmillan, Pivot Series: Cham, Switzerland, 2019. [Google Scholar]
  3. Hilmola, O.-P. Transport modes and intermodality. In Encyclopedia of Marine and Offshore Engineering; Carlton, J., Jukes, P., Sang, C.Y., Eds.; Wiley Publishers: New York, NY, USA, 2017; pp. 1–12. [Google Scholar]
  4. Roso, V.; Woxenius, J.; Lumsden, K. The dry port concept: Connecting container seaports with the hinterland. J. Transp. Geogr. 2009, 17, 338–345. [Google Scholar] [CrossRef]
  5. Monios, J.; Wilmsmeier, G. Giving a direction to port regionalisation. Transp. Res. Part A Policy Pract. 2012, 46, 1551–1561. [Google Scholar] [CrossRef]
  6. Baydar, A.M.; Sürel, H.; Celik, M. Freight villages: A literature review of from the sustainability and societal equity perspective. J. Clean. Prod. 2017, 167, 1208–1221. [Google Scholar] [CrossRef]
  7. OECD. OECD Urban Policy Reviews: China 2015; OECD Urban Policy Reviews; OECD Publishing: Paris, France, 2015. [Google Scholar]
  8. Dent, H.S. The Demographic Cliff—How to Survive and Prosper During the Great Deflation of 2014–2019; Penguin Group: New York, NY, USA, 2014. [Google Scholar]
  9. He, Q.; Bertness, M.D.; Bruno, J.F.; Li, B. Economic development and coastal ecosystem change in China. Sci. Rep. 2014, 4, 5995. [Google Scholar] [CrossRef] [PubMed]
  10. National Bureau of Statistics of China. China Statistical Yearbook 2016; China Statistics Press: Beijing, China, 2016.
  11. National Bureau of Statistics of China. China Statistical Yearbook 2017; China Statistics Press: Beijing, China, 2017.
  12. National Bureau of Statistics of China. China Statistical Yearbook 2018; China Statistics Press: Beijing, China, 2018.
  13. UNCTAD. Data Center—Container Port Throughput, 2010–2017. 2018. Available online: unctadstat.unctad.org (accessed on 27 December 2018).
  14. Jiang, Y.; Sheu, J.-B.; Peng, Z.; Yu, B. Hinterland patterns of China Railway (CR) express in China under the Belt and Road Initiative: A preliminary analysis. Transp. Res. Part E 2018, 119, 189–201. [Google Scholar] [CrossRef]
  15. Kuzmicz, K.A.; Pesch, E. Approaches to empty container repositioning problems in the context of Eurasian intermodal transportation. Omega 2018. [Google Scholar] [CrossRef]
  16. Jiang, B.; Li, J.; Mao, X. Container ports multimodal transport in China from the view of low carbon. Asian J. Ship. Logist. 2012, 28, 321–344. [Google Scholar] [CrossRef]
  17. Shenzhen Port. World Class Container Shipping Hub; Shenzhen Port: Shenzhen, China, 2018. [Google Scholar]
  18. Ka, B. Application of fuzzy AHP and ELECTRE to China dry port location selection. Asian J. Ship. Logist. 2011, 27, 331–354. [Google Scholar] [CrossRef]
  19. Chang, Z.; Yang, D.; Wan, Y.; Han, T. Analysis on the features of Chinese dry ports: Ownership, customs service, rail service and regional competition. Transport Policy 2019. [Google Scholar] [CrossRef]
  20. Henttu, V.; Lättilä, L.; Hilmola, O.-P. Optimization of relative transport costs of a hypothetical dry port structure. J. Transp. Telecommun. 2011, 12, 12–19. [Google Scholar]
  21. Lättilä, L.; Henttu, V.; Hilmola, O.-P. Hinterland Operations of Sea Ports Do Matter: Dry Port Usage Effects on Transportation Costs and CO2 Emissions. Transp. Res. Part E 2013, 55, 23–42. [Google Scholar] [CrossRef]
  22. Roso, V.; Andersson, D. Dry ports and logistics platforms. In Encyclopedia of Marine and Offshore Engineering; Carlton, J., Jukes, P., Sang, C.Y., Eds.; Wiley: New York, NY, USA, 2017. [Google Scholar]
  23. Vassallo, J.M. Nature or Nurture: Why do Railroads Carry Greater Freight Share in the United States than in Europe? Research Working Paper Series, WP05–15; Harvard University: Cambridge, MA, USA, 2005. [Google Scholar]
  24. Panova, Y.; Hilmola, O.-P. Justification and evaluation of dry port investments in Russia. Res. Transp. Econ. 2015, 51, 61–70. [Google Scholar] [CrossRef]
  25. Hanaoka, S.; Regmi, M.B. Promoting intermodal freight transport through the development of dry ports in Asia: An environmental perspective. IATSS Res. 2011, 35, 16–23. [Google Scholar] [CrossRef] [Green Version]
  26. Tsao, Y.-C.; Ling, V.T. Seaport-dry port network design considering multimodal transport and carbon emissions. J. Clean. Prod. 2018, 199, 481–492. [Google Scholar] [CrossRef]
  27. Wang, X.; Cao, J. Location Evaluation of Inland Dry Port Based on Regional Attraction. China Waterw. Transp. 2018, 12, 30–33. [Google Scholar]
  28. Cullinane, K.; Wilmsmeier, G. The contribution of the dry port concept to the extension of port life cycles. Oper. Res./Comput. Sci. Interfaces Ser. 2011, 49, 359–379. [Google Scholar]
  29. Roso, V. Evaluation of the dry port concept from an environmental perspective: A note. Transp. Res. Part D Transp. Environ. 2007, 12, 523–527. [Google Scholar] [CrossRef]
  30. Roso, V. The emergence and significance of dry ports: The case of the Port of Göteborg. World Rev. Intermodal Transp. Res. 2009, 2, 296–310. [Google Scholar] [CrossRef]
  31. Beresford, A.; Pettit, S.; Xu, Q.; Williams, S. A study of dry port development in China. Marit. Econ. Logist. 2012, 14, 73–98. [Google Scholar] [CrossRef]
  32. Zeng, Q.; Maloni, M.J.; Paul, J.A.; Yang, Z. Dry port development in China: Motivations, challenges, and opportunities. Transp. J. 2013, 52, 234–263. [Google Scholar] [CrossRef]
  33. Notteboom, T.; Yang, Z. Port governance in China since 2004: Institutional layering and the growing impact of broader policies. Res. Transp. Bus. Manag. 2017, 22, 184–200. [Google Scholar] [CrossRef]
  34. Bentaleb, F.; Mabrouki, C.; Semma, A. Dry Port Development: A Systematic Review. J. Eta Marit. Sci. 2015, 3, 75–96. [Google Scholar] [CrossRef]
  35. Shi, S.; Wang, T. Current situation and countermeasure of dry port development in China. Waterw. Transp. Manag. 2016, 38, 22–25. [Google Scholar]
  36. Li, J.; Jiang, B. Cooperation performance evaluation between seaport and dry port; Case of Qingdao and Xi’an port. Int. J. E-Navig. Marit. Econ. 2014, 1, 99–109. [Google Scholar] [CrossRef]
  37. Li, Y.; Dong, Q.; Sun, S. Dry port development in China: Current status and future strategic directions. J. Coast. Res. 2015, 73, 641–646. [Google Scholar] [CrossRef]
  38. Wei, H.; Sheng, Z. Dry Ports-Seaports Sustainable Logistics Network Optimization: Considering the Environment Constraints and the Concession Cooperation Relationships. Pol. Marit. Res. 2017, 24, 143–151. [Google Scholar] [CrossRef] [Green Version]
  39. Amos, P.; Dashan, J.; Tao, N.; Junyan, S.; Weijun, F. Sustainable Development of Inland Waterway Transport in China; The World Bank: Washington, WA, USA, 2009. [Google Scholar]
  40. Li, D.; Zhao, L.; Wang, C.; Sun, W.; Xue, J. Selection of China’s imported grain distribution centers in the context of the Belt and Road initiative. Transp. Res. Part E 2018, 120, 16–34. [Google Scholar] [CrossRef]
  41. Wu, J.; Haasis, H.-D. The freight village as a pathway to sustainable agricultural products logistics in China. J. Clean. Prod. 2018, 196, 1227–1238. [Google Scholar] [CrossRef]
  42. Creswell, J.W.; Creswell, J.D. Research design: Qualitative, Quantitative, and Mixed Methods Approaches; Sage Publications: Thousand Oaks, CA, USA, 2017. [Google Scholar]
  43. Padberg, M.W. Combinatorial Optimization—Mathematical Programming Studies; Springer: Berlin/Heidelberg, Germany, 1980; Volume 12. [Google Scholar]
  44. Gass, S.I. Linear programming. In Encyclopedia of Statistical Sciences; State publishing house of physical and mathematical literature “FIZMATGIZ”: Moscow, Russia, 2004. [Google Scholar]
  45. Yokota, T.; Gen, M.; Li, Y.X. Genetic algorithm for non-linear mixed integer programming problems and its applications. Comput. Ind. Eng. 1996, 30, 905–917. [Google Scholar] [CrossRef]
  46. Genova, K.; Guliashki, V. Linear integer programming methods and approaches—A survey. J. Cybern. Inf. Technol. 2011, 11, 1. [Google Scholar]
  47. Miller, C.E.; Tucker, A.W.; Zemlin, R.A. Integer programming formulation of traveling salesman problems. J. ACM (JACM) 1960, 7, 326–329. [Google Scholar] [CrossRef]
  48. Floudas, C.A.; Lin, X. Mixed integer linear programming in process scheduling: Modeling, algorithms, and applications. Ann. Oper. Res. 2005, 139, 131–162. [Google Scholar] [CrossRef]
  49. Aerts, J.C.; Eisinger, E.; Heuvelink, G.B.; Stewart, T.J. Using linear integer programming for multi-site land-use allocation. Geogr. Anal. 2003, 35, 148–169. [Google Scholar] [CrossRef]
  50. Abara, J. Applying integer linear programming to the fleet assignment problem. Interfaces 1989, 19, 20–28. [Google Scholar] [CrossRef]
  51. Cheng, S.; Chan, C.W.; Huang, G.H. An integrated multi-criteria decision analysis and inexact mixed integer linear programming approach for solid waste management. Eng. Appl. Artif. Intell. 2003, 16, 543–554. [Google Scholar] [CrossRef]
  52. Shirokov, A.P. Mathematical Models and Methods in the Management of Transport Systems: Transport Problems Management by Methods of Linear Programming; Educational and Methodical Manual for Students; Far Eastern State Transport University (FESTU): Khabarovsk, Russia, 1999. [Google Scholar]
  53. Wentzel, E.S.; Ovcharov, L.A. The Theory of Random Processes and its Engineering Applications; Higher School: Moscow, Russia, 2000. [Google Scholar]
  54. Yermoliev, Y.M. Methods of Stochastic Programming; Science: Moscow, Russia, 1976. [Google Scholar]
  55. Henttu, V.; Hilmola, O.-P. Financial and environmental impacts of hypothetical Finnish dry port structure. Res. Transp. Econ. 2011, 33, 393–407. [Google Scholar] [CrossRef]
  56. Sheremet, A.D. Theory of Economic Analysis; Infra-M: Moscow, Russia, 2011. [Google Scholar]
  57. Panova, Y. Public-Private Partnership Investments in Dry Ports—Russian Logistics Markets and Risks. Thesis for the Degree of Doctor of Science (Technology), Lappeenranta University of Technology, Lappeenranta, Finland, 2016. [Google Scholar]
  58. United Nations. Review of Maritime Transport 2018; United Nations Conference on Trade and Development; United Nations: New York, NY, USA, 2018. [Google Scholar]
  59. Pan, K.; Cao, Y.; Liang, S.; Wei, H. New tendency of Chinese container port system: 1998–2010. GeoJournal 2014, 79, 373–384. [Google Scholar] [CrossRef]
  60. World Shipping Council. TOP 50 Container Sea Ports in 2016. 2018. Available online: http://www.worldshipping.org/about-the-industry/global-trade/top-50-world-container-ports (accessed on 28 December 2018).
  61. Lloyds. Lloyd’s List: One Hundred Ports 2018. 2018. Available online: https://lloydslist.maritimeintelligence.informa.com/one-hundred-container-ports-2018#ranking (accessed on 29 December 2018).
  62. European Union. EU Transport in Figures—Statistical Pocketbook 2018; Publications Office of EU: Luxemburg, 2018. [Google Scholar]
  63. OECD. The Competitiveness of Global Port-Cities; OECD Publishing: Paris, France, 2014. [Google Scholar]
  64. Park, N.-K.; Lim, C.-K. Choice factors of transshipment port in Northeast Asia. J. Navig. Port Res. Int. Ed. 2009, 33, 587–596. [Google Scholar] [CrossRef]
  65. Demographia. Demographia World Urban Areas. 14th Annual Edition: 201804. 2018. Available online: http://www.demographia.com/db-worldua.pdf (accessed on 27 December 2018).
  66. Wikipedia. List of Cities in China by Population and Built-up Area. 2018. Available online: https://en.wikipedia.org/wiki/List_of_cities_in_China_by_population_and_built-up_area (accessed on 27 December 2018).
  67. Google Maps. Google Maps Service. 2019. Available online: https://www.google.fi/maps (accessed on 4 January 2019).
  68. Huochepiao. Chinese Railway Website Called Huochepiao. 2019. Available online: http://www.huochepiao.com (accessed on 8 January 2019).
  69. Baidu Map. Baidu Map Service. 2019. Available online: https://map.baidu.com (accessed on 8 January 2019).
  70. OpenSolver. OpenSolver website—Download & Install. 2019. Available online: https://opensolver.org/installing-opensolver/ (accessed on 8 January 2019).
  71. Mason, A.J. OpenSolver—An Open Source Add-in to Solve Linear and Integer Progammes in Excel. In Operations Research Proceedings 2011; Diethard, K., Hans-Jakob, L., Karl, S., Eds.; Springer: Berlin/Heidelberg, Germany, 2012; pp. 401–406. [Google Scholar]
  72. Dimitrov, N.B.; Solow, D.; Szmerekovsky, J.; Guo, J. Emergency relocation of items using single trips: Special cases of the Multiple Knapsack Assignment Problem. Eur. J. Oper. Res. 2017, 258, 938–942. [Google Scholar] [CrossRef]
  73. Ramos, A.G.; Leal, J. ILP model for energy-efficient production scheduling of flake ice units in food retail stores. J. Clean. Prod. 2017, 156, 953–961. [Google Scholar] [CrossRef]
  74. GeoHack. GeoHack—Shanghai. 2019. Available online: https://tools.wmflabs.org/geohack/geohack.php?pagename=Shanghai&params=31_13_43_N_121_28_29_E_type:adm1st_region:CN-31 (accessed on 16 January 2019).
  75. Defra. Greenhouse Gas Reporting: Conversion Factors 2018. 2018. Available online: https://www.gov.uk/government/publications/greenhouse-gas-reporting-conversion-factors-2018 (accessed on 27 December 2018).
  76. Nõmmik, A.; Kukemelk, S. Developing gravity model for airline regional route modelling. Aviation 2016, 20, 32–37. [Google Scholar] [CrossRef]
Figure 1. Transportation mode shares (freight) in 2016 within China as measured with tons and ton-km. Source (data): National Bureau of Statistics of China [10,11,12].
Sustainability 11 01515 g001
Figure 2. Sea ports and larger cities in China, when the model tries to replicate the current container handling volumes of selected sea ports with population amounts.
Sustainability 11 01515 g002
Figure 3. Sea ports and larger cities in China (with city names), when the model tries to replicate the current container handling volumes of selected sea ports with population amounts (figure turned 90 degrees).
Sustainability 11 01515 g003
Figure 4. Sea ports, two possible dry ports (Wuhan and Xuzhou) and larger cities in China, when the model tries to replicate the current container handling volumes of selected sea ports with population amounts.
Sustainability 11 01515 g004
Figure 5. Sea ports and larger cities in China, when the model just seeks the best possible allocation of container volume on a used container sea port structure to minimize hinterland transport.
Sustainability 11 01515 g005
Figure 6. Sea ports, two dry ports (Wuhan and Xuzhou), and larger cities in China, when the model just seeks the best possible allocation of container volume on a used container sea port structure to minimize hinterland transport.
Sustainability 11 01515 g006
Figure 7. Sea ports, two dry ports (Wuhan and Xuzhou), and larger cities in China (with city names), when the model seeks the best possible allocation of container volume on a used container sea port structure to minimize hinterland transport (figure turned 90 degrees).
Sustainability 11 01515 g007
Figure 8. Hinterland transport total amounts (emissions) from four different scenarios of this study.
Sustainability 11 01515 g008
Table 1. Sea ports used in this study within optimization and sea port/dry port model (TEU, Twenty foot Equivalent Unit). Source (data): United Nations [58]; World Shipping Council [60]; Lloyds [61]; Unctad [13].
Sea PortMill. TEU (2017)
Shanghai40.23
Shenzhen25.21
Ningbo24.61
Guangzhou20.37
Qingdao18.26
Tianjin15.21
Xiamen10.38
Dalian9.71
Suzhou5.40
Lianyungang4.71
Dongguan3.91
Nanjing3.08
Fuzhou3.00
Tangshan2.53
Quanzhou2.30
Total:188.91
Total China:213.72
Share:88.4 %
Table 2. Largest Chinese cities (TOP 50 plus Lianyungang) and their respective population as well as whether they are included as container sea ports in this study. Source (data): Wikipedia [66], Demographia [65], Unctad [13].
City AreaPopulationSea Port City AreaPopulationSea Port
1Shanghai24.18yes26Wuxi6.55
2Beijing21.71 27Xiamen3.53yes
3Guangzhou14.50yes28Changchun7.67
4Tianjin15.62yes29Ningbo7.64yes
5Chongqing17.00 30Nanning6.91
6Chengdu14.43 31Taiyuan4.20
7Shenzhen12.53yes32Hefei7.87
8Harbin10.64 33Changzhou4.59
9Wuhan10.61 34Tangshan7.54yes
10Hangzhou9.47 35Zhongshan3.14
11Xi’an12.00 36Xuzhou8.58
12Shenyang8.29 37Guiyang4.70
13Dongguan8.22yes38Ürümqi3.52
14Nanjing8.34yes39Zibo4.53
15Foshan7.20 40Shijiazhuang10.78
16Jinan6.81 41Fuzhou7.66yes
17Wenzhou9.12 42Huai’an4.80
18Qingdao9.05yes43Linyi10.04
19Quanzhou8.13yes44Lanzhou3.62
20Shantou5.39 45Yangzhou4.46
21Changsha7.43 46Nanchang5.04
22Suzhou10.66yes47Huizhou4.60
23Zhengzhou9.57 48Nantong7.28
24Dalian6.69yes49Xiangyang5.50
25Kunming6.63 50Zaozhuang3.73
51Lianyungang4.39yes
Total (51):427.08
Total (China):1409.50
Share (%):30.3 %
Table 3. Illustration of the distance matrix, where there exists information from distances between the 15 largest cities.
123456789101112131415
ShanghaiBeijingGuangzhouTianjinChongqingChengduShenzhenHarbinWuhanHangzhouXi’anShenyangDongguanNanjingFoshan
1Shanghai012141450113016691964147422868271761377173514653021471
2Beijing1214021431141802180821691241115812931074690216810292164
3Guangzhou145021430212613171568139331898912661679276771.2136030.8
4Tianjin113011421260185218592196119211851226112564121949852190
5Chongqing166918021317185204001451302785215917542476138313781317
6Chengdu1964180815681859400017003034115918837422483163216701566
7Shenzhen1474216913921961451170003349107212891799279869.41383142
8Harbin22861241331811923027303433490234123772300560337021353365
9Wuhan827115898911858521159107223410746781179210485441016
10Hangzhou176129312661226159118831289237774601319182512832761290
11Xi’an137710741679112575474217992300781131901715169510871656
12Shenyang173569027676412476248327985601792182517150281915842815
13Dongguan1465216871.221941383163269.4337010481283169528190138987.4
14Nanjing30210291360985137816701383213554427610871584138901385
15Foshan1471216430.82190131715661423365101612901656281587.413850

