1. Introduction
The transport of goods in urban areas is essential for the economy of any given city. Nevertheless, urban freight delivery and pick-up movements can have at least four major negative impacts: Congestion, insecurity, pollution [
1], and energy consumption. Especially, when the drivers have limited time for delivery, they double-park so as not to cruise for parking. Double-parking can cause temporal reductions of the road capacity in several places. The capacity drops can consequently increase travel time delays and reduce the global performances of transportation networks [
2,
3,
4,
5].
The Freight Loading Zone (FLZ) management is a challenge as the multi-modal demand of the existing infrastructure increases. Indeed, parking is essential for trucks to deliver and pick-up goods. Implementing comprehensive urban freight policies is a challenge for public decision makers. The lack of understanding of the supply chain perspective is one of the identified difficulties [
6,
7]. City managers can apply numerous strategies to reduce illegal freight double-parking problems. Based on previous studies, this paper attempts to identify two FLZ policies that are inherently linked: (i) Freight double-parking fine; and (ii) spatial FLZ management. It is recognized that private cars’ compliance in ensuring they do not park at FLZ can play a crucial role in reducing double-parking [
5].
(i) Numerous researches focus on parking price policy designed for cars [
8,
9,
10] car-sharing [
11], and freight [
12]. However, few studies have evaluated freight double-parking fine policy [
13,
14]. Actually, enforcement can be considered a reduction of the FLZ demand [
5,
15]. Increasing double-parking fines price can discourage illegal drivers, but not ensure their elimination [
13]. Moreover, cities are dependent on goods mobility and should not be dissuaded to double-park without adjusting a proper number of vacant FLZs, i.e., compensatory actions. Nourinejad and Roorda [
14] proposed an equilibrium model between the illegal commercial vehicle parking and the enforcement policies—defined in their study by the citation fine and level of enforcement.
(ii) The management of FLZ’s location is a dynamic problem through space and time. We identified two management solutions, which can be used individually or combined: Spatially, i.e., the number and the location of FLZ, and temporally, i.e., time window, time limit of parking, or enforcement of the booking system of FLZ [
16,
17]. Despite the fact that there is no universally agreed framework to identify the optimal spatial configuration and management system of FLZ, some papers proposed methodologies to establish their number, location, and usage [
5,
18]. Nourinejad et al. [
19] evaluated the reserved streets for freight parking as a potential truck parking policy. In urban areas, freight parking infrastructure has a high demand and limited supply [
5]. Malik et al. [
20] examined the impact of imbalance between FLZ demand and supply. This imbalance can vary considerably in terms of different areas and roadway types [
21]. Management solutions contribute to the efficient use of FLZ infrastructure by optimizing the use of space and time. This optimization makes it possible to maintain a level of service, while reducing the number of FLZs [
18]. While, a reduction in the number of FLZ increases the distance between a pair of FLZs. In the literature, numerous papers proposed to design the FLZ systems by solving the optimization problem. Muñuzuri et al. [
18] solved the location-allocation problem [
22] for the FLZ spatial configuration. The authors analyzed the resulting number, location, and availability of FLZs. Their indicator is the average traveled distance between the FLZ used and the customer, i.e., the walking distance. This paper considers a return as the unavailability of parking space. The network scale is one street. More generally, Levy and Benenson [
23] proposed a GIS-based approach for assessing parking patterns in urban areas, where dynamic supply and demand are taken into account.
Three major reasons can lead to the behavior of trucks to double-park: (i) the probability of finding a vacant FLZ through the time. This probability is influenced by the occupancy rate [
24], e.g., FLZ may be already occupied illegally by private cars or by another delivery truck. The consequences are uncertain times for cruising, additional delays, and fuel consumption; (ii) the spatial configuration of FLZs can be inappropriate, e.g., the FLZ locations may be inconsistent by unfollowing the economy dynamic; and (iii) the maneuvering time may dissuade drivers [
13].
This paper aims to retrieve the searching time of trucks, where double-parking by delivery trucks is eliminated. We define the searching time as the cruising-for-parking time, i.e., the time for a truck to find the first vacant parking. Moreover, to enhance the relevance of trucks to cruising-for-parking, we assume the automatized and systematic deployment of double-parking fine, and used the technology of autonomous delivery vehicles designed for sidewalks. Finally, microscopic traffic simulation with two case studies are carried out, a theoretical Manhattan network and the real network of Lyon (France) and its real data of FLZ location. We evaluate the FLZ system of Lyon through two axes of indicators: Spatially using Voronoï diagram and temporally using the cruise-for-truck-parking.
We investigated how the searching time is affected by two parameters: (i) The occupancy level of FLZs, and (ii) the region density of FLZs. To the best of our knowledge, there are no existing studies that focus on this line of research. Particularly, on researching time as an endogenous function of trucks’ travel time to evaluate FLZ management. We assume that there is a relationship between the cruise-for-parking and the probability of trucks to double-park. Thus, the minimization of the searching time can be an aggregated metric to evaluate both, the FLZ system performance and the double-parking rate. Based on our findings, an application to a last mile cost function is proposed.
The paper is organized as follows. In
Section 2, microscopic simulation is described integrating the parking choice model, the availability model, and the traffic model.
Section 3 describes the two case studies, their relative data and transportation network. In
Section 4, a spatial analysis of FLZ management is established and the quantization of the searching time is analyzed. In
Section 5, an application to a last mile cost function is proposed.
Section 6 draws the conclusion in this paper and presents some implications for future work.
2. Methodology
To retrieve the searching time, this paper proposed a methodology that includes the simulation of private car traffic flow and the trucks’ cruising-for-parking at the microscopic simulation scale. A two-step commercial vehicle parking model is presented: (i) A parking choice model, and (ii) an availability model.
In this paper, the commercial vehicle can only park on an FLZ, and not on any other kind of parking slot. Moreover, the state of demand was considered as the likelihood of finding ta vacant FLZ and the supply as the number of FLZs normalized by area, i.e., the FLZ density [FLZ/km]. Moreover, this paper attempted to identify five characteristics for simulating delivery routes: The origin and the destination, the array of stop points—customers, its order, the route between each pair of stop points, and the stopping time duration. Furthermore, the experimental design was based on the assumption that the properties of delivery routes do not influence the searching time. Consequently, origin, destination, and stop points were set randomly. In addition, the stopping time duration was fixed.
2.1. Parking Choice Model
The parking choice model was applied for each customer. The truck driver would choose the first parking available which is located at the shortest traveled distance of the customer location. Indeed, we assumed that the delivery truck driver aims to minimize his walking distance between the establishment to visit and the place the truck is parked. To this end, we assumed that the delivery truck drivers have the entire knowledge of the topology network. Moreover, we assumed that the delivery truck has no information of the FLZs occupancies, e.g., the location of the first FLZ vacant for a given customer.
For each customer, the array of FLZs of the network was sorted in ascending order according to the traveled distance from the given customer and the FLZ
i. To this end, we used the [
25] Dijkstra algorithm to compute the first shortest traveled distance for a given pair-wise origin and destination. Traveled distance makes it possible to consider the directed graph of the network (e.g., instead of Euclidean distance).
In this study, we designated acceptance thresholds for the walking distance and the searching time. Their calibrations call for specific attention as traveled distances and travel times can be heterogeneous throughout the network. The limitation of this model is that the total searching distance is not optimized for the delivery route generation (i.e., Traveling Salesman Problem or Vehicle Routing Problem algorithms). Indeed, the parking choice model considers each customer independently.
2.2. Availability Model
This paper investigated the Bernoulli’s principle to model the parking availability [
26,
27]. We determined that
p is the probability to find a vacant FLZ and
T0 is the occupancy rate, which satisfies
T0 = 1 −
p. We defined
k as the number of failure among Bernoulli trials before getting one success, i.e., finding the first available FLZ. The geometric distribution gives the probability of
k defined as:
with 0 ≤
p ≤ 1. Note that if
k is higher than the number of FLZs considered then the delivery truck repeats the FLZ array until the
k-th FLZ is reached. Arnott and Williams [
27] demonstrated that the use of geometric distribution underestimated the cruising time for parking.
This availability model made it possible to study various probabilities
p, which can represent different rates of FLZs occupancy in urban areas. The occupancy rate of 53% was used in the study of [
28] Plantier and Bonnet. Numerous solutions can contribute to decrease the rate of FLZs occupancy, e.g., a better rotation of trucks parking (reduction of the limit delivery time), the enforcement of private car to not to park on FLZ, or increasing of the number of FLZ. More precisely, occupancy rate (state of the demand at time
t) and the supply are inherently linked and thereby can influence each other.
This paper introduced the study of a carrousel in order to analyze the phenomenon related to our model of availability. The carrousel (
Figure 1-a) is a single direction infinite circle where the truck travels until it finds the first vacant FLZ, as described in the parking choice model. The carrousel is not a circle network, as studied by [
29] Litvak and Van Zwet. Carrousel is a generic schema of the proposed availability model, where distance of a given pair of FLZs can be related to any meshed transportation network.
To analytically study the availability model, we employed a stochastic approach of the distance of a given pair of FLZs. More precisely, the distance followed the gamma probability density function [
30].
Figure 1-b shows the fit of the gamma probability density function on the distribution of link length from the network of Lyon. The mean and the standard deviation are respectively 103, and 92 m. Let the two parameters be the shape denoted by
A and the scale denoted by
B, which are set respectively to
A = 1.95 and
B = 52.8.
Figure 1-c shows the traveled distance distribution, where
p = 0.5. Note that a zero value means no searching distance as the first FLZ visited is vacant.
Figure 1-d shows the boxplots of the distribution of various
p, from 0.1 to 0.9 by step of 0.1. The use of boxplot made it possible to establish a first statistical study of the properties of searching traveled distance influenced by
p, i.e., the mean, the median and the interquartile range. These three indicators are decreasing as a function of
p.
2.3. Microscopic Simulation of the Traffic Dynamics
To model traffic dynamics, this paper used a microscopic traffic simulator SymuVia [
31]. The latter is based on the Newell’s model [
32,
33] that is equivalent to the LWR’s model [
32,
33]. The trajectories calculated by the microscopic traffic simulator SymuVia are represented in Lagrangian coordinates. Microscopic simulation is computationally demanding for large scale networks, especially when the demand level is high. In fact, this kind of simulation requires the computation of the individual vehicle’s trajectories at each instant time
t.
This article carried out a microscopic simulation of mixed traffic is composed of private cars and commercial delivery trucks. We investigated the searching time that commercial trucks take to find the first vacant FLZ for each customer. The searching time was only calculated if the first closest FLZ to the customer is not vacant. If the first FLZ is vacant, the searching time would be zero. The network traffic was assigned according to the first Wardrop principle [
34], where users want to minimize their own travel times. The network equilibrium corresponded to the Deterministic User Equilibrium. Some studies performed a sensitivity analysis to investigate the influence of the traffic parameters calibration (see e.g., [
3,
35,
36]).
2.4. Indicators
In this paper, time-space indicators were used to evaluate an FLZ system. Firstly, this paper defined a spatial indicator that was based on the number and locations of FLZs on the network. Secondly, in order to characterize the FLZ’s level of service, it proposed using the Voronoï diagram [
37]. The latter is composed by convex polygons (or cells), calculated from the equidistant Euclidian distance of FLZ. Therefore, each polygon corresponds to an FLZ. In the literature, Voronoï diagrams were also used to partition a transportation network into a set of polygons based on the spatial distribution of data points [
38]. In this study, the data points corresponded to the FLZ. Thanks to the Voronoï polygons, three different variables were established, including the number of adjacent polygons, the surface area and density of a polygon. On one hand, this paper focused on the latter two variables, which enabled the identification of FLZ region. For each FLZ region, similar policy measures were set up to increase the performance of the FLZ management. On the other hand, this paper attempted to define another temporal indicator that was based on the searching time for FLZ. The searching time increased as the congestion of traffic in the network becomes more significant. Therefore, this indicator can be calculated from real or simulated traffic data.
4. Results
The impact of the state of the demand (denoted by p) and the state of supply (denoted by d) of FLZs on the searching time were quantified, on both the Manhattan and the Lyon networks. First, a spatial analysis of the FLZ configuration was established on the real network of Lyon. Then, the searching time measure was used to study the FLZ system.
Figure 4-a shows the Lyon network were partitioned, based on Voronoï decomposition. The black cells and the blue points represent the Voronoï polygons, and the FLZs, respectively. Voronoï cells properties make it possible to identify the shortest Euclidian distance of FLZ for any customer, based on cell perimeter; i.e., the FLZ where the customer is in the Voronoï polygon. Thus, Voronoï cells area can be used to measure the spatial FLZ level of service. The increase of the Voronoï cell area decreases the FLZ level of service. It is important to note that the FLZ location is not the centroidal Voronoï tessellation (i.e., is not the center of mass).
Figure 4-b distinguishes the density of establishments by the color of polygons, where the density is normalized from 0 to 1.
Figure 4-c represents the cross-analysis of the cells based on two of its characteristics: The length area and the density. The
x-axis represents the number of establishments and the
y-axis represents the length area. Voronoï cell (depicted by blue points), called FLZ in the legend. The research findings showed two potential regions for enhancement: (i) The region where temporal FLZ system should be enhanced, and (ii) the region where spatial FLZ configuration should be enhanced. (i) The south-east of the
Figure 4-c is characterized by a low length area with a high density of establishments. These values usually belong to an FLZ configuration of a city center, where the dynamic of the economy is the highest. The temporal FLZ system should be enhanced in this region, as the length area is already low. Indeed, enforcing FLZ turnover can be more relevant in this region that creates additional FLZs, as the existing infrastructure offer in city center is limited; (ii) the north of the
Figure 4-c is characterized by a high length area. Spatial FLZ should increase in this region as Voronoï length area that is too long, can induce a high traveled distance to reach the shortest FLZ, for a given customer. In further work, the spatial analysis of the FLZ level of service can be refined by the number of adjacent Voronoï cells. Moreover, the number of establishments—density cell—can be normalized by the number of movements (pickup and delivery) with the use of a freight demand model [
3,
45]. One of the major conclusions of [
46] David et al. is that, the number of FLZs in Lyon was generally appropriate. Their study focused on the first and the second district of Lyon, which are characterized by high commercial, residential density and congestion. Their parameters were 324 FLZ and 332 movements (representing 75% of Lyon urban freight).
Stochastic simulations of the Manhattan network have been computed per
p and
d, where each simulation includes a route of several customers, varying from 3 to 15. Such network enabled the study of 6 FLZ spatial configurations, that are homogeneously distributed.
Figure 5-a shows the distribution of 220 observations of searching time, where
p = 0.4 and
d = 2.2 FLZ/km. The
x-axis represents the searching time, [s], and the
y-axis represents the frequency.
Figure 5-b shows the boxplots for each
p varying from 0.2 to 0.8, where the density is set to
d = 2.2 FLZ/km. The trend of boxplots is similar to the
Figure 1-d. As our analysis has shown, the searching time distribution is dependent on the geometric probability function, considered in the availability model (cf.
Section 2.2). The mean searching time is 482 s, and 31 s, respectively for
p = 0.2, and
p = 0.8. Moreover, the interquartile range can represent the uncertainty of the searching time, which is equal to 616 s and 0 s for
p = 0.2 and
p = 0.8, respectively. This interquartile range significantly decreases from
p = 0.2 to
p = 0.4.
Figure 5-c,d visualize respectively the mean and the median searching time [s], depending on
p and
d. 3D-plots make it possible to analyze the dual-impacts of
p and
d on the cruising-for-truck-parking. The highest mean observation is the mean searching time of 664 s, where
p = 0.2 and
d = 0.6. Starting from a threshold of
d, the trend of the searching time distribution through
p tends to be similar. This observation can suggest that, even if FLZ supply is well-furnished, the searching time can be influenced by
p. On one hand, these results can be interpreted as a requirement of at least a threshold number of FLZs for a given urban area, in order to access a reasonable searching time for delivery trucks. On the other hand, the probability
p should be increased to reduce the mean searching time and its related uncertainty, e.g., by FLZ policies reinforcement or encouraging turn-over.
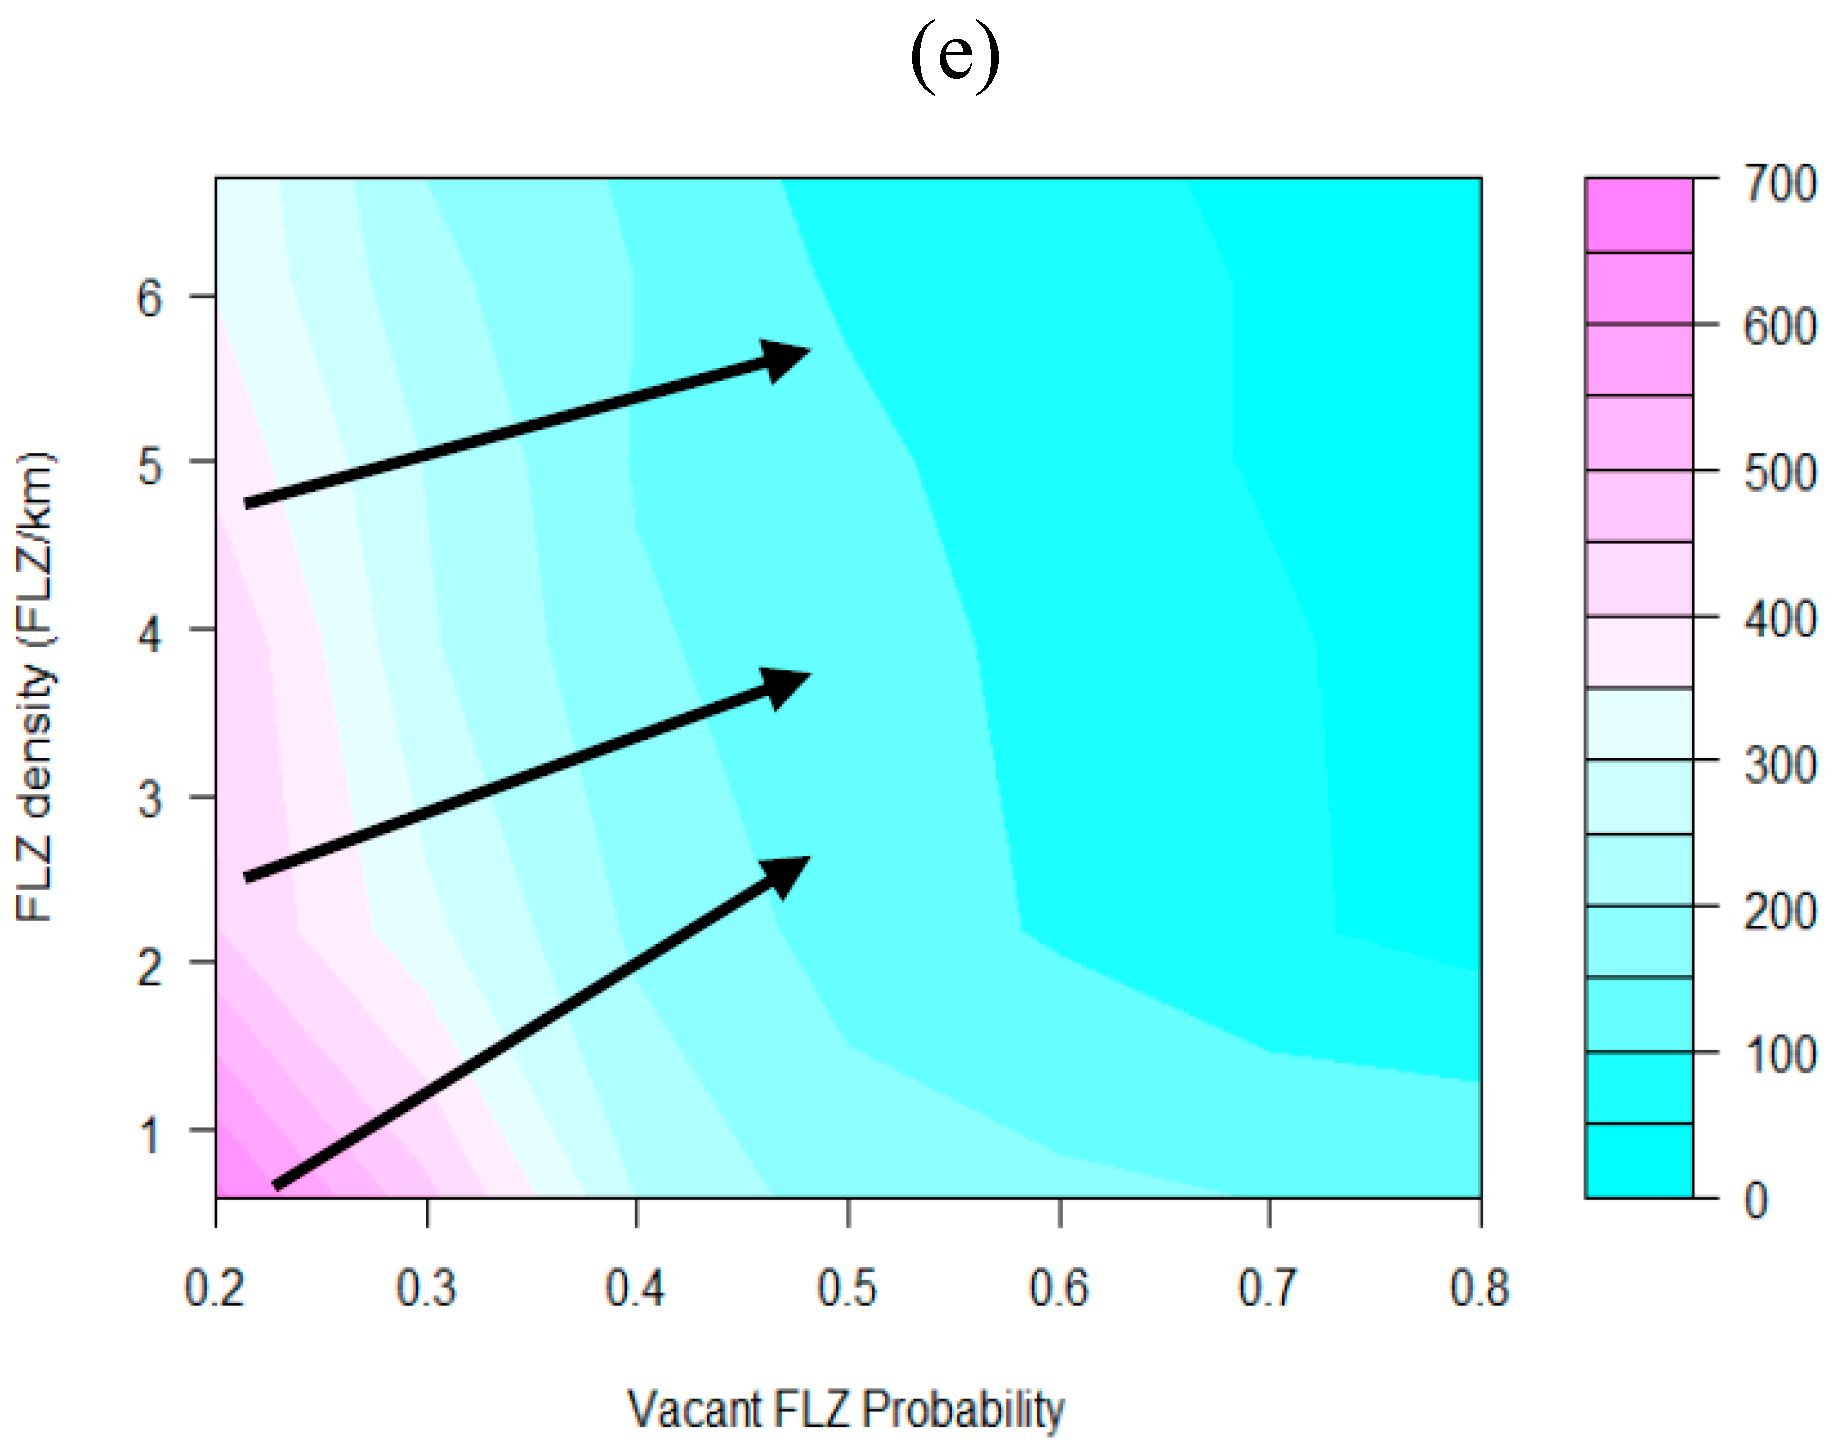
Figure 5-e presents the abacus of the mean searching time [s] related to the probability
p and the density
d respectively on the axis
x and
y. Contour plot renders identification of region by a high mean searching time, which is highlighted in pink. Black arrows represent the gradient slope. The results show a predominant influence of
p on the mean searching time. These results demonstrate that: The enforcement of temporal FLZ turn-over can lead to a greater decrease in the mean searching time than the creation of numerous new FLZs. We propose the use of the Searching Time Abacus (STA) to estimate the mean searching time, based on static demand and homogeneous regions from real-world cities and consequently evaluate FLZ system. For policy makers, STA can be a powerful tool for developing comprehensive freight policies that tackle illegal double-parking problems. Based on the STA, regions that are favorable for creating new FLZs or promoting the FLZ turnover can be identified. Moreover, we believe that two parameters—the occupancy rate and the density of FLZ—are affordable for city manager by survey methodology [
47].
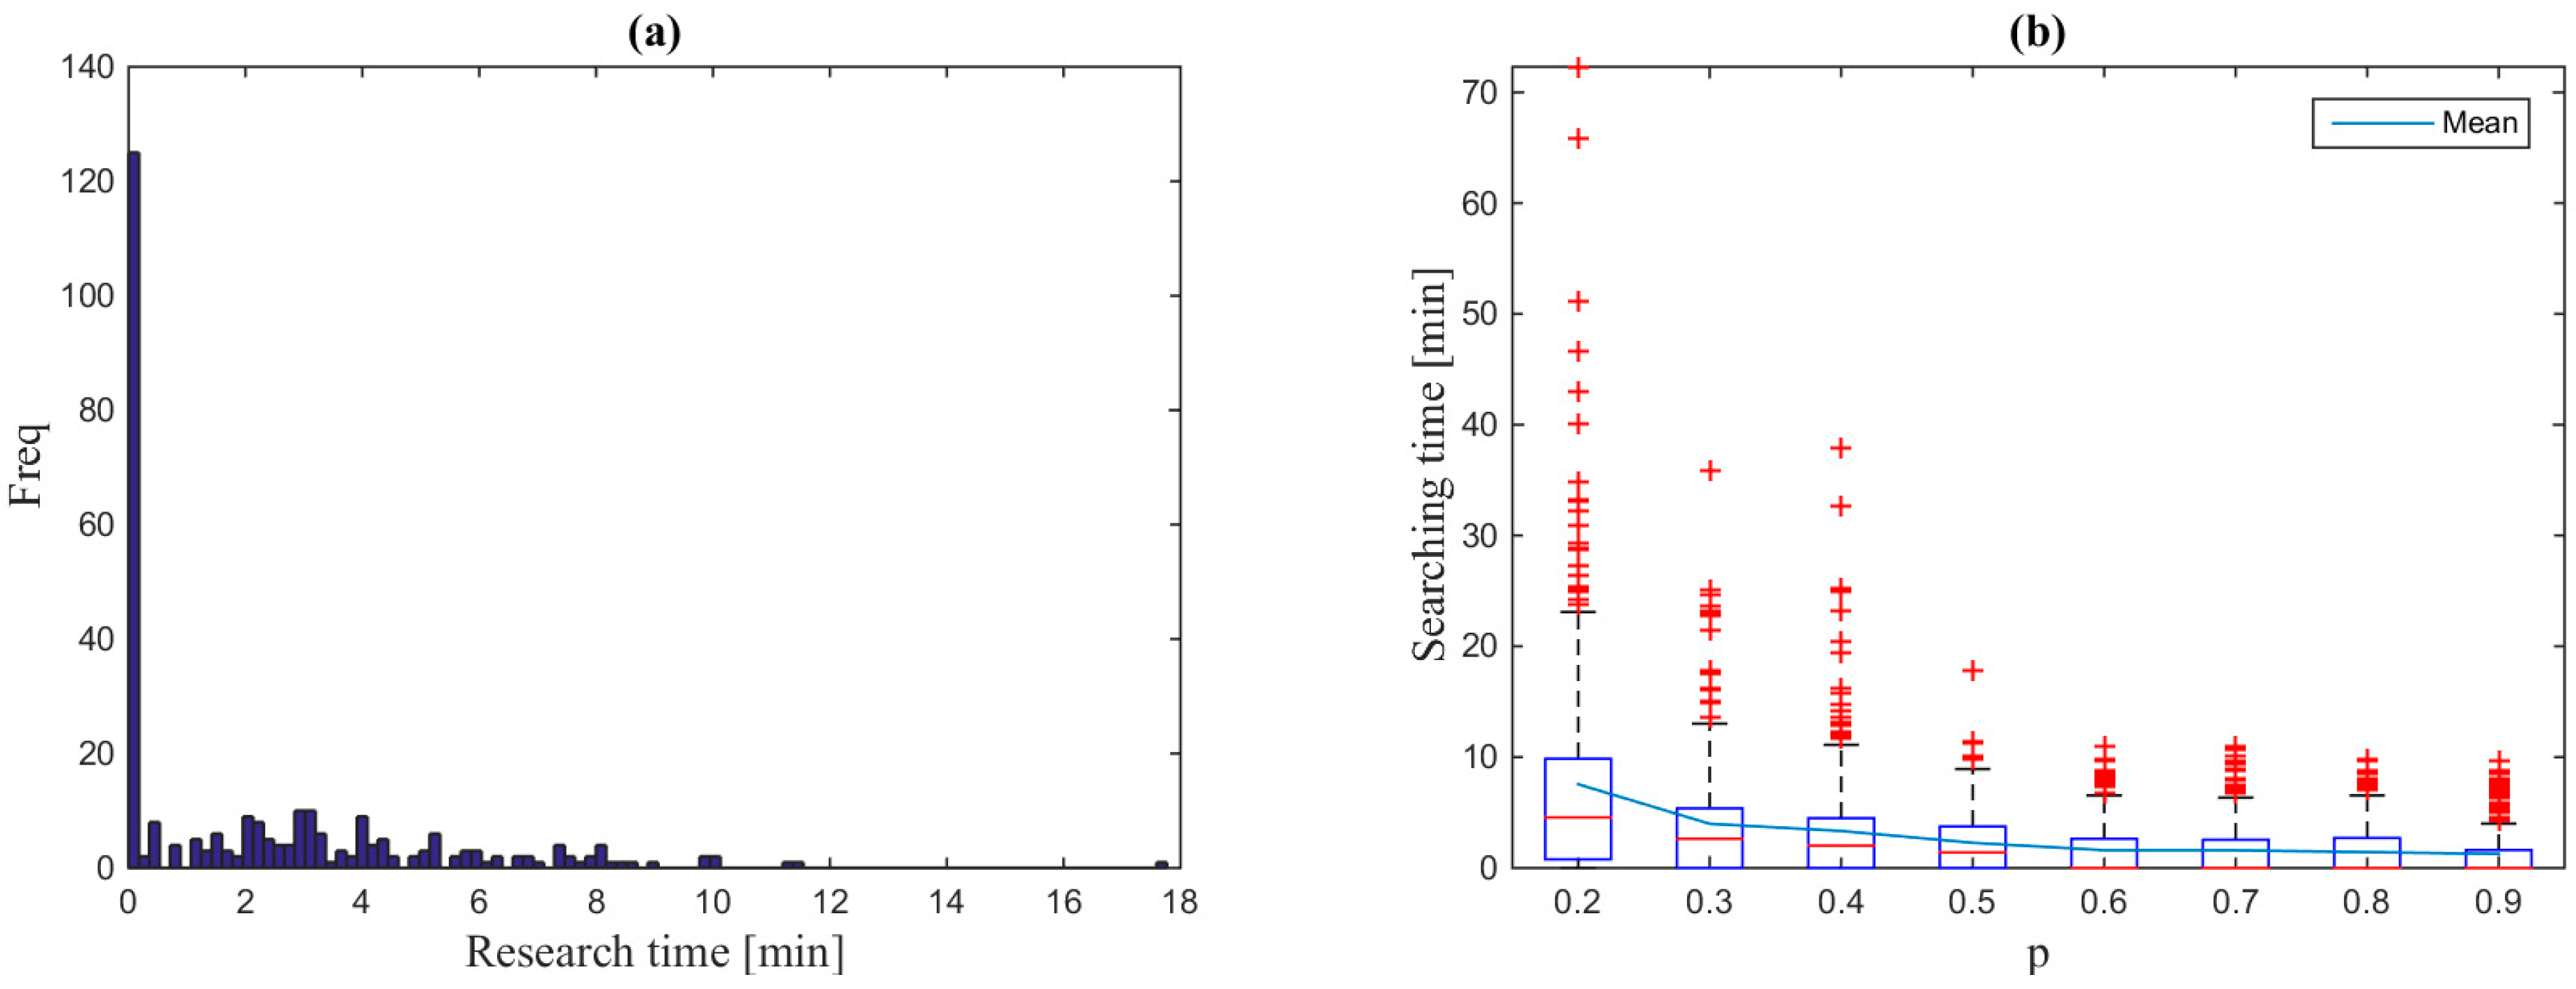
The simulated searching times of the Lyon network was first studied with the same statistical framework as the Manhattan network.
Figure 6-a shows the distribution of the searching time where
p = 0.5.
Figure 6-b shows the boxplot of cruising-for-truck-parking with respect to
p, varying from 0.2 to 0.9 by step of 0.1. Each boxplot corresponds to the distribution of 500 searching time observations. More precisely, for a given
p, 100 microscopic simulations of a delivery route, composed of 5 establishments, are carried out. The blue curve represents the mean searching time with respect to
p. The data suggests similar trends between the Manhattan network study and Lyon network study. However, the scales of these values are different because of the topological differences of the networks.
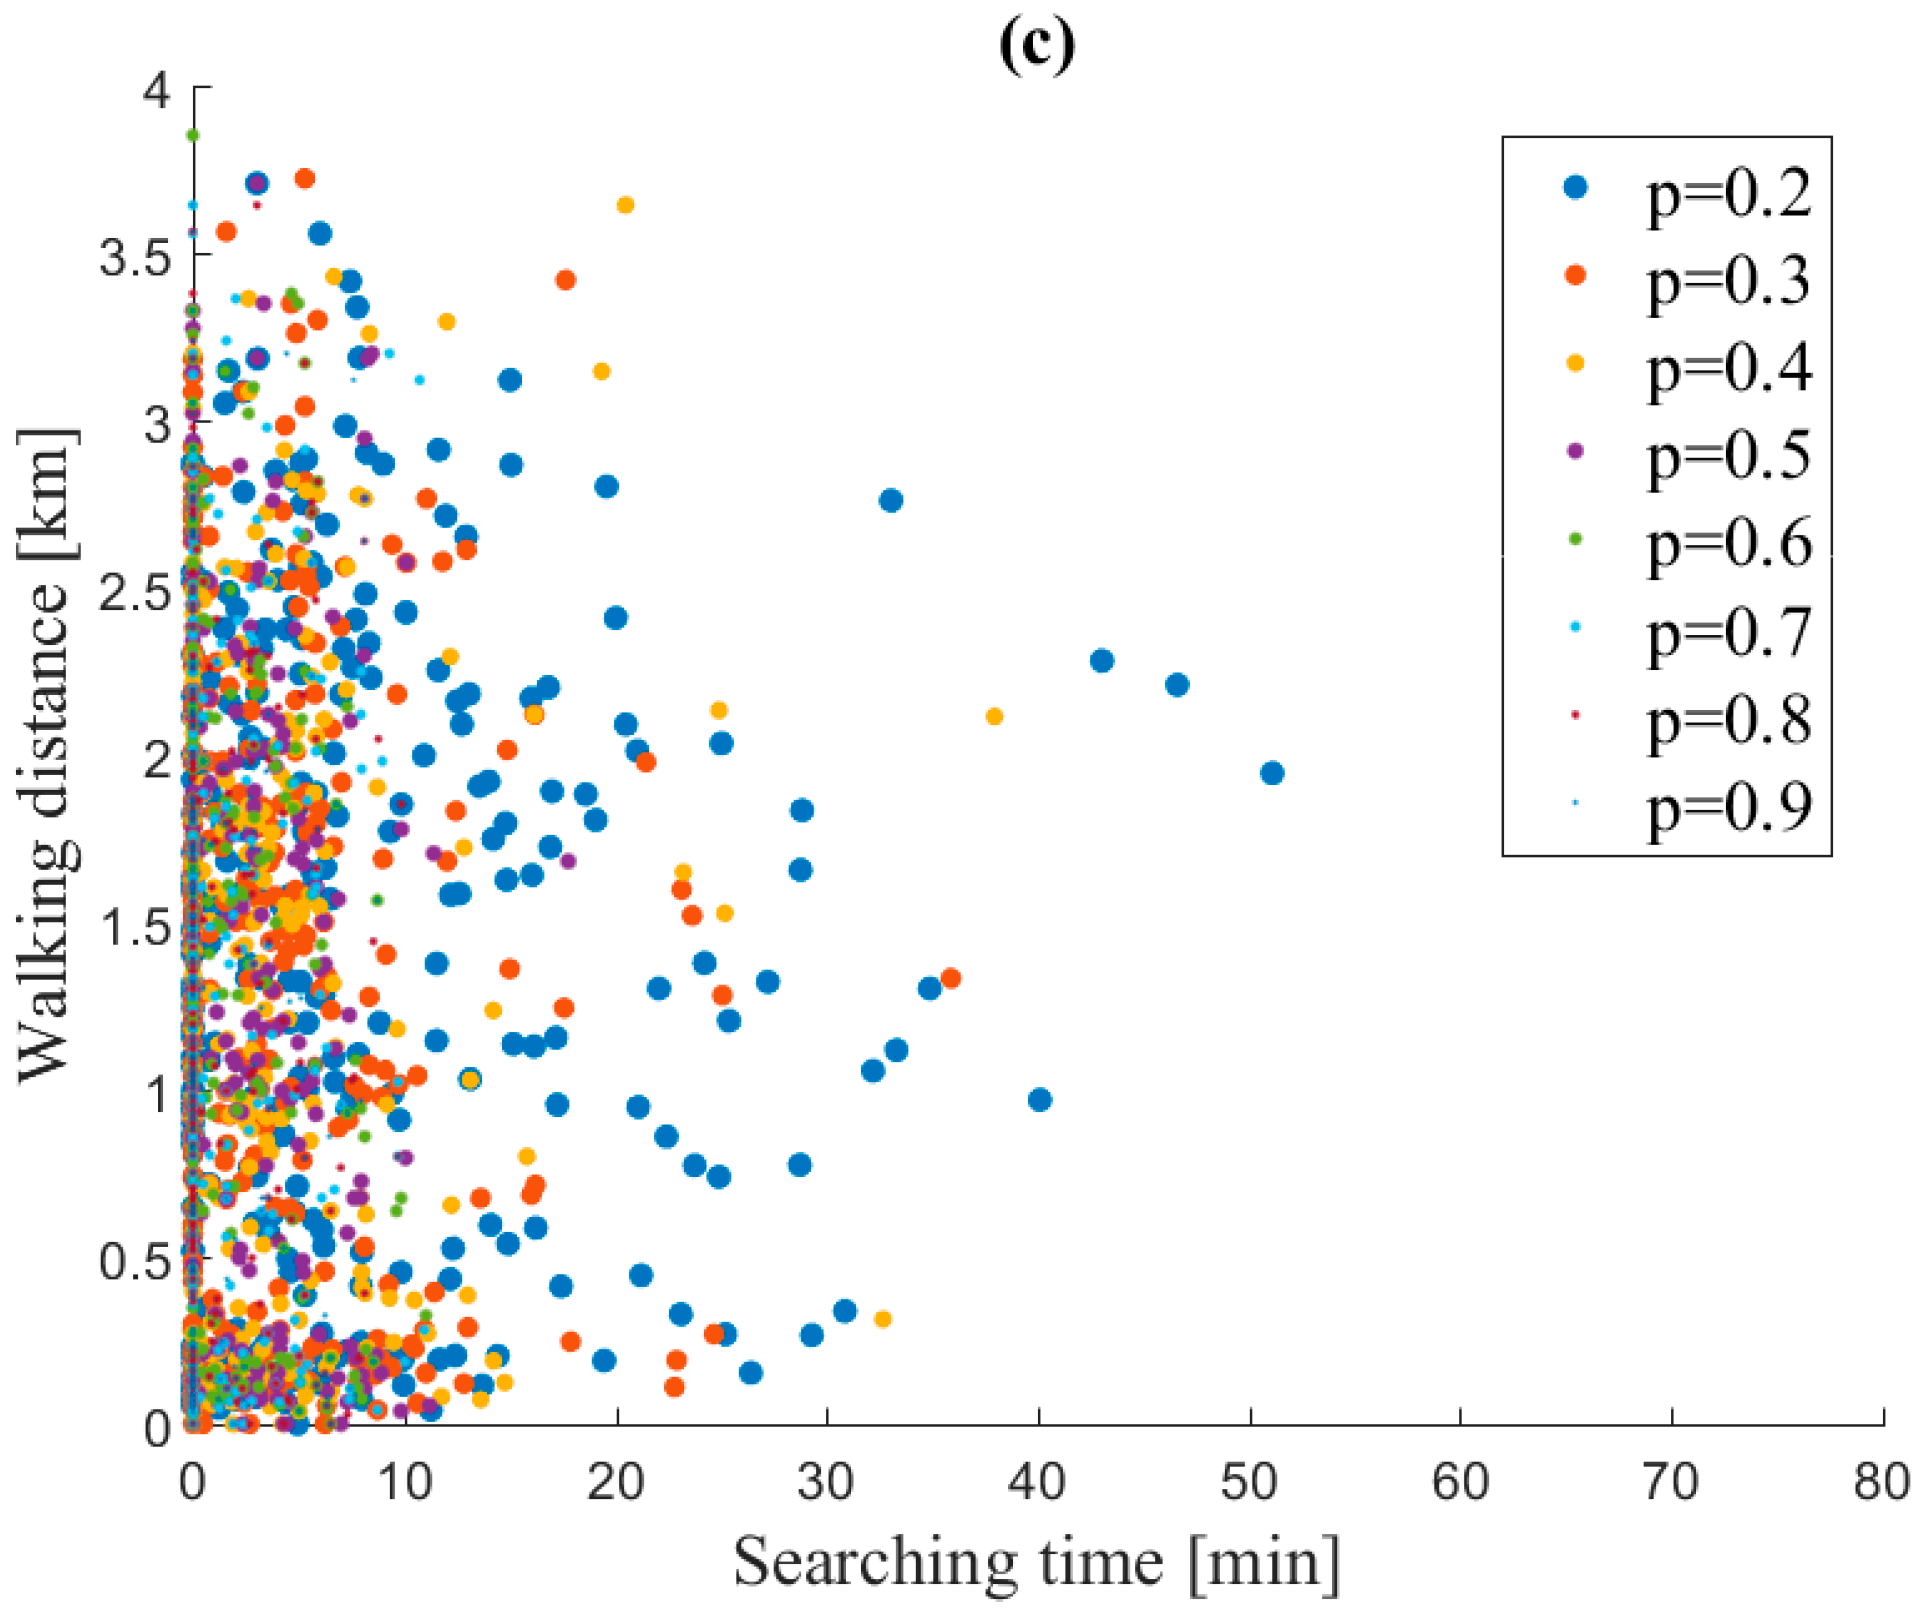
Figure 6-c cross-analyze the simulated cruising-for-truck-parking observations, where the
x and the
y axis correspond to the searching time and the walking distance, respectively. The walking distance is defined by the shortest undirected graph distance from the first nearest available FLZ to the customer location. The size of the data point corresponds to
p, the probability of finding a vacant FLZ. The results demonstrate three regions in
Figure 6-c: (i) the south-west region is characterized by low values of both searching time and walking distance. These observations represent the delivery customer experience, where an FLZ system is well furnished. The searching time is minimized by a high probability to find a vacant FLZ and high density of FLZs in a given zone; (ii) the west region is characterized by a low searching time and a walking distance which can be high. This situation can be considered a perspective for walking distance to be minimized by improving the FLZ configuration (the FLZ number and their locations); (iii) the east region is characterized by high searching time, while the walking distance is variable. This region tends to be characterized by a low
p. Indeed, the
p variable has a predominant influence on the searching time.
5. Application to a Last Mile Cost Function
This section assessed the additional cost of the last mile by considering the searching time. The use of a econometric model, the searching time makes it possible to estimate the retailer’s reactions of imposed FLZ policies. In the literature, numerous studies investigated the value of time (VOT) [
48]. However, few studies have focused on the FLZ availability on the last mile cost function and truck driver behavior [
13]. This section aimed to quantify the cruising-for-truck-parking, using a simplified cost function, relative to a route and service characteristics as shown in
Table 1.
To fulfill the aim, we employed an existing econometric model [
49], based on long-term service cost, which includes vehicle maintenance cost and consumption costs.
Table 1 shows the variables used to formulate the searching time cost function.
The mean searching time was computed by microscopic traffic models corresponding to an additional time of 40 min for a route. The linear cost function model, applied in this study, provided the results of the additional cost of the searching time of 17.2, 103.2 and 412.8 €, corresponding respectively to the temporal scale of the day, the week, and the month.
Moreover, this total searching time for a given delivery driver was compared to a driver who would double-park for each customer. Monthly, on average 16 h could be spent on cruise-for-parking under the aforementioned variables. This additional time can be interpreted as: (i) An additional working time and costs, or, (ii) a decreasing number of customers delivered. Note that the marginal cost of congestion is endogenous of the searching time. The advantage is that traditional information required for congestion pricing, such as the travel demand and the traffic flow derived, are not necessary [
51].
6. Conclusions
This paper proposed the searching time as an indicator to measure the performance of an FLZ system. We assumed the elimination of double-parking by the deployment of the automatized as well as systematic double-parking. This research findings showed how this aggregated measure is influenced by the FLZ offer (the number and the location of FLZ) and the FLZ supply (the probability to find a vacant FLZ as the freight parking demand). In this study, microscopic traffic models were applied to simulate the cruising-for-parking of delivery trucks. The methodology includes the parking choice model and the availability model, which has been studied analytically. This research is, to our best knowledge, the first attempt to study the truck searching time by modeling a two-step commercial vehicle parking model in a microscopic traffic simulation.
Two different typologies of directed networks have been studied: The theoretical yet Manhattan-comparable network and the real network of Lyon (France). First, a spatial analysis was established as the Lyon network has been partition into cells based on real-data of FLZs. Specific indicators were proposed in order to identify region where spatial and temporal FLZ configurations should be enhanced. Second, searching time was measured. The results show a predominant influence of the probability of a vacant FLZ on the cruising-for-parking and its related uncertainty. At least a threshold number of FLZ was suggested in order to access a reasonable mean searching time. Moreover, the probability to find an available FLZ should be increased in order to shorten the mean searching time, e.g., by FLZ policies reinforcement or encouraging turn-over.
The searching time measurement has numerous promising applications. The utilization of an econometric model based on the searching time can help to estimate the retailers’ reactions of imposed FLZ policies. For further work, the influence of traffic state on the searching time should be investigated. Moreover, the impact of cruising-for-parking of trucks on the global performances of the network can be explored, as established for the cruising-for-parking of private cars [
25]. This study proposed a framework for policy makers to properly manage an FLZ system by using STA. Based on that, the evaluation of the STA as a model to predict the mean searching time should be studied, where uncertainty can be included.

 ,
, 


