Article

User Acceptance of Mobile Apps for Restaurants: An Expanded and Extended UTAUT-2

by
Ramon Palau-Saumell
1,*,
Santiago Forgas-Coll
2,
Javier Sánchez-García
3 and
Emilio Robres
1
1
IQS School of Management-Universitat Ramon Llull, Via Augusta, 390, 08017 Barcelona, Catalonia, Spain
2
Department of Business, University of Barcelona, Diagonal, 690, 08034 Barcelona, Catalonia, Spain
3
Department of Business Administration and Marketing, Universitat Jaume I, Campus Riu Sec, 12071 Castelló de la Plana, Spain
*
Author to whom correspondence should be addressed.
Sustainability 2019, 11(4), 1210; https://doi.org/10.3390/su11041210
Submission received: 11 January 2019 / Revised: 7 February 2019 / Accepted: 20 February 2019 / Published: 25 February 2019
(This article belongs to the Special Issue Service Quality in Leisure and Tourism)

Abstract

:
This paper examines the adoption of mobile applications for restaurant searches and/or reservations (MARSR) by users, as part of their experiential quality. Following an extended and expanded version of UTAUT-2, this research proposes eight determinants of intentions to use: performance expectancy, effort expectancy, facilitating conditions, hedonic motivation, price-saving orientation, habit, social influence, and perceived credibility. The data were collected from Spanish users of MARSR applications (n = 1200), and analyzed using structural equation modeling (SEM). The findings confirm the need to extend and expand UTAUT-2 by incorporating perceived credibility and the social norm approach. The results gathered from SEM indicate that the drivers of intentions to use MARSR are, in order of impact: habit, perceived credibility, hedonic motivation, price-saving orientation, effort expectancy, performance expectancy, social influence, and facilitating conditions. Habit, facilitating conditions, and intentions to use are significantly related to use. Additionally, the moderating effects of gender, age, and experience were tested by means of a multi-group analysis. The users’ experience was seen to exert a moderating effect in some of the relationships hypothesized in the model, while gender and age did not play a significant role. The findings have both research and practical implications.

1. Introduction

The use of smartphones continues to grow around the world, and is expected to reach 2.87 billion in 2020, which will represent an increase of 83% since 2014 [1]. Mobile app downloads worldwide are also increasing significantly. Specifically, 178.1 billion apps were downloaded to their connected devices in 2017, and this figure is expected to grow to 258.2 billion app downloads by 2022, which will represent an increase of 45% [2]. One of the many different kinds of apps used are mobile applications for restaurant searches and/or reservations (MARSR). An MARSR app can be defined as a free application that is designed to run on mobile devices, which allows consumers to search for information on, select, and book restaurants, and more specifically, to find the location (53%), browse a menu (49%), investigate new restaurants (37%), and place an order for pick-up or delivery (35%) [3]. MARSR provide users with information on exactly what the carrying capacity of the restaurant is, how soon it is available in real-time, and when there will be tables available, in a similar way to other tourist services [4]. This removes uncertainty about times, and eliminates customer waiting time and overcrowding, which are usually related to environmental damage [5]. This type of app can be understood as a process of the customer service experience [6]; that is, it is part of the tourist experience process when they are consuming restaurant services. This means that this experience is a part of their experiential quality, which is a psychological outcome resulting from the customer’s participation in tourism activities [7]. Furthermore, an understanding the process by which consumers adopt these mobile apps has become a key strategic element for restaurants and app designers. However, the literature explaining the acceptance and the use of information and communication technologies (ICTs) is constantly increasing in size and scope; yet, to date, it has not provided any insight into consumers’ adoption of MARSR.
The adoption of ICTs has been analyzed using different theoretical models, such as the Technology Acceptance Model (TAM) [8,9,10], the Prospect Theory [11], the Task-Technology Fit (TTF) [12], the Motivational and Self-Determination Theory [13], the Social Cognitive Theory (SCT) [14], the Technology-Organization-Environment Framework (TOE) [15], or the Unified Theory of Acceptance and Use of Technology (UTAUT) [16,17,18]. The last of these theories, UTAUT, has been considered as a more integrative theory than TAM and other previous models and technology adoption theories, because it has greater predictive capacity [19]. Accordingly, in recent years, much research has been focused on measuring UTAUT-1 [20] and UTAUT-2 [21] in a wide range of mobile and digital areas, such as mobile payment, mobile banking, mobile Internet, online purchases of tickets from low-cost carriers, online purchase intention, smartphone use, and mobile TV [22,23,24,25,26,27,28,29].
However, and with regard to mobile applications, previous research has used several theories to investigate mobile apps in different tourism and hospitality services, such as hotel booking [11], based on Prospect Theory; hotel information, using TAM [8]; catering services, through the Electronic Commerce Systems Success Model [30]; and ridesharing, using SCT [14]. Other studies have used UTAUT as a research model in areas such as mobile payments in hotels [28], travel and tour guides [17], and diet restaurants [19]. Hence, more research is needed, because relatively few studies have investigated mobile app adoption in the context of restaurant search and/or reservation (MARSR).
UTAUT-2 is the theoretical framework used in this research, and it includes the explanatory variables that explain the intentions to use MARSR, such as performance expectancy, effort expectancy, facilitating conditions, hedonic motivation, habit and social influence, and also the positive influences of facilitating conditions, habits, and intention to use, on actual use. It also consists of three moderating variables—gender, age, and experience. Nonetheless, UTAUT-2 cannot fully explain the user acceptance of MARSR without introducing certain modifications, such as new dimensions and constructs that better reflect the behaviors of MARSR users. These modifications include some adaptations of the original model: (i) the need to redesign the original factor price value as price-saving orientation because the use of MARSR does not represent any monetary cost for the consumer, but their use offers significant monetary savings and perceived benefits, as indicated by prior literature in other technological contexts [16]; (ii) the need to expand the original factor social influence, since it was only conceptualized as the subjective norm in the original UTAUT-2 model, and some authors have incorporated other dimensions to better measure its social influence in technology adoption models [31]; (iii) the need to extend the original UTAUT-2 model with one additional factor, perceived credibility, basically because the literature has identified users’ concerns for security and privacy in the adoption of new technologies [32]; however, the original UTAUT-2 model does not include these concepts, although other authors have incorporated privacy and security, as dimensions of perceived credibility, into adaptations of the previous model, UTAUT-1, mainly in mobile banking [24]. Furthermore, very little research using UTAUT has examined the moderating effects of gender, age, and experience of the original UTAUT-2, and if it has done so, it is only in a partial sense, such as by gender [33], or gender and age [24,34,35]. Basically, most studies have been limited to testing the direct effects [36], so the users could have changed their beliefs in relation to the ITC.
Consequently, the questions that will be investigated are the following:
1. What drivers allow users to have intentions to use and use MARSR, and what is their level of importance?
2. Are there any significant differences in terms of gender, age, and experience that influence those drivers?
Taking these criteria into account, this research aims to gain a better understanding of the acceptance of MARSR by pursuing the following objectives: (1) To extend and expand the UTAUT-2 model by including price-saving orientation instead of price value, which is used in the original model, as well as the new dimensions of social influence, and the perceived credibility factor; (2) To test the conceptual model with a sample of Spanish users of MARSR; and (3) To investigate the moderating effects of gender, age, and experience.
The remainder of this paper is structured as follows. Section 2 reviews the related literature on UTAUT and some related concepts, and develops the research model and hypotheses. Section 3 presents the research methodology, while the results are described and reported in Section 4. Section 5 discusses the findings, with theoretical implications and conclusions, and the last section, Section 6, concludes the study with practical implications, limitations, and future research.

2. Literature Review and Hypotheses Development

2.1. The Unified Theory of Acceptance and Use of Technology

UTAUT-1 [20] is a synthesis of several theories and models; namely, the Theory of Reasoned Action (TRA) [37], TAM [38], the Motivational Model [39], TPB [40], the Decomposed Theory of Planned Behavior [41], the Model of PC Utilization [42], Innovation Diffusion Theory [43], and Social Cognitive Theory [44]. UTAUT-1 aims to explain the adoption of ICTs through four key constructs: performance expectancy, effort expectancy, social influence, and facilitating conditions. The first three of these constructs influence intentions to use, and the last one affects technology use [20]. Additionally, these relationships are moderated by gender, age, experience, and voluntariness of use. It has been applied in a wide variety of contexts, such as the acceptance of Internet banking technology by employees, social network sites by students, the use of rural tourism websites, and tour guide apps [17,23,45,46]. UTAUT-2, an extended version of UTAUT-1, was formulated in order to better adapt it to the consumer use framework [21], and it introduces three new variables: hedonic motivation, price value, and habit. While hedonic motivation and price value are solely related to intentions to use, habit is related to both intentions to use and actual usage. Moreover, UTAUT-2 includes a new relationship between the facilitating conditions and the intention to use. Since consumption in the consumer environment is always voluntary, UTAUT-2 eliminates voluntariness of use as a moderating variable. Instead, it introduces experience as a moderator in the relationship between intentions to use and usage. UTAUT-2 concludes that performance expectancy, effort expectancy, social influence, hedonic motivation, price value, and habit all influence the intention to use a technology, while intentions to use, facilitating conditions, and habit are significantly related to actual usage (Figure 1).

2.2. Research Model

UTAUT-2 identifies seven antecedents of consumer intentions to use mobile applications, and three antecedents of acceptance and use of technology. The first seven are performance expectancy, effort expectancy, social influence, facilitating conditions, hedonic motivation, price value, and habit. The three antecedents of use are intention to use, facilitating conditions, and habit [21]. Figure 2 depicts the proposed research model, which extends UTAUT-2 by introducing the construct of perceived credibility, redesigns the original factor, price value, as price-saving orientation, and expands the social influence construct. The definitions of the constructs, together with the theoretical basis and the hypotheses, are explained in the following sections.

2.3. Hypotheses Development

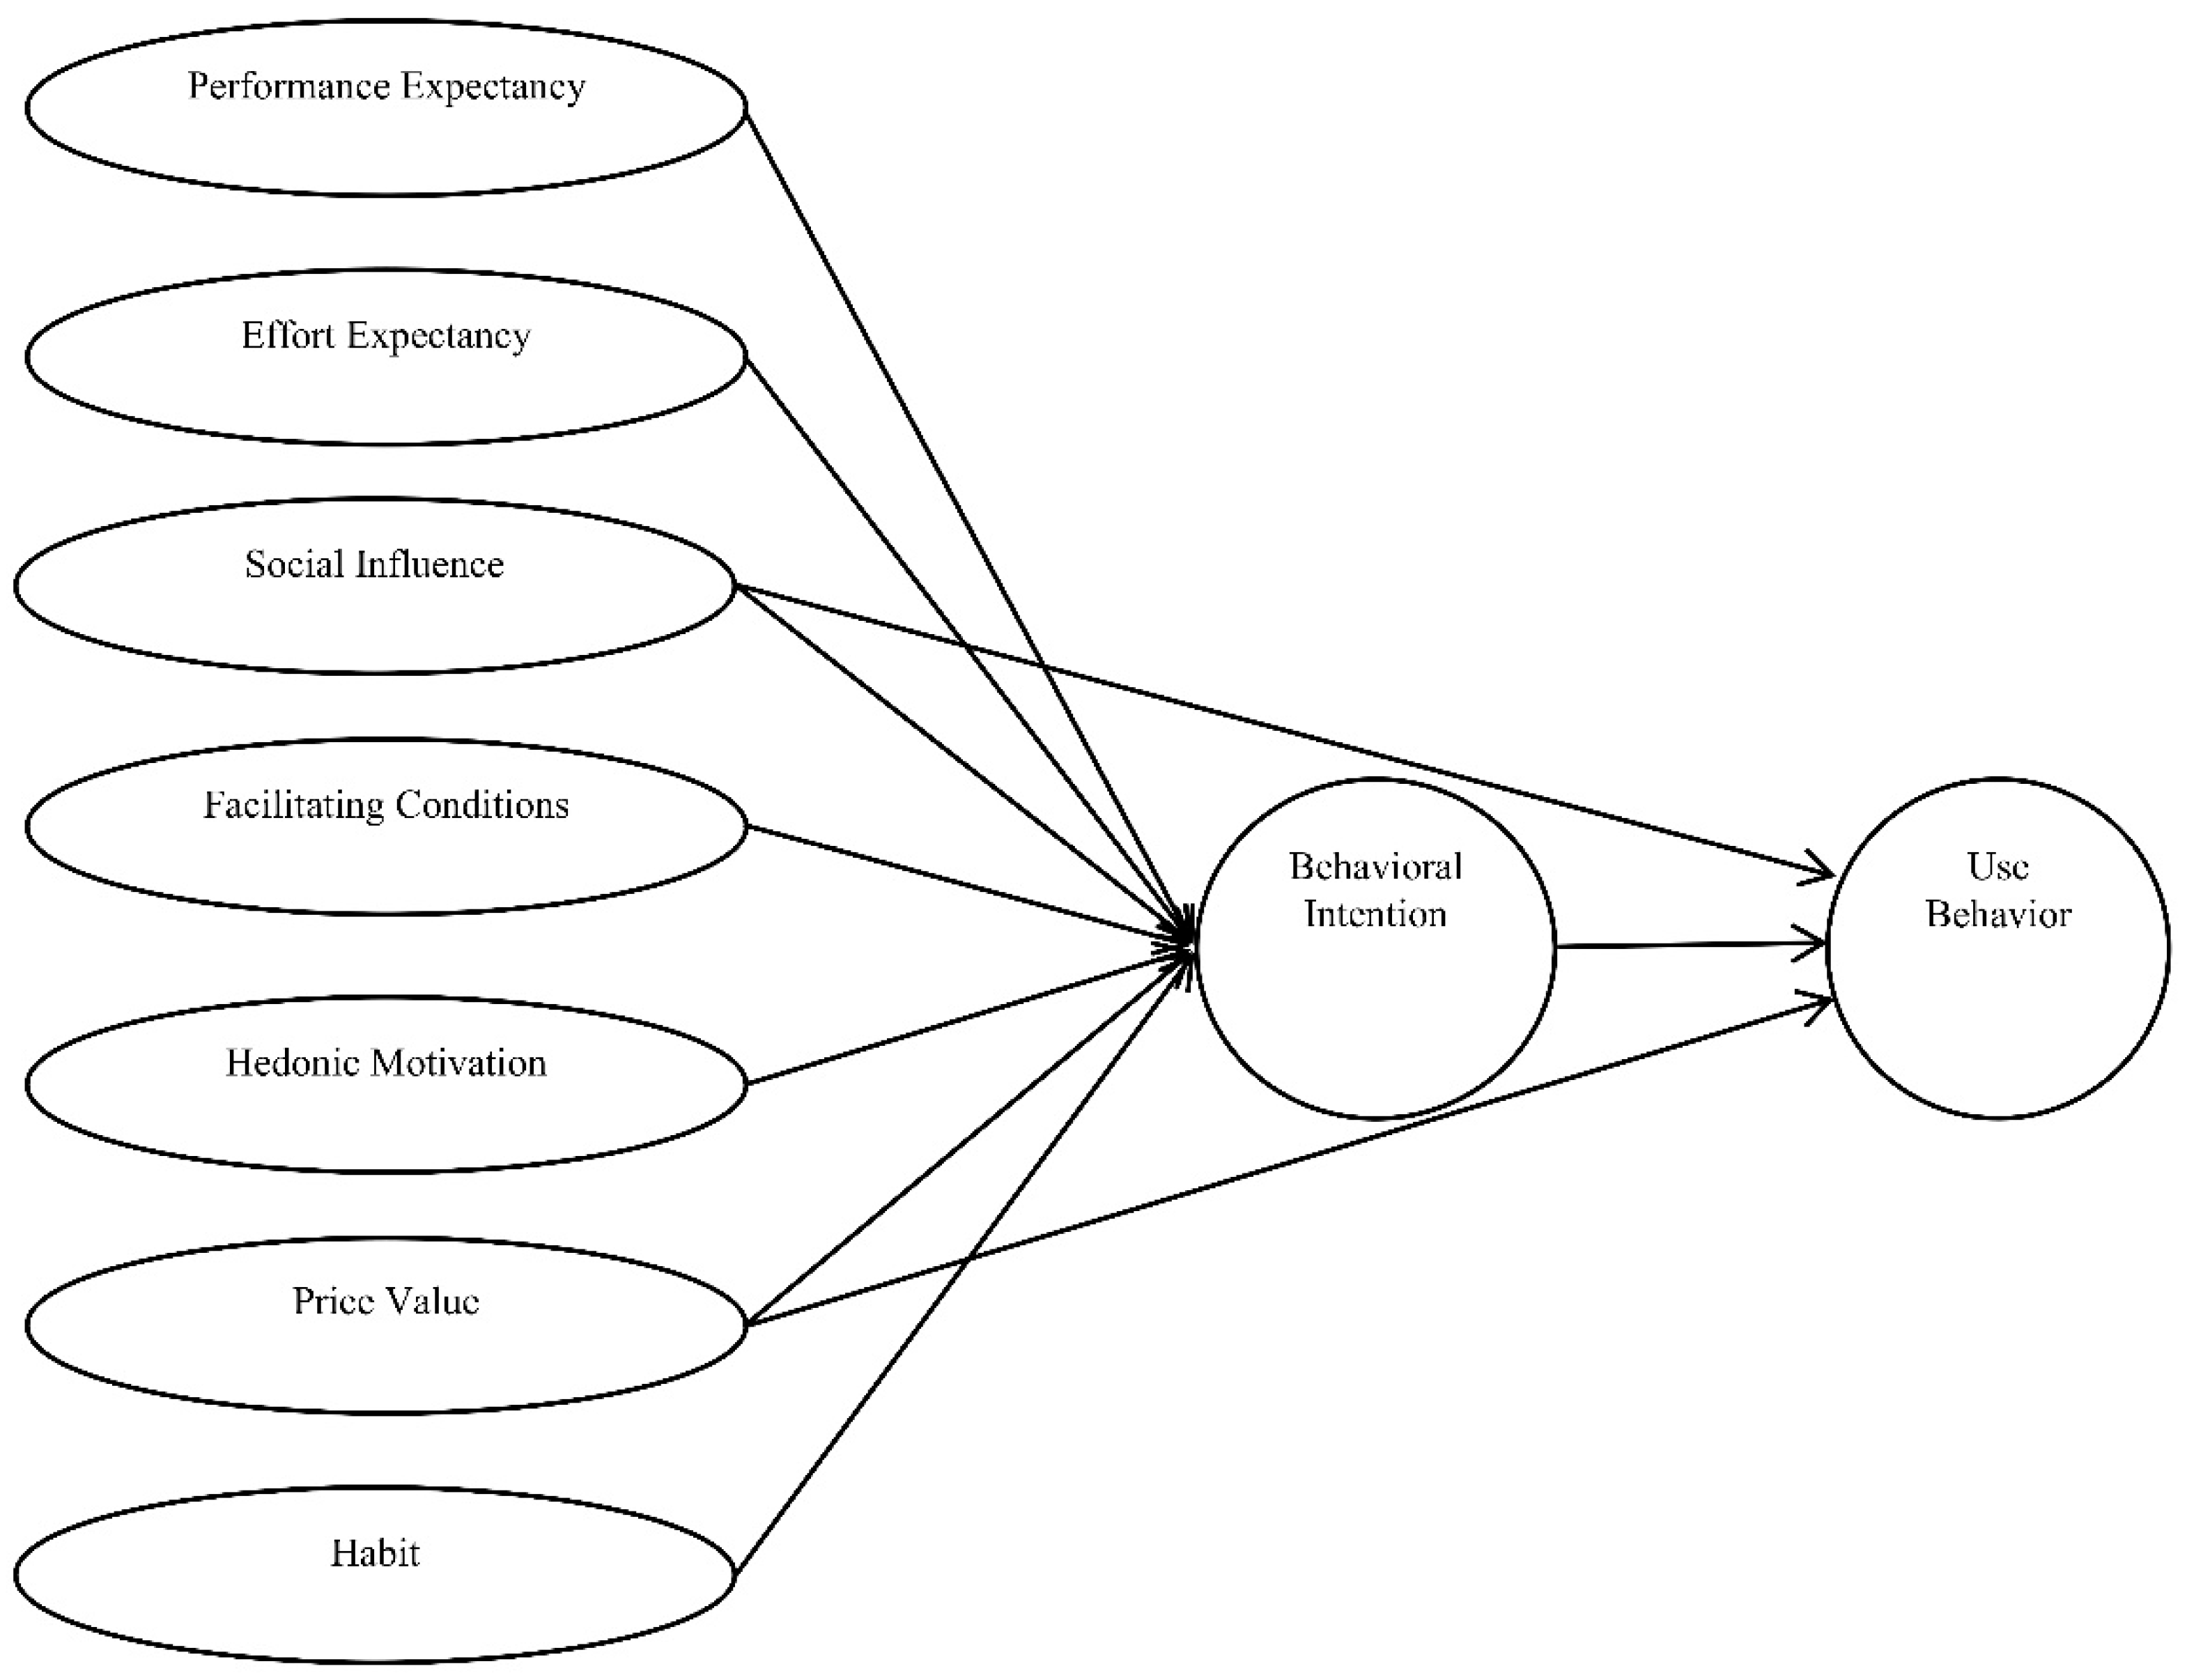
UTAUT-2 identifies three antecedents of consumer acceptance and use of technology: (1) intention to use, which captures the consumer’s main motivations to use the technology; (2) facilitating conditions; and (3) habit, where the other two antecedents have a direct influence on technology use. This conceptualization of the intention to use is consistent with social psychology theories, such as TRA [37] and TPB [40]. According to Fishbein and Ajzen [37] and Ajzen [40], intention describes the motivational factors that influence whether or not an individual will perform a given action in a particular situation. Fishbein and Ajzen [37] verified the relation between intentions to use and use in social psychology, based on TRA, stating that the intention of carrying out a behavior is the greatest predictor of the performance of such conduct. Abroud et al. [47] found that intentions to use had a direct positive impact on the use of Internet stock trading systems, according to the TAM. Authors such as Venkatesh et al. [20], Im et al. [45], and Yu [24] supported the idea that the intention to use has a direct positive influence on technology usage. Accordingly, this research hypothesizes the following:
Hypothesis 1 (H1).
Intention to use directly and positively affects the individual use of MARSR.
Venkatesh et al. [20] defined performance expectancy as the degree to which using a technology will provide consumers with benefits when performing certain activities. Performance expectancy is very similar to the perceived usefulness variable within TAM, which has become the most commonly used instrument for predicting technology usage, because it is robust, powerful, and parsimonious [48].
The performance expectancy construct is considered to be one of the core predictors of the intention to adopt a technology [20,49]. Previous research has tested this relationship, and has obtained positive results in the mobile payment context [27], app-based tour guides [17], and diet food apps [19]. However, there is no evidence of this relationship in the context of MARSR. Since MARSR enable consumers to find a desired or convenient restaurant more quickly and/or efficiently, such expectations can influence the intentions to use. Therefore, it is proposed that:
Hypothesis 2 (H2).
Performance expectancy directly and positively affects the intention to use MARSR.
Effort expectancy is the degree of ease that is associated with consumers’ use of technology [20]. There is a substantial similarity between effort expectancy in UTAUT-2, and the perceived ease-of-use in TAM. Previous empirical studies on mobile app adoption have supported the idea that effort expectancy influences intentions to use [17,19,24], but not in the MARSR environment. Since MARSR are easy to use, understandable, and easy to interact with, minor efforts that are made by consumers in their restaurant searches and/or reservations via MARSR will affect consumers’ intentions to use. Thus, the following hypothesis is proposed:
Hypothesis 3 (H3).
Effort expectancy positively and directly affects the intention to use MARSR.
Facilitating conditions refer to consumers’ perceptions of the resources and the support that are available to perform a behavior. UTAUT identifies the facilitating conditions as a construct that reflects a person’s perception of their control over their behavior [50]. This definition captures the external facets of the concept represented by TPB, as proposed by Ajzen [40], in the form of the perceived behavioral control constructs. Venkatesh et al. [21] added a direct relationship between the facilitating conditions and the intentions to use in UTAUT-2, and Lai [17] confirmed this relationship among users of app-based mobile tour guides. Yet, these relationships have not been found in other studies, such as San Martin and Herrero [23], among users of rural online purchase systems, and from Okumus et al. [19], among users of diet food apps. However, in accordance with Gallivan et al. [51] and Venkatesh et al. [50], appropriate facilitating conditions are essential for the acceptance of ICTs. In the literature on mobile banking adoption, Joshua and Koshy [52] showed that easier access to computers and the Internet results in a higher adoption rate. Hence, higher facilitating conditions are expected to lead to higher intention to use, and a higher rate of use of MARSR. Based on the above discussions, and the paucity of evidence on mobile applications, the following hypotheses are proposed:
Hypothesis 4 (H4).
Facilitating conditions directly and positively affect the use of MARSR.
Hypothesis 5 (H5).
Facilitating conditions directly and positively affect the intention to use MARSR.
Brown and Venkatesh [53] defined hedonic motivation as the fun or enjoyment that is derived from using a technology, and this construct has been shown to play a substantial role in determining technology acceptance and use [21,54]. Previous studies have subsequently proposed and tested the positive influence of perceived enjoyment on mobile internet adoption [55] and mobile banking use [56]. The positive influence of hedonic motivation on behavioral intentions has been tested by Venkatesh et al. [21] in the mobile context, although other authors found it to be weak among users of online services for purchasing tickets for low-cost carriers [16]. To test this relationship within the context of MARSR, the following hypothesis is proposed:
Hypothesis 6 (H6).
Hedonic motivation directly and positively affects the intentions to use MARSR.
The price value construct for a technology whose use carries a monetary cost for the consumer was incorporated within UTAUT-2 by Venkatesh et al. [21]. Price value refers to the consumer’s cognitive tradeoff between the perceived benefits, and their monetary cost [57]. However, this variable is not applicable in the model when an app, such as MARSR, is free of charge. In fact, other studies have found that consumers who purchase products and services through websites can reduce prices and save time [58], or can carry out comparisons of product prices [59]. Both can be associated with price saving. In this research, the price-saving orientation refers to the economic benefits that are obtained by technology users; that is to say, the use of technologies allows consumers to acquire a product or service at a lower price [16,60]. Accordingly, in previous research on UTAUT-2, the price value construct has been replaced by the price-saving orientation [16], and these authors found a positive relationship with intentions to use. Thus, in MARSR, information about prices and their comparison will allow for a price saving. Based on this theoretical review, the following hypothesis is proposed:
Hypothesis 7 (H7).
Price-saving orientation directly and positively affects the intentions to use MARSR.
Habit is defined as the degree to which people tend to perform behaviors that are automatic, based on learning [61]. It refers to a self-reported perception of a repeated behavioral pattern that occurs automatically outside of conscious awareness [62]. Venkatesh et al. [21] found two significant relationships: habit–intentions to use and habit–use. These relationships were confirmed by Escobar-Rodríguez and Carvajal-Trujillo [16] in a study on low-cost carriers’ websites. Therefore, habit is expected to influence both the intentions to use and the actual usage of MARSR. Accordingly, this study posits the following hypotheses:
Hypothesis 8 (H8).
Habit directly and positively affects the intentions to use MARSR.
Hypothesis 9 (H9).
Habit directly and positively affects the use of MARSR.

2.4. The Expanded and Extended UTAUT-2

One of Venkatesh et al.’s [21] proposals was for future research to identify factors that allow for the application of UTAUT to different technologies and use contexts, especially within the consumer behavior field. In this paper, the original UTAUT-2 has been expanded and extended by developing a new operationalization of the social influence factor, the substitution of the price value factor by price-saving orientation, and incorporating a new factor, perceived credibility.
Some studies on mobile marketing have identified the effect of social influence on intention to use, by the means of the subjective norm of TPB [21,24,27]. Nevertheless, there is still a need for more in-depth research on the construct’s operationalization. Therefore, to expand the social influence construct, this study investigates the effect that is produced by perceived norms on consumers’ intention to use MARSR, according to the social norms approach (SNA) [63,64].
Social influence, in the context of technology, is defined as the extent to which consumers perceive that important others believe that they should use a particular technology [21]. However, social influence is not a simple and unified concept [65,66], and it needs to be studied more thoroughly. Deutsch and Gerard [65] studied social influence from the informational and normative perspectives. Kelman [66] considered three different processes in social influence: conformity, internalization, and identification. Williams [67] defined social norms as rules for conduct. The social norms approach (SNA) [63,64], which is the theoretical approach that will be used in this research, posits that the relevant norms can be categorized as being descriptive and injunctive [68,69]. Descriptive norms refer to the popularity of a norm or behavior [70], while injunctive norms apply to social approval or the denial of a norm or act [71]. Moreover, according to Smith and Park [72], these norms exist at both the personal and the societal level. The personal level refers to significant norms among people who are relevant to the individual, whereas the societal level refers to beliefs that are based on legal, cultural, and religious norms.
In a study on mobile advertising, Soroa-Koury and Yang [73] found evidence to support the relationship between social influence and intentions to use, through the social norms theory. Given SNA’s theoretical basis and prior research, the following hypothesis is proposed:
Hypothesis 10 (H10).
Social influence directly and positively affects the intentions to use MARSR.
Perceived credibility in the mobile context is defined as the extent to which an individual believes that the use of mobile technology will not entail any security or privacy threats [49,74,75]. In fact, it is well known that consumers are concerned about security, privacy, and transaction risks in the mobile context [76], and that overcoming these issues is essential for the adoption of applications in the mobile ecosystem [77]. Thus, identifying the influence of perceived credibility on the intentions to use MARSR is relevant.
In the mobile environment, perceived credibility has been measured with two dimensions: security and confidentiality/privacy [78]. Additionally, in the context of MARSR, the user does not complete a sale, but only undertakes a search or booking. Therefore, the trustee’s characteristics of benevolence and integrity, as identified by Mayer et al. [79], and which act as trust generators in the offline context, are not relevant in the mobile environment. In the MARSR framework, only the competence of the application’s managers [79], which can be understood as security and privacy, is significant. Although perceived credibility has already been analyzed in the mobile banking context [24], it has not been tested with respect to MARSR users, and it does not appear among the UTAUT-2 variables. Thus, this study includes perceived credibility, in order to better explain the intentions to use MARSR, as sustained by the direct positive relationship identified by Yu [24] using UTAUT-1 in a sample of mobile banking users in Taiwan. However, perceived credibility has not been tested in UTAUT-2. Therefore, the following hypothesis is proposed:
Hypothesis 11 (H11).
Perceived credibility directly and positively affects the intentions to use MARSR.
Previous research has suggested that age and gender are critical demographic variables that moderate the relationships between consumers’ perceptions of technology, and their behavioral intentions [20,80]. In addition to age and gender, in the ITC context, user experience has been considered as one of the main factors explaining an individual’s behavior, because users gain experience in using ITC as they utilize them over time [81]. Experience is defined in terms of the time elapsed since the initial use of a technology by an individual, and it is usually operationalized by levels, based on the passage of time [21].
The moderating effects of gender, age, and experience were analyzed in UTAUT-1 and 2 between the independent variables and the dependent variable and behavioral intentions [20,21]. In the first model, Venkatesh et al. [20] analyzed the moderating effects of gender, age, and experience (understood as the time elapsed since the initial use of MASRS apps) between the independent variables (performance expectancy, effort expectancy, social influence, and facilitating conditions) and the dependent variable (behavioral intentions), and also between facilitating conditions and technology use in a sample of individuals that had been introduced to a new technology in the workplace. They found that the effect between the performance expectancy and behavioral intentions was stronger for younger men, while the effect was stronger for older women with limited experience in the relationships between effort expectancy and social influence toward behavioral intentions. Additionally, they found that the effect was more significant for older workers with increasing experience in the relationship between facilitating conditions and technology use. A few years later, Venkatesh et al. (2012) [21] analyzed the moderating effects of the new relationships added to the new UTAUT-2, in a sample of internet mobile users. They found that gender and age moderate the relationships between facilitating conditions and behavioral intentions, and between price value and behavioral intentions. Specifically, they observed that older women exercised a greater influence in both relationships. In addition, they found that gender, age, and experience moderate the relationship between hedonic motivation and behavioral intentions, and between habit and behavioral intentions. Specifically, they found that young men in the early stages of experience exercised the greatest influence of hedonic motivation toward behavioral intentions, while older men in the later stages of experience exercised the greatest influence of habit toward behavioral intentions, and of habit toward technology use. Some of these moderating effects were also found by Yu [24]. This author identified that the effect of performance expectancy on behavioral intentions and facilitating conditions for use is higher in men than in women. In addition, they observed that the direct effect of the facilitating conditions for the use of mobile banking was higher among users aged below 30 or over 50, compared to other age groups, but no moderating effects were identified in other relationships within the model. Conversely, other authors have investigated the moderating effects of gender and age using UTAUT models, and they have not found any significant results among social media users [35] or mobile banking users [34].
Given that the above findings are inconsistent, it is necessary to ascertain the moderating effects of gender and age, and taking into account the scarcity of testing conducted on the effect of experience, the hypotheses of the moderating effects of UTAUT-2 must be reformulated. Bearing in mind the discussion above, the following hypotheses were proposed:
Hypothesis 12 (H12).
Age and gender will moderate the effect of performance expectancy on intentions to use MARSR, so that the effect is stronger among younger men.
Hypothesis 13 (H13).
Age, gender, and experience will moderate the effect of effort expectancy on intentions to use MARSR, so that the effect is stronger among older women with limited experience in using mobile applications.
Hypothesis 14 (H14).
Age, gender, and experience will moderate the effect of social influence on intentions to use MARSR, so that the effect is stronger among older women with less experience in using mobile applications.
Hypothesis 15a (H15a).
Age and gender will moderate the effect of facilitating conditions on intentions to use MARSR so that the effect is stronger among older women.
Hypothesis 15b (H15b).
Age, gender, and experience will moderate the effect of facilitating conditions on the use of MARSR, so that the effect is stronger among older men with more experience in using mobile applications.
Hypothesis 16 (H16).
Age, gender, and experience will moderate the effect of hedonic motivation on intentions to use MARSR so that the effect is stronger among younger men with less experience using mobile applications.
Hypothesis 17 (H17).
Age and gender will moderate the effect of price-saving orientation on intentions to use MARSR, so that the effect is stronger among older women.
Hypothesis 18a (H18a).
Age, gender, and experience will moderate the effect of habit on intentions to use MARSR, so that the effect is stronger among older men with experience in using mobile applications.
Hypothesis 18b (H18b).
Age, gender, and experience will moderate the effect of habit on the use of MARSR, so that the effect is stronger among older men with experience in using mobile applications.
Hypothesis 19 (H19).
Experience will moderate the effect of intentions to use MARSR on the use of MARSR, so that the effect is stronger among users with less experience in using mobile applications.
The additional factor, perceived credibility (security and privacy), that extends UTAUT-2 in this research, will be submitted to the same moderating effects as the rest of the constructs, based on the following arguments: i) previous research has highlighted the gender perspectives regarding confidence in technology, and, basically, the lower degree of confidence in technology activities identified in females [82]. Compared to males, females have consistently higher levels of concerns about security [83], and privacy-related and security-related policies are crucial for engaging females in the online market [84] and, in particular, in mobile platforms [85]. In addition, most young people are digital natives, who see technologies as part of their daily routine. They can thus be regarded as being pre-adopters of new technologies, since they are more familiar with the new innovations [86]. Accordingly, older females with less experience in using mobile applications will have more influence in the relationships between perceived credibility and intentions to use MARSR. Therefore, the following hypothesis is proposed:
Hypothesis 20 (H20).
Age, gender, and experience will moderate the effect of perceived credibility on the intentions of use of MARSR, so that the effect is stronger among older women with less experience in using mobile applications.

3. Methodology

3.1. Instrument Development

A questionnaire was designed, with items adapted from a prior literature review. The questionnaire was organized into two sections. The first section included six questions on the respondents’ demographic characteristics, such as age, gender, occupation, and nationality. The second section contained 42 questions on the major constructs included in the proposed model. The original items from Venkatesh et al. [21] were modified and adapted to the mobile application framework to develop scales for use, intention to use, performance expectancy, effort expectancy, facilitating conditions, hedonic motivations, and habit. Three items were used to measure price-saving orientation, based on the work of Escobar-Rodríguez and Carvajal-Trujillo [16]. A four-item perceived credibility scale was taken from Yu [24]. Finally, four dimensions for the measurement of social influence were used: personal descriptive norms, societal descriptive norms, personal injunctive norms, and societal injunctive norms. Three items in each were used to measure personal descriptive norms, societal descriptive norms, personal injunctive norms, and societal injunctive norms, adapted from Smith and Park [72]. Additionally, experience was measured as the number of years of mobile applications usage.
The final version of the questionnaire was pretested on 10 digital marketing professionals with experience in the development and promotion of mobile applications. Their feedback helped us to improve the clarity of the questionnaire, and to ensure good communication with the respondents. Questions in the second section were measured using a five-point Likert scale ranging from “strongly disagree” (1) to “strongly agree” (5).

3.2. Data Collection

The sample was built using a non-probabilistic sampling method with proportional gender and age quotas from the population, and comprised Spanish residents who owned a smartphone and who used MASRS. The size of the quotas required to reach the most representative sample of the different proportions of the population was fixed. With a view to meeting the objectives of the predefined quotas, a non-random method of selecting the respondents was chosen. In order to collect the data, an online survey was conducted using Netquest.com [87], which is a professional research market agency that has the largest mobile panel in Spain. A sample of 1,200 individuals was obtained. Males and females each accounted for 50%, while 15% were aged 18–24; 21% were between 25 and 34 years old; 27% were aged between 35 and 44; 24% were 45–54 years old; and 13% were aged 55 or older. The majority of respondents had a university degree (59%) or high school diploma (37%). In terms of occupation, most of them were employed (62%), followed by students (11%), unemployed (9%), retired (7%), and self-employed (6%).

3.3. Method of Analysis

To test the conceptual model, the authors employed latent variable structural equation modeling (SEM). The model was estimated from the matrices of variances and covariances, using the maximum likelihood estimation procedure, with EQS 6.1 statistical software [88]. A study of the dimensionality, reliability and the validity of the social influence scale was carried out, to ensure that the measured construct was the intended one. This analysis allowed the social influence scale to be refined. Thus, non-significant items were eliminated, leaving a total of 12 items. The social influence items that shared the same dimensions were averaged to form composite measures [89]. Composite measures are combinations of items that are used to create score aggregates, which are then subjected to confirmatory factor analysis (CFA), together with the rest of the scales taken into account in the proposed model, in order to validate them. In a CFA, composite measures are useful for two reasons. First, they make it possible to better meet the normal-distribution assumption of maximum likelihood estimation. Second, they yield more parsimonious models, because they reduce the number of variances and covariances to be estimated, thereby increasing the stability of the parameter estimates, enhancing the variable-to-sample-size ratio, and reducing the impact of the sampling error on the estimation process. Accordingly, a composite measure of each dimension of social influence was introduced in the analyses conducted, to assess the dimensionality, reliability, and validity of the scales. Finally, the causal relationships to test hypotheses 1‒11 were determined.

4. Results

4.1. Measurement Model Results

The psychometric properties of the social influence scale were analyzed in the first step of the analysis (Table 1) by implementing a CFA of the 12 items that make up the final scale. This enabled us to obtain four dimensions: descriptive personal norm, descriptive social norm, injunctive personal norm, and injunctive social norm. The probability associated with the chi-square test reached a value higher than 0.05 (0.07951), indicating a good overall fit of the scale. Convergent validity is demonstrated in two ways. First, the factor loadings are significant and greater than 0.5 [90], and second, the average variance extracted (AVE) for each of the factors is higher than 0.5 [91], with levels ranging from 0.74 (descriptive social norm) to 0.86 (injunctive personal norm). The reliability of the scale is confirmed, because the composite reliability (CR) indices of each of the dimensions obtained are higher than 0.6 [90], with levels ranging from 0.88 (descriptive social norm) to 0.95 (injunctive personal norm).
Table 2 shows the discriminant validity of the four dimensions of social influence, evaluated by the means of AVE [91]. To support discriminant validity, a construct must share more variance with its indicators than with other constructs in the model. This occurs when the square root of the AVE between each pair of factors is higher than the estimated correlation between those factors; this occurs here, thus ratifying the discriminant validity. Further evidence of discriminant validity was also provided when examining the confidence intervals of the paired correlations among the latent variables, and none of the confidence intervals developed included a value of 1 [92]. Furthermore, discriminant validity was also tested through the differences between the chi-square values (with one degree of freedom) for the fixed and free solutions. All of the chi-square differences were significant, thus providing evidence of discriminant validity [88].
Two methods to assess common method bias were used. First, Harman’s single factor test was conducted, with the results showing that 37.94% of the variance is explained, and hence, no substantial amount of common method bias is present [93]. Second, using EQS, we specified a method factor, together with the original latent variables, and calculated the squared factor loadings for both the method factor and the substantive factors (i.e., the original latent variables). The average variance explained by the substantive factors was higher than 0.7, while that explained by the method factor was under 0.017, thus suggesting that the common method bias is not a concern in this study [20].
To test for multicollinearity, the variance inflation factors (VIFs) were computed and found to have a lowest value of 1.855, and a highest value of 4.235, both of which are below the conservative threshold of 5, thereby suggesting that multicollinearity was not a major issue in this study [94].
The psychometric properties of the scales forming the model were analyzed, once composite measures had been formed from items sharing the same dimension on the social influence scale [89]. The probability associated with the chi-square is higher than 0.05 (0.39544), thereby indicating a good overall fit of the scales (Table 3) [95]. Convergent validity is demonstrated, because the factor loadings are significant and higher than 0.5 [89], and the AVE for each of the factors is higher than 0.5 [91], with levels ranging from 0.60 (price-saving orientation) to 0.75 (hedonic motivation and perceived credibility). The reliability of the scale is verified, as the CR indices for each of the dimensions obtained are above 0.6 [90], with levels that range from 0.81 (price-saving orientation) to 0.92 (perceived credibility) (see Table 3).
Table 4 shows the discriminant validity of the constructs considered, following the same criteria as in Table 2, and the discriminant validity was ratified.

4.2. Structural Model Results

The overall causal relationships of the proposed model were analyzed to test Hypotheses 1‒11 (Table 5). The probability of the chi-square was higher than 0.05 (0.08255), the comparative fit index (CFI) (0.995) was close to unity, and the root mean square error of approximation (RMSEA) was close to zero (0.014). Additionally, the variance in intentions to use (R2 = 0.72) was explained by perceived credibility, performance expectancy, effort expectancy, social influence, facilitating conditions, hedonic motivations, price-saving orientation, and habit. The variance in use (R2 = 0.71) was explained by intentions to use, facilitating conditions, and habit. This indicates that the model used in this study is able to successfully predict and explain the use and adoption of MARSR. The authors found that R2 in use increased by more than 38%, compared to the original UTAUT-2.
In order to obtain a better fit of the model, some parameters were constrained to be equal: specifically, all of the determinants of intention to use, on the one hand, and all the antecedents of use, on the other. A comparison of the chi-square values of both models yielded ∆χ2 = 230.78 with ∆df = 9, with an associated p = 0.000, which means that the constrained model is more accurate [88]. The results of the analysis show that all the relationships posited in the model were supported for the sample.
The results of the SEM analysis of the structural model indicated, as shown in Table 5 and Figure 3, that intentions to use, facilitating conditions, and habit significantly and positively influenced use (β = 0.38, p < 0.01; β = 0.29, p < 0.01; β = 0.45, p < 0.01). These results support H1, H4, and H9. In addition, performance expectancy, effort expectancy, facilitating conditions, hedonic motivation, price-saving orientation, habit, social influence, and perceived credibility significantly and positively affect the intentions to use (β = 0.13, p < 0.01; β = 0.13, p < 0.01; β = 0.11, p < 0.01; β = 0.14, p < 0.01; β = 0.13, p < 0.01; β = 0.18, p < 0.01; β = 0.11, p < 0.01; β = 0.16, p < 0.01). These findings support H2, H3, H5, H6, H7, H8, H10, and H11.

4.3. The Moderating Effects Analysis

A moderation analysis was conducted to test the validity of the moderation hypotheses (H12a to H20). Table 6 shows the moderating effects of gender (male vs. female), age (18 to 39 vs. 40 or over), and experience, using mobile applications (less than three years vs. more than three years), on the relationships in the model. Previously, for each moderator analysis, the invariance of the factor loadings was ratified; in all three cases, the model fit was not significantly worse in the model, with more restricted factor loadings than in the simultaneous model (the probability associated with the chi-square increase is always higher than 0.05, p = 0.112 for gender, p = 0.201 for age, and p = 0.092 for experience).
Table 6 shows that gender and age did not moderate the effects of the independent variables on intentions to use MARSR. The detailed statistical figures reveal that only experience in using mobile applications moderated the effect of intention to use (0.33 vs. 0.44), facilitating conditions (0.19 vs. 0.38), and habit (0.37 vs. 0.57) on the use of MARSR. This effect was greater in users with more experience in using mobile applications. Consequently, H15b and H18b are partially supported, while H12, H13, H14, H15a, H16, H17, H18a, H19, and H20 are rejected.

5. Discussion and Conclusion

This research has developed and tested a successful model for a restaurant search and/or reservation app, through the expanded and extended UTAUT-2. The findings strongly support the suitability of the extended and expanded UTAUT-2 as a means for guiding the understanding of the factors that are involved in users’ acceptance of mobile applications for restaurant searches and/or reservations (MARSR). In addition, this research has analyzed the moderating effects of gender, age, and experience, which were only partially supported.
This research is one of the first empirical studies to extend the exploration of technology acceptance in tourism services apps to the specific case of consumers’ adoption of app-based MARSR.
The empirical findings of this research indicate that the drivers of intentions to use MARSR are, in order of impact: habit, perceived credibility, hedonic motivation, performance expectancy, effort expectancy, price-saving orientation, social influence, and facilitating conditions. These results mainly show that restaurants’ customers will have positive intentions for adopting MARSR, because they need to use this app to find a restaurant, as long as they perceive that MARSR safeguards data confidentiality, and that it is fun, entertaining, and easy to use, and that it helps to save time and money. Additionally, the results reveal that the greatest influence on the relationships with usage are exerted by, from high to low, habit, intentions to use, and facilitating conditions.
The results indicate that habit is the strongest predictor of intentions to use, and of actual usage, in the context of MARSR. This finding is consistent with the previous literature on UTAUT-2 [16,21]. The explanation of this finding could be that the intention to use a restaurant app becomes less critical when the habit is stronger, since the probability of using it continuously is much higher, as has been seen in the strong influence of habit on the use of MARSR. This fact confirms previous research carried out among internet users, which found a direct effect of habit on technology use, but a more moderate impact on intentions to use [61].
Perceived credibility is the second strongest predictor of intentions to use, which means that privacy and security are still issues when using MARSR, and usually arise as such, in the early stages of the adoption of new technologies. In the MARSR context, privacy and security are not merely a matter of legislative compliance, but also of business practice and of finding a technical solution for consumer requirements. Consequently, perceived credibility is another important antecedent of intentions to use in the context of MARSR, which is also consistent with the findings of previous studies in UTAUT-1 on mobile banking [24]. This is a novelty in UTAUT-2, and one of the contributions of this research. These results confirm the need to extend UTAUT-2 by incorporating the perceived credibility factor, to better understand the acceptance of MARSR according to the proposed model.
The effects of hedonic motivation have not been considered in depth in the mobile application context, with the exception of the research by Venkatesh et al. [21], which was focused on mobile technology in general. Hedonic motivation is a strong predictor of intentions to use, thus confirming the findings of Venkatesh et al. [21], with the relationship being stronger than in previous applications of UTAUT- 2, in the online purchase context [16]. These findings suggest that users rate mobile applications as being positive, when they are fun, enjoyable, and entertaining.
The cost of using mobile services has been tested in UTAUT mobile research. Yu [24] found a negative relationship between economic cost and intentions to use. Nevertheless, as MARSR are free of charge, and given that in this research that the price value construct of the original UTAUT-2 was replaced by the price-saving orientation, its influence on intentions to use is significant, thus confirming previous research [16]. These results reveal that consumers use these applications to obtain discounts and to save money, which is a novel contribution to the literature on mobile applications.
The results also show that performance expectancy and effort expectancy are predictors of intentions to use. Performance expectancy has a positive influence on intentions to use, thereby confirming the previous literature on UTAUT in the mobile context [21,24,27], and in the acceptance of tourism mobile apps [17,19]. The results are also consistent with previous research that has indicated positive relationship between effort expectancy and intentions to use [17,19,21]. Users will have positive intentions to adopt MARSR if they are perceived as efficient apps for searching that are easy to use, while also saving time.
Social influence is the original construct of UTAUT-1, which has been tested most commonly in the mobile framework, and its influence on intentions to use has garnered considerable support [24,96]. In this study, the social influence construct was expanded by using the SNA, which was expected to outperform the relationship between social influence and intentions to use. Unexpectedly, in this research, the estimated β parameter for the abovementioned relationship represented one of the least powerful drivers of intentions to use, in contrast to more specialized apps, as found in a study conducted among users of diet apps [19], in which social influence was the most powerful antecedent of the intentions to use. Therefore, this is another contribution, and it may be explained by two reasons. First, the generalization of the use of mobile services may have reduced social influence, as a result of normative pressure from reference groups. Second, if habit is the strongest driver of intentions to use, the social norm necessarily becomes less relevant.
The effects of facilitating conditions on intentions to use have been supported in research carried out on app-based mobile tour guides [17], and their effect on usage has also been tested among consumers of mobile shopping services [97]. Accordingly, in this study, facilitating conditions are the last driver in order of relevance affecting usage, and the second that influences intentions to use, while in other studies on mobile apps, this relationship has not been found to be significant [19]. These outcomes indicate that the role of facilitating conditions and their impacts are more influential on MARSR usage than on MARSR intentions to use. This means that individuals’ perceptions of the support and the resources that are available for using MARSR are key factors for the acceptance of this technology.
Contrary to the previous studies by Venkatesh et al. [20,21], which indicated the moderating impacts of gender, age, and experience on all of the relationships between the independent variables and the behavioral intentions, except for between performance expectancy and behavioral intentions, which were moderated only by gender and age, this research has not found any significant differences in terms of gender and age, thereby supporting other studies on social media users [35] and mobile banking [34]. These findings could be interpreted as a reflection of the tendency that individuals are evolving to become more and more digital in modern societies, especially when there are no economic risks in the activity, since other authors have identified gender differences in the use of mobile payment platforms [85]. Likewise, the main role of habit among users of MARSR in the whole sample already anticipates these results in some way. In short, previous assumptions about age and gender, in terms of technology acceptance and use, may have become anachronistic.
This research has identified significant differences in the moderating effect of experience in using mobile applications between facilitating conditions and use, intentions to use and use, and habit and use of MARSR, which is partially supported by previous literature [20,21]. This effect is seen to be stronger in the first two relations for people with more than three years’ experience, whereas previous literature has found that the effect was stronger for individuals with less than three years’ experience with mobile applications [21]. These findings could be explained by the fact that users have an increasingly greater amount of experience in online contexts [98], and more confidence and practice in the use of applications. As a result, they tend to be more willing to use MARSR than novice users. Conversely, the results of this research do coincide with previous literature on the fact that individuals with more than three years of experience are the ones for which the strongest effect between habit and use is observed, thus supporting Venkatesh et al. [21].
In sum, an extended and expanded version of UTAUT-2 was used in this research, to explain the user acceptance of mobile apps for restaurants. This new version of UTAUT-2 has been extended by adding one new factor, perceived credibility, redesigning the original factor price value as price-saving orientation, and expanding the social influence factor, using descriptive personal, descriptive social, injunctive personal, and injunctive social norms as dimensions of the factor. This has resulted in variances of the intentions to use MASRS (R2 = 0.72) and in MASRS use (R2 = 0.71), being substantial improved compared to the previous literature [16,21].

6. Practical Implications, Limitations, and Future Research

This research has conceptualized consumers’ intentions to use, and the use of MARSR, by building a comprehensive model that extends and expands on UTAUT-2, in which habit, perceived credibility, and hedonic motivation perceptions were found to play a primordial role in intentions to use MARSR. Furthermore, habit was identified as the main antecedent to using MARSR. In addition, no differences were found by gender or age in the relationships hypothesized in the model. Significant differences were only found among users with more than three years’ experience, using MARSR between the intention to use and use, facilitating conditions and use, and habit and use.
The results of the structural model have various potential managerial implications for MARSR companies, as well as for restaurant owners and managers, taking into account that MARSR is one of the activities that make up the customer process during the service experience, which plays a crucial role in tourism services [99,100]. These suggestions could help MARSR companies to increase data traffic, to maximize the value of their investments and to improve their results. From the point of view of restaurant owners and managers, the increasing number of MARSR users can help them to reach more customers, and thus obtain more bookings, revenues, and profits. In addition, the results demonstrate that the habit of using mobile applications is the most important variable influencing intentions to use and the usage of MARSR. These results suggest that app providers must encourage users to further develop the habit of using their MARSR regularly, by providing differential services. For example, managers of restaurants should encourage additional activities, such as discounts, offers, and tastings, as users are far more likely to be receptive, when using these kinds of applications becomes part of their daily routine. This would lead to an increase in booking rates and the rotation of installed capacity. Moreover, the results show that performance expectancy and price-saving orientation influence users’ intentions to use. That is, users of MARSR utilize these applications to search for restaurants quickly, save time, compare prices, find cheap restaurants, and identify good price proposals. Therefore, restaurant owners and managers should work actively to become part of this sales channel, in order to gain access to this source of customers, which is becoming increasingly relevant.
The results also indicate that MARSR users are very sensitive to security and privacy issues, as well as to the hedonic aspect of MARSR. Therefore, MARSR companies should create applications with higher levels of security and confidentiality. These companies should also improve the design of their applications, to make them even more fun and entertaining. Likewise, this research has shown that users value ease-of-use in these applications, and thus, MARSR managers should aim to design user-friendly apps. Finally, the results reveal a greater effect of intentions to use on usage. MARSR managers should therefore aim to strengthen consumers’ intentions to use these applications, because this will lead to more actual usage. This means that according to the findings, that managers must take action with respect to variables such as performance expectancy, effort expectancy, facilitating conditions, hedonic motivation, price-saving orientation, and perceived credibility, in order to increase the use of MARSR. Additionally, the app designers, and according to the results regarding the moderating effects, should enhance facilitating conditions, since it could be a motivator for users with less experience, and it would improve their intentions of use toward MARSR. This study is not free of limitations, however, and these limitations provide avenues for further research. First, the measurement of use was self-reported, rather than being based on actual use. This limitation is common to all previous research on the UTAUT theory [16,27,28]. A relevant advance for future research would be the possibility of measuring real behavior. Second, this research expands on and extends UTAUT-2, in order to investigate users’ intentions to use and the use of MARSR, but there may be other potential factors for extending UTAUT-2, such as personalization or perceived risk, that we have not taken into account, and which can help to improve the understanding of MARSR users. Third, national comparisons to identify cultural differences among countries would be desirable, to test the proposed model. Third, the sample does not include tourists. Future research could incorporate this important group in Spain. Four, it could be relevant for future research to include other interactions between the variables of the conceptual model, as well as other moderating effects among the independent and dependent variables, such as social influence as a moderator. Finally, future research could be addressed to identify the contributions of mobile applications towards mitigating the negative effects of overcrowding, in overtourism destinations.
Last but not least, MARSR are very popular among urban users. One direction for future research could be to conduct a study of the adoption of MARSR, comparing urban and rural users.

Author Contributions

R.P.-S. and S.F.-C. contributed to research design, empirical analysis, manuscript writing, and provided quality assurance for the research; J.S.-G. conducted the methodology and data analysis; E.R. contributed to research design, manuscript writing, and collection of data. All authors read and approved the final manuscript.

Funding

This research received no external funding.

Conflicts of Interest

The authors declare no conflict of interest.

References

  1. Statista. Smartphone Users Worldwide 2014–2020. 2018. Available online: https://www.statista.com/statistics/330695/number-of-smartphone-users-worldwide/ (accessed on 17 October 2018).
  2. Statista. Annual Number of Global Mobile App Downloads 2017–2022. 2018. Available online: https://www.statista.com/statistics/271644/worldwide-free-and-paid-mobile-app-store-downloads/ (accessed on 17 October 2018).
  3. Statista. Pre-Dining Smartphone Usage in the U.S. 2016. 2018. Available online: https://www.statista.com/statistics/609812/activities-carried-out-by-diners-on-their-smartphones-us/ (accessed on 15 October 2018).
  4. Dickinson, J.E.; Ghali, K.; Cherrett, T.; Speed, C.; Davis, N.; Norgate, S. Tourism and the smartphone app: Capabilities, emerging practice and scope in the travel domain. Curr. Issues Tour. 2014, 17, 84–101. [Google Scholar] [CrossRef]
  5. Hinch, T.; Higham, J. Sport Tourism Development, 2nd ed.; Channel View Publications: Bristol, UK, 2011. [Google Scholar]
  6. Pareigis, J.; Edvardsson, B.; Enquist, B. Exploring the role of the service environment in forming customer’s service experience. Int. J. Qual. Serv. Sci. 2011, 3, 110–124. [Google Scholar] [CrossRef]
  7. Wu, H.C.; Cheng, C.C.; Ai, C.H. A study of experiential quality, experiential value, trust, corporate reputation, experiential satisfaction and behavioral intentions for cruise tourists: The case of Hong Kong. Tour. Manag. 2018, 66, 200–220. [Google Scholar] [CrossRef]
  8. Kim (Sunny), J. An extended technology acceptance model in behavioral intention toward hotel tablet apps with moderating effects of gender and age. Int. J. Contemp. Hosp. Manag. 2016, 28, 1535–1553. [Google Scholar]
  9. Kim, H.B.; Kim, T.T.; Shin, S.W. Modeling roles of subjective norms and eTrust in customers’ acceptance of airline B2C eCommerce websites. Tour. Manag. 2009, 30, 266–277. [Google Scholar] [CrossRef]
  10. Lee, W.; Xiong, L.; Hu, C. The effect of Facebook users’ arousal and valence on intention to go to the festival: Applying an extension of the technology acceptance model. Int. J. Hosp. Manag. 2012, 31, 819–827. [Google Scholar] [CrossRef]
  11. Wang, H.Y.; Wang, S.H. Predicting mobile hotel reservation adoption: Insight from a perceived value standpoint. Int. J. Hosp. Manag. 2010, 29, 598–608. [Google Scholar] [CrossRef]
  12. Schrier, T.; Erdem, M.; Brewer, P. Merging task-technology fit and technology acceptance models to assess guest empowerment technology usage in hotels. J. Hosp. Tour. Technol. 2010, 1, 201–217. [Google Scholar] [CrossRef]
  13. Ozturk, A.B.; Nusair, K.; Okumus, F.; Hua, N. The role of utilitarian and hedonic values on users’ continued usage intention in a mobile hotel booking environment. Int. J. Hosp. Manag. 2016, 57, 106–115. [Google Scholar] [CrossRef]
  14. Zhu, G.; So, K.K.F.; Hudson, S. Inside the sharing economy Understanding consumer motivations behind the adoption of mobile applications. Int. J. Contemp. Hosp. Manag. 2017, 29, 2218–2239. [Google Scholar] [CrossRef]
  15. Wang, Y.S.; Li, H.T.; Li, C.R.; Zhang, D.Z. Factors affecting hotels’ adoption of mobile reservation systems: A technology-organization-environment framework. Tour. Manag. 2016, 53, 163–172. [Google Scholar] [CrossRef]
  16. Escobar-Rodríguez, T.; Carvajal-Trujillo, E. Online purchasing tickets for low-cost carriers: An application of the unified theory of acceptance and use of technology (UTAUT) model. Tour. Manag. 2014, 43, 70–88. [Google Scholar] [CrossRef]
  17. Lai, I.K.V. Traveler acceptance of an app-based mobile tour guide. J. Hosp. Tour. Res. 2015, 39, 401–432. [Google Scholar] [CrossRef]
  18. Lee, J.; Kim, K.; Shin, H.; Hwang, J. Acceptance Factors of Appropriate Technology: Case of Water Purification Systems in Binh Dinh, Vietnam. Sustainability 2018, 10, 2255. [Google Scholar] [CrossRef]
  19. Okumus, F.; Ali, F.; Bilgihan, A.; Ozturk, A.B. Psychological factors influencing customers’ acceptance of smartphone diet apps when ordering food at restaurants. Int. J. Hosp. Manag. 2016, 72, 67–77. [Google Scholar] [CrossRef]
  20. Venkatesh, V.; Morris, M.G.; Davis, G.B.; Davis, F.D. User acceptance of information technology: Toward a unified view. MIS Q. 2003, 27, 425–478. [Google Scholar] [CrossRef]
  21. Venkatesh, V.; Thong, J.Y.L.; Xu, X. Consumer Acceptance and Use of Information Technology: Extending the Unified Theory. MIS Q. 2012, 36, 157–178. [Google Scholar] [CrossRef]
  22. Zhou, T. Understanding mobile Internet continuance usage from the perspectives of UTAUT and flow. Inf. Dev. 2011, 27, 207–218. [Google Scholar] [CrossRef]
  23. San Martín, H.; Herrero, A. Influence of the user’s psychological factors on the online purchase intention in rural tourism Integrating innovativeness to the UTAUT framework. Tour. Manag. 2012, 33, 341–350. [Google Scholar] [CrossRef]
  24. Yu, C.S. Factors affecting individuals to adopt mobile banking: Empirical evidence from the UTAUT Model. J. Electron. Commer. Res. 2012, 13, 104–121. [Google Scholar]
  25. Pan, L.Y.; Chang, S.C.; Sun, C.C. A three-stage model for smart phone use antecedents. Qual. Quant. 2014, 48, 1107–1115. [Google Scholar] [CrossRef]
  26. Wong, C.; Tan, G.W.-H.; Locke, S.-P.; Ooi, K.-B. Mobile TV: A new form of entertainment? Ind. Manag. Data Syst. 2014, 114, 1050–1067. [Google Scholar] [CrossRef]
  27. Slade, E.L.; Dwivedi, Y.K.; Piercy, N.C.; Williams, M.D. Modeling consumers’ adoption intentions of remote mobile payments in the United Kingdom: Extending UTAUT with innovativeness, risk, and trust. Psychol. Mark. 2015, 32, 860–873. [Google Scholar] [CrossRef]
  28. Morosan, C.; DeFranco, A. It’s about time: Revisiting UTAUT2 to examine consumers’ intentions to use NFC mobile payment in hotels. Int. J. Hosp. Manag. 2016, 53, 17–29. [Google Scholar] [CrossRef]
  29. Coves Martínez, A.L.; Sabiote-Ortiz, C.M.; Rey-Pino, J.M. The influence of cultural intelligence on intention of internet use. Span. J. Mark. 2018, 22, 231–250. [Google Scholar] [CrossRef]
  30. Wang, Y.S.; Tseng, T.H.; Wang, W.T.; Shiyh, Y.W.; Chan, P.Y. Developing and validating a mobile catering app success model. Int. J. Hosp. Manag. 2019, 77, 19–30. [Google Scholar] [CrossRef]
  31. Eckhardt, A.; Laumer, S.; Weitzel, T. Computer self efficacy: Development of a measure and initial test. J. Inf. Technol. 2009, 24, 11–24. [Google Scholar] [CrossRef]
  32. Suganthi, B. Internet banking patronage: An empirical investigation of Malaysia. J. Internet Bank. Commer 2001, 6, 20–32. [Google Scholar]
  33. Gupta, B.; Dasgupta, S.; Gupta, A. Adoption of ICT in a government organization in a developing country: An empirical study. J. Strateg. Inf. Syst. 2008, 17, 140–154. [Google Scholar] [CrossRef]
  34. Oliveira, T.; Faria, M.; Thomas, M.A.; Popovic, A. Extending the understanding of mobile banking adoption: When UTAUT meets TTF and ITM. Int. J. Inf. Manag. 2014, 34, 689–703. [Google Scholar] [CrossRef]
  35. Workman, M. New media and the changing face of information technology use: The importance of task pursuit, social influence, and experience. Comput. Hum. Behav. 2014, 31, 111–117. [Google Scholar] [CrossRef]
  36. Venkatesh, V.; Thong, J.Y.L.; Xu, X. Unified Theory of Acceptance and Use of Technology: A synthesis and the road ahead. J. Assoc. Inf. Syst. 2016, 17, 328–376. [Google Scholar] [CrossRef]
  37. Fishbein, M.; Ajzen, I. Belief, Attitude, Intention and Behavior: An Introduction to Theory and Research; Addison-Wesley: Reading, MA, USA, 1975. [Google Scholar]
  38. Davis, F.D. Perceived usefulness, perceived ease of use, and user acceptance of information technology. MIS Q. 1989, 13, 319–339. [Google Scholar] [CrossRef]
  39. Davis, F.D.; Bagozzi, R.P.; Warshaw, P.R. Extrinsic and intrinsic motivation to use computers in the workplace. J. Appl. Soc. Psychol. 1992, 22, 1111–1132. [Google Scholar] [CrossRef]
  40. Azjen, I. The theory of planned behavior. Organ. Behav. Hum. Decis. Process. 1991, 50, 179–211. [Google Scholar]
  41. Taylor, S.; Todd, P.A. Understanding information technology usage: A test of competing models. Inf. Syst. Res. 1995, 6, 144–176. [Google Scholar] [CrossRef]
  42. Thompson, R.; Higgins, C.; Howell, J. Personal computing: Toward a conceptual model of utilization. MIS Q. 1991, 15, 125–143. [Google Scholar] [CrossRef]
  43. Moore, G.C.; Benbasat, I. Development of an instrument to measure the perceptions of adopting an information technology innovation. Inf. Syst. Res. 1991, 2, 192–222. [Google Scholar] [CrossRef]
  44. Compeau, D.R.; Higgins, C.A. Computer self-efficacy: Development of a measure and initial test. MIS Q. 1995, 19, 189–211. [Google Scholar] [CrossRef]
  45. Im, I.; Hong, S.; Kang, M.S. An international comparison of technology adoption. Testing the UTAUT model. Inf. Manag. 2011, 48, 1–8. [Google Scholar] [CrossRef]
  46. Borrero, J.D.; Yousafzai, S.Y.; Javed, U.; Page, K.L. Expressive participation in Internet social movements: Testing the moderating effect of technology readiness and sex on students SNS use. Comput. Hum. Behav. 2014, 30, 39–49. [Google Scholar] [CrossRef]
  47. Abroud, A.; Choong, Y.V.; Muthaiyah, S.; Fie, D.Y.G. Adopting e-finance: Decomposing the technology acceptance model for investors. Serv. Bus. 2015, 9, 161–182. [Google Scholar] [CrossRef]
  48. Venkatesh, V.; Davis, F.D. A Theoretical Extension of the Technology Acceptance Model: Four Longitudinal Field Studies. Manag. Sci. 2000, 46, 186–204. [Google Scholar] [CrossRef]
  49. Wang, Y.-S.; Wang, Y.-M.; Lin, H.-H.; Tang, T.-I. Determinants of user acceptance of internet banking: An empirical study. Int. J. Serv. Ind. Manag. 2003, 14, 501–519. [Google Scholar] [CrossRef]
  50. Venkatesh, V.; Brown, S.; Maruping, L.; Bala, H. Predicting different conceptualizations of system use: The competing roles of behavioral intention, facilitating conditions, and behavioral expectation. MIS Q. 2008, 32, 483–502. [Google Scholar] [CrossRef]
  51. Gallivan, M.J.; Spitler, V.K.; Koufaris, M. Does information technology training really matter? A social information processing analysis of coworkers’ influence on IT usage in the workplace. J. Manag. Inform. Syst. 2005, 22, 153–192. [Google Scholar] [CrossRef]
  52. Joshua, A.J.; Koshy, M.P. Usage patterns of electronic banking services by urban educated customers: Glimpses from India. J. Internet Bank. Commer. 2011, 16, 1–12. [Google Scholar]
  53. Brown, S.; Venkatesh, V. Model of Adoption of Technology in Households: A Baseline Model Test and Extension Incorporating Household Life Cycle. MIS Q. 2005, 29, 399–426. [Google Scholar] [CrossRef]
  54. Chtourou, M.S.; Souiden, N. Rethinking the TAM model: Time to consider fun. J. Consum. Mark. 2010, 27, 336–344. [Google Scholar] [CrossRef]
  55. Kim, H.; Chan, H.; Gupta, S. Value-based adoption of mobile internet: An empirical investigation. Decis. Support Syst. 2007, 43, 111–126. [Google Scholar] [CrossRef]
  56. Hanudin, A.; Rostinah, S.; Masmurniwati, M.A.; Ricardo, B. Receptiveness of mobile banking by Malaysian local customers in Sabah: An empirical investigation. J. Internet Bank. Commer. 2012, 17, 1–12. [Google Scholar]
  57. Dodds, W.B.; Monroe, K.B.; Grewal, D. Effects of price, brand and store information on buyers’ product evaluations. J. Mark. Res. 1991, 28, 307–319. [Google Scholar]
  58. Punj, G. Income effects on relative importance of two online purchase goals: Saving time versus saving money? J. Bus. Res. 2012, 65, 634–640. [Google Scholar] [CrossRef]
  59. Jung, K.; Cho, Y.C.; Lee, S. Online shoppers’ response to price comparison sites. J. Bus. Res. 2014, 67, 2079–2087. [Google Scholar] [CrossRef]
  60. Jensen, J.M. Shopping orientation and online travel shopping: The role of travel experience. Int. J. Tour. Res. 2012, 14, 56–70. [Google Scholar] [CrossRef]
  61. Limayem, M.; Hirt, S.; Cheung, C. How Habit Limits the Predictive Power of Intention: The Case of Information Systems Continuance. MIS Q. 2007, 31, 705–737. [Google Scholar] [CrossRef]
  62. Triandis, H.C. Attitude and Attitude Change; John Wiley and Sons: New York, NY, USA, 1971. [Google Scholar]
  63. Berkowitz, A.D. From reactive to proactive prevention: Promoting an ecology of health on campus. In Substance Abuse on Campus: A Handbook on Substance Abuse for College and University Personnel; Rivers, P.C., Shore, E., Eds.; Greenwood Press: Westport, CT, USA, 1997; pp. 120–139. [Google Scholar]
  64. Perkins, H.W. The emergence and evolution of the social norms approach to substance abuse prevention. In The Social Norms Approach to Preventing School and College Age Substance Abuse; Perkins, H.W., Ed.; Jossey-Bass: San Francisco, CA, USA, 2003; pp. 3–17. [Google Scholar]
  65. Deutsch, M.; Gerard, H.B. A study of normative and informational social influences upon individual judgement. J. Abnorm. Psychol. 1955, 51, 629–636. [Google Scholar] [PubMed]
  66. Kelman, H.C. Compliance, identification, and internalization three processes of attitude change. J. Confl. Resolut. 1958, 2, 51–60. [Google Scholar] [CrossRef]
  67. Williams, R.M. Norms: The concept of norms. In International Encyclopedia of the Social Sciences; Sills, D.I., Ed.; McMillan: Mahwah, NJ, USA; New York, NY, USA, 1968; pp. 204–208. [Google Scholar]
  68. Cialdini, R.B.; Reno, R.R.; Kallgren, C.A. A focus theory of normative conduct: Recycling the concept of norms to reduce littering in public places. J. Pers. Soc. Psychol. 1990, 58, 1015–1026. [Google Scholar] [CrossRef]
  69. Smith, J.R.; Terry, D.J.; Manstead, A.S.R.; Louis, W.R.; Kotterman, D.; Wolfs, J. The attitude–behavior relationship in consumer conduct: The role of norms, past behavior, and self-identity. J. Soc. Psychol. 2008, 148, 311–333. [Google Scholar] [CrossRef] [PubMed]
  70. Cialdini, R.B.; Reno, R.R.; Kallgren, C.A. A focus theory of normative conduct: A theoretical refinement and reevaluation of the role of norms in human behavior. Adv. Exp. Soc. Psychol. 1991, 24, 201–234. [Google Scholar]
  71. Lapinski, M.K.; Rimal, R.N. An explication of social norms. Commun. Theory 2005, 15, 127–147. [Google Scholar] [CrossRef]
  72. Smith, S.W.; Park, H.S. Distinctiveness and influence of subjective norms, personal descriptive and injunctive norms, and societal descriptive and injunctive norms on behavioral intent: A case of two behaviors critical to organ donation. Hum. Commun. Res. 2007, 33, 194–218. [Google Scholar]
  73. Soroa-Koury, S.; Yang, K.C.C. Factors affecting consumers’ responses to mobile advertising from a social norm theoretical perspective. Telemat. Inform. 2010, 27, 103–113. [Google Scholar] [CrossRef]
  74. Luarn, P.; Lin, H.-H. Toward an understanding of the behavioral intention to use mobile banking. Comput. Hum. Behav. 2005, 21, 873–891. [Google Scholar] [CrossRef]
  75. Goh, T.-T.; Sun, S. Exploring gender differences in Islamic mobile banking acceptance. Electron. Commer. Res. 2014, 14, 435–458. [Google Scholar] [CrossRef]
  76. Lu, Y.; Yang, S.; Chau, P.Y.K.; Cao, Y. Dynamics between the trust transfer process and intention to use mobile payment services: A cross-environment perspective. Inf. Manag. 2011, 48, 393–403. [Google Scholar] [CrossRef]
  77. Kambourakis, G.; Martínez, G.; Mármol, F.G. Editorial: Special issue on advances in security and privacy for future mobile communications. Electron. Commer. Res 2015, 15, 73–74. [Google Scholar] [CrossRef]
  78. Laforet, S.; Li, X. Consumers’ attitudes towards online and mobile banking in China. Int. J. Bank Mark. 2005, 23, 362–380. [Google Scholar] [CrossRef]
  79. Mayer, R.C.; Davis, J.H.; Schoorman, F.D. An integrative model of organizational trust. Acad. Manag. Rev. 1995, 20, 709–734. [Google Scholar] [CrossRef]
  80. Tarhini, A.; Hone, K.; Liu, X. Measuring the moderating effect of gender and age on e-learning acceptance in England: A structural equation modeling approach for an extended technology acceptance model. J. Educ. Comput. Res. 2014, 51, 163–184. [Google Scholar] [CrossRef]
  81. Castañeda, J.A.; Muñoz-Leiva, F.; Luque, T. Web Acceptance Model (WAM): Moderating effects of user experience. Inf. Manag. 2007, 44, 384–396. [Google Scholar] [CrossRef]
  82. Schumacher, P.; Morahan-Martin, J. Gender, Internet and computer attitudes and experiences. Comput. Hum. Behav. 2000, 16, 13–29. [Google Scholar] [CrossRef]
  83. Dwyer, P.D.; Gilkeson, J.H.; List, J.A. Gender differences in revealed risk taking: Evidence from mutual fund investors. Econ. Lett. 2002, 76, 151–158. [Google Scholar] [CrossRef]
  84. San Martín, S.; Jiménez, N.H. Online buying perceptions in Spain: Can gender make a difference? Electron. Mark. 2011, 21, 267–281. [Google Scholar] [CrossRef]
  85. Shao, Z.; Zhang, L.; Li, X.; Guo, Y. Antecedents of trust and continuance intention in mobile payment platforms: The moderating effect of gender. Electron. Commer. Res. 2019, 33, 100823. [Google Scholar] [CrossRef]
  86. Guo, X.; Zhang, X.; Sun, Y. The privacy–personalization paradox in mHealth services acceptance of different age groups. Electron. Commer. Res. 2016, 16, 55–65. [Google Scholar] [CrossRef]
  87. Netquest. Available online: https://www.netquest.com/online-surveys-investigation (accessed on accessed on 17 October 2018).
  88. Bentler, P.M. EQS Structural Equations Program Manual; Multivariate Software Inc.: Encino, CA, USA, 1995. [Google Scholar]
  89. Bandalos, D.L.; Finney, S.J. Item parceling issues in structural equation modelling. In Advanced Structural Equation Modeling: New Developments and Technique; Marcoulides, G.A., Schumacker, R.E., Eds.; Lawrence Erlbaum Associates: Mahwah, NJ, USA, 2001; pp. 269–296. [Google Scholar]
  90. Bagozzi, R.P.; Yi, T. On the evaluation of structural equation models. J. Acad. Mark. Sci. 1988, 16, 74–94. [Google Scholar] [CrossRef]
  91. Fornell, C.; Larcker, D.F. Evaluating structural equations models with unobservable variables and measurement error. J. Mark. Res. 1981, 18, 39–50. [Google Scholar] [CrossRef]
  92. Torkzadeh, G.; Koufteros, X.A.; Pflughoeft, K. Confirmatory analysis of a computer self-efficacy instrument. Struct. Equ. Model. 2003, 10, 263–275. [Google Scholar] [CrossRef]
  93. Hair, J.F., Jr.; Black, W.; Babin, B.; Anderson, R.; Tatham, R. Multivariate Data Analysis; Pearson Prentice-Hall: Upper Saddle River, NJ, USA, 2006. [Google Scholar]
  94. Hair, J.F., Jr.; Anderson, R.E.; Tatham, R.L.; Black, W.C. Multivariate Data Analysis, 7th ed.; Pearson New International Edition Macmillan: Harlow, UK, 2014. [Google Scholar]
  95. Jöreskog, K.G.; Sörbom, D. PRELIS 2 User’s Reference Guide: A Program for Multivariate Data Screening and Data Summarization: A Preprocessor for LISREL; Scientific Software International: Chicago, IL, USA, 1996. [Google Scholar]
  96. Yang, S.; Lu, Y.; Gupta, S.; Cao, Y.; Zhang, R. Mobile payment services adoption across time: An empirical study of the effects of behavioural beliefs, social influences, and personal traits. Comput. Hum. Behav. 2012, 28, 129–142. [Google Scholar] [CrossRef]
  97. Yang, K. Determinants of US consumer mobile shopping services adoption: Implications for designing mobile shopping services. J. Consum. Mark. 2010, 27, 262–270. [Google Scholar] [CrossRef]
  98. Stouthuysen, K.; Teunis, I.; Reusen, E.; Slabbinck, S. Initial trust and intentions to buy: The effect of vendor-specific guarantees, customer reviews and the role of online shopping experience. Electron. Commer. Res. Appl. 2018, 27, 33–38. [Google Scholar] [CrossRef]
  99. Palau-Saumell, R.; Forgas-Coll, S.; Sánchez-García, J.; Prats-Planagumà, L. Managing dives centres: SCUBA divers’ behavioural intentions. Eur. Sport Manag. Q. 2014, 14, 422–443. [Google Scholar] [CrossRef]
  100. Forgas-Coll, S.; Palau-Saumell, R.; Matute, J.; Tárrega, S. How do service quality, experience and enduring involvement influence tourists behavior: An empirical study in the Picasso and Miró museums in Barcelona. Int. J. Tour. Res. 2017, 19, 246–256. [Google Scholar] [CrossRef]
Figure 1. UTAUT-2.
Figure 1. UTAUT-2.
Sustainability 11 01210 g001
Figure 2. Research Model.
Sustainability 11 01210 g002
Figure 3. Structural model results. Note: Numbers are the standardized path coefficients. ** p < 0.01.
Sustainability 11 01210 g003
Table 1. Analysis of the dimensionality, reliability, and validity of the Social Influence Scale (Fully Standardized Solution).
Factor Loadingt
Descriptive Personal Norm (AVE = 0.85; CR = 0.94)
I believe that many people who are important to me use MARSR.0.8942.49 **
I believe that many people whose opinions I value use MARSR.0.9446.18 **
I believe that many people who are important to me search for restaurants using MARSR.0.9244.31 **
Descriptive Social Norm (AVE = 0.74; CR = 0.88)
I believe that many people in my country use MARSR.0.8836.79 **
I believe that many people in my country express their desire to use MARSR.0.7327.17 **
I believe that many people in my country search for restaurants using MARSR.0.9036.09 **
Injunctive Personal Norm (AVE = 0.86; CR = 0.95)
I believe that many people whose opinions I value approve of my using MARSR. 0.9142.52 **
I believe that many people who are important to me support my using MARSR.0.9342.69 **
I believe that many people who are important to me support my searching for restaurants using MARSR.0.9344.36 **
Injunctive Social Norm (AVE = 0.85; CR = 0.94)
I believe that many people in my country approve of the use of MARSR. 0.9240.11 **
I believe that many people in my country support the use of MARSR.0.9137.23 **
I believe that many people in my country are in favor of searching for restaurants using MARSR.0.9238.86 **
Notes. Model fit: chi-square (χ2) = 61.2287, df = 47, p = 0.07951; root mean square error of approximation (RMSEA) = 0.016; Bentler–Bonett non-normed fit index = 0.998; comparative fit index (CFI) = 0.999; CR = composite reliability; AVE = average variance extracted; ** p < 0.01.
Table 2. Correlations and discriminant validity of the Social Influence Scale.
1234
Descriptive Personal Norm0.92 a
Descriptive Social Norm0.51 **b0.86
Injunctive Personal Norm0.61 **0.53 **0.93
Injunctive Social Norm0.47 **0.83 **0.60 **0.92
Notes. a Square root of the average variance is along the diagonal. ** p < 0.01. b Below the diagonal: the estimated correlation between the factors.
Table 3. Analysis of the dimensionality, reliability, and validity of the Social Influence Scale (fully standardized solution).
Factor Loadingt
Use (AVE = 0.88; CR = 0.88)
How much time do you spend using MARSR when you are looking for restaurants? 0.8522.17 **
Intentions to use (AVE = 0.74; CR = 0.90)
I will always try to use MARSR.0.8839.70 **
I plan to continue to use MARSR frequently.0.8238.16 **
I intend to continue using MARSR in the future. 0.8838.23 **
Performance Expectancy (AVE = 0.67; CR = 0.89)
I find MARSR useful in my daily life when searching for restaurants.0.7629.37 **
I believe that using MARSR helps me search for restaurants more quickly.0.8433.84 **
I believe that using MARSR increases my productivity when searching for restaurants.0.8536.05 **
I believe I can save time using MARSR when searching for restaurants.0.8332.93 **
Effort Expectancy (AVE = 0.72; CR = 0.91)
I believe that learning how to use MARSR is easy for me.0.8432.12 **
I believe that my interaction with MARSR is clear and understandable.0.8836.56 **
I find MARSR easy to use.0.9139.82 **
I believe it is easy for me to become skillful at using MARSR.0.7628.83 **
Facilitating Conditions (AVE = 0.59; CR = 0.85)
I believe that I have the necessary smartphone to use MARSR.0.7321.24 **
I believe that I have the necessary knowledge to use MARSR.0.8328.21 **
I feel comfortable using MARSR.0.8030.51 **
I believe MARSR are compatible with other technologies I use.0.7124.67 **
Hedonic Motivation (AVE = 0.75; CR = 0.90)
I believe that using MARSR is fun.0.8534.62 **
I believe that using MARSR is enjoyable. 0.9037.12 **
I believe that using MARSR is very entertaining.0.8637.01 **
Price-Saving Orientation (AVE = 0.60; CR = 0.81)
I can save money by examining the prices of different restaurants when using MARSR.0.7727.88 **
I like to search for cheap restaurant deals when using MARSR.0.8232.95 **
I believe MARSR offer better value for my money.0.7226.67 **
Habit (AVE = 0.62; CR = 0.87)
The use of MARSR has become a habit for me.0.8240.76 **
I am in favor of using MARSR.0.7730.51 **
I feel the need to use MARSR.0.7130.56 **
Using MARSR on my smartphone has become natural to me.0.8440.84 **
Social Influence (AVE = 0.65; CR = 0.88) Items parceling
Personal Descriptive Norms0.7525.71 **
Societal Descriptive Norms0.8433.21 **
Personal Injunctive Norms0.7827.22 **
Societal Injunctive Norms0.8533.53 **
Perceived Credibility (AVE = 0.75; CR = 0.92)
When using MARSR on my smartphone, I believe that my information is kept confidential.0.8237.16 **
I believe that my searches are secure. 0.8741.21 **
I believe that my privacy will not be breached.0.8641.11 **
I believe that the environment is safe.0.9043.98 **
Notes. Model fit: chi-square (χ2) = 481.5385, df = 474, p = 0.39544; root mean square error of approximation (RMSEA) = 0.004; Bentler–Bonett non-normed fit index = 0.999; comparative fit index (CFI) = 0.999; CR = composite reliability; AVE = average variance extracted; ** p < 0.01.
Table 4. Correlations and discriminant validity of the scales associated with the model.
UseIntentions to usePerformance ExpectancyEffort ExpectancyFacilitating ConditionsHedonic MotivationsPrice-Saving OrientationHabitSocial InfluencePerceived Credibility
Use0.94 a
Intentions to use0.62 **b0.86
Performance Expectancy0.55 **0.72 **0.82
Effort Expectancy0.30 **0.60 **0.70 **0.85
Facilitating Conditions0.36 **0.64 **0.64 **0.74 **0.77
Hedonic Motivations0.57 **0.69 **0.63 **0.54 **0.52 **0.87
Price-Saving Orientation0.53 **0.76 **0.64 **0.55 **0.59 **0.68 **0.77
Habit0.71 **0.74 **0.61 **0.45 **0.43 **0.70 **0.64 **0.79
Social Influence0.52 **0.78 **0.75 **0.63 **0.66 **0.71 **0.68 **0.70 **0.81
Perceived Credibility0.22 **0.32 **0.37 **0.35 **0.22 **0.45 **0.34 **0.37 **0.36 **0.87
Notes. a Square root of the average variance is along the diagonal. ** p < 0.01. b Below the diagonal: the estimated correlation between the factors.
Table 5. Structural equation modeling (SEM) results (structural model).
HPathPath Coefficientt
H1Intentions to use → Use0.384.96 **
H2Performance Expectancy → Intentions to use0.1336.81 **
H3Effort Expectancy → Intentions to use0.1336.81 **
H4Facilitating Conditions → Use0.294.96 **
H5Facilitating Conditions → Intentions to use0.1136.81 **
H6Hedonic Motivation → Intentions to use0.1436.81 **
H7Price-Saving Orientation → Intentions to use0.1436.81 **
H8Habit → Intentions to use0.1836.81 **
H9Habit → Use0.454.96 **
H10Social Influence → Intentions to use0.1136.81 **
H11Perceived Credibility → Intentions to use0.1636.81 **
Notes. Fit of the model: chi-square (χ2) = 535.0924, df = 491, p = 0.08255; root mean square error of approximation (RMSEA) = 0.014; Bentler–Bonett non-normed fit index = 0.994; comparative fit index (CFI) = 0.995; ** p < 0.01.
Table 6. SEM results (moderating effects).
GenderAgeExperience
PathMen (597)Women (605)18–39 (605)Over 40 (597)3 Years or Less (484)More than 3 Years (718)
Intentions to use → Use0.400.360.380.380.330.41 *
Performance Expectancy→Intentions to use0.130.130.130.130.130.13
Effort Expectancy → Intentions to use0.140.130.130.130.130.12
Facilitating Conditions → Use0.290.290.340.290.190.38 **
Facilitating Conditions→Intentions to use0.110.120.130.100.110.10
Hedonic Motivation → Intentions to use0.140.140.140.140.140.15
Price-Saving Orientation→Intentions to use0.130.140.150.120.130.14
Habit → Intentions to use0.180.180.190.160.160.19
Habit → Use0.480.430.480.430.370.52 ***
Social Influence → Intentions to use0.110.110.100.110.110.11
Perceived Credibility → Intentions to use0.160.160.170.150.150.17
Notes. * ∆λ2 = 4.135, p = 0.04200; ** ∆λ2 = 4.132, p = 0.04207; *** ∆λ2 = 4.144, p = 0.04178. Bold numbers: significant results.

