1. Introduction
The continuous increase of the level of interconnection between businesses and customers at the global scale represents a crucial trend in our times. This interconnection is powered by the use of numerous online platforms and devices that help users communicate faster and easier. In these conditions, social responsibility and sustainable marketing communication become an important concern.
The integration of the concept of sustainability into marketing aims to obtain consumer attention and appreciation in the digital era. Sustainable marketing is not only meant to promote the product and increase profits, but also to create a positive change in society, in the sense of emotionally influencing the consumer to opt for responsible brands. If we examine the trends in online promotion, digital communication, and consumer behavior, it appears obvious that both brands and their customers are becoming more and more active in the online environment, especially in the social networks.
The literature that concerns the relationship between online marketing (particularly social media marketing) and sustainability is not very abundant at this moment. However, there are a few research papers that explore this field. An interesting cross-country study by [
1] approaches the relationship between social media involvement level and sustainable behaviors (recycling, eating organic foods, using energy-efficient transportation etc.). The study showed that social media plays a more prominent role in collectivistic cultures than in individualistic cultures, and different social media (Facebook and Twitter) appeal to different sustainable behavior motives. Millson [
2] shows that the intent to purchase technology-based products is influenced by both perceived environmental sustainability information and social media use to obtain technology-based product information. Regarding the social media, Ladeira and Mello [
3] note that it has the power of “transforming the social context into a better place to live, being associated with the meaning of sustainable marketing”.
Rajesh [
4] advances the idea that social media can be a platform for sustainability, because it delivers the information people need in order to make better buying decisions and empowers customers to demand quality and accountability from companies. Last but not least, Onete et al. [
5] show that social media plays an important role in the development of sustainable businesses (being an important marketing and customer relationship tool), while [
6] plead that social marketing is a concept related to sustainable development.
Social media is primarily a communication tool, where customers can share their comments and opinions about products and brands. Therefore, we are going to further discuss the concept of electronic word-of-mouth in social media.
The credibility offered by the personal recommendation of an unrewarded communicator underpins WOM (word of mouth) communication [
7]. Studies show that consumer choice is more strongly influenced by this form of communication than others [
8,
9]. WOM was researched for a long time to discover its drivers and main consequences [
10]. With the arrival of the Internet age customers became able to give and receive product-related advice in the online environment, which led to the birth of electronic word-of-mouth (eWOM) communication. The purpose of this article is to determine whether three important antecedents of traditional WOM—customer satisfaction, affective commitment, and high sacrifice commitment—are significant drivers of eWOM as well.
For several decades, WOM has expressed a simplistic conceptualization focusing especially on favorableness of communication [
11,
12,
13,
14]. The potential of the WOM construct has not been sufficiently studied [
11,
12,
14,
15,
16,
17]. Another shortcoming of the WOM research during the first decades was that it focused more on the WOM receiver and less on the WOM sender [
8,
11,
12,
15,
17,
18,
19,
20,
21]. According to the research, WOM has greatly influenced the choice of products and put less emphasis on the role of the sender of communication who plays a special role in promoting the organization [
17,
20,
22]. Other studies focused on how potential antecedents affect the behavior of the WOM sender [
11,
12,
13].
After the year 2000, an abundant quantity of eWOM studies has sprung up. Researchers started to thoroughly investigate the motives behind posting WOM messages in the online environment [
23,
24,
25], as well as the motives of seeking eWOM before making a buying decision [
26,
27]. Subramani and Rajagopalan [
28] shows that the choice of products and services is influenced and facilitated by eWOM, such as discussion communities and forums. Stauss [
29,
30] highlighted opportunities and threats emerging as a result of increased online information exchange, and [
31] investigated eWOM’s power of influence in choosing various products.
Research has shown that other sources of information on the Internet have lesser credibility and empathy for clients than eWOM [
32]. Customers’ behavior and attitudes are influenced by eWOM, and it can be manipulated by marketers due to the anonymity that the Internet offers, according to [
33]. The development of customer relationships is very important and has been valued by [
34,
35]. If a few years ago the purchasing decision was based on advertising and professional information, now one in three people often use eWOM information. Companies have understood this and have increased marketing budgets for the online area [
36]. Hung et al. [
37] show that social media could be a more appropriate platform for sustainable advertising and social campaigns through eWOM, rather than traditional commercial advertising and marketing.
A number of researchers have tried to devise appropriate WOM measures. Harrison-Walker [
38] proposes to understand WOM as a two-dimensional construct in which word-of-mouth activity combines with word-of-mouth praise. The volume shows the frequency with which people communicate WOM and the WOM valence refers to the type of positive or negative messages [
39]. These two dimensions also apply to eWOM. Studies show that positive reviews posted by customers favorably affect the demand for a particular product [
40]. These buying intentions are influenced not only by the quality of online reviews but especially by the quantity of them, offered by those who have the product [
41]. One of the most important eWOM drivers is the customer satisfaction or dissatisfaction. According to [
42] dissatisfied customers generate eWOM more consistently than satisfied. The proportion is 26% respondents dissatisfied with the products, compared to 23% satisfied customers who post on social media.
However, satisfaction is far from being the only eWOM antecedent. Hennig-Thurau [
23] studied the motivations of delivering eWOM in consumer-opinion platforms and extracts nine groups of motivations: platform assistance, venting negative feelings, concern for other customers, positive self-enhancement, social benefits, economic incentives, helping the company and advice seeking. Kreis and Gottschalk [
43] consider that three are three types of motives that determine the customer to articulate eWOM in the social media: content gratification (satisfying the need to convey informational content), social gratification (sending social signs—like expertise in the field, for example—to others) and process gratification (economic incentives, for instance). Santo-Serra and Soto-Sanfiel [
44] show that the main motivations of giving eWOM are needed for personal expression and the strengthening of social relationships, while the main gratification obtained by the eWOM senders are self-identity, social vigilance, and a sense of belonging.
In the model proposed by [
38], consumer engagement and quality of service are very important for WOM. The consumer’s commitment is made up of two components: affectivity and high-sacrifice. The affective commitment refers to the feelings of belonging and the attachment of the client to a service provider. High-sacrifice commitment develops because a customer perceives supplier change as an expensive process or does not determine an alternative supplier. Harrison–Walker’s research empirically validates a WOM communication measurement scale. It investigates the impact of customer engagement and perceived quality of service on both volume and valence of WOM. Harrison–Walker explains this finding by the differences between the two industries. Customers find it hard to appreciate the quality of veterinary services by their outcome (because they do not have the necessary expertise), so service quality becomes an important determinant of their WOM volume. On the contrary, in the hair salon industry customers can evaluate the services quality by their results. This is why service quality indicators are not very important for them, so they not influence their WOM activities very much.
In the next section we discuss the concept of customer satisfaction and the connection between satisfaction and eWOM.
1.1. eWOM and Sales
The impact of eWOM on retail sales was extensively studied during the last years [
45] demonstrates that the effect of eWOM volume and valence on product sales depends on product nature: mass or niche. Specifically, the effect of eWOM volume on sales is greater for mass products, while the effect of valence is greater for niche products. Zhang et al. [
46] have studied the impact of the online reviews on camera sales and found that a greater number of reviews and a greater review rating significantly improve sales, while [
47] showed that the average reviews rating have a positive effect on hotel bookings. It is also worth mentioning the research of [
48], which shows that the online review ratings for movies can predict the box office sales.
Chern et al. [
49] have created a sales forecasting model for consumer products based on the influence of online WOM. These authors introduce the concept of review influence curve, which accounts for the timeliness of the influence of online reviews (once they are posted, the reviews are usually available on the platform). The time limit of the influence is affected by two factors: product life cycle and number of reviews (eWOM volume). More recently, Hong et al. [
50] investigated the impact of online WOM on retail sales and divide the WOM sources into two categories: internal WOM (available on the sales platform) and external WOM (available on third party sources like social media websites, review platforms etc.). They proved that both internal and external eWOM volume are positively associated with sales, while review rating (eWOM valence) is positively correlated with sales in case of the positive ratings and negatively correlated with sales in case of negative ratings. Finally, Zhou and Duan [
51] showed that the software sales rank at Amazon is affected by two eWOM factors: number of reviews (volume) and rating (valence).
The role of eWOM volume and valence in influencing the online purchase behavior got a substantial attention in extant research. Liu and Ji [
52] showed that online customer purchase intention is positively associated with the perceived credibility and perceived usefulness of the online reviews. According to [
53], brand image is a mediator between eWOM and purchase intention. Positive eWOM leads to a better product image, which positively influences buying intention. Kudeshia and Kumar [
54] studied the social eWOM and proved that positive eWOM influences brand attitude and intention to purchase.
Heejae and Dahana [
55] show that the eWOM message valence influences the brand choice, and this relationship is moderated by two variables: prior brand attitude and message acceptance. According to these authors, subjects who receive positive/negative messages about a brand are more likely to choose/reject the brand if their prior attitude about the brand is positive/negative. Also, subjects who receive positive/negative messages about a brand are more likely to choose the brand if their intention to accept the message is high/low. Baker et al. [
56] built a complex model that assesses the influence of eWOM volume and valence on purchase intention. Their findings show that eWOM volume is positively associated with the purchase intention. As for the eWOM valence, it affects the purchase intention as follows: positive eWOM messages increase purchase intention, negative messages diminish purchase intention and mixed valence messages do not influence purchase intention.
According to [
57], reviews with a positive valence reduce the perceived purchase risk, which in turn improves the attitude towards purchasing and encourages the purchase intention. Purnawirawan et al. [
58] performed a meta-analytic investigation that showed that online review valence significantly influences five variables: review credibility, perceived review usefulness, attitude towards product, product recommendation intention, and product purchase intention. Erkan and Evans [
59] use the Technology Acceptance Model to study the influence of eWOM in social media on consumers’ purchase intention. As it results from these authors’ model, purchase intention is influenced by attitude towards information, information usefulness and information adoption. Langan et al. [
60] proved that the influence of review valence on purchase intention is moderated by the product nature (utilitarian or hedonic), brand equity and review source credibility.
In consequence, eWOM is a powerful driver of sales, since it diminishes the perceived purchase risk, increases the product credibility, and the customer purchase intention. This is why it is important to study the factors that could stimulate eWOM for the online retail companies. However, though there are a good number of studies that investigate the influences on the propensity to provide eWOM, there are very few papers that methodically approach the antecedents of eWOM volume and valence in the online retailing context. Knowing these antecedents can help us understand why e-retail customers give feedback in the social networks and how their feedback will likely be: favorable or unfavorable, complimentary or critical. In the following section we discuss two possible influencers of volume and valence: customer satisfaction and customer commitment.
1.2. Customer Satisfaction
Companies are traditionally interested in customer satisfaction, and with good reason. Customers will continue to purchase those products that they are satisfied with. Moreover, they will likely tell others about those products, thus influencing their brand perceptions and their buying decisions. Increasing consumer satisfaction is important in improving consumer retention rates, increased market share, and profitability [
61,
62,
63]. This is the reason why customer satisfaction has become an increasing emphasis of corporate strategy [
64].
A number of studies discuss the appropriate ways to measure satisfaction levels [
65,
66]. Others investigated the causes and sources of dissatisfaction [
67] and some addressed the theoretical bases of satisfaction [
68]. Richins [
69] examined the customers’ response to dissatisfaction using variables like the nature of the dissatisfaction, blame for the dissatisfaction and perceptions of retailer responsiveness.
As Azam et al. [
70] show, in e-commerce satisfaction is a critical predictor of the online purchase intention. These authors develop two constructs for measuring satisfaction in e-retail: information satisfaction (that comprises variables like website relevancy and understandability) and system satisfaction (that includes items like interface, security, navigability or personalization). Azam’s research comes to the conclusion that both information and system satisfaction are significant predictors of the overall e-retail customers’ satisfaction. According to [
71], the main determinants of the customer satisfaction in e-commerce are interface quality, information quality, perceived security, and perceived privacy. Necula et al. [
72] prove that e-commerce websites visitors’ satisfaction is influenced by quality of product description. He et al. [
73] propose a complex model of evaluating the satisfaction in e-retail. This model is composed by four indices: business index (that mainly concerns products quality and price), function index (related to the e-store functionality like speed, easy search capabilities etc.), service index (that regards fulfillment) and whole situation index (concerning the e-commerce platform image and popularity). The results of the above-mentioned authors confirm that satisfaction in e-commerce is strongly related to the quality of services, so it is reasonable to use it as a predictor variable in our adapted Harrison–Walker model.
Furthermore, as the study of [
39] shows, satisfaction is a sound predictor for the WOM and eWOM behavior. Halstead proved that the dissatisfied consumers engage in significantly more WOM behavior than satisfied consumers by telling more people about their negative experiences. Furthermore, satisfied customers deliver positive eWOM while dissatisfied customers generate negative eWOM. Other researchers, like [
74] sustain that the relationship between satisfaction and WOM is U-shaped. In consequence, the less satisfied customers are more likely to deliver WOM.
Mazzarol et al. [
75] show that while service quality and customer satisfaction are important antecedents of eWOM, they are not actually translated into eWOM unless some triggers and conditions are activated. These triggers are in fact moderators between satisfaction and WOM behavior. They could be a question from a friend or colleague, an associated word (brand or product type, for example) in a conversation, the desire to help a friend etc. Chung and Shin [
76] develop a model where the antecedents of satisfaction in e-commerce are the website characteristics, while the satisfaction is an antecedent for eWOM. The link between satisfaction and eWOM has also been established in the study of [
77].
Given the above-mentioned findings, we have formulated the hypotheses concerning the relationship between satisfaction and eWOM as follows:
H1: There is a negative relationship between satisfaction and eWOM volume.
H2: There is a positive relationship between satisfaction and eWOM valence.
Many extant studies show that gender is an important influencer of online communication habits. For example, Kimbrough [
78] found that women use mediated communication (including via social networks) more frequently than men. A more recent study performed by [
79] establishes that women are more likely to engage in online communication than men. Given these findings, we suspect that the inclination to engage in eWOM activities are different for men and women who experience the same satisfaction level. This is why we formulate the following hypothesis:
H1′: Gender moderates the relationship between satisfaction and eWOM volume.
Furthermore, there is research that proves that the quantity of eWOM provided by a social network user is influenced by usage intensity. The study of [
80] shows that people who have a great need for social interactions and use social networks very much engage more frequently in brand-related eWOM. Tsai and Men [
81] states that the consumer engagement in social media sites is determined, among other factors, by a factor called
social media dependency (in other words, the intensity of social media usage). In consequence, we have reasons to believe that Facebook intensity usage interferes in the relationship between satisfaction and eWOM. This led us to the following hypothesis:
H2′: Intensity of Facebook usage moderates the relationship between satisfaction and eWOM volume.
1.3. Customer Commitment
Customer commitment (or attachment) is other WOM antecedent considered in literature. Park and Kim [
41] define commitment as the strength of cognitive and emotional bond connecting the brand and the consumer. There are two different types of commitment: affective commitment, which is “a kind of emotional affection towards a commercial name or an organization” [
82], and high-sacrifice commitment (or cost-based commitment), which means that the customer stays in relation with a brand or organization, because either there are no better options, or switching to a better option involves a high cost [
83]. Maisam and Masha [
82] show that brand commitment positively influences WOM, while [
84] argue that the most important outcome of brand commitment is the intention to recommend the product to others.
Harrison-Walker [
38] hypothesized that affective commitment is positively related to WOM communication (both volume and valence dimensions), while high sacrifice commitment is not significantly related to WOM. In her paper she argues that people with high levels of affective commitment are motivated to engage in activities that help the company (like giving positive WOM, for instance). On the other hand, customers who passively remain with the company because of the switching costs only will not feel obliged to carry out such activities. Harrison-Walker’s findings confirmed all these research hypotheses.
Based on the previous results in literature, our hypotheses regarding the relationships between commitment and eWOM are expressed as follows:
H3: There is a positive relationship between affective commitment and eWOM volume.
H4: There is a positive relationship between affective commitment and eWOM valence.
H5: There is no relationship between high sacrifice commitment and eWOM volume.
H6: There is no relationship between high sacrifice commitment and eWOM valence.
The conceptual model that encompasses our eight hypotheses can be found in
Figure 1.
3. Results
Before building the Harrison–Walker model and testing our hypotheses, we had to investigate our constructs and test them for reliability and validity. First of all, we performed an exploratory factor analysis in IBM SPSS (version 21) to decide which items would be retained for each construct. At this stage we aimed to detect the items that highly correlated with two or more constructs (i.e. the important cross-loadings) as well as the items that correlated poorly with all the factors. As a result of the exploratory factor analysis, we have refined our measurement scales by removing all the cross-loadings and poor loadings. Twelve items out of forty were removed in total (two for the affective commitment, two for the high sacrifice commitment, four for the satisfaction, one for the eWOM volume and three for the eWOM valence), so twenty-eight items were retained for the next stage of the analysis. The Kaiser–Meyer–Olkin indicator for the EFA model was 0.887 and the Bartlett’s sphericity test was statistically significant (p < 0.01). In conclusion, our model presented a very good sampling adequacy.
At the second stage of our research we performed a confirmatory factor analysis in IBM Amos (version 21) in order to test the relationships between each construct and its retained items. Five constructs and twenty-eight individual items were included in this model. The cutoff values we used to assess the goodness-of-fit for our model were: for the root mean square error of approximation (RMSEA)—0.08 [
88], for the comparative fit index (CFI)—0.900 [
89], for the Tuckey–Lewis index (TLI)—0.900 [
89], for the standardized root mean square residual (SRMR)—0.08, for the χ2/df ratio—between 1 and 5 [
88]. The main indicators of our measurement model are summarized in
Table 1. The first column of this table contains the inventory of our five constructs. For each individual item, the standardized path loading (regression coefficient), the t value, and the standard error are presented. Also, for each construct the Cronbach’s alpha, the composite reliability, and the average variance extracted (AVE) are reported in the
Table 1.
All the path loadings are statistically significant (t > 1.96), which means that the constructs are well explained by their underlying items. For all the constructs, the Cronbach’s alpha values and the composite reliabilities are greater than 0.70, indicating a good internal consistency. Furthermore, our constructs present a good convergent validity—the average variance extracted (AVE) are greater than 0.50. In order to assess the discriminant validity, we have compared the average variance extracted with the construct squared correlations (see
Table 2). Overall, the average variance extracted is greater than the squared correlations, which represents a good discriminant validity.
The main diagonal contains the average extracted values (AVE), while the off-diagonal figures represent the squared correlations between the latent variables (constructs).
The goodness-of-fit indicators for the measurement model above are: χ2(509) = 795.881, p < 0.01, χ2/df = 1.564, RMSEA = 0.045, CFI = 0.942, TLI = 0.937, SRMR = 0.066. In consequence, our model is a very good fit.
The following stage of our analysis consisted of creating the causal (structural) model to check the hypotheses H1-H6. The causal model was investigated through a path analysis conducted with the IBM Amos software (version 21). The goodness-of-fit indicators of this model are: χ2(341) = 744.401,
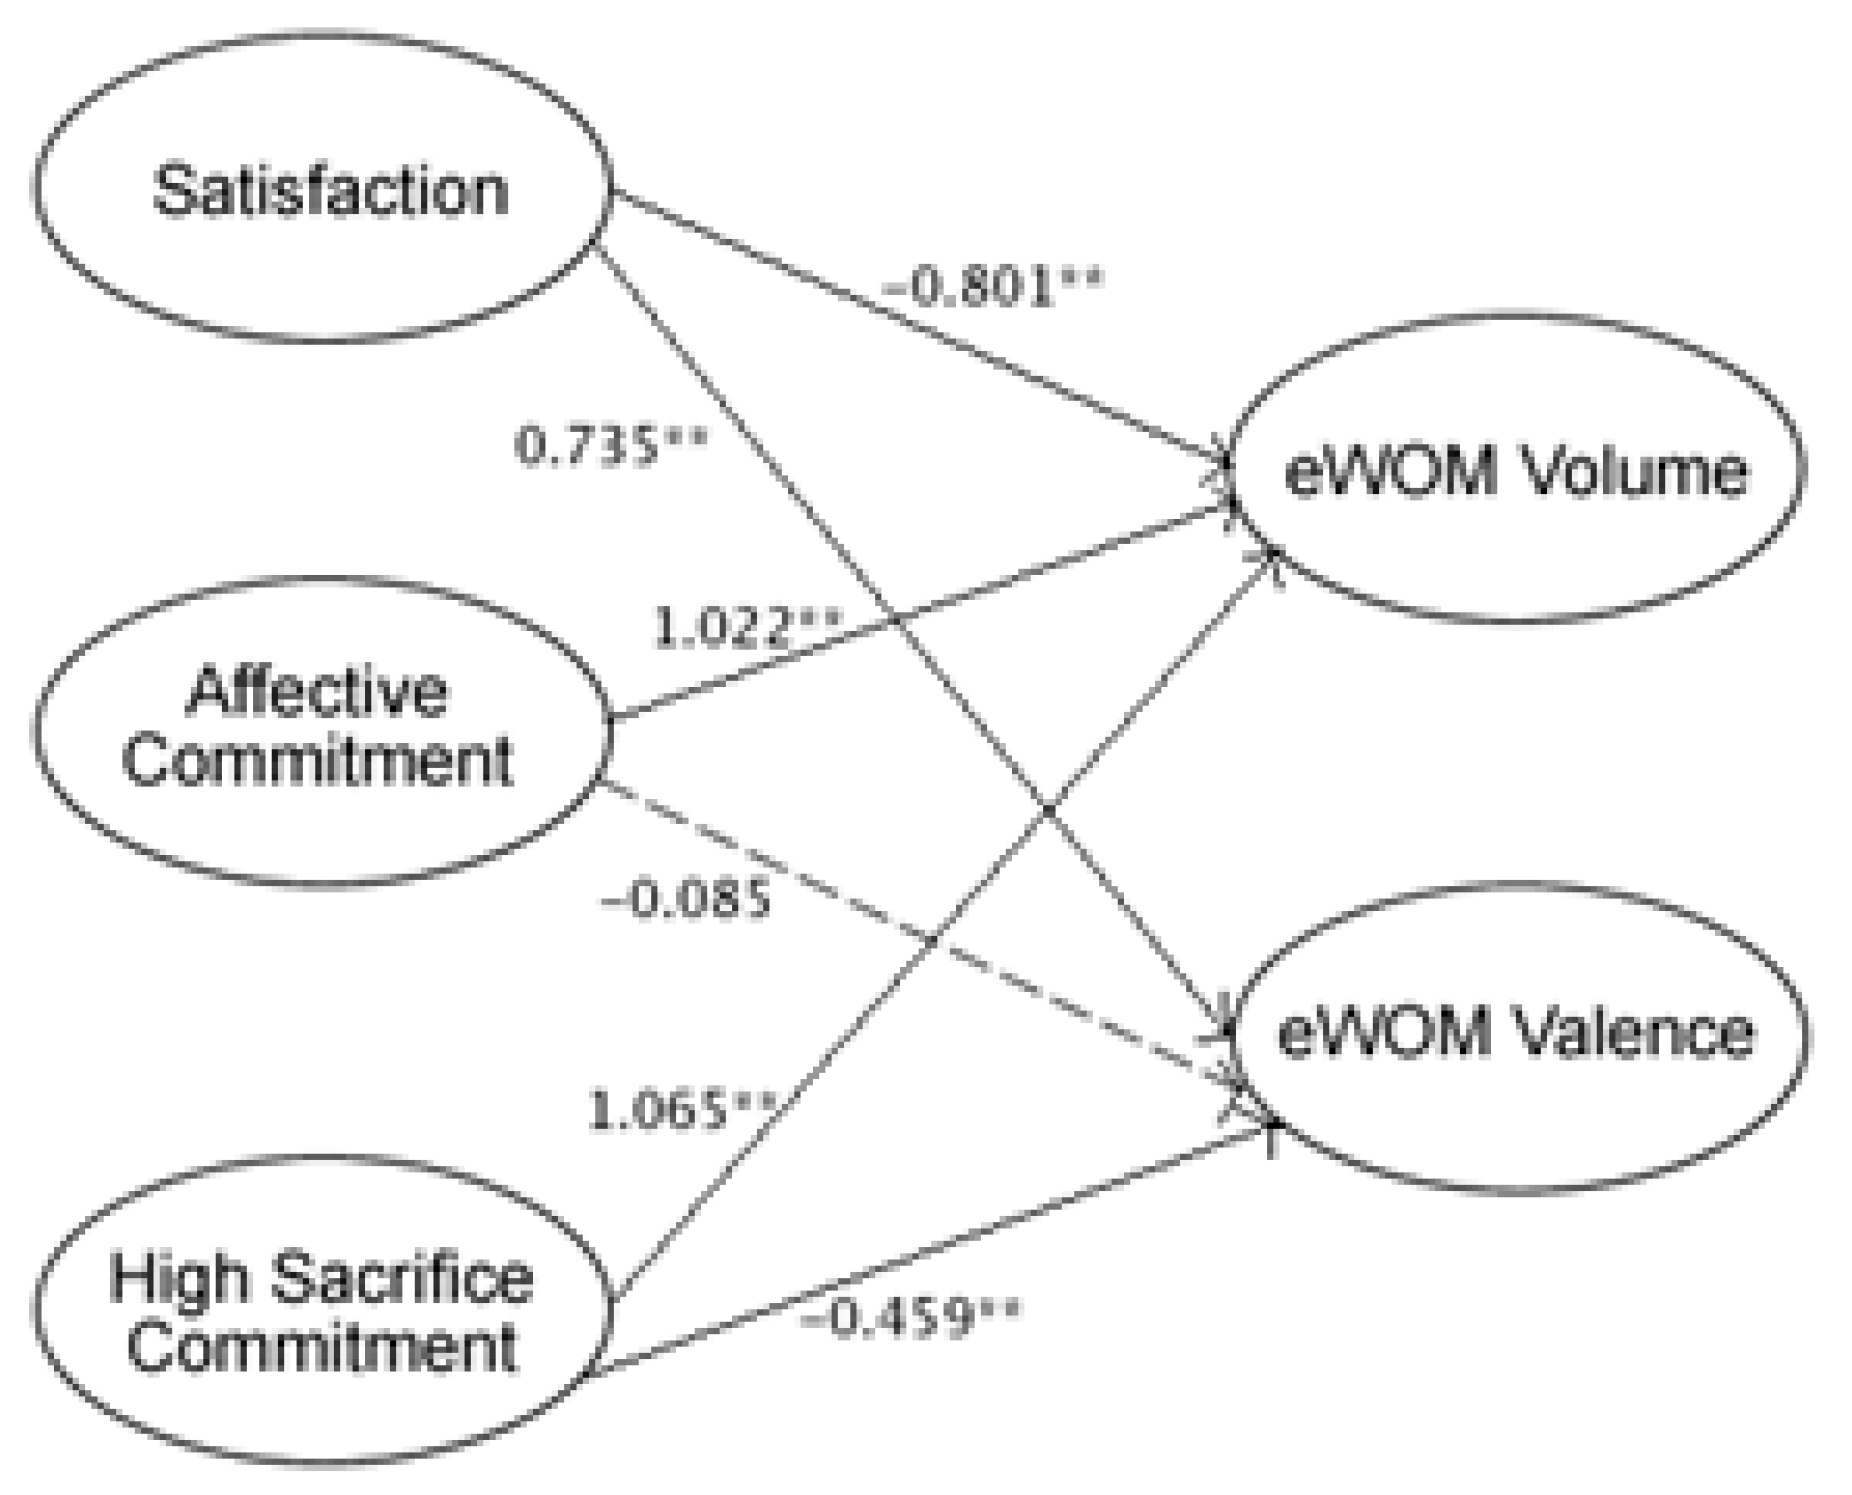
p < 0.01, χ2/df = 2.184, RMSEA = 0.065, CFI = 0.912, TLI = 0.902, SRMR = 0.068. All the indicators meet the cutoff values, suggesting a good model fit. The tested model is presented in
Figure 2 and path loadings (coefficients) for this model are shown in
Table 3.
Three of our hypotheses are not supported: H2, H5, and H6. In conclusion, affective commitment does not influence the eWOM valence, while high sacrifice commitment does influence both eWOM volume and eWOM valence. As for the hypotheses H1, H3, and H4, they are fully supported.
In the last stage of our research we have tested the hypotheses H1′ and H2′, regarding the moderating effects of the variables gender and Facebook usage intensity in the relationship between satisfaction and eWOM volume. To assess the moderating effects we have used the procedure described by [
90]. We are going to present it for each variable separately.
To analyze the effect of the variable gender, we have divided our data set into two subsets based on its categories: male and female. For each subset we have tested two models: a constrained model (where the coefficient of the path of interest was constrained to 1) and an unconstrained model. Afterwards we have computed the difference in chi-square between the two models. The moderation effect is significant if the difference is greater than 3.84 (the value of chi-square for one degree of freedom) in both subsets. The results of this analysis are shown in
Table 4.
The difference in chi-square between the constrained and unconstrained model is higher than 3.84 in both subsets. In consequence, the moderation effect of gender is statistically significant, so the hypothesis H1′ is supported.
Table 5 presents the coefficients of our path of interest (satisfaction—eWOM volume) in both male and female groups.
A similar procedure was executed to study the moderating effect of Facebook usage intensity. An aggregated Facebook usage score was computed for each respondent, by averaging the individual item scores. Next, the data set was split into two subsets based on the values of the aggregated score: low Facebook usage (the scores below the median) and high Facebook usage (the scores above the median). For each subset, a constrained and an unconstrained model were tested and the difference in chi-square between these models was computed. The results are presented in
Table 6.
The moderating effect of Facebook usage is significant, because the chi-square differences are greater than 3.84 in both subsets. In conclusion, the hypothesis H2′ is supported. The path coefficients in the two groups can be found in
Table 7.
4. Discussion
The results of the analysis show that our variables of study—customer satisfaction and commitment—have an important influence on both eWOM volume and eWOM valence. The affective commitment positively influences the eWOM volume (B = 1.022). This result can be easily explained: customers who like an online store and want to help it achieve its goals will strive to spread the word about that store to their Facebook friends. Thus they will not miss the opportunities to share information about the store, because this is a way to reward the company for their good experiences.
However, the affective commitment has no significant impact on the eWOM valence (B = −0.085, p = 0.715). At a first glance, this result is very surprising. It suggests that customers with high levels of affective commitment can spread both positive and negative word-of-mouth on Facebook, which is contradictory (why would people who really like the store post adverse comments about it?). We find the explanation if we look closely at the relationship between satisfaction and eWOM valence on the one hand, and satisfaction and affective commitment on the other hand. Satisfaction has a strong positive influence on the eWOM valence (B = 0.735, p < 0.001), while there is a medium correlation between satisfaction and affective commitment (r = 0.562). Therefore, satisfaction seems to be a confounding variable in our model: since it is correlated with both affective commitment and eWOM valence, it reduces the importance of the relationship between them. In conclusion, most of the satisfied customers develop high levels of affective commitment in time and give the store positive WOM.
Furthermore, we notice the negative relationship between satisfaction and eWOM volume (B = −0.801,
p = 0.002). This means that dissatisfied customers are more engaged in word-of-mouth than satisfied customers, both offline and online. Therefore chances are the angry customers will share their nuisances on Facebook (to vent their negative feelings), while most of the happy customers will rarely talk about their positive experiences with the online store. This result is consistent with those obtained by [
91]. According to this author, the connection between satisfaction and WOM volume depends on the type of the encounter with the service provider. Lang shows that there are two types of encounters: EAI (enduring, affectively charged and intimate) and BRD (brief, rational and distant). In the first case the relationship between satisfaction and WOM is positive (i.e. more satisfaction engenders more WOM volume), while in the second case it is negative (i.e. less satisfaction engenders more WOM volume). In the e-commerce industry, the type of encounter belongs to the BRD category (it is a short term encounter with low emotional involvement and great physical distance between parties). This explains why the relationship between satisfaction level and eWOM volume is negative, as our model demonstrates.
Our research shows that the relationship between satisfaction and eWOM volume is moderated by gender and intensity of Facebook usage. In the male respondents group, the path coefficient is statistically significant and has a large magnitude (B = −5.095,
p = 0.010). However, in the female respondents group the coefficient is not significant (
p = 0.149). This denotes that male customers tend to react strongly on Facebook in case of dissatisfaction, by spreading negative eWOM about a product that disappointed them. It is less likely that they will talk about the products or brands they are happy with. For the female customers, on the other hand, the tendency to provide eWOM on Facebook does not seem to be influenced by satisfaction. As [
92] asserts, women are relationship-oriented, so they look to connect and communicate with other people (especially women). This could explain why they are more likely to engage in eWOM. For men, on the other hand, communication should have a clear purpose, so they use it mainly to solve their problems. This may be the reason why male customers generate eWOM only when they are unsatisfied with a product.
Intensity of Facebook usage also influences the strength of association between satisfaction and eWOM volume. In the low usage group, satisfaction is an important determinant of the intention to provide eWOM, the relationship being negative (B = −1.069, p = 0.028). Thus for people who are not passionate Facebook fans, the main reason why they use this network to spread the word about brands is dissatisfaction. They will probably not bother to write a post about a product they liked. In the high usage group, the relationship satisfaction and eWOM volume is not significant (p = 0.083). In consequence, customers in this group may post about their experiences with product irrespective of whether they were satisfied or not. They behave like this because Facebook plays an important role in their life: they use it to communicate with peers about practically everything, including brands, products, stores and so on. Hence, their key driver to post comments about products is not satisfaction (or lack thereof), but pleasure to interact with others on Facebook. Contrary to the hypotheses H5 and H6, our findings show that high sacrifice commitment influences both eWOM volume and eWOM valence. The influence is positive for the eWOM volume (B = 1.065, p < 0.001) and negative for the eWOM valence (B = −0.459, p < 0.001). In consequence, people with big levels of high sacrifice commitment will provide greater amounts of eWOM, but most of this eWOM will be negative (unfavorable). The customers who are not satisfied with the online store but passively stay with it (because they do not see a better choice or because it would be very hard for them to switch) will likely go in the social networks to express their frustrations.
Our findings concerning the hypotheses H5 and H6 could be explained in the light of the results obtained by [
93]. These authors show that the primary drivers for the online WOM are social, functional, and emotional, in this order of importance. Therefore in the online environment, eWOM is significantly influenced by the high sacrifice commitment, which is a behavioral dimension. Facebook members provide word-of-mouth not only to express their satisfaction or dissatisfaction, but also to fulfill their desire to socialize and belong (social purpose) and to inform their peers about brands (functional purpose). This can explain why many customers who are forced to stay with an online store (without necessarily being satisfied about it) will express their displeasure and annoyance on Facebook.
As a conclusion, we could say that the biggest amount of positive electronic word-of-mouth for an online store is generated by people who are involved with the store, who have a special relationship with it. These people are loyal customers and become passionate “supporters” of the store on Facebook. On the other hand, the biggest quantity of negative word-of-mouth online comes from dissatisfied customers that either stopped buying from the store, or continue to buy because it would be difficult for them to make a change.
Limitations and Further Research
The first important limitation of this research is due to the fact that we have used a convenience sample (since it was impossible to get a list of our population of study and perform a random sampling). Another limitation results from the fact that our sample consisted of students only. These two limitations could somewhat affect the generalizability of our results. Though students are a good target for studies like ours (because they are very active in the social media and are used to buying from online stores), future research could aim to investigate other categories of the population in terms of age, profession or social status.
Another notable limitation is due to the fact that we have used the survey-based design to collect our data. Unlike the experiment, the survey gathers all data at the same time, so it is harder to demonstrate that the causes (predictors) precede the consequences (dependent variables). As a result, we cannot fully prove the causal relationship between commitment and satisfaction, on the one hand, and eWOM on the other hand. However, it is reasonable to consider that customer satisfaction and commitment go before eWOM and influence the eWOM behavior. Thus, this limitation does not affect the validity of our study.
Besides, our research is limited to the study of the word-of-mouth for the online store. Further research should investigate if our hypotheses hold true for other types of online businesses, especially for services. Finally, it might be interesting to study whether the relationship between eWOM and its antecedents is affected by moderating variables like attitude towards Facebook or perception towards online shopping.
5. Conclusions
As our findings show, the model we have created is suitable for the e-commerce industry. Satisfaction, affective commitment, and high sacrifice commitment are good eWOM predictors.
Satisfaction influences both eWOM volume and eWOM valence. The unsatisfied customers are much more inclined to provide eWOM, but their posts and comments will be negative (unfavorable). As a consequence, the e-commerce companies face the risk that the amount of negative eWOM is greater than the amount of positive eWOM (since angry customers tend to be more vocal on Facebook). Our results indicate that especially male customers are very prone to express their displeasure with bad products. Also, people who are not intense Facebook users are more likely to generate negative eWOM when they are unhappy with a product or brand. This is why marketing managers should intelligently generate positive eWOM on the one hand, and reduce the volume of negative eWOM, on the other hand. A good way to produce positive eWOM is to encourage satisfied customers to talk about their experiences online. E-retailers should ask for referrals and testimonials from the happy customers (especially those who are heavy social media users) and spread them in the social networks. Another way to create favorable eWOM is to seek individuals who are opinion leaders in various product categories. The opinion leaders are particularly useful, because they convey their messages frequently to a big number of people (friends, fans, or followers), which greatly increases the eWOM strength and efficiency. The company should recognize these advocates and reward them.
Every online retailer should have a social media plan in order to stimulate eWOM and maintain a positive company image. Creating engaging social media content and urging people to share it is another efficient method to engender a great volume of positive eWOM.
Ecommerce companies should also prevent negative eWOM as much as possible. There are several ways to accomplish this: make it easy to contact the company (so the unhappy customers can complain and expose their issues), take responsibility for the customers’ negative experiences, have effective customer support and solve these problems quickly, issue refunds (within reason) to customers who ask for them. Providing customers with a community (forum) where they can complain may be a good idea: it makes it less likely that they will complain in the social networks.
As our model shows, the most important antecedent of eWOM valence is customer satisfaction (or dissatisfaction). In conclusion, the best way to counteract negative eWOM is to commit with customer satisfaction and give customers very few reasons to complain.
The affective commitment strongly influences the eWOM volume, but its influence on the eWOM valence is less visible, because of the confounding effect of satisfaction. The most interesting results of our research concern the relationship between high sacrifice commitment and eWOM in the e-retail space. While in the offline world the high sacrifice commitment does not affect the WOM behavior, in e-commerce it has an important influence on both eWOM volume and eWOM valence. Lovett’s findings [
93] offer a consistent explanation of this fact. According to this author, in the online environment people provide eWOM not only because they are emotionally engaged with the company, but also for social and functional reasons. Thus a customer with high levels of high sacrifice commitment (i.e. those who are “trapped” in a relationship with an e-store) develop social and practical motivations to spread negative messages on Facebook: they warn their peers to stay away from that store, seek revenge upon the store for its poor performance or talk with other people in their community. Given these facts, it is critical that e-tailing companies watch the conversations about the company (using the specialized tools available online) and respond to negative feedback by acknowledging the problems and explaining how the company is going to fix them.
In consequence, e-retailers should attentively monitor both customer satisfaction and their online reputation, to make sure that customers buy from them because they are actually happy, not because they have no other choice [
94]. Discontented customers that cannot switch to other e-stores may become transmitters of a large amount of negative eWOM that might seriously damage the company bottom line.


