LDA-Based Model for Defect Management in Residential Buildings

Abstract
:1. Introduction
2. Literature Review
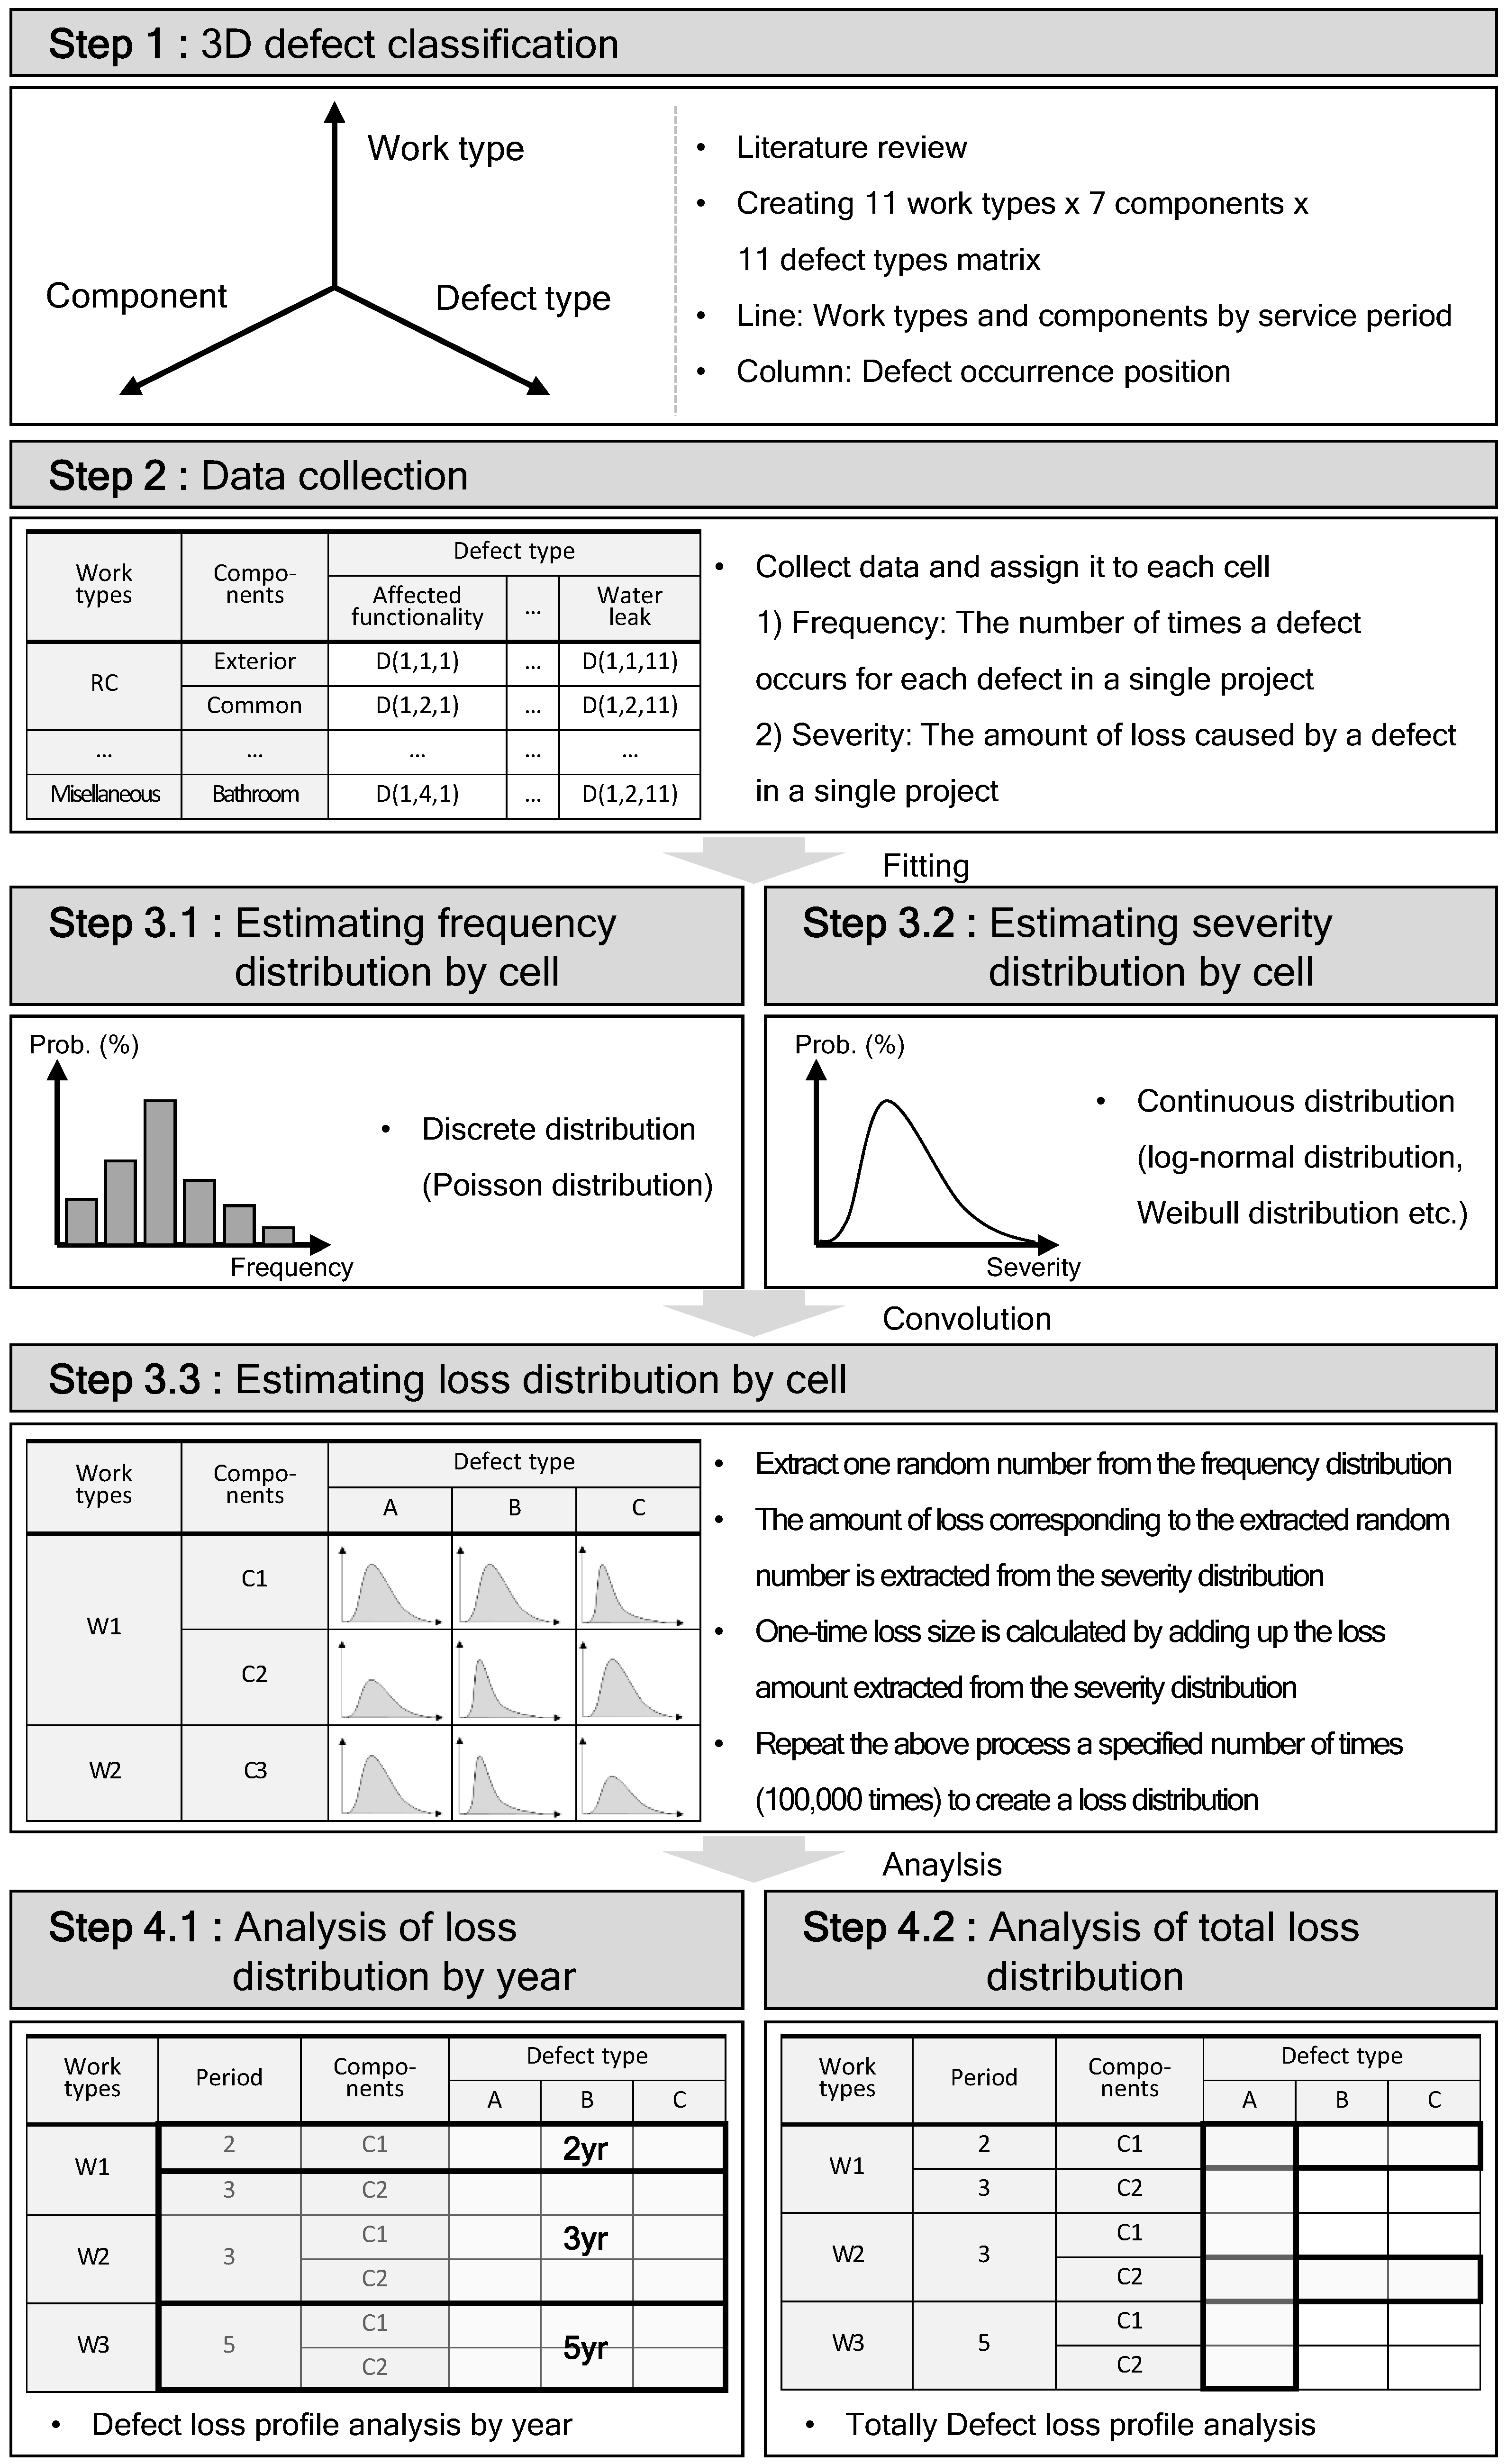
3. Materials and Method
4. Analysis
4.1. Data Collection and Setting the 3D Defect Classification
4.2. Estimating Loss Distributions by the Cell
5. Discussion and Conclusions
Author Contributions
Funding
Conflicts of Interest
References
- Raslanas, S.; Alchimoviene, J.; Banaitiene, N. Residential areas with apartment houses: Analysis of the condition of buildings, planning issues, retrofit strategies and scenarios. Int. J. Strat. Property Manag. 2011, 15, 158–172. [Google Scholar] [CrossRef] [Green Version]
- Yuen, B.; Yeh, A.; Appold, S.J.; Earl, G.; Ting, J.; Kwee, L.K. High-rise living in Singapore public housing. Urban Stud. 2006, 43, 583–600. [Google Scholar] [CrossRef]
- Sacks, R.; Goldin, M. Lean Management Model for Construction of High-Rise Apartment Buildings. J. Construct. Eng. Manag. 2007, 133, 374–384. [Google Scholar] [CrossRef]
- Josephson, P.E.; Hammarlund, Y. The causes and costs of defects in construction: A study of seven building projects. Autom. Construct. 1999, 8, 681–687. [Google Scholar] [CrossRef]
- Kim, J.H.; Go, S.S. Evaluation of defective risk for the finishing work of apartment house. Korean J. Constr. Eng. Manag. 2012, 13, 63–70. [Google Scholar] [CrossRef] [Green Version]
- Kim, Y.S.; Oh, S.W.; Cho, Y.K.; Seo, J.W. A PDA and wireless web-integrated system for quality inspection and defect management of apartment housing projects. Autom. Construct. 2008, 17, 163–179. [Google Scholar] [CrossRef]
- Jang, H.S.; Seo, C.H. A Study on the Improvement of Defect Information Management System of Apartment House. J. Korea Inst. Build. Constr. 2010, 10, 115–123. [Google Scholar] [CrossRef] [Green Version]
- Kang, I.; Shu, D.S.; Ann, K.S. A study on the optimum defect management system of apartment house in Korea. JAIK 1997, 13, 343–353. [Google Scholar]
- Craig, N.; Sommerville, J.; Auchterlounie, T. Customer satisfaction and snagging in the UK private house building sector. In Proceedings of the 26th Annual ARCOM Conference, Leeds, UK, 6–8 September 2010; Egbu, C., Ed.; Association of Researchers in Construction Management: Leeds, UK, 2010; pp. 1199–1208. Available online: http://www.arcom.ac.uk/-docs/proceedings/ar2010-1199-1208_Craig_Sommerville_and_Auchterlounie.pdf (accessed on 6 May 2019).
- Cooper, I. Post-occupancy evaluation—Where are you? Build. Res. Inform. 2001, 29, 158–163. [Google Scholar] [CrossRef]
- de Silva, N.; Dulaimi, M.F.; Ling, F.Y.Y.; Ofori, G. Improving the maintainability of buildings in Singapore. Build. Environ. 2004, 39, 1243–1251. [Google Scholar] [CrossRef]
- Davey, C.L.; McDonald, J.; Lowe, D.; Duff, R.; Powell, J.A.; Powell, J.E. Defects liability management by design. Build. Res. Inform. 2006, 34, 145–153. [Google Scholar] [CrossRef]
- Forcada, N.; Macarulla, M.; Fuertes, A.; Casals, M.; Gangolells, M.; Roca, X. Influence of building type on post-handover defects in housing. J. Perform. Constr. Fac. 2012, 26, 433–440. [Google Scholar] [CrossRef]
- Aljassmi, H.; Han, S. Analysis of Causes of Construction Defects Using Fault Trees and Risk Importance Measures. J. Construct. Eng. Manag. 2013, 139, 870–880. [Google Scholar] [CrossRef]
- Mills, A.; Love, P.E.D.; Williams, P. Defect costs in residential construction. Korean J. Constr. Eng. Manag. 2009, 135, 12–16. [Google Scholar] [CrossRef]
- Forcada, N.; Macarulla, M.; Love, P.E.D. Assessment of residential defects at post-handover. J. Construct. Eng. Manag. 2013, 139, 372–378. [Google Scholar] [CrossRef]
- Forcada, N.; Macarulla, M.; Gangolells, M.; Casals, M.; Fuertes, A.; Roca, X. Post-handover housing defects: Sources and origins. J. Perform. Constr. Fac. 2013, 27, 756–762. [Google Scholar] [CrossRef]
- Pan, W.; Thomas, R. Defects and Their Influencing Factors of Post handover New-Build Homes. J. Perform. Constr. Fac. 2015, 29, 04014119. [Google Scholar] [CrossRef]
- Watt, D.S. Building Pathology: Principles and Practice; Blackwell Science: Oxford UK, 1999. [Google Scholar]
- Seo, D.S.; Park, J.M. Analysis of Consulting Reports on Defect Disputes in Apartment Building. J. Korea Inst. Build. Constr. 2013, 13, 498–505. [Google Scholar] [CrossRef] [Green Version]
- Ishak, S.N.H.; Chohan, A.H.; Ramly, A. Implications of design deficiency on building maintenance at post-occupational stage. J. Build. Apprais. 2007, 3, 115–124. [Google Scholar] [CrossRef] [Green Version]
- Macarulla, M.; Forcada, N.; Casals, M.; Gangolells, M.; Fuertes, A.; Roca, X. Standardizing Housing Defects: Classification, Validation, and Benefits. J. Construct. Eng. Manag. 2013, 139, 968–976. [Google Scholar] [CrossRef]
- Georgiou, J. Verification of a building defect classification system for housing. Struct. Surv. 2010, 28, 370–383. [Google Scholar] [CrossRef]
- Rotimi, F.E.; Tookey, J.; Rotimi, J.O. Evaluating Defect Reporting in New Residential Buildings in New Zealand. Buildings 2015, 5, 39–55. [Google Scholar] [CrossRef]
- Atkinson, A.R. The pathology of building defects; a human error approach. Eng. Construct. Architect. Manag. 2002, 9, 53–61. [Google Scholar] [CrossRef]
- Minato, T. Representing causal mechanism of defective designs: A system apoach considering human errors. Construct. Manag. Econ. 2003, 21, 297–305. [Google Scholar] [CrossRef]
- Chong, W.K.; Low, S.P. Latent Building Defects: Causes and Design Strategies to Prevent Them. J. Perform. Constr. Fac. 2006, 20, 213–221. [Google Scholar] [CrossRef] [Green Version]
- Bortolini, R.; Forcada, N. Building Inspection System for Evaluating the Technical Performance of Existing Buildings. J. Perform. Constr. Fac. 2018, 32, 04018073. [Google Scholar] [CrossRef]
- Lee, J. Value Engineering for Defect Prevention on Building Façade. J. Construct. Eng. Manag. 2018, 144, 04018069. [Google Scholar] [CrossRef]
- Chong, W.K.; Low, S.P. Assessment of defects at construction and occupancy stages. J. Perform. Constr. Fac. 2005, 19, 283–289. [Google Scholar] [CrossRef]
- Hughes, W.; Hillebrandt, P.; Murdoch, J. The impact of contract duration on the cost of cash retention. Construct. Manag. Econ. 2000, 18, 11–14. [Google Scholar] [CrossRef]
- Hopkin, T.; Lu, S.L.; Rogers, P.; Sexton, M. Detecting defects in the UK new-build housing sector: A learning perspective. Construct. Manag. Econ. 2016, 34, 35–45. [Google Scholar] [CrossRef]


| Defect Classification | Description | Writer(s) |
|---|---|---|
| Affected functionality | Materials/components that must be replaced because its functionality is completely affected. Materials/components that must be repaired but not necessarily replaced because its functionality is partially affected. | Forcada et al. (2013), Forcada et al. (2013), Macarulla et al. (2013), Rotimi et al. (2015) [16,17,22,24] |
| Broken | Materials/components physically and forcibly separated into pieces or split. | Forcada et al. (2013), Forcada et al. (2013), Macarulla et al. (2013), Georgiou et al. (2010), Rotimi et al. (2015), Chong et al. (2006), Chong et al. (2005) [16,17,22,23,24,27,30] |
| Corrosion | All defects caused by living beings as molds. Corrosion of metals or the carbonation of concrete. | Macarulla et al. (2013), Rotimi et al. (2015) [22,24] |
| Crack | Cracks in construction elements. | Forcada et al. (2013), Macarulla et al. (2013), Rotimi et al. (2015), Chong et al. (2005) [16,22,24,30] |
| Detachment | Materials/components that are not fixed in their position. | Forcada et al. (2013), Forcada et al. (2013), Macarulla et al. (2013), Rotimi et al. (2015), Chong et al. (2006), Chong et al. (2005) [16,17,22,24,27,30] |
| Incorrect installation | Materials/components are not well positioned or do not satisfy project specifications or do not have the characteristics they should. | Forcada et al. (2013), Forcada et al. (2013), Macarulla et al. (2013), Rotimi et al. (2015) [16,17,22,24] |
| Missingtask | Works that are not completed/done, although the project or specifications are supposed to be collocated or completed/done. | Forcada et al. (2013), Forcada et al. (2013), Macarulla et al. (2013) [16,17,22] |
| Surface appearance | Protuberance on a level surface. Opposite effect to a bump. Surface uneven or uniform e.g., in shape or texture, an uneven color, uneven ground, uneven margins, wood with an uneven grain. The result of a collision or abrasion. Surface with a powdery deposit caused by the evaporation of water when there is a certain level of dissolved salts. | Forcada et al. (2013), Forcada et al. (2013), Macarulla et al. (2013), Rotimi et al. (2015), Chong et al. (2006), Chong et al. (2005) [16,17,22,24] |
| Excess moisture | Wetness caused by moisture, including rising dampness. Penetration damp and condensation. | Forcada et al. (2013), Forcada et al. (2013), Macarulla et al. (2013), [16,17,22] |
| Entrapped water | Water that does not drain. | Macarulla et al. (2013) [22] |
| Water leak | Defects related to water that seeps through walls, slabs, roofs, etc. | Forcada et al. (2013), Forcada et al. (2013), Macarulla et al. (2013), Chong et al. (2005) [16,17,22,30] |
| Work Types a (Liability Period) | Locations b | Defects c | ||||||||||
|---|---|---|---|---|---|---|---|---|---|---|---|---|
| Af | Br | Co | Cr | De | Ii | Mt | Sa | Em | Ew | Wl | ||
| Rc (3) | Ex | d(1,1,1) | d(1,1,2) | d(1,1,3) | d(1,1,4) | d(1,1,5) | d(1,1,6) | d(1,1,7) | d(1,1,8) | d(1,1,9) | d(1,1,10) | d(1,1,11) |
| Ca | d(1,2,1) | d(1,2,2) | d(1,2,3) | d(1,2,4) | d(1,2,5) | d(1,2,6) | d(1,2,7) | d(1,2,8) | d(1,2,9) | d(1,2,10) | d(1,2,11) | |
| Ga | d(1,3,1) | d(1,3,2) | d(1,3,3) | d(1,3,4) | d(1,3,5) | d(1,3,6) | d(1,3,7) | d(1,3,8) | d(1,3,9) | d(1,3,10) | d(1,3,11) | |
| Hc | d(1,4,1) | d(1,4,2) | d(1,4,3) | d(1,4,4) | d(1,4,5) | d(1,4,6) | d(1,4,7) | d(1,4,8) | d(1,4,9) | d(1,4,10) | d(1,4,11) | |
| Ba | d(1,5,1) | d(1,5,2) | d(1,5,3) | d(1,5,4) | d(1,5,5) | d(1,5,6) | d(1,5,7) | d(1,5,8) | d(1,5,9) | d(1,5,10) | d(1,5,11) | |
| Re | d(1,6,1) | d(1,6,2) | d(1,6,3) | d(1,6,4) | d(1,6,5) | d(1,6,6) | d(1,6,7) | d(1,6,8) | d(1,6,9) | d(1,6,10) | d(1,6,11) | |
| Bk | d(1,7,1) | d(1,7,2) | d(1,7,3) | d(1,7,4) | d(1,7,5) | d(1,7,6) | d(1,7,7) | d(1,7,8) | d(1,7,9) | d(1,7,10) | d(1,7,11) | |
| Rc (5) | Ex | d(2,1,1) | d(2,1,2) | d(2,1,3) | d(2,1,4) | d(2,1,5) | d(2,1,6) | d(2,1,7) | d(2,1,8) | d(2,1,9) | d(2,1,10) | d(2,1,11) |
| Ca | d(2,2,1) | d(2,2,2) | d(2,2,3) | d(2,2,4) | d(2,2,5) | d(2,2,6) | d(2,2,7) | d(2,2,8) | d(2,2,9) | d(2,2,10) | d(2,2,11) | |
| Ga | d(2,3,1) | d(2,3,2) | d(2,3,3) | d(2,3,4) | d(2,3,5) | d(2,3,6) | d(2,3,7) | d(2,3,8) | d(2,3,9) | d(2,3,10) | d(2,3,11) | |
| Hc | d(2,4,1) | d(2,4,2) | d(2,4,3) | d(2,4,4) | d(2,4,5) | d(2,4,6) | d(2,4,7) | d(2,4,8) | d(2,4,9) | d(2,4,10) | d(2,4,11) | |
| Ba | d(2,5,1) | d(2,5,2) | d(2,5,3) | d(2,5,4) | d(2,5,5) | d(2,5,6) | d(2,5,7) | d(2,5,8) | d(2,5,9) | d(2,5,10) | d(2,5,11) | |
| Re | d(2,6,1) | d(2,6,2) | d(2,6,3) | d(2,6,4) | d(2,6,5) | d(2,6,6) | d(2,6,7) | d(2,6,8) | d(2,6,9) | d(2,6,10) | d(2,6,11) | |
| Bk | d(2,7,1) | d(2,7,2) | d(2,7,3) | d(2,7,4) | d(2,7,5) | d(2,7,6) | d(2,7,7) | d(2,7,8) | d(2,7,9) | d(2,7,10) | d(2,7,11) | |
| Rc (10) | Ex | d(3,1,1) | d(3,1,2) | d(3,1,3) | d(3,1,4) | d(3,1,5) | d(3,1,6) | d(3,1,7) | d(3,1,8) | d(3,1,9) | d(3,1,10) | d(3,1,11) |
| Ca | d(3,2,1) | d(3,2,2) | d(3,2,3) | d(3,2,4) | d(3,2,5) | d(3,2,6) | d(3,2,7) | d(3,2,8) | d(3,2,9) | d(3,2,10) | d(3,2,11) | |
| Ga | d(3,3,1) | d(3,3,2) | d(3,3,3) | d(3,3,4) | d(3,3,5) | d(3,3,6) | d(3,3,7) | d(3,3,8) | d(3,3,9) | d(3,3,10) | d(3,3,11) | |
| Hc | d(3,4,1) | d(3,4,2) | d(3,4,3) | d(3,4,4) | d(3,4,5) | d(3,4,6) | d(3,4,7) | d(3,4,8) | d(3,4,9) | d(3,4,10) | d(3,4,11) | |
| Ba | d(3,5,1) | d(3,5,2) | d(3,5,3) | d(3,5,4) | d(3,5,5) | d(3,5,6) | d(3,5,7) | d(3,5,8) | d(3,5,9) | d(3,5,10) | d(3,5,11) | |
| Re | d(3,6,1) | d(3,6,2) | d(3,6,3) | d(3,6,4) | d(3,6,5) | d(3,6,6) | d(3,6,7) | d(3,6,8) | d(3,6,9) | d(3,6,10) | d(3,6,11) | |
| Bk | d(3,7,1) | d(3,7,2) | d(3,7,3) | d(3,7,4) | d(3,7,5) | d(3,7,6) | d(3,7,7) | d(3,7,8) | d(3,7,9) | d(3,7,10) | d(3,7,11) | |
| Ma (5) | Ex | d(4,1,1) | d(4,1,2) | d(4,1,3) | d(4,1,4) | d(4,1,5) | d(4,1,6) | d(4,1,7) | d(4,1,8) | d(4,1,9) | d(4,1,10) | d(4,1,11) |
| Ca | d(4,2,1) | d(4,2,2) | d(4,2,3) | d(4,2,4) | d(4,2,5) | d(4,2,6) | d(4,2,7) | d(4,2,8) | d(4,2,9) | d(4,2,10) | d(4,2,11) | |
| Ga | d(4,3,1) | d(4,3,2) | d(4,3,3) | d(4,3,4) | d(4,3,5) | d(4,3,6) | d(4,3,7) | d(4,3,8) | d(4,3,9) | d(4,3,10) | d(4,3,11) | |
| Hc | d(4,4,1) | d(4,4,2) | d(4,4,3) | d(4,4,4) | d(4,4,5) | d(4,4,6) | d(4,4,7) | d(4,4,8) | d(4,4,9) | d(4,4,10) | d(4,4,11) | |
| Ba | d(4,5,1) | d(4,5,2) | d(4,5,3) | d(4,5,4) | d(4,5,5) | d(4,5,6) | d(4,5,7) | d(4,5,8) | d(4,5,9) | d(4,5,10) | d(4,5,11) | |
| Re | d(4,6,1) | d(4,6,2) | d(4,6,3) | d(4,6,4) | d(4,6,5) | d(4,6,6) | d(4,6,7) | d(4,6,8) | d(4,6,9) | d(4,6,10) | d(4,6,11) | |
| Bk | d(4,7,1) | d(4,7,2) | d(4,7,3) | d(4,7,4) | d(4,7,5) | d(4,7,6) | d(4,7,7) | d(4,7,8) | d(4,7,9) | d(4,7,10) | d(4,7,11) | |
| Fi (2) | Ex | d(5,1,1) | d(5,1,2) | d(5,1,3) | d(5,1,4) | d(5,1,5) | d(5,1,6) | d(5,1,7) | d(5,1,8) | d(5,1,9) | d(5,1,10) | d(5,1,11) |
| Ca | d(5,2,1) | d(5,2,2) | d(5,2,3) | d(5,2,4) | d(5,2,5) | d(5,2,6) | d(5,2,7) | d(5,2,8) | d(5,2,9) | d(5,2,10) | d(5,2,11) | |
| Ga | d(5,3,1) | d(5,3,2) | d(5,3,3) | d(5,3,4) | d(5,3,5) | d(5,3,6) | d(5,3,7) | d(5,3,8) | d(5,3,9) | d(5,3,10) | d(5,3,11) | |
| Hc | d(5,4,1) | d(5,4,2) | d(5,4,3) | d(5,4,4) | d(5,4,5) | d(5,4,6) | d(5,4,7) | d(5,4,8) | d(5,4,9) | d(5,4,10) | d(5,4,11) | |
| Ba | d(5,5,1) | d(5,5,2) | d(5,5,3) | d(5,5,4) | d(5,5,5) | d(5,5,6) | d(5,5,7) | d(5,5,8) | d(5,5,9) | d(5,5,10) | d(5,5,11) | |
| Re | d(5,6,1) | d(5,6,2) | d(5,6,3) | d(5,6,4) | d(5,6,5) | d(5,6,6) | d(5,6,7) | d(5,6,8) | d(5,6,9) | d(5,6,10) | d(5,6,11) | |
| Bk | d(5,7,1) | d(5,7,2) | d(5,7,3) | d(5,7,4) | d(5,7,5) | d(5,7,6) | d(5,7,7) | d(5,7,8) | d(5,7,9) | d(5,7,10) | d(5,7,11) | |
| In (3) | Ex | d(6,1,1) | d(6,1,2) | d(6,1,3) | d(6,1,4) | d(6,1,5) | d(6,1,6) | d(6,1,7) | d(6,1,8) | d(6,1,9) | d(6,1,10) | d(6,1,11) |
| Ca | d(6,2,1) | d(6,2,2) | d(6,2,3) | d(6,2,4) | d(6,2,5) | d(6,2,6) | d(6,2,7) | d(6,2,8) | d(6,2,9) | d(6,2,10) | d(6,2,11) | |
| Ga | d(6,3,1) | d(6,3,2) | d(6,3,3) | d(6,3,4) | d(6,3,5) | d(6,3,6) | d(6,3,7) | d(6,3,8) | d(6,3,9) | d(6,3,10) | d(6,3,11) | |
| Hc | d(6,4,1) | d(6,4,2) | d(6,4,3) | d(6,4,4) | d(6,4,5) | d(6,4,6) | d(6,4,7) | d(6,4,8) | d(6,4,9) | d(6,4,10) | d(6,4,11) | |
| Ba | d(6,5,1) | d(6,5,2) | d(6,5,3) | d(6,5,4) | d(6,5,5) | d(6,5,6) | d(6,5,7) | d(6,5,8) | d(6,5,9) | d(6,5,10) | d(6,5,11) | |
| Re | d(6,6,1) | d(6,6,2) | d(6,6,3) | d(6,6,4) | d(6,6,5) | d(6,6,6) | d(6,6,7) | d(6,6,8) | d(6,6,9) | d(6,6,10) | d(6,6,11) | |
| Bk | d(6,7,1) | d(6,7,2) | d(6,7,3) | d(6,7,4) | d(6,7,5) | d(6,7,6) | d(6,7,7) | d(6,7,8) | d(6,7,9) | d(6,7,10) | d(6,7,11) | |
| Wa (5) | Ex | d(7,1,1) | d(7,1,2) | d(7,1,3) | d(7,1,4) | d(7,1,5) | d(7,1,6) | d(7,1,7) | d(7,1,8) | d(7,1,9) | d(7,1,10) | d(7,1,11) |
| Ca | d(7,2,1) | d(7,2,2) | d(7,2,3) | d(7,2,4) | d(7,2,5) | d(7,2,6) | d(7,2,7) | d(7,2,8) | d(7,2,9) | d(7,2,10) | d(7,2,11) | |
| Ga | d(7,3,1) | d(7,3,2) | d(7,3,3) | d(7,3,4) | d(7,3,5) | d(7,3,6) | d(7,3,7) | d(7,3,8) | d(7,3,9) | d(7,3,10) | d(7,3,11) | |
| Hc | d(7,4,1) | d(7,4,2) | d(7,4,3) | d(7,4,4) | d(7,4,5) | d(7,4,6) | d(7,4,7) | d(7,4,8) | d(7,4,9) | d(7,4,10) | d(7,4,11) | |
| Ba | d(7,5,1) | d(7,5,2) | d(7,5,3) | d(7,5,4) | d(7,5,5) | d(7,5,6) | d(7,5,7) | d(7,5,8) | d(7,5,9) | d(7,5,10) | d(7,5,11) | |
| Re | d(7,6,1) | d(7,6,2) | d(7,6,3) | d(7,6,4) | d(7,6,5) | d(7,6,6) | d(7,6,7) | d(7,6,8) | d(7,6,9) | d(7,6,10) | d(7,6,11) | |
| Bk | d(7,7,1) | d(7,7,2) | d(7,7,3) | d(7,7,4) | d(7,7,5) | d(7,7,6) | d(7,7,7) | d(7,7,8) | d(7,7,9) | d(7,7,10) | d(7,7,11) | |
| Me (3) | Ex | d(8,1,1) | d(8,1,2) | d(8,1,3) | d(8,1,4) | d(8,1,5) | d(8,1,6) | d(8,1,7) | d(8,1,8) | d(8,1,9) | d(8,1,10) | d(8,1,11) |
| Ca | d(8,2,1) | d(8,2,2) | d(8,2,3) | d(8,2,4) | d(8,2,5) | d(8,2,6) | d(8,2,7) | d(8,2,8) | d(8,2,9) | d(8,2,10) | d(8,2,11) | |
| Ga | d(8,3,1) | d(8,3,2) | d(8,3,3) | d(8,3,4) | d(8,3,5) | d(8,3,6) | d(8,3,7) | d(8,3,8) | d(8,3,9) | d(8,3,10) | d(8,3,11) | |
| Hc | d(8,4,1) | d(8,4,2) | d(8,4,3) | d(8,4,4) | d(8,4,5) | d(8,4,6) | d(8,4,7) | d(8,4,8) | d(8,4,9) | d(8,4,10) | d(8,4,11) | |
| Ba | d(8,5,1) | d(8,5,2) | d(8,5,3) | d(8,5,4) | d(8,5,5) | d(8,5,6) | d(8,5,7) | d(8,5,8) | d(8,5,9) | d(8,5,10) | d(8,5,11) | |
| Re | d(8,6,1) | d(8,6,2) | d(8,6,3) | d(8,6,4) | d(8,6,5) | d(8,6,6) | d(8,6,7) | d(8,6,8) | d(8,6,9) | d(8,6,10) | d(8,6,11) | |
| Bk | d(8,7,1) | d(8,7,2) | d(8,7,3) | d(8,7,4) | d(8,7,5) | d(8,7,6) | d(8,7,7) | d(8,7,8) | d(8,7,9) | d(8,7,10) | d(8,7,11) | |
| Dw (3) | Ex | d(9,1,1) | d(9,1,2) | d(9,1,3) | d(9,1,4) | d(9,1,5) | d(9,1,6) | d(9,1,7) | d(9,1,8) | d(9,1,9) | d(9,1,10) | d(9,1,11) |
| Ca | d(9,2,1) | d(9,2,2) | d(9,2,3) | d(9,2,4) | d(9,2,5) | d(9,2,6) | d(9,2,7) | d(9,2,8) | d(9,2,9) | d(9,2,10) | d(9,2,11) | |
| Ga | d(9,3,1) | d(9,3,2) | d(9,3,3) | d(9,3,4) | d(9,3,5) | d(9,3,6) | d(9,3,7) | d(9,3,8) | d(9,3,9) | d(9,3,10) | d(9,3,11) | |
| Hc | d(9,4,1) | d(9,4,2) | d(9,4,3) | d(9,4,4) | d(9,4,5) | d(9,4,6) | d(9,4,7) | d(9,4,8) | d(9,4,9) | d(9,4,10) | d(9,4,11) | |
| Ba | d(9,5,1) | d(9,5,2) | d(9,5,3) | d(9,5,4) | d(9,5,5) | d(9,5,6) | d(9,5,7) | d(9,5,8) | d(9,5,9) | d(9,5,10) | d(9,5,11) | |
| Re | d(9,6,1) | d(9,6,2) | d(9,6,3) | d(9,6,4) | d(9,6,5) | d(9,6,6) | d(9,6,7) | d(9,6,8) | d(9,6,9) | d(9,6,10) | d(9,6,11) | |
| Bk | d(9,7,1) | d(9,7,2) | d(9,7,3) | d(9,7,4) | d(9,7,5) | d(9,7,6) | d(9,7,7) | d(9,7,8) | d(9,7,9) | d(9,7,10) | d(9,7,11) | |
| Fu (2) | Ex | d(10,1,1) | d(10,1,2) | d(10,1,3) | d(10,1,4) | d(10,1,5) | d(10,1,6) | d(10,1,7) | d(10,1,8) | d(10,1,9) | d(10,1,10) | d(10,1,11) |
| Ca | d(10,2,1) | d(10,2,2) | d(10,2,3) | d(10,2,4) | d(10,2,5) | d(10,2,6) | d(10,2,7) | d(10,2,8) | d(10,2,9) | d(10,2,10) | d(10,2,11) | |
| Ga | d(10,3,1) | d(10,3,2) | d(10,3,3) | d(10,3,4) | d(10,3,5) | d(10,3,6) | d(10,3,7) | d(10,3,8) | d(10,3,9) | d(10,3,10) | d(10,3,11) | |
| Hc | d(10,4,1) | d(10,4,2) | d(10,4,3) | d(10,4,4) | d(10,4,5) | d(10,4,6) | d(10,4,7) | d(10,4,8) | d(10,4,9) | d(10,4,10) | d(10,4,11) | |
| Ba | d(10,5,1) | d(10,5,2) | d(10,5,3) | d(10,5,4) | d(10,5,5) | d(10,5,6) | d(10,5,7) | d(10,5,8) | d(10,5,9) | d(10,5,10) | d(10,5,11) | |
| Re | d(10,6,1) | d(10,6,2) | d(10,6,3) | d(10,6,4) | d(10,6,5) | d(10,6,6) | d(10,6,7) | d(10,6,8) | d(10,6,9) | d(10,6,10) | d(10,6,11) | |
| Bk | d(10,7,1) | d(10,7,2) | d(10,7,3) | d(10,7,4) | d(10,7,5) | d(10,7,6) | d(10,7,7) | d(10,7,8) | d(10,7,9) | d(10,7,10) | d(10,7,11) | |
| Mi (3) | Ex | d(11,1,1) | d(11,1,2) | d(11,1,3) | d(11,1,4) | d(11,1,5) | d(11,1,6) | d(11,1,7) | d(11,1,8) | d(11,1,9) | d(11,1,10) | d(11,1,11) |
| Ca | d(11,2,1) | d(11,2,2) | d(11,2,3) | d(11,2,4) | d(11,2,5) | d(11,2,6) | d(11,2,7) | d(11,2,8) | d(11,2,9) | d(11,2,10) | d(11,2,11) | |
| Ga | d(11,3,1) | d(11,3,2) | d(11,3,3) | d(11,3,4) | d(11,3,5) | d(11,3,6) | d(11,3,7) | d(11,3,8) | d(11,3,9) | d(11,3,10) | d(11,3,11) | |
| Hc | d(11,4,1) | d(11,4,2) | d(11,4,3) | d(11,4,4) | d(11,4,5) | d(11,4,6) | d(11,4,7) | d(11,4,8) | d(11,4,9) | d(11,4,10) | d(11,4,11) | |
| Ba | d(11,5,1) | d(11,5,2) | d(11,5,3) | d(11,5,4) | d(11,5,5) | d(11,5,6) | d(11,5,7) | d(11,5,8) | d(11,5,9) | d(11,5,10) | d(11,5,11) | |
| Re | d(11,6,1) | d(11,6,2) | d(11,6,3) | d(11,6,4) | d(11,6,5) | d(11,6,6) | d(11,6,7) | d(11,6,8) | d(11,6,9) | d(11,6,10) | d(11,6,11) | |
| Bk | d(11,7,1) | d(11,7,2) | d(11,7,3) | d(11,7,4) | d(11,7,5) | d(11,7,6) | d(11,7,7) | d(11,7,8) | d(11,7,9) | d(11,7,10) | d(11,7,11) | |
| Category | Defect Frequency (Number) | Defect Frequency Rate (%) | Defect Cost/G.F.A ($/m2) | Defect Cost/G.F.A Rate (%) |
|---|---|---|---|---|
| Affected functionality | 11.44 | 9.87 | 0.46 | 0.78 |
| Broken | 4.46 | 3.85 | 0.54 | 0.91 |
| Corrosion | 3.34 | 2.88 | 1.33 | 2.25 |
| Crack | 33.02 | 28.50 | 3.64 | 6.16 |
| Detachment | 12.64 | 10.91 | 2.92 | 4.94 |
| Incorrect installation | 9.16 | 7.91 | 16.07 | 27.18 |
| Missing task | 16.49 | 14.23 | 6.61 | 11.19 |
| Surface appearance | 11.42 | 9.86 | 8.20 | 13.86 |
| Excess moisture | 1.89 | 1.63 | 0.71 | 1.20 |
| Entrapped water | 3.22 | 2.78 | 0.72 | 1.22 |
| Water leak | 8.77 | 7.57 | 17.91 | 30.30 |
| Total | 115.85 | 100.00 | 59.11 | 100.00 |
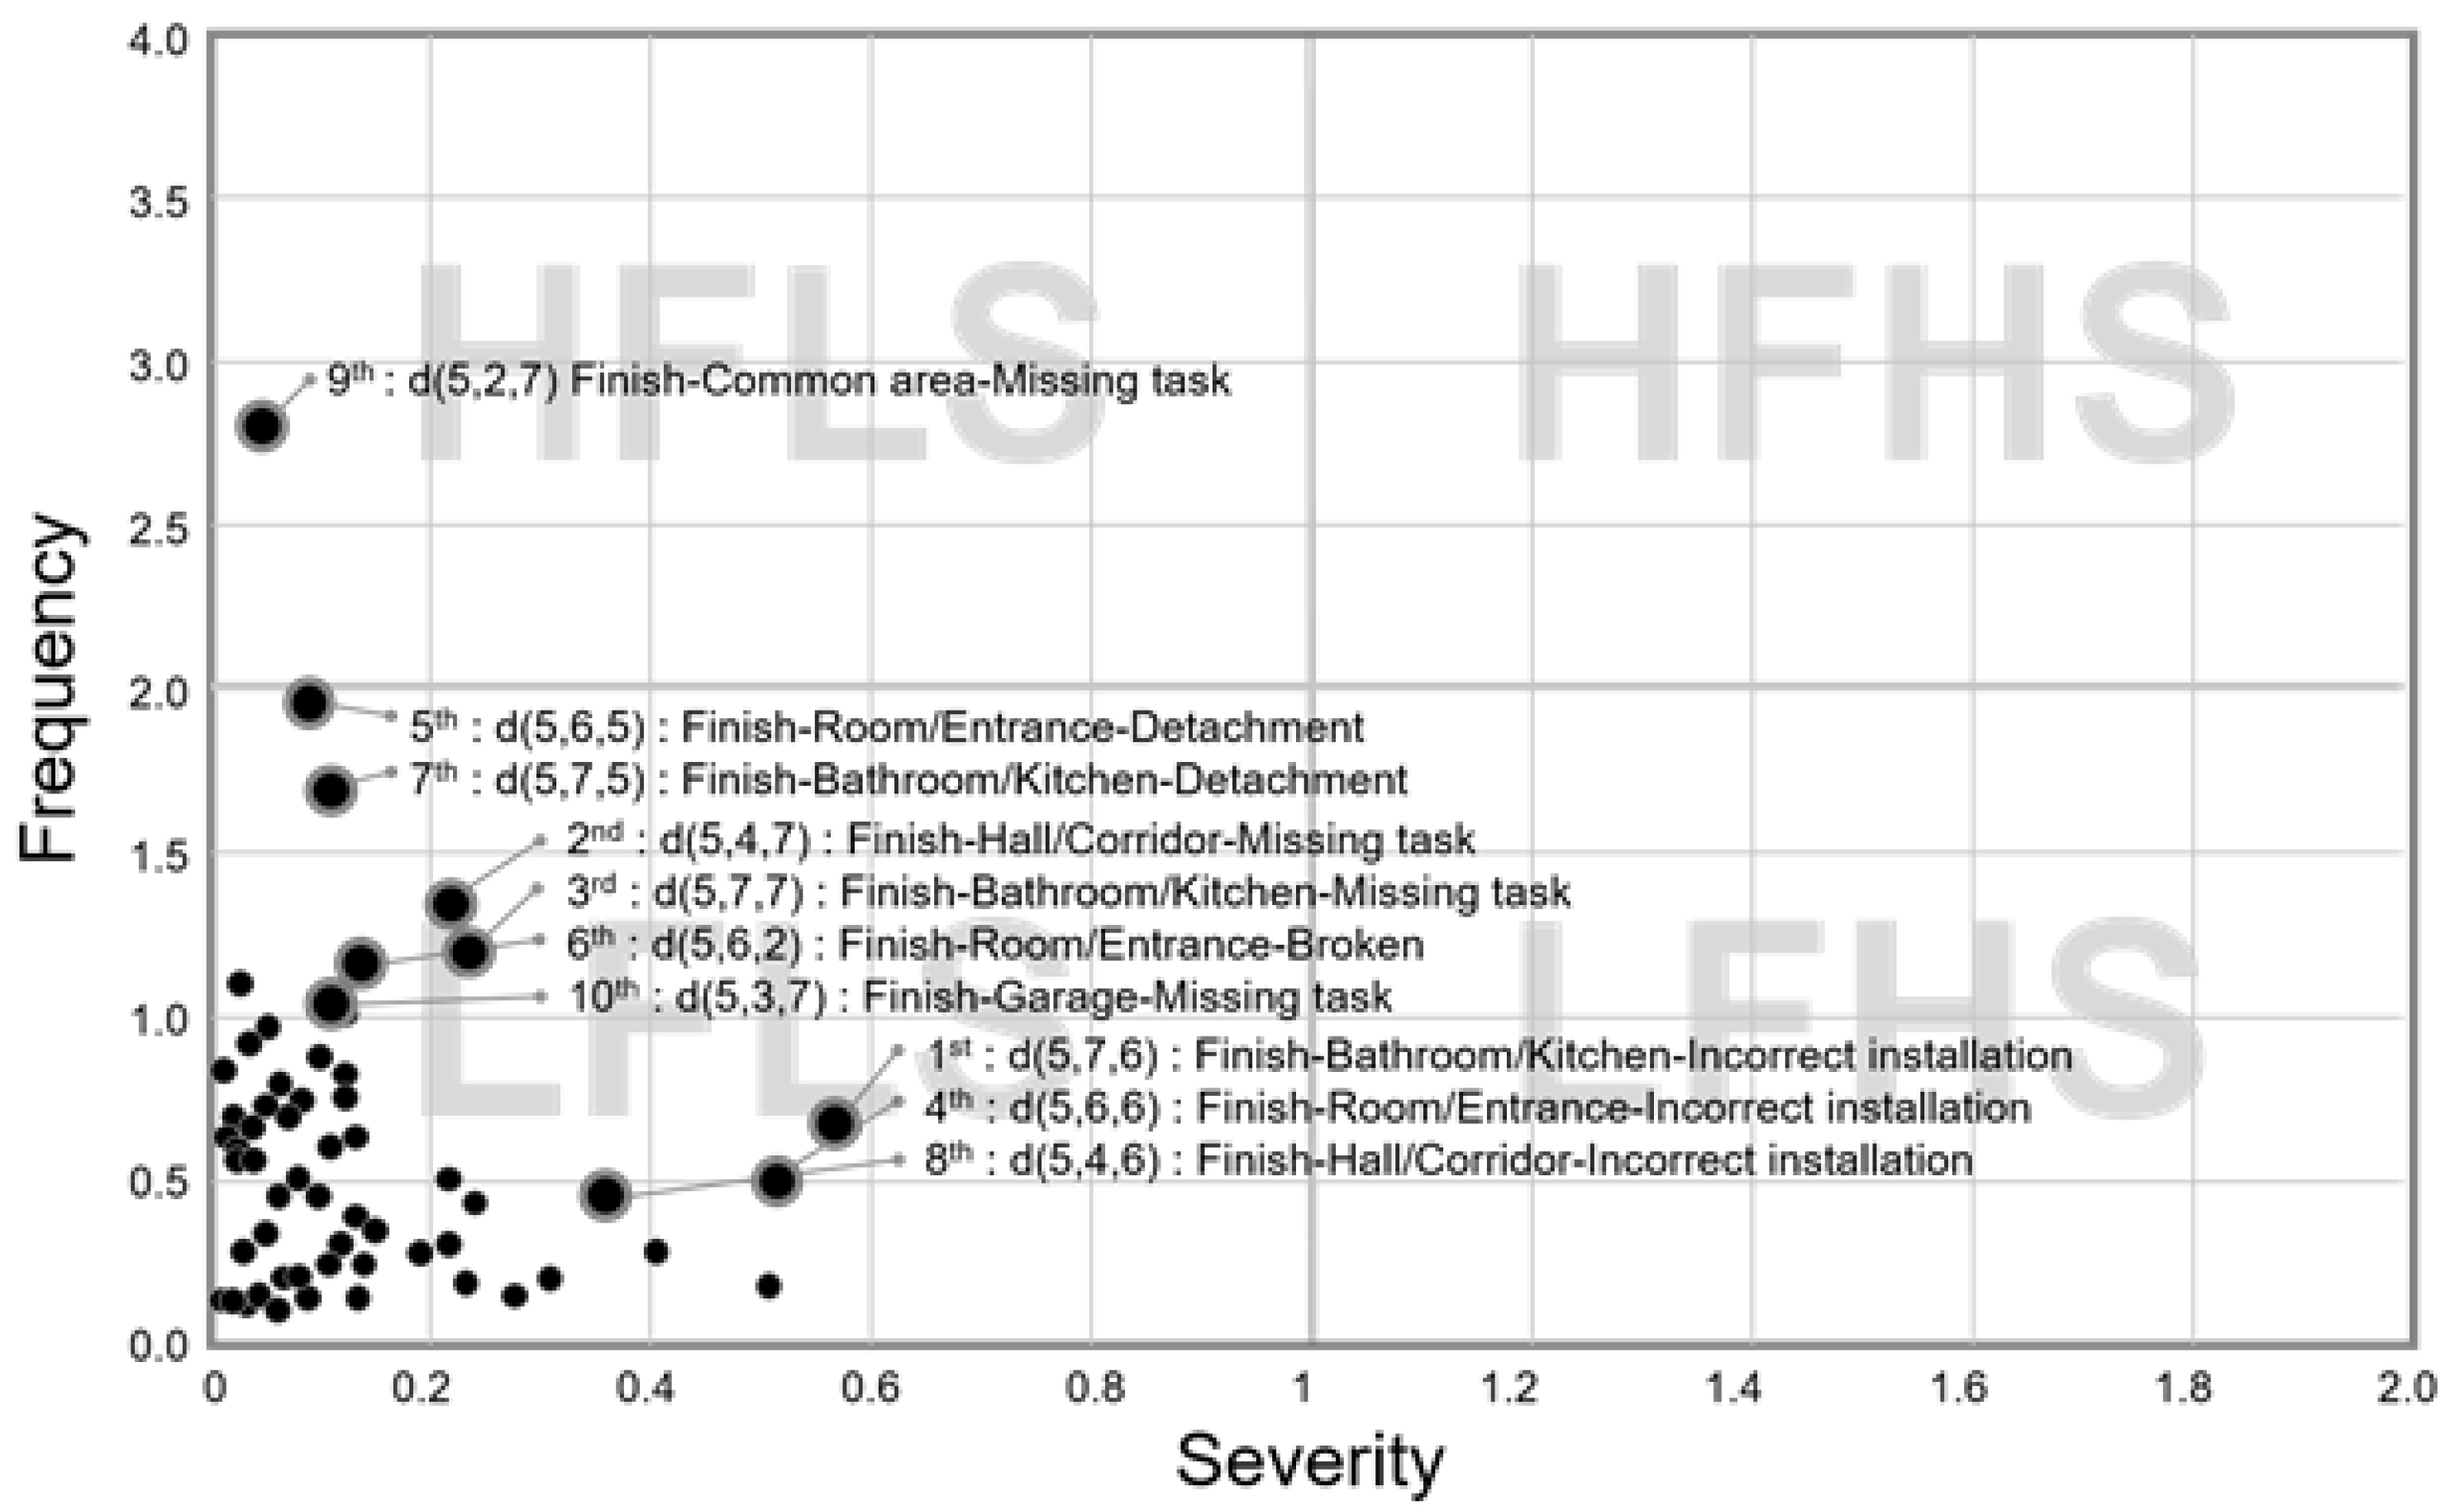
| Ranking | Work Types | Location | Defects | Average |
|---|---|---|---|---|
| 1 | Finish | Bathroom/Kitchen | Incorrect installation | 0.370 |
| 2 | Finish | Hall/Corridor | Missing task | 0.309 |
| 3 | Finish | Bathroom/Kitchen | Missing task | 0.279 |
| 4 | Finish | Room/Entrance | Incorrect installation | 0.208 |
| 5 | Finish | Room/Entrance | Detachment | 0.183 |
| 6 | Finish | Room/Entrance | Broken | 0.181 |
| 7 | Finish | Bathroom/Kitchen | Detachment | 0.174 |
| 8 | Finish | Hall/Corridor | Incorrect installation | 0.134 |
| 9 | Finish | Common area | Missing task | 0.131 |
| 10 | Finish | Garage | Missing task | 0.125 |
| Risk Zone | Defect Characteristics | Defect Risk Management Strategies | |
|---|---|---|---|
| Cell No | Phase | ||
| HFLS | d(5,2,7) | Construction | Construction of components is required after disassembly, because incorrect installations and missing tasks appear as major defects. Thorough management during construction is required because of a serious defect that prevents the building from performing its function and role at all, or demolishing is required simultaneously with construction depending on the field situation. |
| LFLS | d(5,7,6) | ||
| d(5,4,7) | |||
| d(5,7,7) | |||
| d(5,6,6) | |||
| d(5,4,6) | |||
| d(5,3,7) | |||
| LFLS | d(5,6,5) | Handover | Defects such as detachment and breakage need to be reviewed through visual inspection, along with careful management of the construction status by reviewing the design documents and design change documents during the inspection of use. |
| d(5,6,2) | |||
| d(5,7,5) | |||
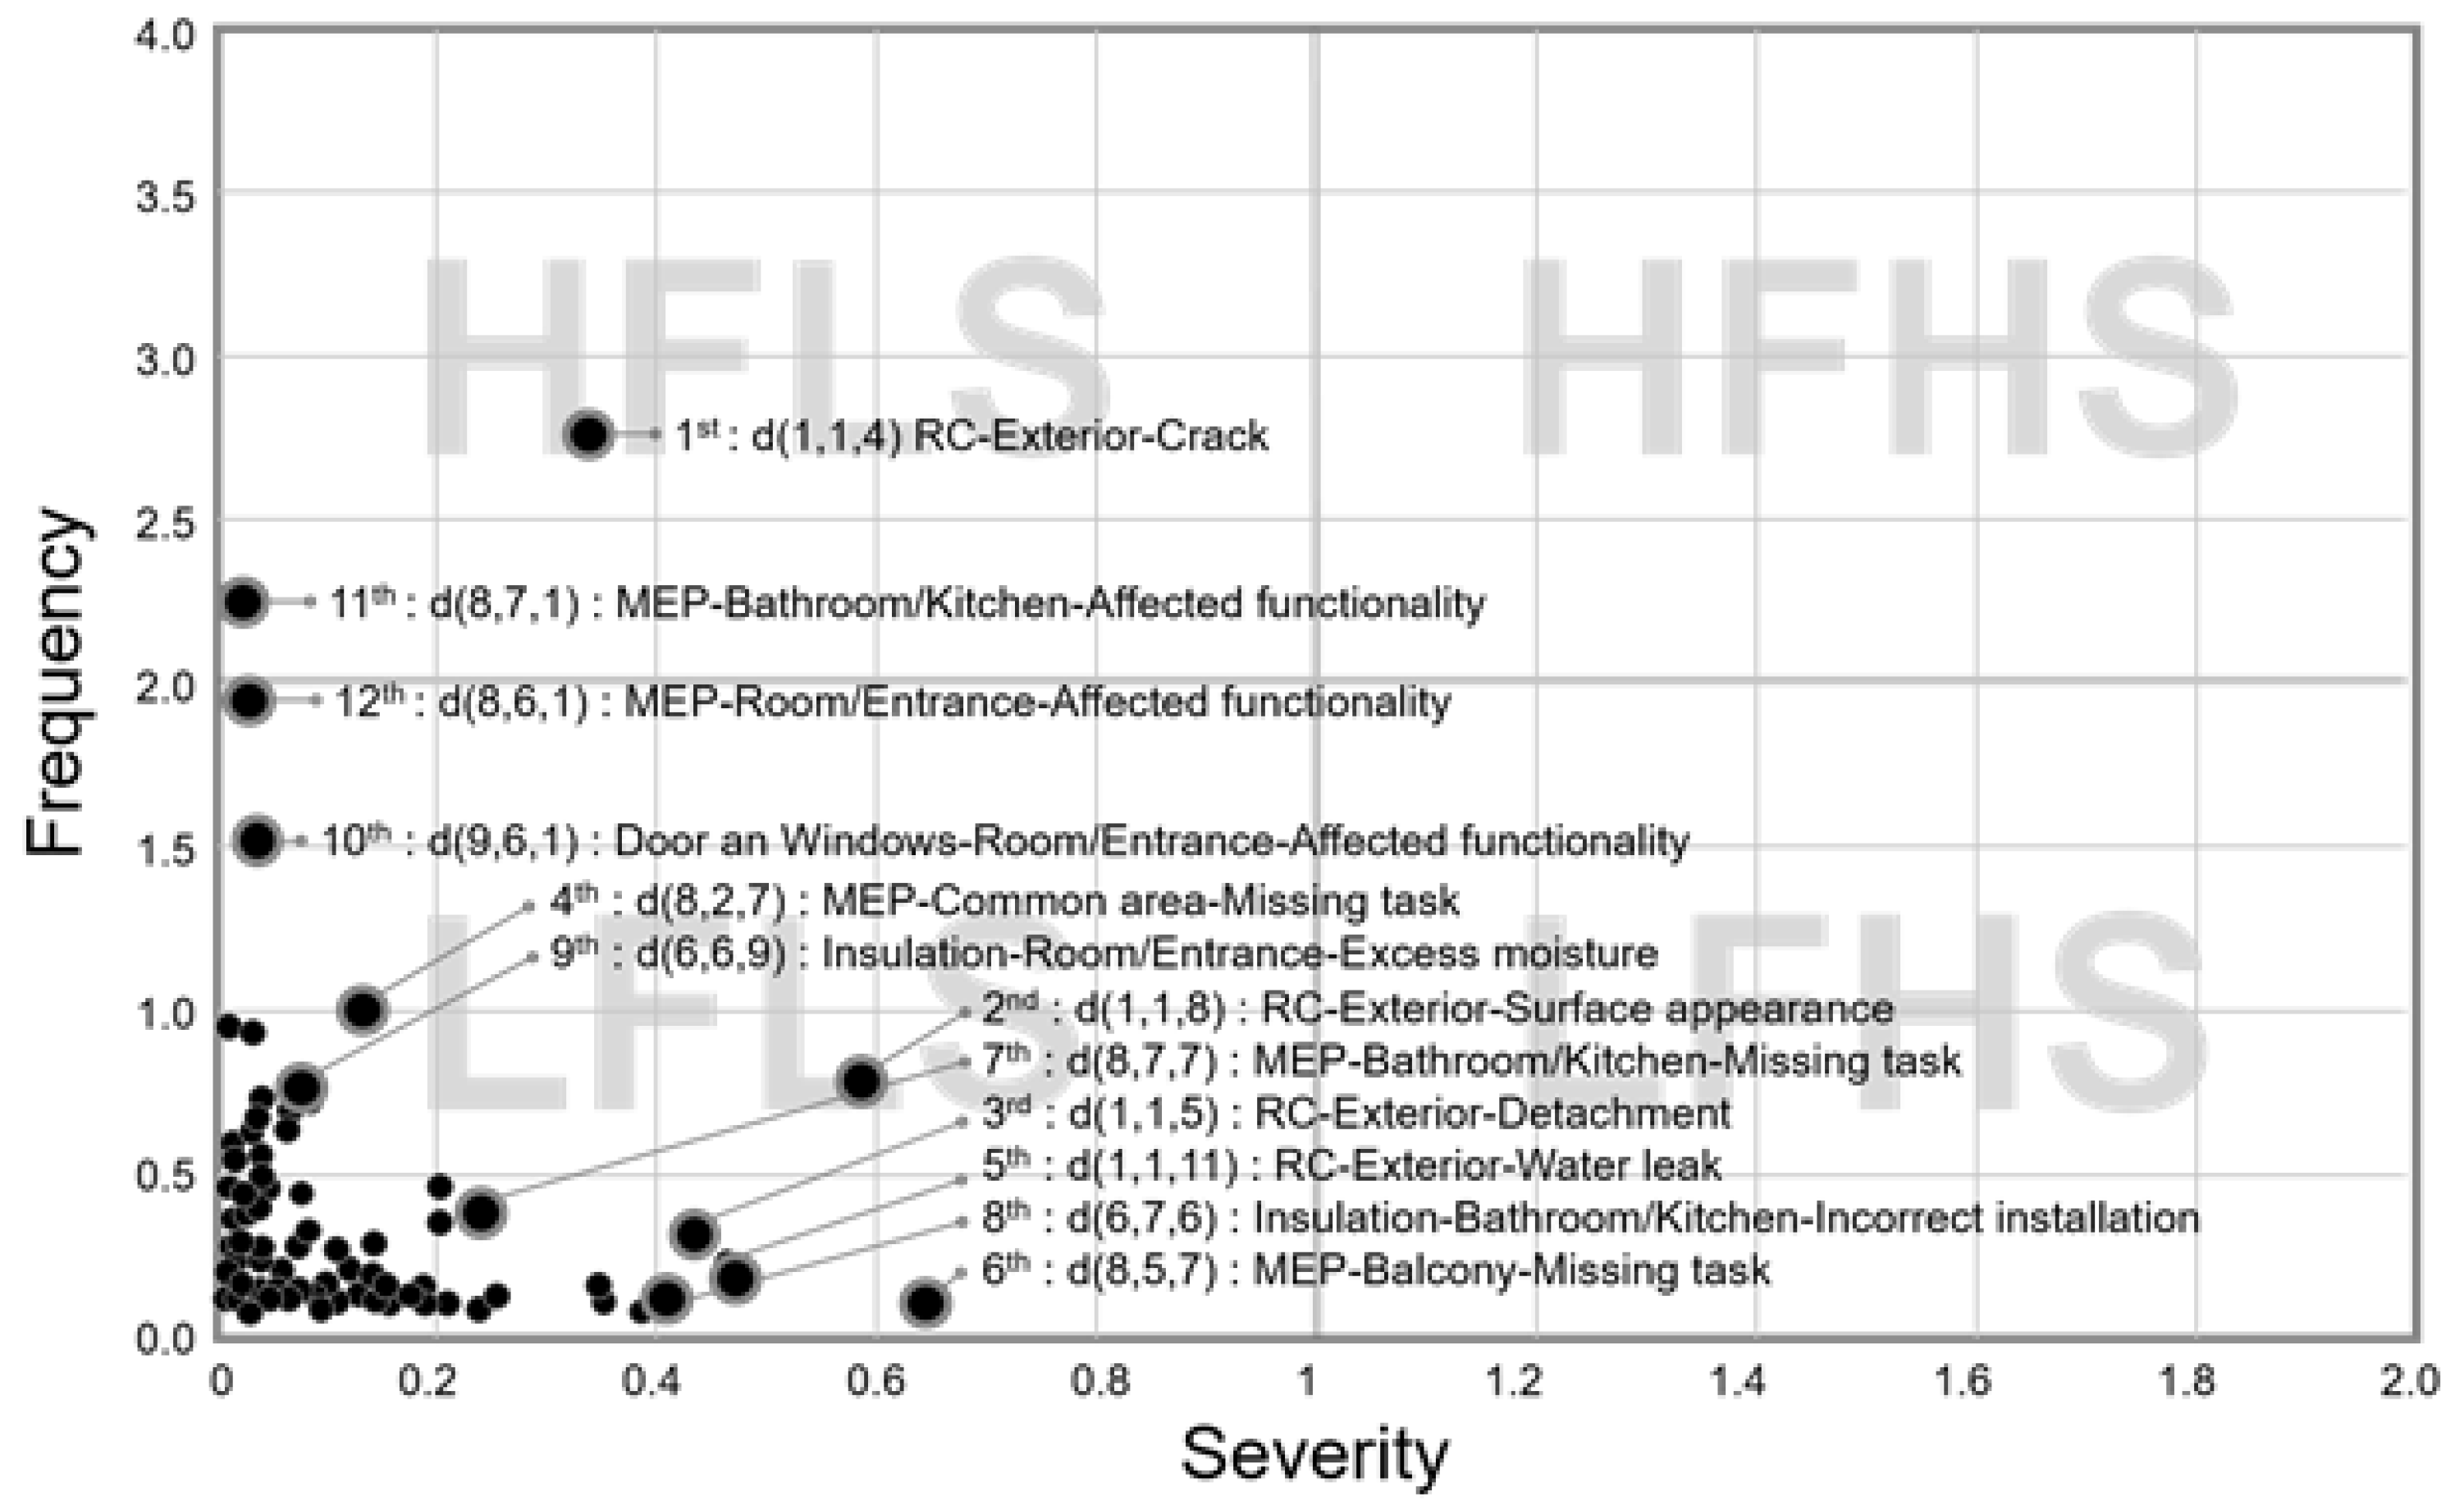
| Ranking | Work Types | Location | Defects | Average |
|---|---|---|---|---|
| 1 | RC | Exterior | Crack | 0.923 |
| 2 | RC | Exterior | Surface appearance | 0.428 |
| 3 | RC | Exterior | Detachment | 0.138 |
| 4 | MEP | Common area | Missing task | 0.134 |
| 5 | RC | Exterior | Water leak | 0.111 |
| 6 | MEP | Balcony | Missing task | 0.081 |
| 7 | MEP | Bathroom/Kitchen | Missing task | 0.076 |
| 8 | Insulation | Bathroom/Kitchen | Incorrect installation | 0.066 |
| 9 | Insulation | Room/Entrance | Excess moisture | 0.062 |
| 10 | Door and Windows | Room/Entrance | Affected functionality | 0.060 |
| 11 | MEP | Bathroom/Kitchen | Affected functionality | 0.057 |
| 12 | MEP | Entrance | Affected functionality | 0.056 |
| Risk Zone | Defect Characteristics | Defect Risk Management Strategies | |
|---|---|---|---|
| Cell No | Phase | ||
| HFLS | d(1,1,4) | Post-Handover and Occupancy | Secondary defects can occur from cracks and damage in the main structure. An early response at the beginning of a defect is effective to reduce serial losses. |
| LFHS | d(1,1,8) | ||
| d(1,1,5) | |||
| d(1,1,11) | |||
| LFLS | d(8,2,7) | Construction | Thorough management and supervision in the construction phase is required to reduce the losses of incorrect installations and missing tasks. |
| d(8,5,7) | |||
| d(8,7,7) | |||
| d(6,7,6) | |||
| LFLS | d(6,6,9) | Design, Construction, and Handover | Management measures are required, such as constructability review in the design phase of MEP work and close collaboration between work types in the construction phase. Water leakage due to poor insulation work has a significant effect on the satisfaction of occupants, causing severe inconvenience. Hence, continuous management measures such as thorough design, appropriate method, and proper material selection are required. |
| d(9,6,1) | |||
| d(8,7,1) | |||
| d(8,6,1) | |||
| Ranking | Work Types | Location | Defects | Average |
|---|---|---|---|---|
| 1 | RC | Garage | Crack | 0.706 |
| 2 | Water proof | Garage | Incorrect installation | 0.319 |
| 3 | Water proof | Garage | Missing task | 0.307 |
| 4 | RC | Exterior | Crack | 0.167 |
| 5 | Water proof | Balcony | Water leak | 0.136 |
| 6 | RC | Garage | Water leak | 0.135 |
| 7 | RC | Balcony | Crack | 0.120 |
| 8 | RC | Garage | Surface appearance | 0.103 |
| 9 | RC | Garage | Incorrect installation | 0.101 |
| 10 | Water proof | Exterior | Water leak | 0.086 |
| 11 | RC | Common area | Crack | 0.073 |
| Risk Zone | Defect Characteristics | Defect Risk Management | |
|---|---|---|---|
| Cell No | Phase | Strategies | |
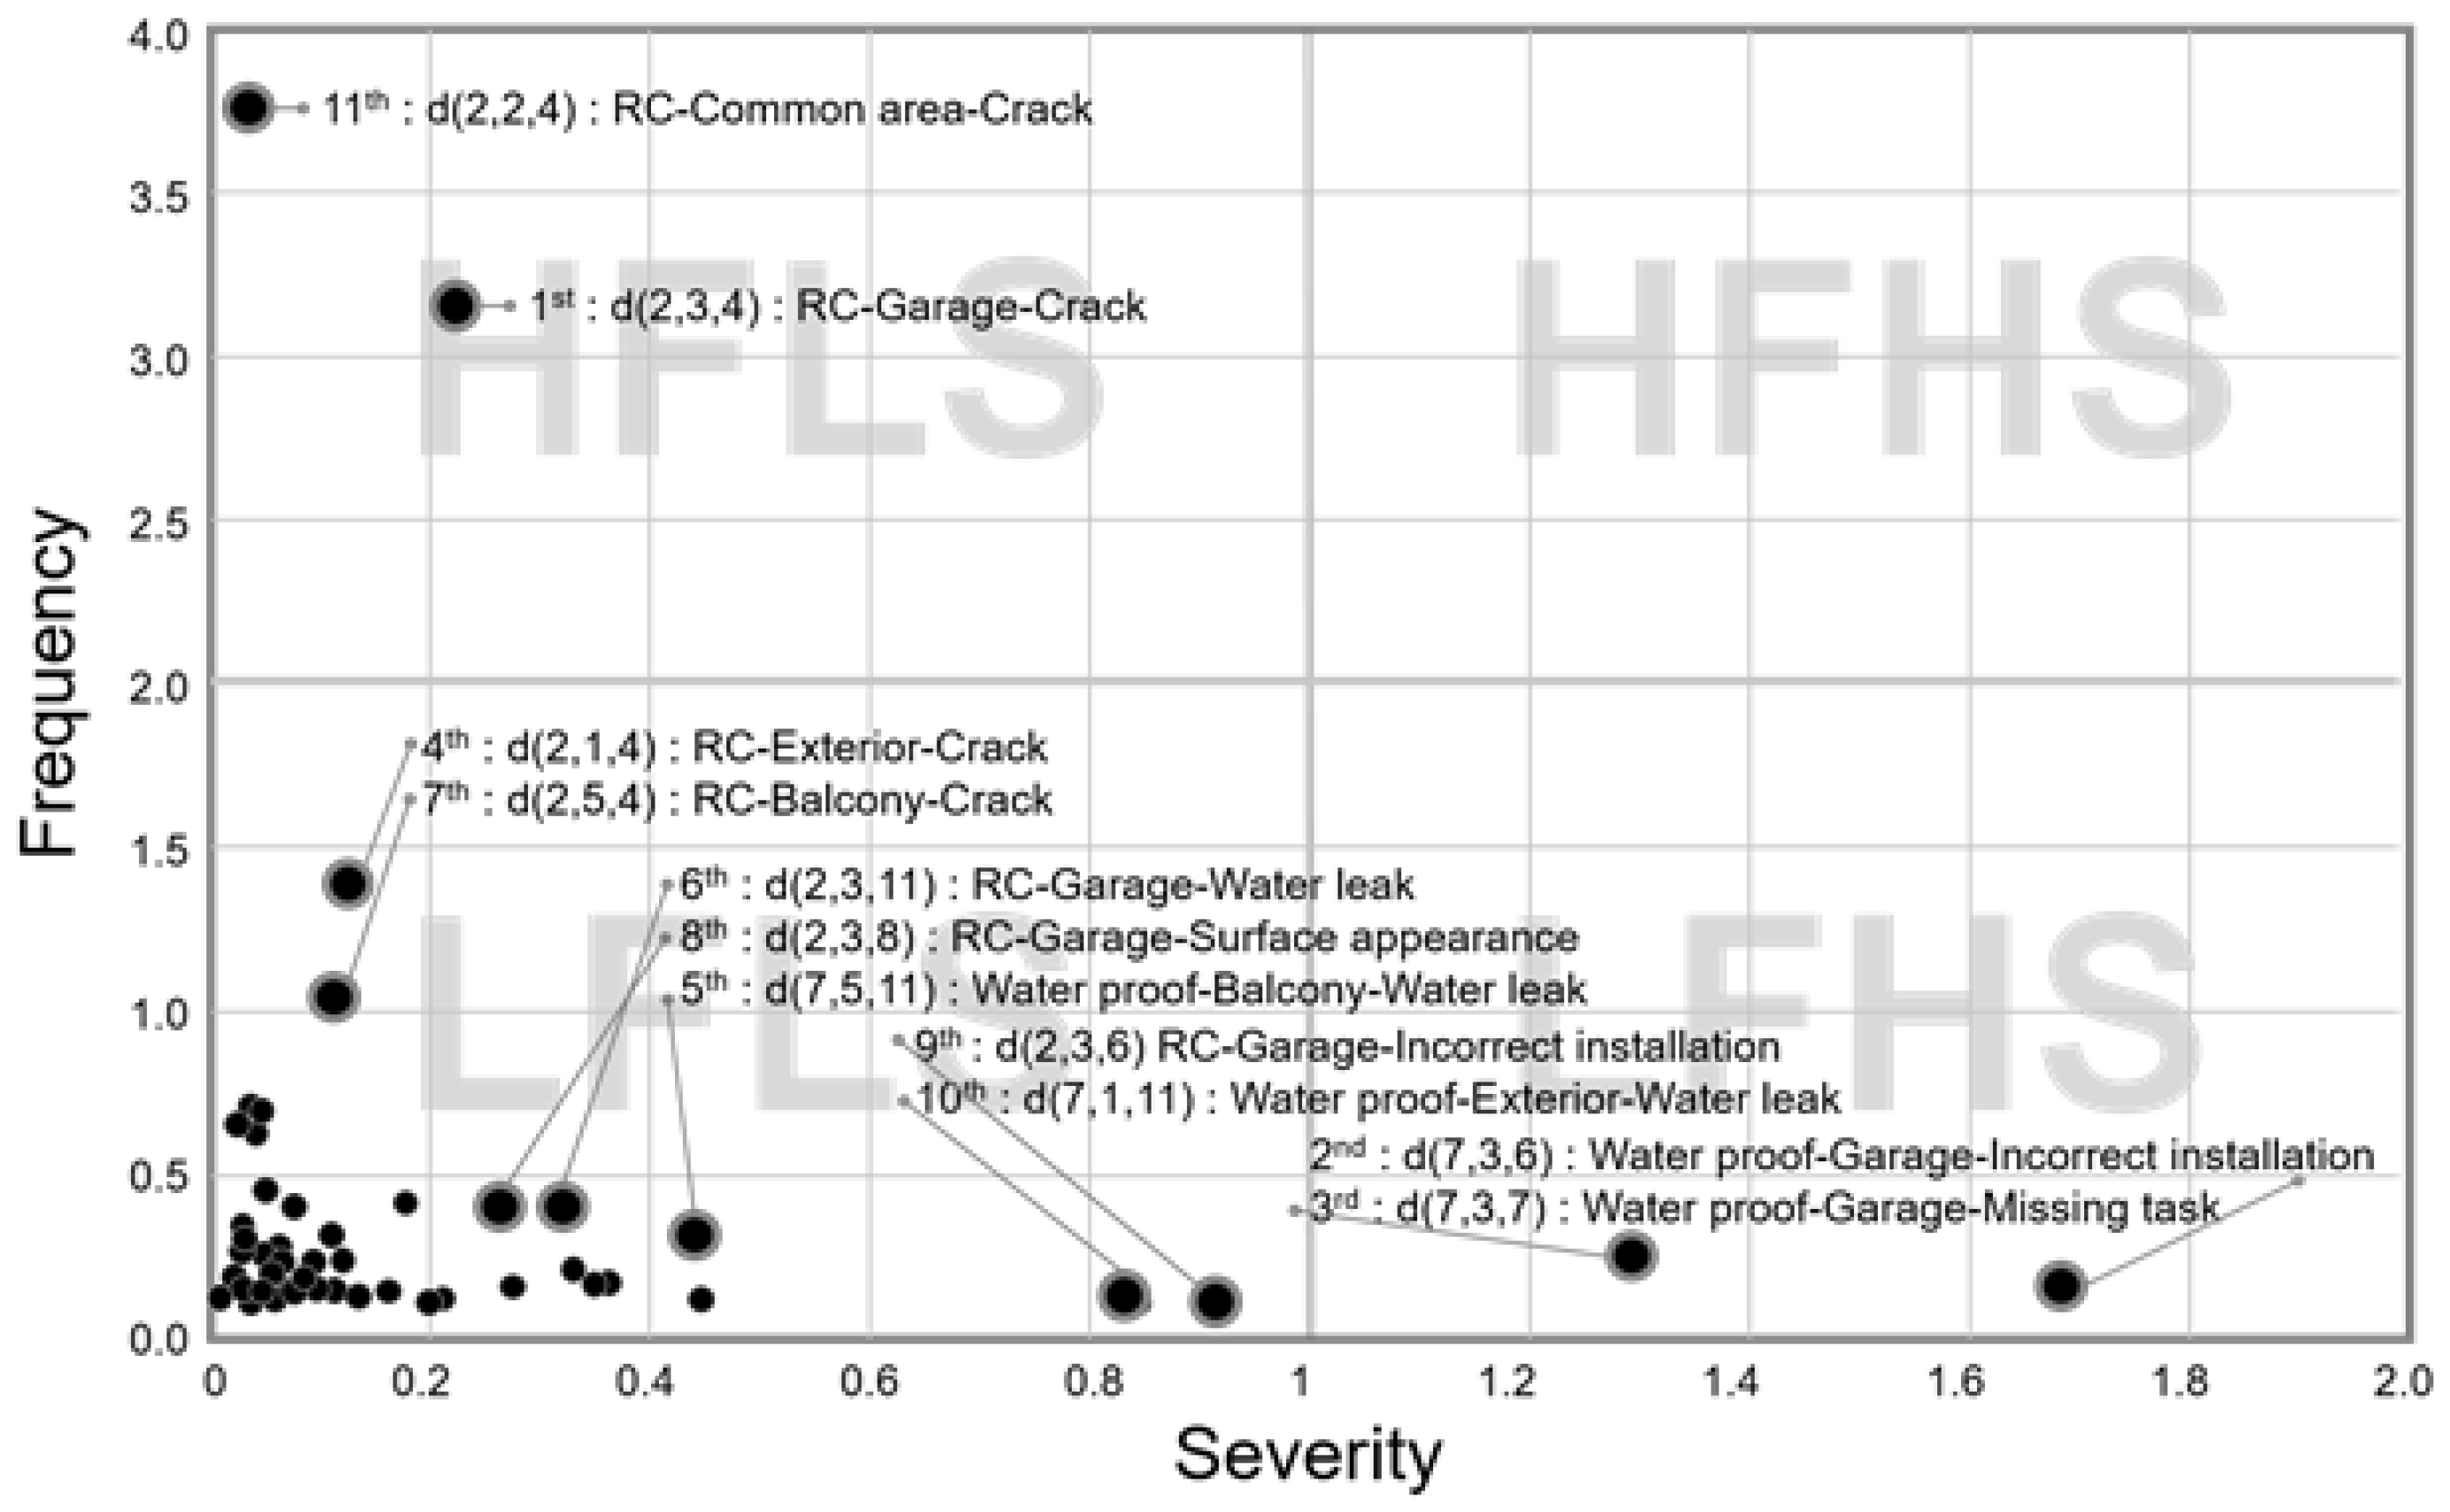
| HFLS | d(2,3,4) | Handover, Post-Handover and Occupancy | Cracks/damage occurs in structures such as underground parking lots. RC work of the underground parking lot can be visually inspected. Thus, a strategy to discover potential defects early through thorough defect inspection in the handover phase is required. Crack defect can lead to a series of other defects such as surface defects and water leakage. Therefore, an immediate response in the early stage of a defect is required. |
| d(2,2,4) | |||
| LFLS | d(2,1,4) | ||
| d(2,3,11) | |||
| d(2,5,4) | |||
| d(2,3,8) | |||
| d(2,3,6) | |||
| LFLS | d(7,5,11) | Post-Handover and Occupancy | Crack/water leakage occurs in parts that have contact with the outside environment. This can lead to other defects such as crack enlargement and reinforcement corrosion. Thus, an early response to the defect is critical to reduce the defect losses. |
| d(7,1,11) | |||
| LFHS | d(7,3,6) | Construction | Reconstruction is required because incorrect installation and missing tasks appear as the main defects. |
| d(7,3,7) | |||
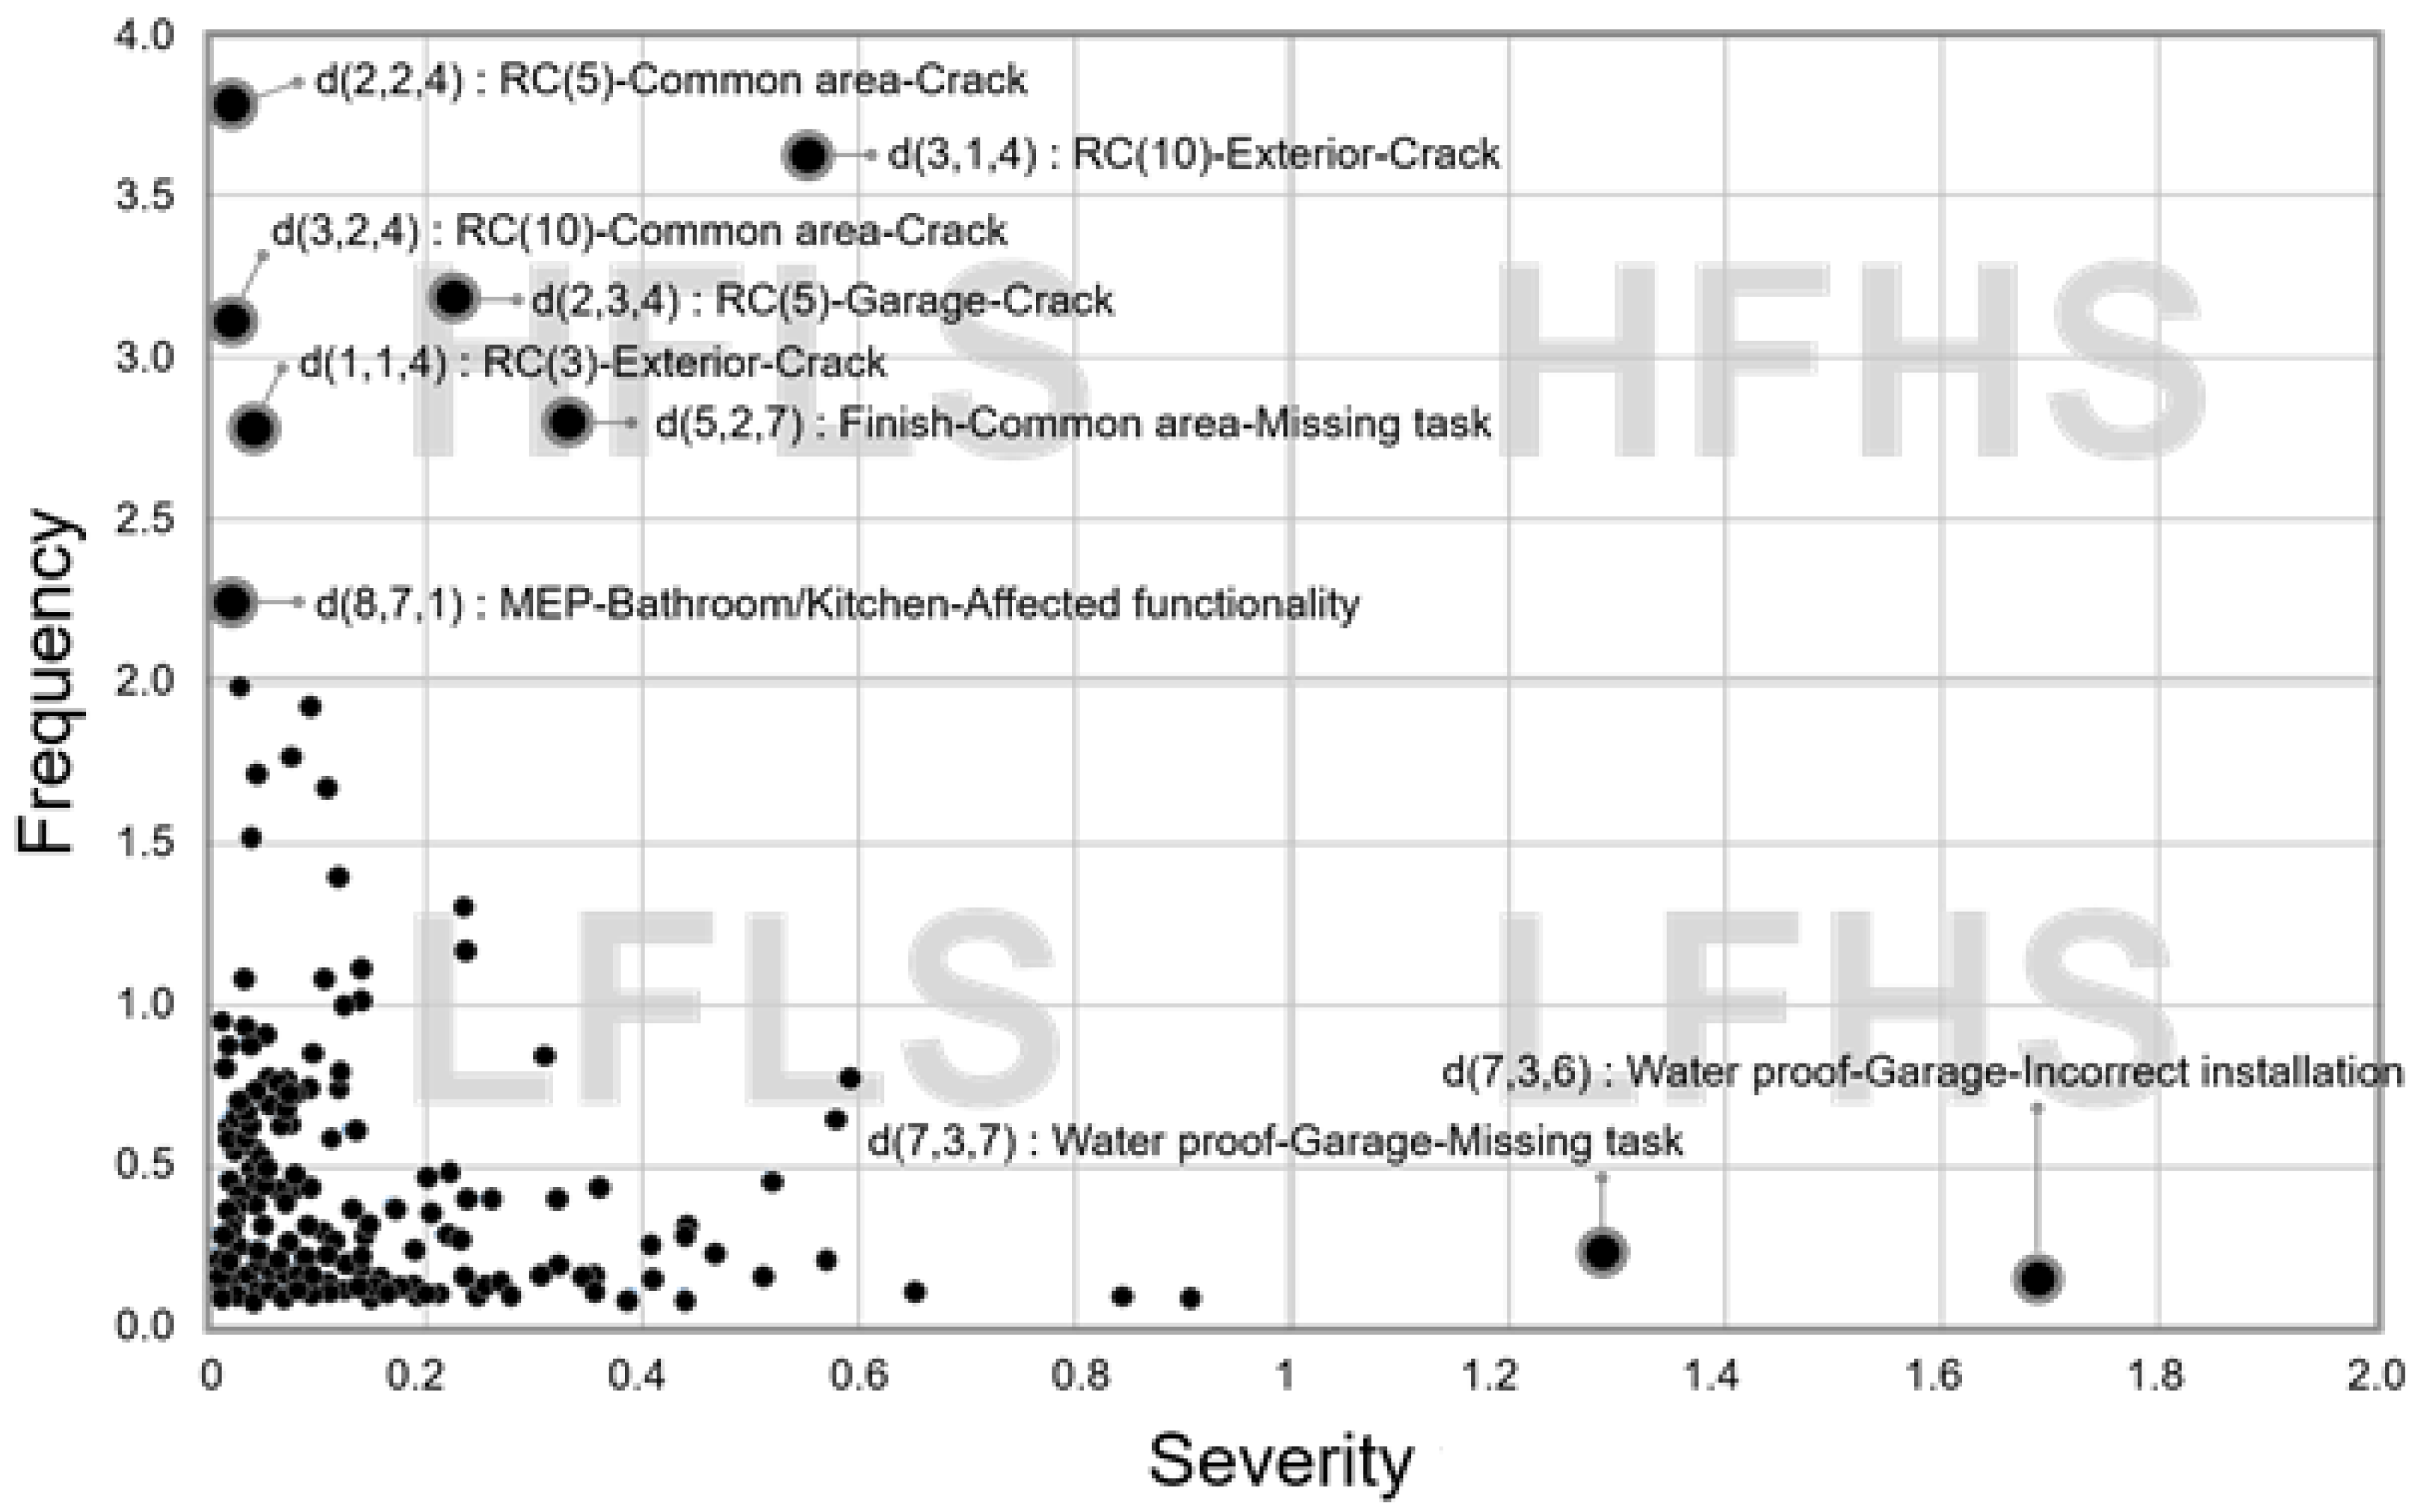
| Ranking | Work Types | Location | Defects | Average |
|---|---|---|---|---|
| 1 | RC | Exterior | Crack | 2.029 |
| 2 | RC | Exterior | Surface appearance | 0.262 |
| 3 | RC | Hall/corridor | Crack | 0.137 |
| 4 | RC | Exterior | Water leak | 0.123 |
| 5 | RC | Garage | Crack | 0.078 |
| 6 | RC | Garage | Water leak | 0.066 |
| 7 | RC | Common area | Crack | 0.060 |
| 8 | RC | Exterior | Detachment | 0.045 |
| 9 | RC | Hall/corridor | Water leak | 0.039 |
| 10 | RC | Exterior | Corrosion | 0.032 |
| Risk Zone | Defect Characteristics | Defect Risk Management | |
|---|---|---|---|
| Cell No | Phase | Strategies | |
| HFLS | d(3,1,4) | Construction | Crack/damage occurs in the structure. Losses must be minimized through thorough management in the construction phase rather than response/repair after completion. Even if the defect liability period has expired, the business entity must take responsibility for defects that occurred a long time before the end of the durable period of the component (Only if the contractor has the cause of the defect). |
| d(3,2,4) | |||
| LFLS | d(3,1,8) | ||
| d(3,1,5) | |||
| d(3,1,11) | |||
| d(3,1,3) | |||
| d(3,3,4) | |||
| d(3,3,11) | |||
| d(3,4,4) | |||
| d(3,4,11) | |||
© 2019 by the authors. Licensee MDPI, Basel, Switzerland. This article is an open access article distributed under the terms and conditions of the Creative Commons Attribution (CC BY) license (http://creativecommons.org/licenses/by/4.0/).
Share and Cite
Kim, B.; Ahn, Y.; Lee, S. LDA-Based Model for Defect Management in Residential Buildings. Sustainability 2019, 11, 7201. https://doi.org/10.3390/su11247201
Kim B, Ahn Y, Lee S. LDA-Based Model for Defect Management in Residential Buildings. Sustainability. 2019; 11(24):7201. https://doi.org/10.3390/su11247201
Chicago/Turabian StyleKim, Byeol, Yonghan Ahn, and Sanghyo Lee. 2019. "LDA-Based Model for Defect Management in Residential Buildings" Sustainability 11, no. 24: 7201. https://doi.org/10.3390/su11247201