Article

Prevalence and Correlates of Academic Dishonesty: Towards a Sustainable University

Faculty of Labor Relations, Campus Vida, University of Santiago de Compostela, 15782 Santiago de Compostela, Spain
*
Author to whom correspondence should be addressed.
Sustainability 2019, 11(21), 6062; https://doi.org/10.3390/su11216062
Submission received: 11 September 2019 / Revised: 21 October 2019 / Accepted: 28 October 2019 / Published: 31 October 2019
(This article belongs to the Special Issue Psychology of Sustainability and Sustainable Development)

Abstract

:
Academic dishonesty (AD) is a problem that affects all higher education institutions. It hurts their reputation, undermines integrity programs, and sidelines sustainability efforts. To understand its negative impact, the empirical study of AD is a critical issue. Up to now, the majority of research on AD has taken place in the North American context. The current research analyzes the prevalence of AD in a non-American university and, focusing on individual differences, examines some of its causes and consequences. The results prove that: (1) AD is a problem that occurs frequently among students; (2) three dimensions of the big five personality model correlate with AD. These are conscientiousness (ρ = −0.49, p < 0.01), extraversion (ρ = 0.39, p < 0.01), and agreeableness (ρ = −0.14, p < 0.01); (3) AD is associated to students’ GPA (Grade Point Average) (ρ = −0.34, p < 0.01) and contextual performance (ρ = −0.50, p < 0.01); (4) personality accounts for 30% of AD variance (R = 0.55, p < 0.01); and (5) AD and some of the studied individual differences explain 38% and 41% of GPA and contextual performance variance (R = 0.62, p < 0.01 and R = 0.64, p < 0.01). Implications for research and practice are discussed.

1. Introduction

As it becomes increasingly impossible to ignore scientists’ dire warnings about the environmental cost of maintaining the statu quo, many types of organizations, from multinational industries to non-profit institutions, have been progressively investing resources and plotting ways to achieve a more sustainable level of impact. Unsurprisingly, for the past few decades, universities have also begun to implement programs that include sustainability as a key focus. Whether this involves searching for a more efficient use of energy, disposing of waste properly, going more digital, teaching proper recycling methods, or promoting other “green” endeavors, academic institutions play a central role in creating a more sustainable future. Indeed, most of the research concerning sustainability has focused on the control of effects caused by organizations on the physical environment [1]. However, as Sammalisto and Lindhvist [2] point out, sustainability is a broad construct that incorporates not only an environmental dimension but also a social and ethical one. Therefore, it is important to emphasize ethical as well as ecological factors when visualizing what sustainability means. This broader conception is the basis of what is now known as the psychology of sustainability (see [3]).
The purpose of higher education institutions is at least twofold: (a) To transfer technical knowledge and professional skills to a new generation, in other words, to help students obtain the best possible academic outcomes (i.e., excellent grades); and (b) to reinforce students’ values, principles, and moral development. With regard to the first purpose, a great deal of studies have shown that academic outcomes can be fundamentally predicted by individual differences variables, among them, cognitive ability and personality. Recent meta-analyses showed that general mental ability (GMA) correlates with academic outcomes (i.e., grade point average). Some examples are the meta-analyses by Kuncel, Hezlett, and Ones [4]; Kuncel, Ones, and Sackett [5]; Poropat [6]; Postlethwaite [7]; Salgado [8]; and Strenze [9]. Personality variables included in the big five model of personality, particularly conscientiousness, were also shown to be good determinants of academic outcomes (see for instance [6,10,11,12]).
With regard to the second purpose, universities are required to promote a climate where transparency, responsibility, and ethical decision-making are central goals. They must be committed to the creation of a framework that shapes students’ morals and conduct, so that they remain responsible and honest citizens after graduation. This set of academic procedures and ethical standards is often referred as the integrity system (IS). The development of an effective IS that is accepted and respected by instructors, students, and the academic community overall is a major step towards building socially sustainable universities. Academic institutions are intended to influence the development of students and help them become more ethical individuals who, ideally, will act in an honest and socially sustainable manner outside of school. Reinforcing these values and confronting dishonest conduct at the level of higher education is needed in order to stop unethical behaviors in the student’s subsequent occupational life. These efforts could help to lower negative behaviors, such as absenteeism, high-turnover, corruption, bribery, and other counterproductive work behaviors (see [13]). They could also promote positive values, such as inclusiveness, fairness, equality, and ethical economic, social, and environmental decision-making.
Unfortunately, many ISs are often threatened by the occurrence of non-ethical behaviors performed by students. These activities, frequently referred to as counterproductive academic behaviors or academic dishonesty (AD), directly damage institutional efforts in the social and ethical spheres. Hence, policies implemented by universities with the aim of being more sustainable must necessarily incorporate two key factors: Academic integrity as a goal to reach and academic dishonesty as a phenomenon to fight.
AD refers to an extensive range of behaviors that includes cheating on examinations, absenteeism, property damage, inappropriate use of resources, unpermitted collaboration, plagiarism, or fabrication. Among other negative effects, AD can bring about an unmerited assessment of students, interfere in the students’ ethical development, undermine the morale of faculty and academically honest peers, and weaken the reputation of academic institutions [14]. Furthermore, AD is not restricted to a concrete geographical area. Although a large part of the research on this topic has taken place in North America, some studies have proven that AD occurs on campuses all around the world (see for instance [15,16,17,18]).
Given this alarming situation, the empirical study of AD is a necessary step in order to develop effective tools against its occurrence and help universities foster sustainability and academic integrity. The current study aims to: (1) Determine the prevalence rates of AD among a sample of university students in Spain; (2) examine the extent to which students’ personality and general mental ability (GMA) explain AD; and (3) analyze the incidence of AD and previous individual differences on students’ grade point average (GPA) and contextual performance (CP).
The novelty of the present study lies in: (1) The analysis of the cited relationships using a sample of students enrolled in a Western European university. As mentioned, to date the vast majority of AD research has been performed in the North American context. Research examining the relationships tested in the current research is limited, especially in the Spanish context. Hence, we expect to contribute to the AD literature from a European point of view; (2) the study of relationships between AD and the big five dimensions using a quasi-ipsative forced-choice inventory. Empirical results produced so far in the AD literature have been obtained by using single stimulus personality inventories. However, it is well-known that single stimulus personality questionnaires are affected by faking. Despite the relevance of this issue, only one study [19] has addressed this question. Hence, it is our purpose to determine whether forced-choice quasi-ipsative inventories are a good option to predict AD; (3) the examination of the relationship between AD and contextual performance. To the best of our knowledge, the link between these two variables has never been tested; and (4) the development and testing of a structural model of the relationships among personality, general mental ability (GMA), academic dishonesty, grade point average (GPA), and contextual performance (CP), since most of the research on AD has limited the analyses to the correlational level.
To achieve the objectives of this research, we performed descriptive statistics for AD, correlational analyses, and structural equation models that will be described later. In the next sections, we will review the empirical evidence produced so far on the mentioned relationships and state the research hypotheses.

1.1. Personality and Academic Dishonesty (AD)

In an attempt to contribute to the nomological network of the psychological basis of AD, we focused on the study of the big five model of personality. Despite the earlier pessimism about the importance of this personality model on the prediction of AD (see [20]), literature reviews published on this topic point out the relevance of some of the five dimensions. The meta-analysis carried out by Cuadrado, Salgado, and Moscoso [21] showed that conscientiousness and agreeableness are negatively related to AD (ρ = −0.24 and ρ = −0.14, respectively). Both dimensions also generalize their predictive validity. Giluk and Postlethwaite [22] reached similar results (ρ = −0.22 for conscientiousness and ρ = −0.14 for agreeableness). Credé, Roch, and Kieszczynka [23] found a negative effect size between conscientiousness and academic absenteeism (ρ = −0.24). Once more, conscientiousness generalized its predictive validity. These results were expected since students scoring high in conscientiousness are responsible, organized, dutiful, and work oriented. Agreeable people are characterized by traits, such as trust, altruism, and rejection of harmful behaviors. These attributes might explain why conscientious and agreeable students are less prone to behave in a dishonest manner in the academic domain.
Moreover, recent meta-analytic research carried out in the educational and organizational domains showed that the type of personality questionnaire was a relevant moderator of the capacity of the big five personality factors to predict academic and occupational outcomes [12,24,25,26,27]. The bulk of the research was conducted using single stimulus (SS) inventories (i.e., NEO-PI-R) and no studies were done using forced-choice (FC) quasi-ipsative personality inventories. However, it is well established that: (1) FC quasi-ipsative inventories show larger validity for predicting GPA and job performance than SS inventories [26]; (2) SS inventories are affected by faking and social desirable response biases (i.e., [8,28,29]); and (3) FC personality inventories are robust against faking [27,30,31]. To the best of our knowledge, only one study [19] has partially examined the relationship between the big five and AD using a FC quasi-ipsative inventory. Therefore, additional and more complete studies using this type of measure should address this relationship. By using a FC quasi-ipsative inventory we can both estimate the link between the big five dimensions and AD and examine whether FC quasi-ipsative inventories show smaller, equal, or larger correlations that SS personality inventories. This is a relevant novelty of the current study. Therefore, based on the revised literature, we hypothesize that:
Hypothesis 1.
Conscientiousness correlates negatively with AD; and
Hypothesis 2.
Agreeableness correlates negatively with AD.

1.2. General Mental Ability (GMA) and Academic Dishonesty (AD)

GMA is another important psychological variable that might be relevant in addressing the phenomenon of AD. Research on the relationship between GMA and AD suggests a negative correlation between the variables. As Dilchert, Ones, David, and Rostow [32] state, individuals scoring lower in GMA are less likely to evaluate the repercussion of their actions. Consequently, they might be less reluctant to engage in deviant conduct. GMA has also proven to be an excellent predictor of academic performance (see [4,7,33,34]). This could be the reason why more intelligent students do not have the need to engage in prohibited behaviors in order to achieve good academic results. Meta-analyses by Cuadrado, et al., [21] and Paulhus and Dubois [35] confirmed this negative relationship (ρ = −0.19 and r = −0.26, respectively). Using academic absenteeism as the criterion variable, Credé et al., [23] found an effect size of ρ = −0.11. On the basis of the previous evidence, we posit the following hypothesis:
Hypothesis 3.
GMA correlates negatively with AD.

1.3. Academic Dishonesty (AD) and Grade Point Average (GPA)

Theoretical rationale suggests a negative relationship between AD and GPA. In this respect, it seems reasonable to believe that students who skip class, cheat on exams, or get unpermitted collaboration on assignments also get lower grades as they are not acquiring the corresponding knowledge. Consequently, the GPA of dishonest students will be affected. Meta-analyses on this subject have confirmed a negative link between the constructs. Whitley [36] found inverse relationships despite the type of academic performance measure used (r = −0.16 for GPA and r = −0.30 for specific tasks). Results by Cuadrado [37] ranged from ρ = −0.62 for examination grades to ρ = −0.35 for a mixed category of different indicators of academic performance. The result for GPA was ρ = −0.39. In all the cases, validity generalization occurred. Credé et al., [23] also reported a negative effect size between academic absenteeism and GPA (ρ = −0.41). The magnitude increased to ρ = −0.44 when the predictor variable was course grades. These results could be relevant since GPA is one of the most important variables in the academic field. GPA reflects students’ knowledge acquisition, ability, effort, and persistence. Additionally, it is an important criterion in social, educational, and organizational settings because many administrative decisions that affect students’ career (i.e., admission to certain universities, admission to master’s degrees, admission to PhD programs), economic decisions (i.e., obtainment of financial aid), and organizational decisions (i.e., inclusion in personnel selection procedures and, eventually, being hired) are based on students’ GPA (see [38,39,40]). Accordingly, in the current study, we expect that:
Hypothesis 4.
AD correlates negatively with GPA.

1.4. Academic Dishonesty (AD) and Contextual Performance (CP)

Contextual performance (CP) involves behaviors, such as helping others with their tasks, giving support to the institution, encouraging others to comply with rules, showing initiative, or volunteering in responsibilities that go beyond those formally required [41]. From an ethical perspective, the promotion of these practices can help enhance sustainability in academic institutions. The relevance of this construct lies in the nature of the cited behaviors since they are, in any case, desirable in the educational domain and subsequent occupational life.
CP has been frequently assessed and studied in organizational research (i.e., [42,43]). However, the assessment of this variable in the educational domain is very rare (see, for instance, [44]). In addition, the relationship between dishonest behaviors (counterproductive work behaviors) and contextual performance has largely been examined in organizational contexts (see [43,45]), showing a negative association between the constructs (see [46,47]). Nevertheless, the link between AD and CP has not yet been examined and, as posited before, it is an additional novelty of this study. Based on the negative relationships found in the organizational domain, our last hypothesis is:
Hypothesis 5.
AD correlates negatively with CP.

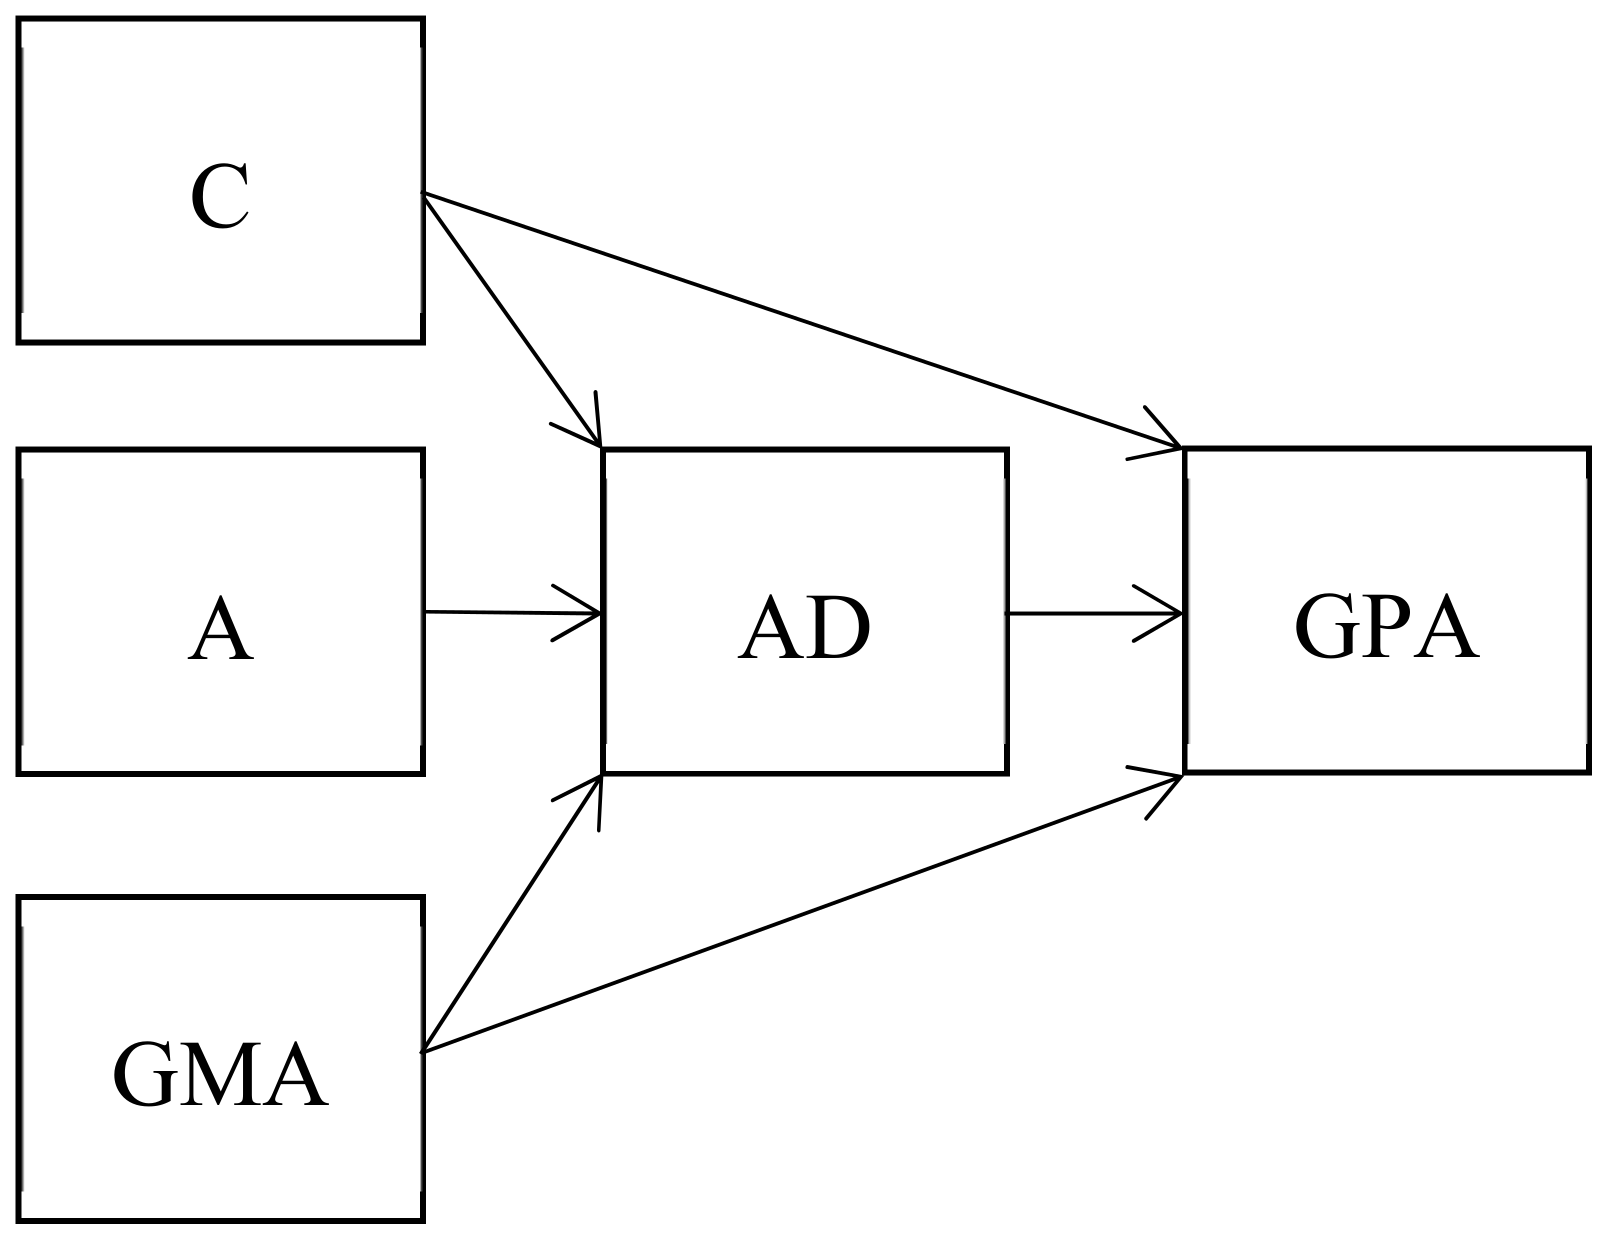
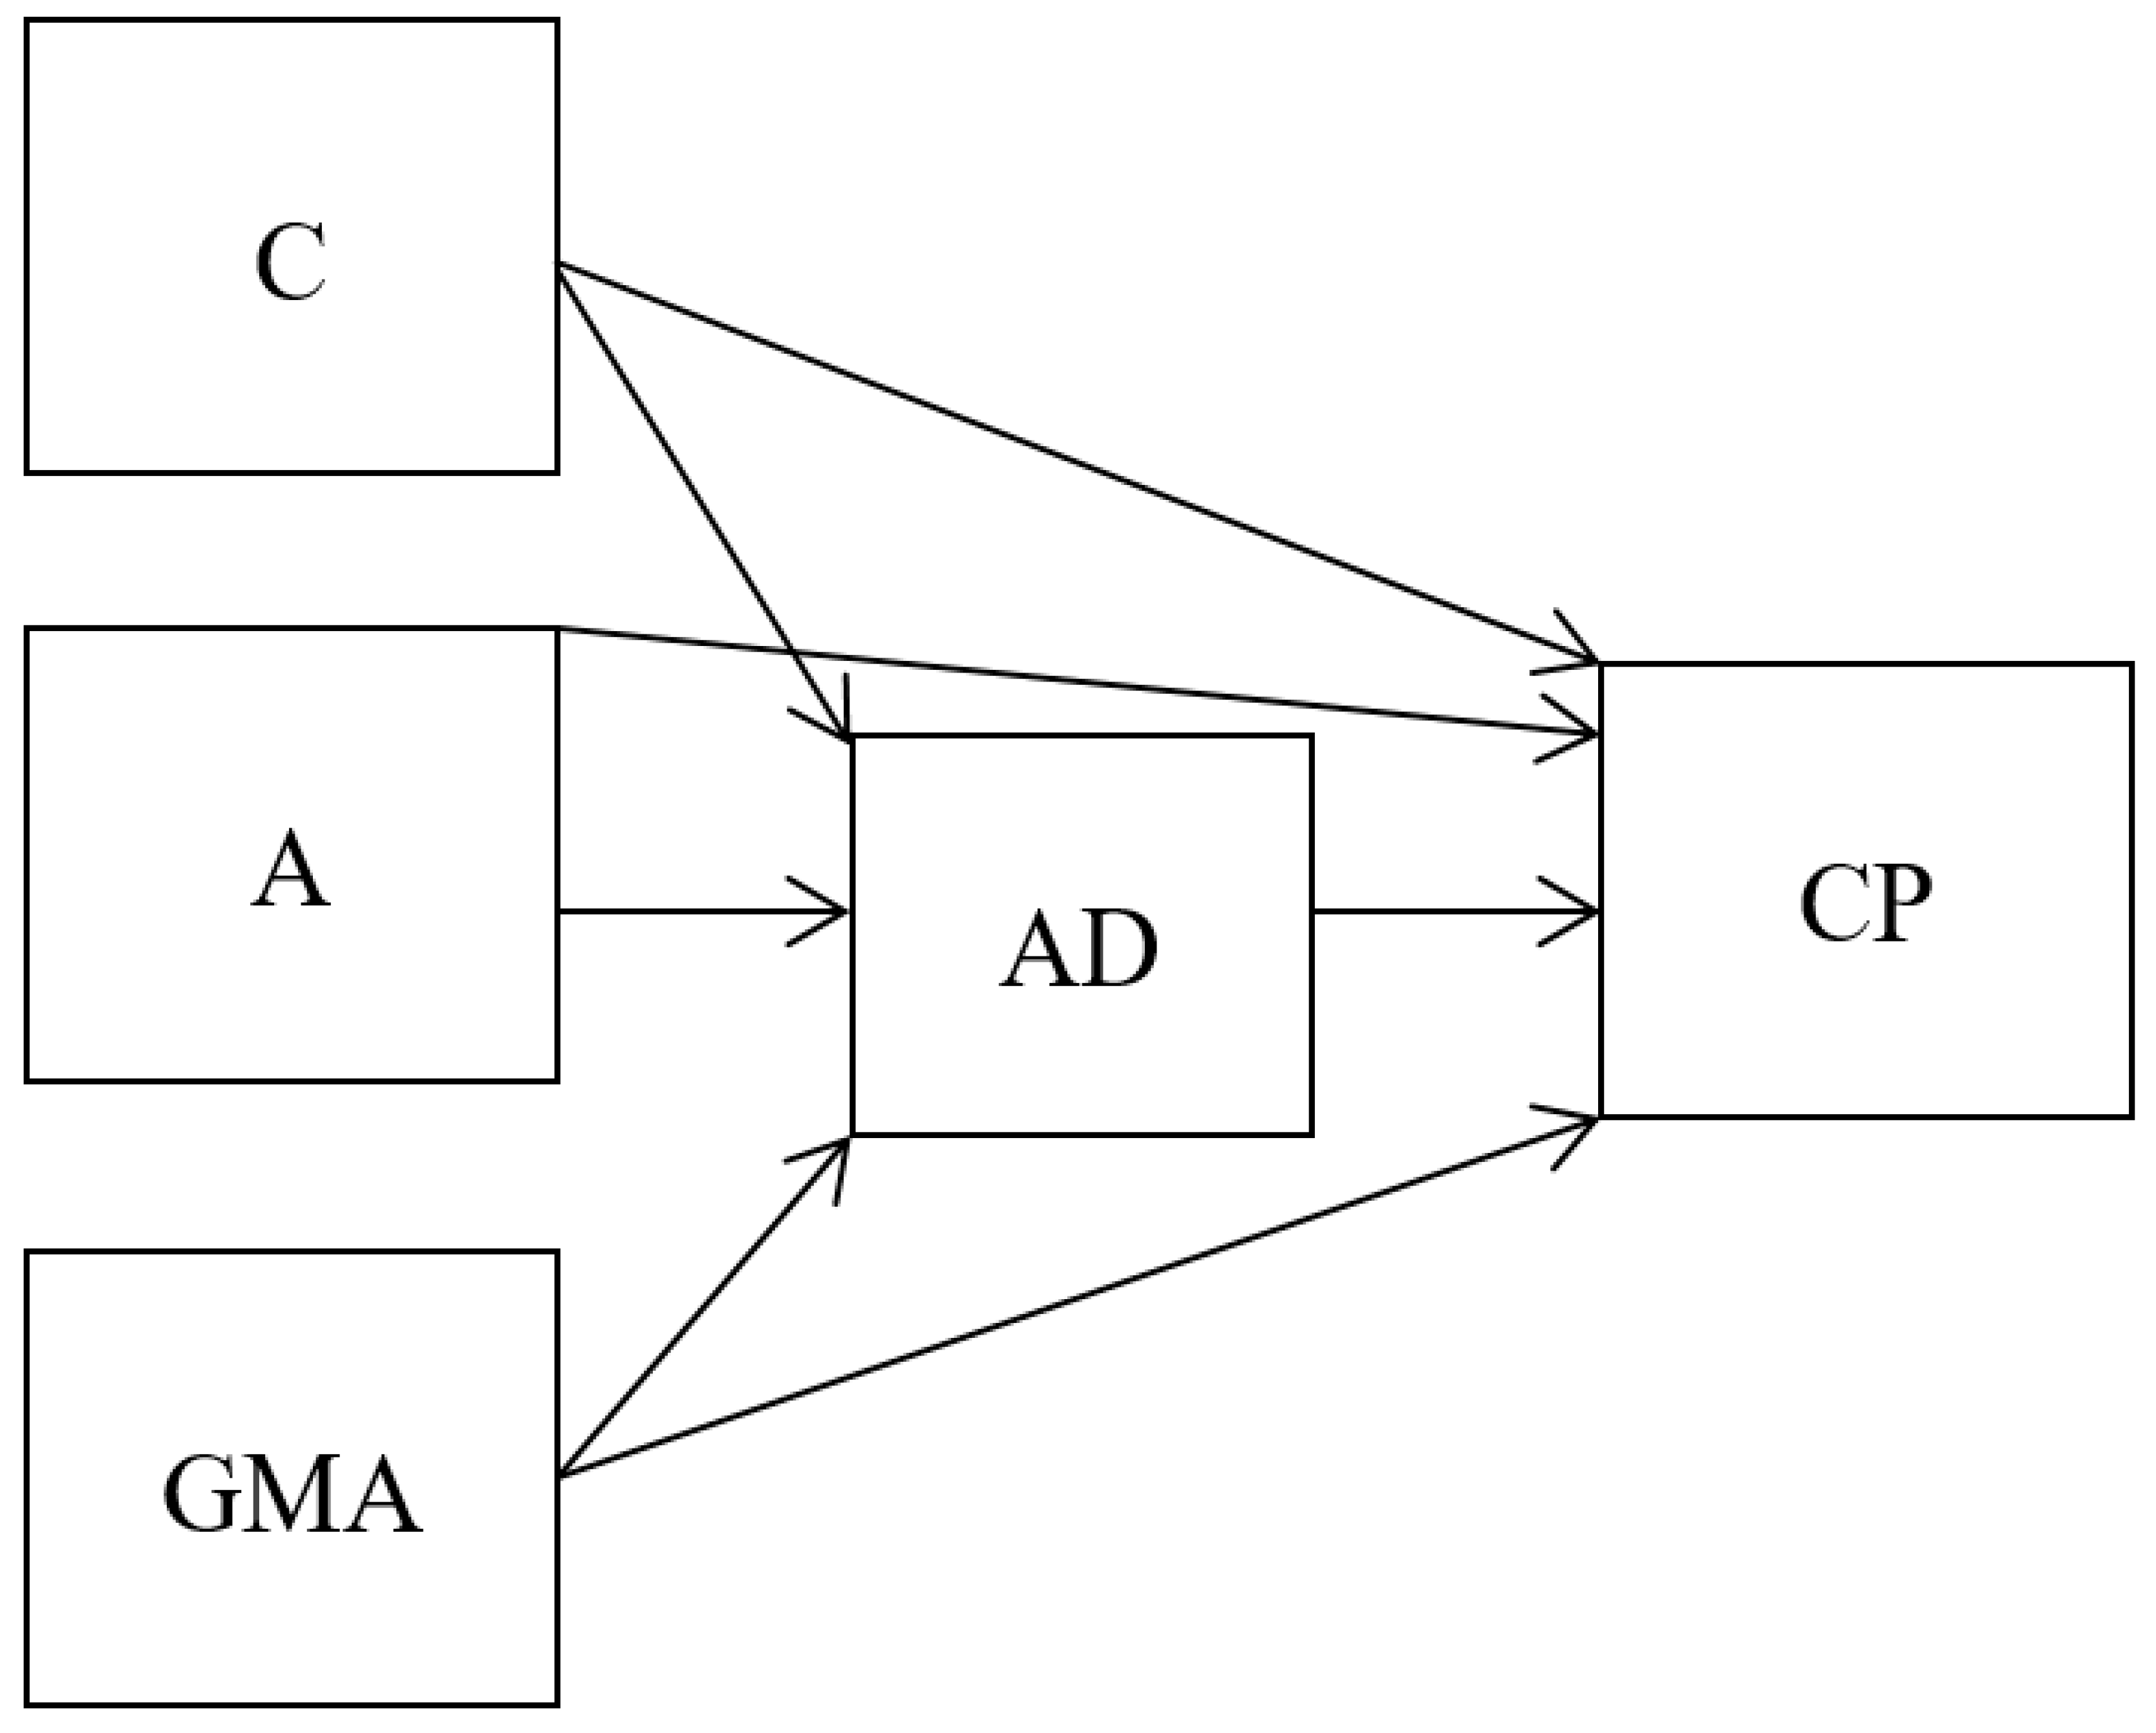
1.5. An Integrative Model of Correlates of Academic Dishonesty

The hypotheses posited in the previous sections state the expected results at the correlational level. However, the bivariate relationships among personality, GMA, AD, GPA, and CP described above do not suggest or imply direct and indirect effects among the variables. In addition, bivariate correlations do not consider the potential interactions among these variables. For this purpose, a structural model should be tested. With this aim, we applied structural equation modeling (SEM) techniques to the correlation matrix of the set of variables. To the best of our knowledge, previous research has not examined the full and complex relationships among the variables studied in this investigation.
The development of the structural model was based on the empirical evidence found in the literature reviewed in the precedent sections. Thus, as posited by hypotheses 1, 2, and 3, conscientiousness, agreeableness, and GMA correlates negatively with AD. As personality and GMA temporality precedes AD, and it is obvious that AD does not modify (increases or decreases) conscientiousness, agreeableness, and GMA, these three individual differences variables can be hypothesized as antecedents of AD in a structural model. Next, as posited in hypotheses 4 and 5, AD correlates negatively with GPA and CP. We can extend our rationale by hypothesizing that AD is an antecedent variable of GPA and CP. For example, cheating and plagiarism are behaviors committed before obtaining the exam outcomes that produce GPA. In a similar vein, we can argue that AD (i.e., cheating and plagiarism) is a previous conduct to CP. Additionally, prior research has found that conscientiousness and GMA are predictors (antecedents) of GPA, so they can show both direct and indirect (through AD) effects on GPA. Similarly, conscientiousness, agreeableness, and GMA have been linked to CP. Consequently, they can also show both direct and indirect effects on CP.
Taking these arguments together, we will test two models of the mediating role of AD, one for GPA as the dependent variable and another for CP as the dependent variable. The first model considers the two big five dimensions and GMA as direct predictors of AD and indirect predictors of GPA through AD. The second model replicates the latter but considers CP instead of GPA as the dependent variable. By testing these two models we might establish the directionality of the results found at the correlational level and, consequently, contribute to the knowledge of AD antecedents and the AD pervasive effect on these two important performance dimensions: Task performance (GPA) and contextual performance (CP). The two models will be tested using structural equation modeling (SEM) because this type of analysis allows an estimation of the magnitude of the direct and indirect effects and also provides information on the relative predictive weight of every single predictor variable (see [48]). Figure 1 and Figure 2 illustrate the structure of the relationships for these two models.

2. Materials and Methods

2.1. Procedure and Participants

The sample was composed of 388 students enrolled in the University of Santiago de Compostela (Spain). The mean age was 21.3 years old (SD = 3.4) and women accounted for 67% of the sample. In total, 89% were undergraduates, 7% were enrolled in a master’s program, and 4% were PhD students.
The study was published by posting advertisements in several university buildings calling for the voluntary participation of students. We also asked the participants to provide a copy of their academic records in which the grades gained in the taken courses and the GPA were reported. Groups ranging from 10 to 40 subjects were organized to do the tests. Students attended voluntarily, provided their informed consent, and received 10 euros as compensation for their participation. After an average of a 10-week period, a second phase of the research was carried out to calculate the test re-test reliability of the measures administrated at time 1. Altogether, 138 students participated in the research at time 2.

2.2. Measures

2.2.1. Personality (Big Five)

The big five personality dimensions were measured using the Quasi-Ipsative Personality Inventory (QI5F/Tri) developed by Salgado [49]. This inventory consists of a quasi-ipsative forced-choice measure composed of 140 triads (28 per dimension). Each triad comprises three items that assess different personality dimensions. Subjects were required to indicate which of the three statements describes them the best and which describes them the worst. The internal consistency coefficients for the current sample were, respectively, 0.67, 0.75, 0.84, 0.69, and 0.78 for emotional stability, extraversion, openness to experience, agreeableness, and conscientiousness (N = 343). Test re-test reliability coefficients ranged from r = 0.67 for emotional stability to r = 0.90 for openness to experience (N = 133). Range restriction coefficients were U = 1.22 (u = 0.82) for every dimension.

2.2.2. General Mental Ability (GMA)

General mental ability (GMA) was measured using a Spanish adaptation of the Wonderlic Personnel Test [50]. The test consists of 50 items, including word comparisons, sentence parallelisms, numerical comparisons, numerical series, analyses of geometric figures, and logic and math questions. The level of difficulty increases as the test progresses. Subjects must correctly answer the largest number of questions in 12 minutes. The Cronbach’s alpha coefficient for the current sample was α = 0.78 (N = 386) and the stability coefficient was r = 0.83 (N = 138). In the manual, the reliability coefficients obtained for the different versions of the test ranged from 0.82 to 0.94. The range restriction coefficient in this sample was U = 1.11 (u = 0.90).

2.2.3. Grade Point Average (GPA)

Academic performance was measured using the students’ grade point average (GPA) reported in the copy of the official transcripts that participants had to submit for the research. GPA is considered one of the best indicators of academic success because: (1) It represents technical knowledge, persistence, and motivation; (2) it is based on several evaluations (exams, assignments) made by different evaluators (teachers); and (3) it reflects the level of performance over a long period of time [51]. In the present study, with a range of possible values from 0 to 10, the average GPA was 6.95 (SD = 0.86, N = 359). The internal consistency coefficient was calculated using the estimations provided by seven primary studies (see Table 1). As can be seen, the mean value was α = 0.87 (SD = 0.06).

2.2.4. Contextual Performance (CP)

Contextual performance (CP) was evaluated using the Academic Contextual Performance Questionnaire (CDCE, Cuestionario de desempeño contextual en estudiantes) developed by Salgado [59]. This instrument consists of 30 items that assess the behaviors included in the taxonomy proposed by Borman et al., [41]: (1) Personal support, referring to actions, such as helping, cooperating, and motivating other students (12 items, e.g., I make suggestions to my classmates with the aim of improving their academic results); (2) organizational support, including behaviors, such as supporting and knowingly representing the university (9 items, e.g., Every time I have the opportunity, I show my explicit support to my university); and (3) conscientious initiative, which evaluates actions, such as persisting with extra effort or taking the initiative on academic opportunities (9 items, e.g., I attend courses even when they are not mandatory). Subjects had to indicate to what extent they performed the described behaviors using a Likert scale that ranged from 1 (never) to 5 (always). Both the Cronbach’s alpha and the test re-test coefficients were 0.85 (N = 344 and N = 134, respectively).

2.2.5. Academic Dishonesty (AD)

Academic dishonesty (AD) was measured using the Questionnaire of Negative Academic Performance (CDAN, Cuestionario de desempeño académico negativo) by Salgado [59]. This instrument is composed of 30 items classified in the following scales (6 items per scale): (1) Cheating on examinations (e.g., I have used crib-notes during examinations); (2) inappropriate use of resources (e.g., I have stolen objects, such as books or notebooks); (3) absenteeism (e.g., I have voluntarily failed to attend class); (4) breach of rules (e.g., I have used false excuses for my academic benefit); and (5) low effort (e.g., I have delivered poor quality works on purpose). Participants had to indicate the frequency with which they engaged in the described actions using a Likert scale ranging from 1 (never) to 5 (always). The internal consistency reliability was α = 0.89 (N = 379). It ranged from α = 0.66 for breach of rules to α = 0.84 for low-effort behaviors. The test re-test coefficient was r = 0.80 for the entire measure (N = 138), and ranged from r = 0.51 for breach of rules to r = 0.81 for low effort. U coefficient was estimated to perform the correction for range restriction when AD was used to predict GPA and CP. We obtained a U value of 1.19 (u = 0.84) when the criterion was GPA, and 1.22 (u = 0.82) when it was CP.

3. Results

3.1. Descriptive Statistics of AD

Table 2 shows AD descriptive statistics. With a distribution of values ranging between 30 and 150, the average result was 62.04 (SD = 13.02). The scores for the specific scales could vary from 6 to 30. In the current sample, the behavior most frequently performed by the students was cheating on examinations (M = 15.17, SD = 4.29), followed by absenteeism (M = 14.89, SD = 3.97) and low effort (M = 14.22, SD = 4.34). The lowest average score was for the inappropriate use of resources, with a mean of 7.85 (SD = 2.28).
Table 3 shows the frequency (in percentage) of the AD behaviors. The results showed that 77.9%, 76.5%, and 76.2% of the students reported to have engaged in absenteeism, cheating, and low-effort behaviors, respectively, at some point during their studies. However, the majority of the sample never inappropriately used academic resources (76.5%). Overall, the results confirm that AD is a widespread phenomenon among the evaluated sample.

3.2. Analyses of Correlations

Table 4 presents the correlations among the variables. Observed correlations are shown below the diagonal and corrected correlations above the diagonal. All coefficients were corrected for lack of reliability. The relationships of AD with personality, GMA, and performance were corrected for lack of reliability in predictor and criterion variables but also for indirect range restriction in the predictor variables. There are two important reasons to conduct these corrections. First, as Schmidt and Hunter [60] state, the measurement error in X and Y underestimates the real magnitude of the effect size. Second, in order to carry out multiple regression analyses and structural equation modeling, methodologists indicate that measurement error and range restriction produce the violation of the independence-of-errors assumption and, therefore, the estimation of parameters can be biased (see, for example, [48,60,61,62]). To obtain ρ values, we used a two-step process. First, we corrected the observed correlation by the attenuation effect of reliability of X and Y [48,60]. Once the last coefficient was obtained, it was corrected using the indirect rage restriction formula given by Schmidt and Hunter [60].
As reported in Table 4, sex negatively correlated with AD (r = −0.22, p < 0.01), so that men have a greater tendency than women to engage in AD. Age did not correlate with global AD. However, it was related to cheating behaviors (r = −0.12, p < 0.05).
With regard to personality dimensions, conscientiousness showed the larger correlation with AD (ρ = −0.49, p < 0.01). The analyses also indicated that conscientiousness was significantly related to AD regardless of the type of negative behavior considered, with ρ values ranging from ρ = −0.24 (p < 0.01) for breach of rules to ρ = −0.54 (p < 0.01) for low effort. These results supported hypothesis 1. Extraversion showed the second largest correlation with AD, with a positive result of ρ = 0.39 (p < 0.01). Furthermore, extraversion showed a positive and significant relationship with every type of dishonest behavior, ranging from ρ = 0.23 (p < 0.01) for inappropriate use of resources and low effort behaviors to ρ = 0.38 (p < 0.01) for absenteeism. Agreeableness also correlated significantly with AD (ρ = −0.14, p < 0.05) which supported hypothesis 2, but the correlation was not significant for all the AD facets. Emotional stability and openness to experience did not correlate significantly with AD, although emotional stability significantly correlated with absenteeism and inappropriate use of resources (ρ = 0.20, p < 0.01 and ρ = 0.24, p < 0.01, respectively) and openness to experience with absenteeism (ρ = 0.15, p < 0.05), cheating (ρ = −0.15, p < 0.05), and inappropriate use of resources (ρ = 0.14, p < 0.05).
Concerning the relationship between GMA and AD, the corrected correlation was not statistically significant. Therefore, hypothesis 3 was not supported. The result for the relationship between AD and GPA showed a ρ value of −0.34 (p < 0.01), supporting, therefore, hypothesis 4. The correlations of GPA with the AD facets of cheating, absenteeism, low effort, and breach of rules were significant and negative, ranging from ρ = −0.15 (p < 0.01) for cheating to ρ = −0.50 (p < 0.01) for low-effort behaviors. Finally, the corrected correlation between AD and CP was ρ = −0.50 (p < 0.01), which confirmed hypothesis 5. AD also correlated with the AD facets, with ρ-values ranging from ρ = −0.15 (p < 0.01) for cheating to ρ = −0.55 (p < 0.01) for low-effort behaviors.

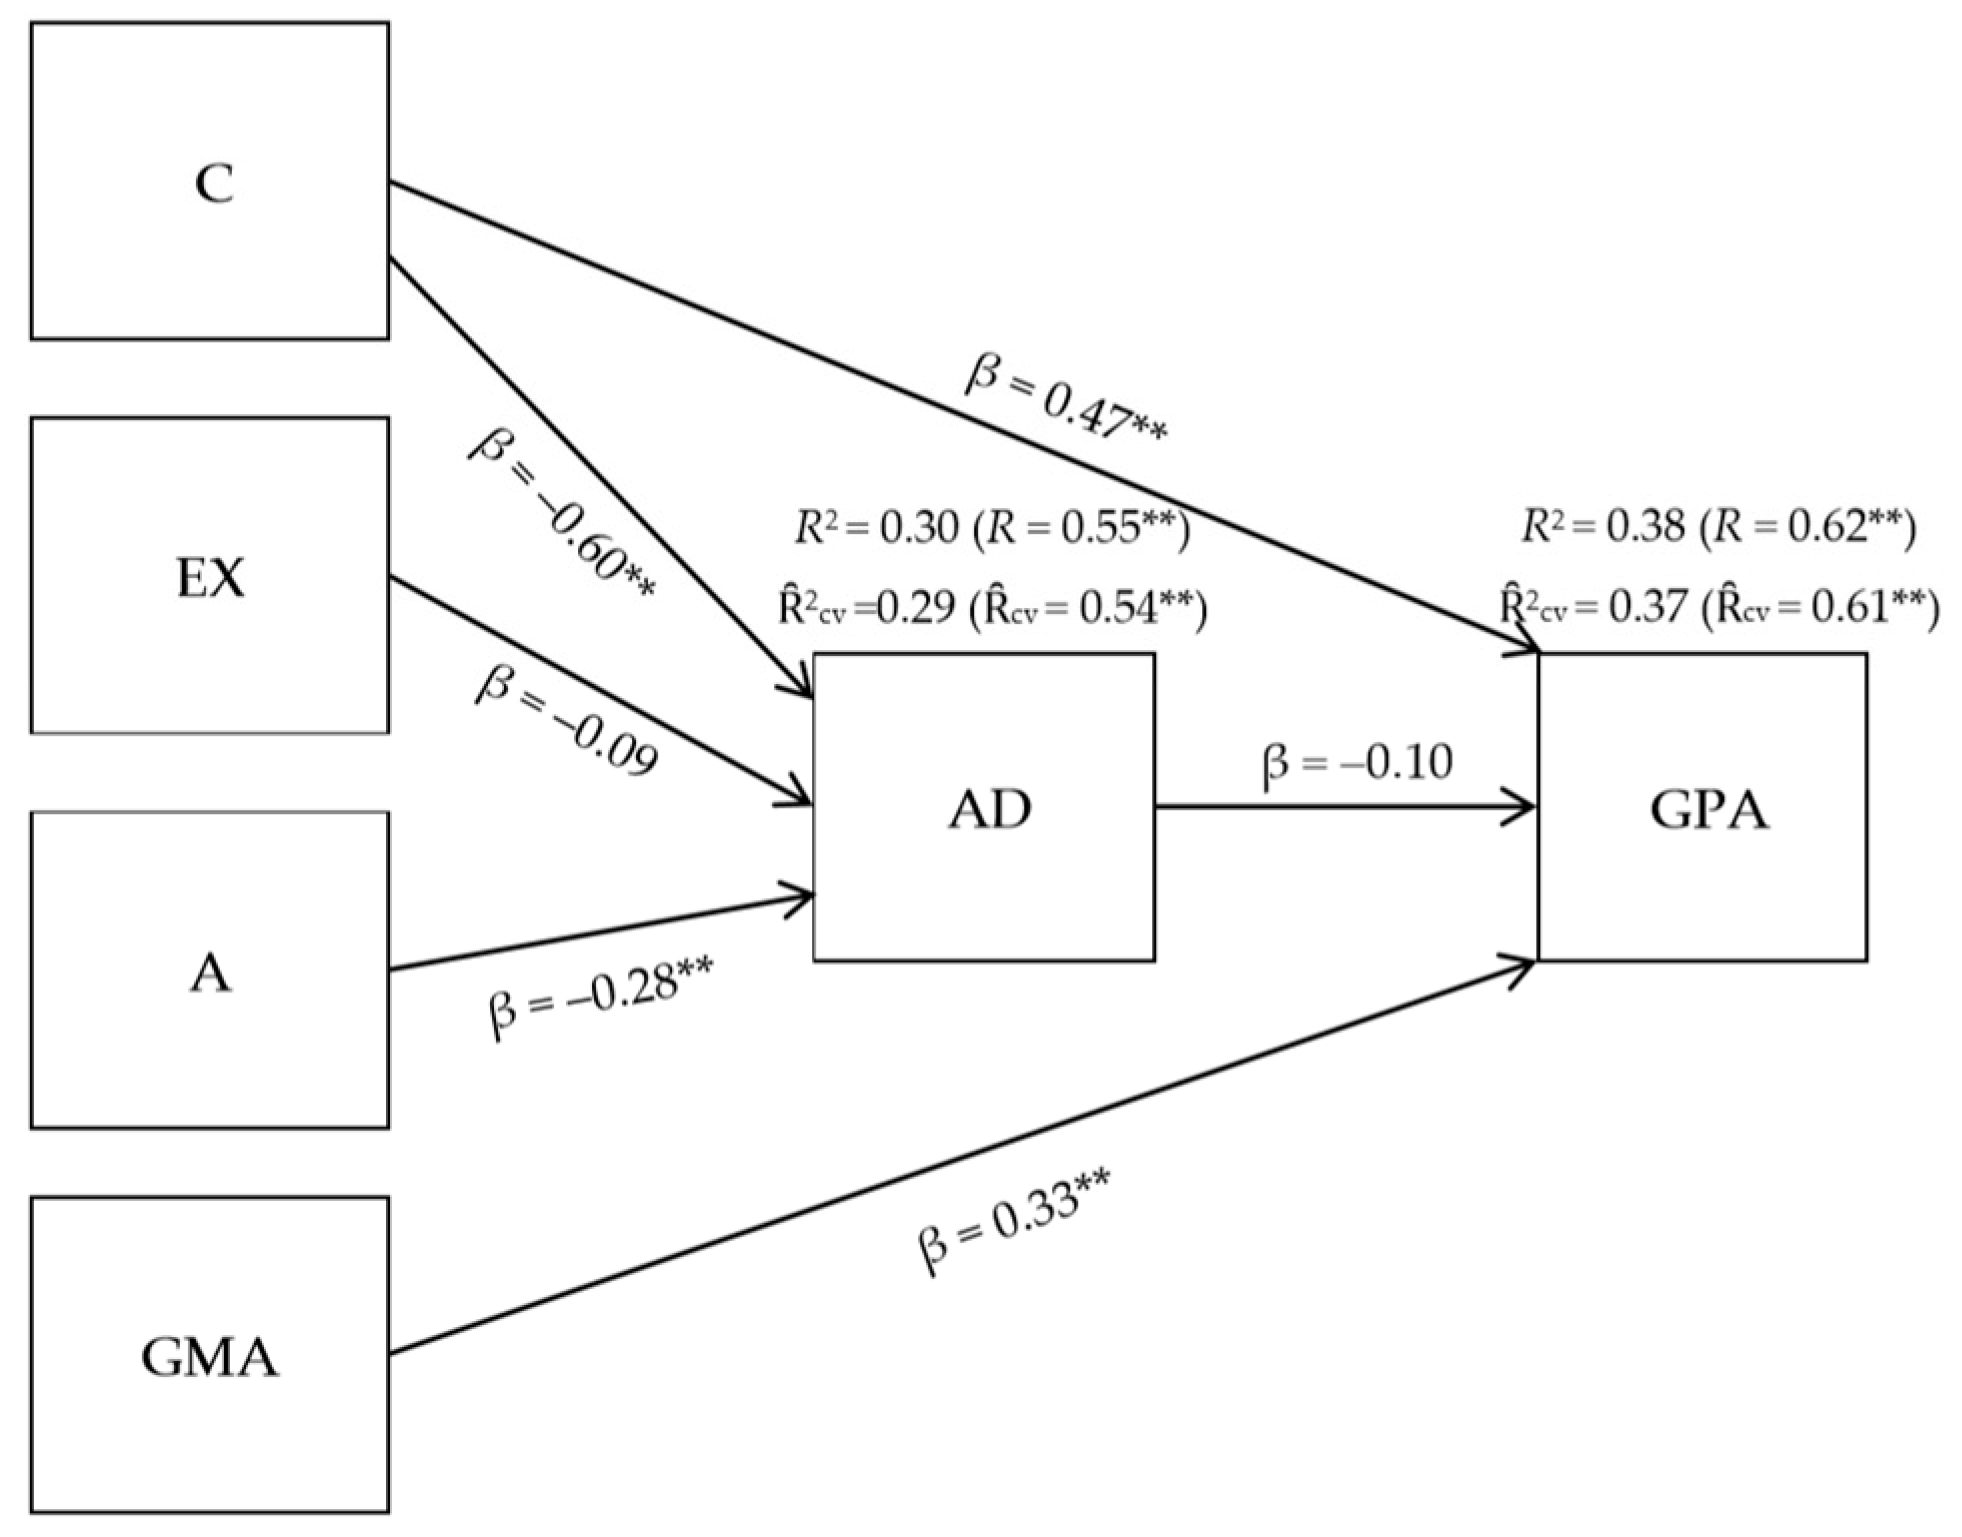
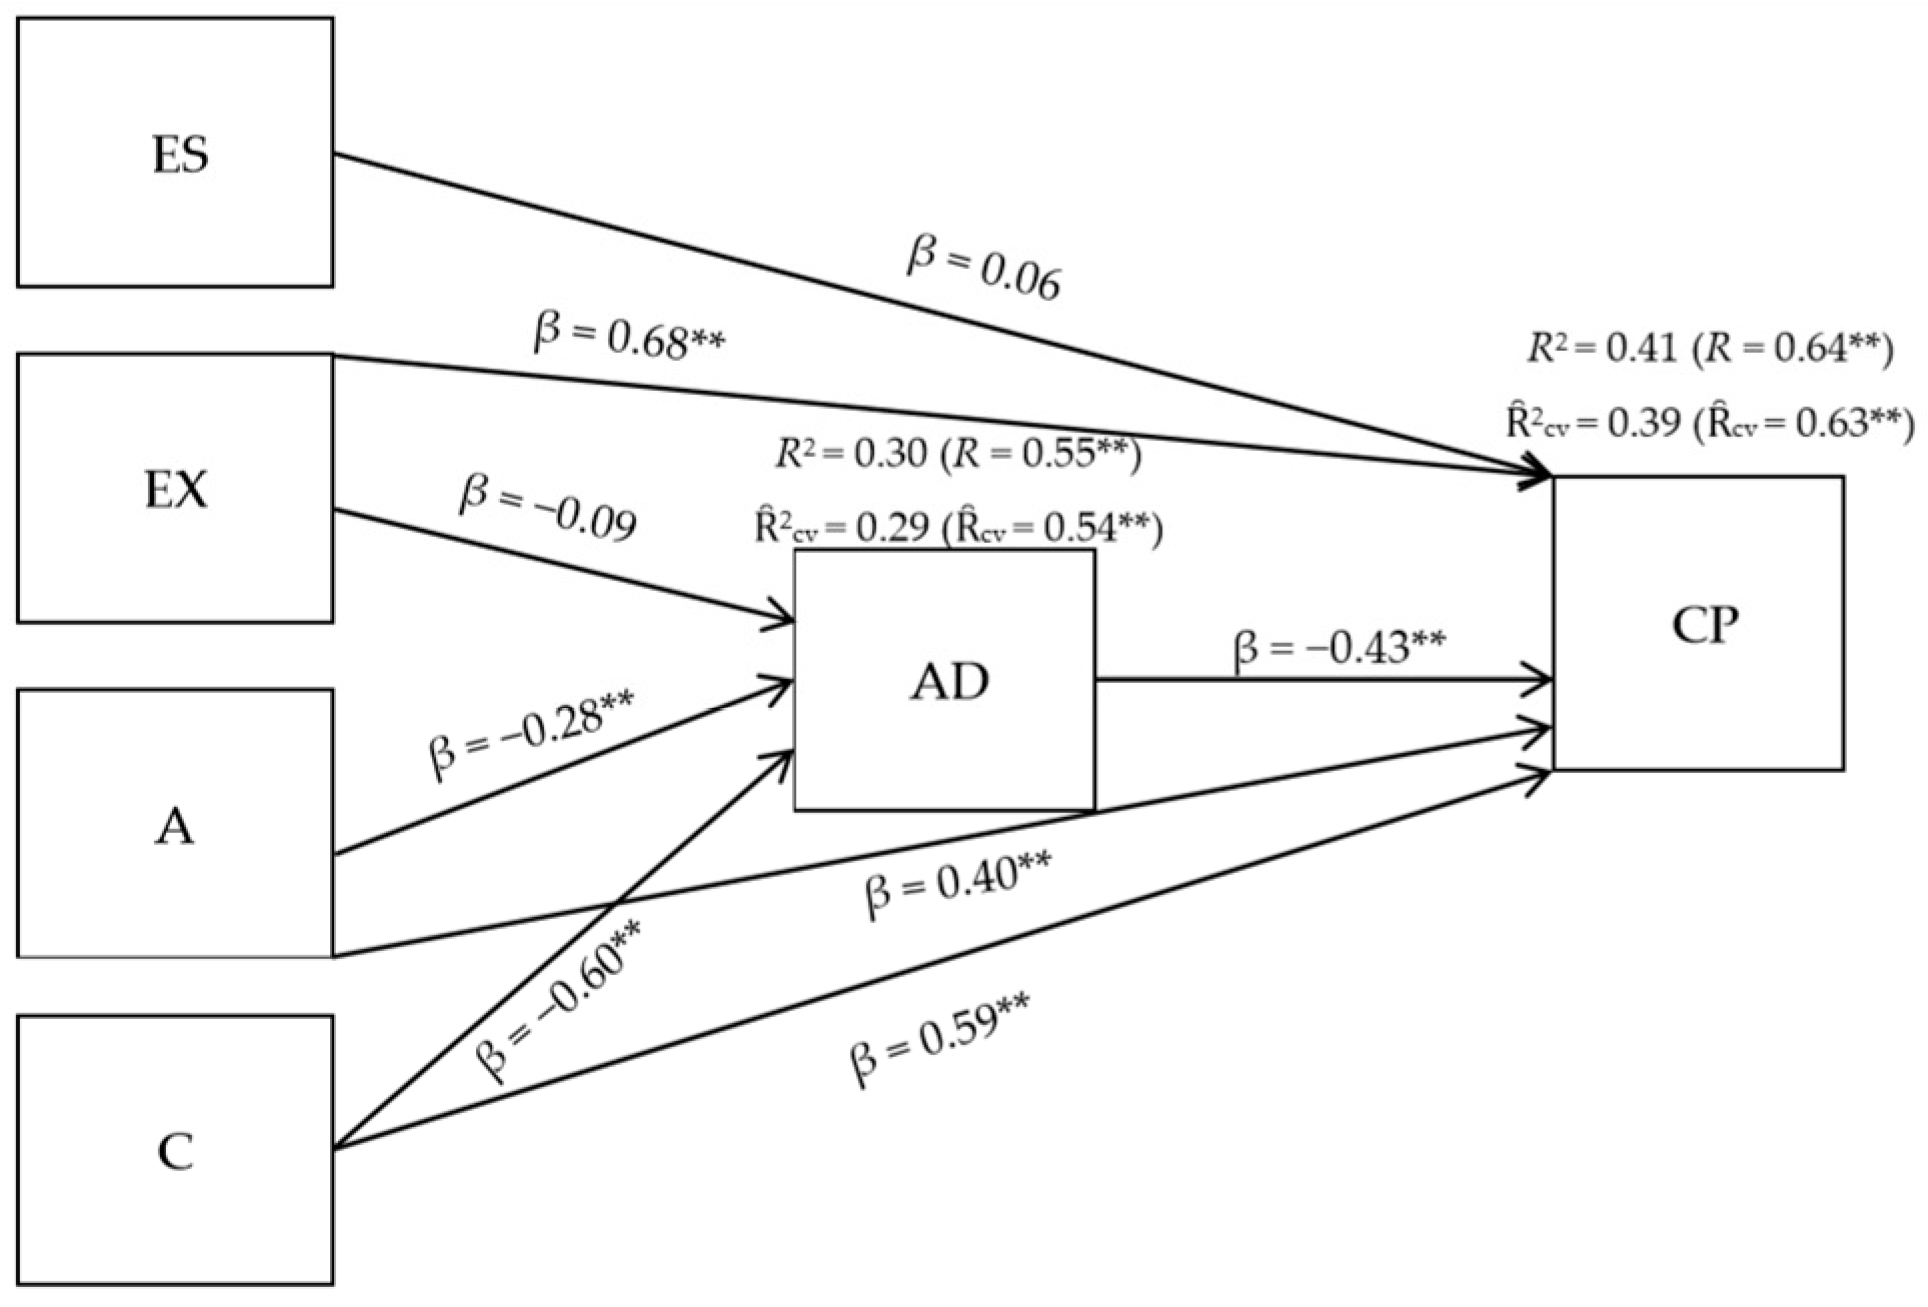
3.3. Structural Equation Models

Next, on the basis of the results described in the matrix of corrected correlations, we tested two structural equation models, one for GPA as the dependent variable and another for CP as the dependent variable. The tested models are slightly different from those previously hypothesized since the considered relationships are based on the correlational results. Hence, in model 1, the criterion variables were: (1) AD directly predicted by conscientiousness, extraversion, and agreeableness; and (2) GPA directly predicted by AD, conscientiousness, GMA, and extraversion (which also predicts indirectly GPA through AD). In model 2, the criterion variables were: (1) AD directly predicted by conscientiousness, extraversion, and agreeableness; and (2) CP directly predicted by emotional stability, GMA, and conscientiousness (which also predicts GPA indirectly through AD). We used the program LISREL 8.2 [63] to carry out the models’ estimation.
After testing the relationships described for model 1, the fit indexes were not as satisfactory as expected. Thus, considering that the standardized weight from extraversion to GPA was almost null, we proceeded to its removal from the regression equation. The result of this change was a good fit of the data to the model. The χ2 test was not significant (6.96, p = 0.73), the comparative fit index (CFI) showed a magnitude of 0.99, the root mean square error of approximation (RMSEA) had a value of 0.065, and the root mean square residual (RMR) was 0.026. A graphical representation of the model appears in Figure 3. As the figure shows, conscientiousness was the most robust predictor of AD (β = −0.60, p < 0.01). Conscientiousness, extraversion, and agreeableness accounted altogether for 30% of AD validity (R2 = 0.30, R = 0.55, p < 0.01). However, as R and R2 estimators are biased due to potential capitalization on chance in regression analyses, we calculated the cross-validation coefficient (Ȓcv) and the square cross-validation coefficient (Ȓ2cv) using Browne’s formula [64]. The obtained values were Ȓcv = 0.54 and Ȓ2cv = 0.29 (p < 0.01).
Among the variables that had a direct effect on GPA, conscientiousness appeared again as the best predictor (β = 0.47, p < 0.01). The result for GMA was β = 0.33 (p < 0.01). The effect of AD on GPA was β = −0.10, partially explained by the personality dimensions predicting AD. The overall GPA variance accounted for the previous variables was 38% (R2 = 0.38, R = 0.62, p < 0.01). The Ȓcv and Ȓ2cv coefficients were 0.61 (p < 0.01) and 0.37, respectively.
It must be noted that the direct effects from agreeableness and conscientiousness to AD were noticeably higher than the true validity coefficients previously found for these relationships (β = −0.60 and ρ = −0.49 for conscientiousness and β = −0.28 and ρ = −0.14 for agreeableness). These findings suggest a potential suppressor effect. A suppressor effect occurs when the inclusion of a second predictor increases the predictive capacity of one or more predictors [65]. In the current model, we identified the variables most strongly related to conscientiousness and agreeableness to test the existence of suppressor effects. Next, we proceeded to remove these variables one by one from the regression equation in which AD was the criterion in order to test the effects of the removals on the magnitude of beta weights and R2. In this case, the elimination of agreeableness caused a reduction on conscientiousness’ beta coefficient from −0.60 to −0.41. Furthermore, R2 decreased from R2 = 0.30 to R2 = 0.25. On the other hand, by eliminating conscientiousness from the equation, agreeableness beta weight decreased from −0.28 to −0.01 and R2 from 0.30 to 0.15. These findings suggest the existence of a reciprocal suppressor effect. Finally, although the effects of the removal of extraversion on conscientiousness’ beta and agreeableness’ beta coefficients were examined, in none of the cases did R2 change.
Following the suggestions by MacKinnon [48] and MacKinnon, Lockwood, Hoffman, West, and Sheets [66], we tested the significance of the suppressor effects using Sobel’s test and 95% confidence intervals (CIs) of the suppressor effects using the distribution of the product of the regression coefficients (z test). We used the software of Preacher and Leonardelli [67] to obtain Sobel test values and the software of Tofighi and MacKinnon ([68], https://amplab.shinyapps.io/MEDCI/) to obtain the 95% CIs. As can be seen in Table 5, all the suppressor effects were significant.
Figure 4 presents the model for CP. As it was the case for model 1, after testing the initial model, we observed that the fit indexes could be still improved. Hence, we performed the following modifications in the regression equations: (1) We included extraversion as a determinant of CP; and (2) we also introduced agreeableness as a direct predictor of CP. These changes have empirical support because extraversion is related to some dimensions of CP, such as interpersonal facility [69], and agreeableness is shown to be a strong predictor of CP [41,69,70]. In addition, given that the fit indexes could be still improved, we performed a third change by removing GMA as a predictor of CP because it did not significantly contribute to its prediction. The fit indexes were a non-significant χ2 test (0.92, p = 0.34), a comparative fit index (CFI) of 1.00, a root mean square error of approximation (RMSEA) of 0.00, and a root mean square residual (RMR) of 0.01. A graphical representation of the model appears in Figure 2. As the figure shows, conscientiousness, extraversion, and agreeableness accounted for 30% of variance of AD (R2 = 0.30, R = 0.55, p < 0.01), conscientiousness being the dimension with the strongest predictive weight (β = −0.60, p < 0.01). Ȓcv was 0.54 (p < 0.01) and Ȓ2cv was 0.29. With regard to CP, the predictor variables explained the 41% of its variance (R2 = 0.41, R = 0.64, p < 0.01). The Ȓcv coefficient had a magnitude of 0.63 (p < 0.01) and Ȓ2cv of 0.39. Extraversion has an important influence, with a beta coefficient of 0.68 (p < 0.01). Conscientiousness and agreeableness also showed significant positive beta coefficients (β = 0.59 and β = 0.40, p < 0.01) and AD showed a significant negative impact on CP (β = −0.43, p < 0.01).
Considering that extraversion was not related to CP according to the correlational analyses, we examined the existence of suppressor effects. As was done in model 1, we eliminated one by one from the regression equation those variables that were highly related to extraversion at the correlational level. When conscientiousness was removed, extraversion beta changed from 0.68 to 0.24 and R2 from 0.41 to 0.33. When we eliminated agreeableness, the beta weight of extraversion decreased from 0.68 to 0.32 and R2 from 0.41 to 0.33. Therefore, a reciprocal suppressive effect was confirmed. Furthermore, when conscientiousness and agreeableness were removed from the equation at the same time, the beta weight of extraversion showed its lower magnitude (β = 0.20). When extraversion was excluded from the analyses, the beta coefficients of conscientiousness and agreeableness decreased from 0.59 to −0.01 and from 0.40 to 0.06, respectively. In this case, R2 decreased from 0.41 to 0.29.
We also found that by eliminating conscientiousness, the predictive weight of agreeableness changed and vice versa. Thus, when conscientiousness was eliminated from the equation, the beta size of agreeableness went from 0.40 to 0.12, while R2 fell to 0.33. Similarly, by removing agreeableness from the analyses, the predictive weight of conscientiousness varied from 0.59 to 0.20 and R2 to 0.33. These findings supported the existence of three reciprocal suppressor effects that are summarized in Table 5. As in the previous model, we tested their significance using the test of Sobel and calculated the 95% confidence intervals. All the suppressor effects were significant with the exception of the effect of extraversion on agreeableness. In this case, Sobel’s test was −0.70 (p = 0.485) and the 95% confidence interval ranged between −0.05 and +0.02. Finally, the beta results obtained for the personality variables that directly predict AD appeared to be affected by the same suppressor effects already described in model 1.

4. Discussion

Universities have a crucial role in promoting sustainable development as they are the institution most responsible for the transfer of scientific and technical knowledge from generation to generation. Additionally, higher learning institutions have a duty to promote the ethical growth of their students. Sustainable universities must not only concern themselves with lowering the negative environmental impact they make in their day-to-day operations, nor must they solely focus on minimizing each student´s individual ecological footprint. While these are nevertheless vital towards creating a more sustainable future, a university that truly wishes to lead in overcoming the drastic environmental issues we face today must instill a sense of integrity in each student by creating an environment conducive to honesty and ethical practices. The occurrence of AD behaviors can jeopardize the efforts made by the university towards sustainability as students who perform AD may then continue on to perform similarly dishonest acts in the workplace or in governmental institutions, where both the stakes and the impact are much higher (see for instance [71,72,73]). The present research reports some findings that could help academic administrators to boost academic integrity. The main goal was to address the phenomenon of AD in a European university by analyzing its level of occurrence and some of its potential causal factors and consequences. Our results contributed to the AD literature in several aspects: (1) The realization of a study on AD in the Spanish context, where the tested relationships have hardly ever been studied, is a novel issue and a contribution to the literature since AD has been mainly examined from a North American perspective; (2) because single stimulus personality questionnaires are affected by social desirability, we assessed students’ personality by using a forced-choice quasi-ipsative inventory. To the best of our knowledge, only one study [19] had previously addressed this question; (3) we tested the link between AD and CP, a relationship that had not yet been studied in the scientific literature. Considering the relevance of this construct, to address the impact that AD could have on it is also a novel contribution; and (4) considering that most of the studies on AD have limited their analyses to the correlational level, the current research contributes to the side of the causes and consequences of this phenomenon by carrying out structural equation model analyses (SEM), which not only allow determination of the predictive validity of multiple variables considered at the same time but also inform on the relative predictive weight of the predictors. In the following paragraphs, we summarize the main findings of the current research.
With regard to the AD frequency rates, 60% of the sample engaged in some kind of AD behavior. The most prevalent forms of dishonesty were absenteeism, cheating, and low-effort behaviors. Results indicated that 78%, 77%, and 76% of students, respectively, have committed these practices at some point during their studies. Overall, we can conclude that AD is a widespread problem that, in Europe, occurs as often as in America (see for instance [51,52,53,54]).
Correlational analyses showed that conscientiousness, extraversion, and agreeableness are the most related variables to AD. These results follow those produced in previous meta-analyses by Cuadrado et al., [21], Giluk and Postlethwaite [22], and Credé et al., [23], which posited the relevance of conscientiousness and agreeableness in the explanation of AD. Extraverted students also appeared to be prone to behaving in a dishonest manner in the current sample. Extraverted individuals show a greater tendency to be impulsive, risky, and daring [74,75,76,77]. These traits might explain extraverts’ lack of concern to engage in AD. They are also inclined to experience exciting and stimulating activities that could reduce the time they dedicate to academic requirements. Therefore, the pressure to achieve good academic results could drive them to engage in AD (i.e., cheating on exams). It must also be noted that the magnitude of the effect sizes reached for these personality dimensions is equal or greater than that reported by previous meta-analyses (see [21,22,23]). This finding could be explained by the type of response format used in the personality inventory QI5F/Tri [49]. As previously described, the QI5F/Tri is a quasi-ipsative forced-choice test, a type of measure that has proven to be faking resistant when compared to single-stimulus measures [27,77,78]. Empirical evidence has shown that quasi-ipsative forced-choice inventories have the same or greater predictive validity than normative, ipsative, and single stimulus tests regarding occupational and academic performance (see [22,25,26]). On the basis of the current results, quasi-ipsative tests can be a convenient option to predict AD.
GMA did not correlate with AD. This result differs from those reported in previous meta-analyses by Cuadrado et al., [21], Paulhus and Dubois [35], and Credé et al., [23]. A possible explanation might be the existence of moderator variables that affect the magnitude of the effect size. Future studies on this topic should address the impact of variables, such as the academic discipline, the existence of deterrence measures, or students’ perceptions and attitudes towards AD.
Correlational analyses also revealed an association between AD and GPA. The relevance of this result lies in the practical importance of GPA. As previously mentioned, GPA is a widely used criterion for academic, occupational, and administrative decisions that affect, in multiple ways, students’ prospects [38,39,40]. Consequently, finding out the variables that might account for the GPA variance is an issue of great interest. Specifically, when the different dimensions of AD were analyzed separately, the results indicated that two of the most frequently performed behaviors were also those more highly related to GPA: Low effort and absenteeism. Indeed, it is reasonable to think that students who do not put much effort into their academic duties are also those who get lower grades. Similarly, students who skip class will likely also miss out on the information given by the professor to be assessed in examinations. This could consequently result in a difference in grades when compared to the students who attend class.
We also found a large negative correlation between AD and CP. This finding could have important implications for academic administrators given the valuable nature of the behaviors included in this construct (i.e., voluntarily developing skills, being considered and polite to others, showing initiative, or assuming new responsibilities, among others). The obtained result was not surprising since AD behaviors are frequently opposed to CP practices. For instance, students will not support their classmates if they take inappropriate advantage of their work (i.e., if they assume a lower workload in group tasks). Likewise, when students misuse the facilities provided by the center, they are not showing commitment to the institution.
Finally, the structural equation models showed that extraversion, agreeableness, and conscientiousness partially explain AD. Results indicated that conscientiousness is the key factor of the big five model when it comes to predicting AD. These results suggest once more the convenience of assessing these personality dimensions in applied educational processes, not only because they have shown to determine AD but also because conscientiousness is the best of the five dimensions at predicting academic success [6,79,80]. Admission to masters’ degrees, to PhD programs, or to professional internships promoted by universities are examples of processes that could be improved with the evaluation of students’ personality.
The models also proved the mediating role of AD on GPA and CP. These results highlight the convenience of assessing AD as a key factor in educational processes not only because of the relevance of this kind of conduct itself but also because AD is a proven determinant of GPA and CP, two critical criteria in the academic field. The mediating character of AD is a crucial issue to be considered when personality measures are used to predict academic outcomes. The obtained correlations will be influenced by the occurrence of AD and its mediating position will also affect the explained variance of the criteria. As a whole, the variables used in model 1 and 2 were proven to determine 38% and 41% of the GPA and CP variance, respectively. The magnitude of these results can be considered highly satisfactory in the assessment of individual differences, a field that has been often criticized by the “small effects” typically found [81,82]. These results support the use of both model 1 and model 2 as potential tools for researchers and academic practitioners in the prediction of AD, GPA, and CP.

4.1. Suggestions for Future Research and for Practitioners

Future research should focus on two major issues. First, on conducting primary studies about the tested relationships in countries other than the United States and Canada. This is an essential step to perform meta-analyses that allow for a comprehensive comparison with results found in the North American context. Second, on the publication of new studies that analyze additional variables that might account for the remaining variance of AD, GPA and CP.
We also state three recommendations for practitioners and the academic administration overall. First, to use quasi-ipsative forced-choice personality inventories in the prediction of AD, GPA, and CP in order to improve academic decision-making. Second, to focus on the importance of CP as a relevant criterion closely related to ethical and moral sustainability, and to promote policies that reinforce these behaviors. Third, to consider the control of AD as a main target of sustainability due to the fact that: (a) It is a large-scale phenomenon that causes serious consequences; (b) most students have engaged in AD at some point during their academic career; and (c) AD is a proven antecedent of students’ GPA and CP.

4.2. Study Limitations

Similar to many empirical studies, the present one also has some limitations that must be noticed. First, the research was not anonymous and, therefore, there is a possibility that some of the results might be biased due to socially desirable responses, especially those concerning AD. Although our prevalence estimations can be described as high, it is possible that real rates of AD might be even higher. Second, for a better comparison between the validity of SS and FC quasi-ipsative inventories, two questionnaires should be used. However, time limitations precluded the use of two personality inventories since this would require an excessively large testing session.

5. Conclusions

In summary, the present research has contributed to a better knowledge of the prevalence, causes, and consequences of AD. As the world faces countless ethical and social crises, the study of AD in academic institutions becomes as important as demanding a higher level of integrity in any other type of organization. Universities are asked to make institutional efforts that keep sustainability on track. The results found in the current study can be useful in accomplishing this goal. We encourage future researchers to replicate this research and to continue examining other potential causes and consequences of AD.

Author Contributions

All authors listed have made substantial, direct, and intellectual contribution to this research. Conceptualization, J.F.S.; Formal analysis, D.C., J.F.S., and S.M.; Funding acquisition, J.F.S. and S.M.; Investigation, D.C., J.F.S., and S.M.; Writing—original draft, D.C., J.F.S., and S.M.

Funding

This research was funded by Ministry of Economy and Competitiveness, grant number PSI2017-87603-P to Jesús F. Salgado and Silvia Moscoso.

Acknowledgments

We acknowledge the support given by Alexandra Martínez and Inmaculada Otero during the data collecting and coding procedures.

Conflicts of Interest

The authors declare no conflict of interest. The funders had no role in the design of the study; in the collection, analyses, or interpretation of data; in the writing of the manuscript, or in the decision to publish the results.

References

  1. Pfeffer, J. Building sustainable organizations: The human factor. Acad. Manag. Perspect. 2010, 24, 34–45. [Google Scholar] [CrossRef]
  2. Sammalisto, K.; Lindhqvist, T. Integration of sustainability in higher education: A study with international perspectives. Innov. High. Educ. 2008, 32, 221–233. [Google Scholar] [CrossRef]
  3. Di Fabio, A. The psychology of sustainability and sustainable development for well-being in organizations. Front. Psychol. 2017, 8, 1534. [Google Scholar] [CrossRef] [PubMed]
  4. Kuncel, N.R.; Hezlett, S.A.; Ones, D.S. A comprehensive meta-analysis of the predictive validity of the graduate record examinations: Implications for graduate student selection and performance. Psychol. Bull. 2001, 127, 162–181. [Google Scholar] [CrossRef] [PubMed]
  5. Kuncel, N.R.; Ones, D.S.; Sackett, P.R. Individual differences as predictors of work, educational, and broad life outcomes. Personal. Individ. Differ. 2010, 49, 331–336. [Google Scholar] [CrossRef]
  6. Poropat, A.E. A meta-analysis of the five-factor model of personality and academic performance. Psychol. Bull. 2009, 135, 322–338. [Google Scholar] [CrossRef]
  7. Postlethwaite, B.E. Fluid Ability, Crystallized Ability, and Performance across Multiple Domains: A Meta-Analysis. Ph.D. Thesis, University of Iowa, Iowa, IO, USA, 2011. [Google Scholar]
  8. Salgado, J.F. A theoretical model of psychometric effects of faking on assessment procedures: Empirical findings and implications for personality at work. Int. J. Sel. Assess. 2016, 24, 209–228. [Google Scholar] [CrossRef]
  9. Strenze, T. Intelligence and socioeconomic success: A meta-analytic review of longitudinal research. Intelligence 2007, 35, 401–426. [Google Scholar] [CrossRef]
  10. O’Connor, M.C.; Paunonen, S.V. Big Five personality predictors of post-secondary academic performance. Personal. Individ. Differ. 2007, 43, 971–990. [Google Scholar] [CrossRef]
  11. Richardson, M.; Abraham, C.; Bond, R. Psychological correlates of university students’ academic performance: A systematic review and meta-analysis. Psychol. Bull. 2012, 138, 353–387. [Google Scholar] [CrossRef]
  12. Salgado, J.F.; Táuriz, G. The Five-Factor Model, forced-choice personality inventories and performance: A comprehensive meta-analysis of academic and occupational validity studies. Eur. J. Work Organ. Psychol. 2014, 23, 3–30. [Google Scholar] [CrossRef]
  13. Dilchert, S. Counterproductive sustainability behaviors and their relationship to personality traits. Int. J. Sel. Assess. 2018, 26, 49–56. [Google Scholar] [CrossRef]
  14. Whitley, B.E., Jr.; Keith-Spiegel, P. Academic Dishonesty: An Educator’s Guide; Lawrence Erlbaum Associates, Inc.: Mahwah, NJ, USA, 2002. [Google Scholar]
  15. Brimble, M.; Stevenson-Clarke, P. Perceptions of the Prevalence and Seriousness of Academic Dishonesty in Australian Universities. Aust. Educ. Res. 2005, 32, 19–44. [Google Scholar] [CrossRef]
  16. Ison, D.C. The influence of the Internet on plagiarism among doctoral dissertations: An empirical study. J. Acad. Ethics 2015, 13, 151–166. [Google Scholar] [CrossRef]
  17. Teixeira, A.A.; Rocha, M.F. Academic cheating in Austria, Portugal, Romania and Spain: A comparative analysis. Res. Comp. Int. Educ. 2006, 1, 198–209. [Google Scholar] [CrossRef]
  18. Teixeira, A.A.; Rocha, M.F. Cheating by economics and business undergraduate students: An exploratory international assessment. High. Educ. 2010, 59, 663–701. [Google Scholar] [CrossRef]
  19. Hendy, N.T. Forced-choice personality measures and academic dishonesty: A comparative study. J. Acad. Ethics 2017, 15, 293–306. [Google Scholar] [CrossRef]
  20. Williams, K.M.; Nathanson, C.; Paulhus, D.L. Identifying and profiling scholastic cheaters: Their personality, cognitive ability, and motivation. J. Exp. Psyhol. Appl. 2010, 16, 293–307. [Google Scholar] [CrossRef]
  21. Cuadrado, D.; Salgado, J.F.; Moscoso, S. Personality, Intelligence, and Academic Dishonesty: A Meta-analysis. J. Personal. Soc. Psychol. 2019. Under review. [Google Scholar]
  22. Giluk, T.L.; Postlethwaite, B.E. Big Five Personality and Academic Dishonesty: A Meta-analytic Review. Personal. Individ. Differ. 2015, 72, 59–67. [Google Scholar] [CrossRef]
  23. Credé, M.; Roch, S.G.; Kieszczynka, U.M. Class Attendance in College: A Meta-Analytic Review of the Relationship of Class Attendance with Grades and Student Characteristics. Rev. Educ. Res. 2010, 80, 272–295. [Google Scholar] [CrossRef]
  24. Fisher, P.A.; Robie, C.; Christiansen, N.D.; Speer, A.B.; Schneider, L. Criterion-related validity of forced-choice personality measures: A cautionary note regarding Thurstonian IRT versus classical test theory scoring. Personal. Assess. Dec. 2019, 5. [Google Scholar] [CrossRef]
  25. Salgado, J.F. Moderator effects of job complexity on the validity of forced-choice personality inventories for predicting job performance. J. Work Organ. Psychol. 2017, 33, 229–238. [Google Scholar] [CrossRef]
  26. Salgado, J.F.; Anderson, N.; Táuriz, G. The validity of ipsative and quasi-ipsative forced-choice personality inventories for different occupational groups: A comprehensive meta-analysis. J. Occup. Organ. Psychol. 2015, 88, 797–834. [Google Scholar] [CrossRef]
  27. Salgado, J.F.; Lado, M. Faking resistance of a quasi-ipsative forced-choice personality inventory without algebraic dependence. J. Work Organ. Psychol. 2018, 34, 213–216. [Google Scholar] [CrossRef]
  28. Viswesvaran, C.; Ones, D.S. Meta-analyses of fakability estimates: Implications for personality measurement. Educ. Psychol. Meas. 1999, 59, 197–210. [Google Scholar] [CrossRef]
  29. Birkeland, S.A.; Manson, T.M.; Kisamore, J.L.; Brannick, M.T.; Smith, M.A. A meta-analytic investigation of job applicant faking on personality measures. Int. J. Sel. Assess. 2006, 14, 317–335. [Google Scholar] [CrossRef]
  30. Cao, M.; Drasgow, F. Does forcing reduce faking? A meta-analytic review of forced-choice personality measures in high-stakes situations. J. Appl. Psychol. 2019. [Google Scholar] [CrossRef]
  31. Martínez, A. Empirical Evaluation of a Theoretical Model of the Faking Effects on Occupational Personality Measures. Ph.D. Thesis, University of Santiago de Compostela, Santiago de Compostela, Spain, July 2019. [Google Scholar]
  32. Dilchert, S.; Ones, D.S.; Davis, R.D.; Rostow, C.D. Cognitive Ability Predicts Objectively Measured Counterproductive Work Behaviors. J. Appl. Psychol. 2007, 92, 616–627. [Google Scholar] [CrossRef]
  33. Kuncel, N.R.; Hezlett, S.A.; Ones, D.S. Academic performance, career potential, creativity, and job performance: Can one construct predict them all? J. Personal. Soc. Psychol. 2004, 86, 148–161. [Google Scholar] [CrossRef]
  34. Salgado, J.F.; Moscoso, S. A New Look at Validity of the GATB Tests of General Mental Ability for Five Academic and Organizational Criteria. Front. Psychol. 2019, in press. [Google Scholar]
  35. Paulhus, D.L.; Dubois, P.J. The link between cognitive ability and scholastic cheating: A meta-analysis. Rev. Gen. Psychol. 2015, 19, 183–190. [Google Scholar] [CrossRef]
  36. Whitley, B.E., Jr. Factors associated with cheating among college students: A review. Res. High. Educ. 1998, 39, 235–274. [Google Scholar] [CrossRef]
  37. Cuadrado, D. Deshonestidad Académica, Desempeño y Diferencias Individuales. Ph.D. Thesis, University of Santiago de Compostela, Santiago de Compostela, Spain, 2018. [Google Scholar]
  38. Briihl, D.S. Life after College: Psychology Students’ Perceptions of Salary, Business Hiring Criteria, and Graduate Admission Criteria. N. Am. J. Psychol. 2001, 3, 321–330. [Google Scholar]
  39. Reilly, R.R.; Warech, M.A. The Validity and Fairness of Alternatives to Cognitive Tests. In Policy Issues in Employment Testing; Wing, L.C., Gifford, B.R., Eds.; Kluwer: Boston, MA, USA, 1994; pp. 131–224. [Google Scholar]
  40. Rynes, S.L.; Orlitzky, M.O.; Bretz, R.D. Experienced hiring versus college recruiting: Practices and emerging trends. Personal. Psychol. 1997, 50, 309–339. [Google Scholar] [CrossRef]
  41. Borman, W.C.; Penner, L.A.; Allen, T.D.; Motowidlo, S.J. Personality Predictors of Citizenship Performance. Int. J. Sel. Assess. 2001, 9, 52–69. [Google Scholar] [CrossRef]
  42. Hoffman, B.J.; Blair, C.A.; Meriac, J.P.; Woehr, D.J. Expanding the criterion domain? A quantitative review of the OCB literature. J. Appl. Psychol. 2007, 92, 555–566. [Google Scholar] [CrossRef]
  43. Harari, M.B.; Reaves, A.C.; Viswesvaran, C. Creative and innovative performance: A meta-analysis of the relationship with task, citizenship, and counterproductive job performance dimensions. Eur. J. Work Organ. Psychol. 2016, 25, 495–511. [Google Scholar] [CrossRef]
  44. Gore, J.S.; Kiefner, A.E.; Combs, K.M. Personality Traits that Predict Academic Citizenship Behavior. J. Appl. Soc. Psychol. 2012, 42, 2433–2456. [Google Scholar] [CrossRef]
  45. Carpenter, N.C.; Berry, C.M. Are counterproductive work behaviour and withdrawal empirically distinct? A meta-analytic investigation. J. Manag. 2017, 43, 834–863. [Google Scholar] [CrossRef]
  46. Dalal, R.S. A Meta-analysis of the Relationship between Organizational Citizenship Behavior and Counterproductive Work Behavior. J. Appl. Psychol. 2005, 90, 1241–1255. [Google Scholar] [CrossRef] [PubMed]
  47. Podsakoff, N.P.; Whiting, S.W.; Podsakoff, P.M.; Blume, B.D. Individual-and organizational-level consequences of organizational citizenship behaviors: A meta-analysis. J. Appl. Psychol. 2009, 94, 122–141. [Google Scholar] [CrossRef] [PubMed]
  48. MacKinnon, D.P. Introduction to Statistical Mediation Analysis; Lawrence Erlbaum Associates: Mahwah, NJ, USA, 2008. [Google Scholar]
  49. Salgado, J.F.; University of Santiago de Compostela, Santiago de Compostela, Spain. Reliability, Construct and Criterion Validity of the Quasipsative Personality Inventory (QI5F/Tri). 2019. [Google Scholar]
  50. Wonderlic Personnel Test. Wonderlic Personnel Test User’s Manual; Wonderlic: Libertyville, IL, USA, 1992. [Google Scholar]
  51. Kuncel, N.R. The Prediction and Structure of Academic Performance. Ph.D. Thesis, University of Minnesota, Minneapolis, MN, USA, 2003. [Google Scholar]
  52. DeRosier, M.E.; Lloyd, S.W. The Impact of Children’s Social Adjustment on Academic Outcomes. Read. Writ. Q. 2011, 27, 25–47. [Google Scholar] [CrossRef] [PubMed]
  53. Hanks, A.R.; Beier, M.E. Differential Prediction of Preparatory and Performance Self-Efficacy Judgments. Hum. Perform. 2012, 25, 318–334. [Google Scholar] [CrossRef]
  54. LeBlanc, P.H., III. The Relationship between Attendance and Grades in the College Classroom. In Proceedings of the 17th Annual Conference of the International Academy of Business Disciplines, Pittsburgh, PA, USA, 17 April 2005. [Google Scholar]
  55. McNeal, R.B., Jr. Parent involvement, academic achievement and the role of student attitudes and behaviors as mediators. Univ. J. Educ. Res. 2014, 2, 564–576. [Google Scholar] [CrossRef]
  56. Salgado, J.F.; Moscoso, S.; University of Santiago de Compostela, Santiago de Compostela, Spain. Individual Differences, Negative Performance, and Academic Outcomes. 2012. [Google Scholar]
  57. Schmitt, N.; Oswald, F.L.; Friede, A.; Imus, A.; Merritt, S. Perceived fit with an academic environment: Attitudinal and behavioral outcomes. J. Vocat. Behav. 2008, 72, 317–335. [Google Scholar] [CrossRef]
  58. Thompson, R.A.; Zamboanga, B.L. Academic aptitude and prior knowledge as predictors of student achievement in introduction to psychology. J. Educ. Psychol. 2004, 96, 778–784. [Google Scholar] [CrossRef]
  59. Salgado, J.F.; University of Santiago de Compostela, Santiago de Compostela, Spain. Escalas de Desempeño Académico: CDTE, CDCE y CDAN. 2010. [Google Scholar]
  60. Schmidt, F.L.; Hunter, J.E. Methods of Meta-Analysis: Correcting Error and Bias in Research Findings; Sage: Thousand Oaks, CA, USA, 2015. [Google Scholar]
  61. Hoyle, R.H.; Kenny, D.A. Sample Size, Reliability, and Tests of Statistical Mediation. In Statistical Strategies for Small Sample Research; Hoyle, R., Ed.; Sage: Thousand Oaks, CA, USA, 1999; pp. 195–222. [Google Scholar]
  62. Muthén, B.O.; Muthén, L.K.; Asparouhov, T. Regression and Mediation Analysis Using Mplus; Muthén & Muthén: Los Angeles, CA, USA, 2016. [Google Scholar]
  63. Jöreskog, K.; Sörbom, D. LISREL 8.20 and PRELIS 2.20.; Scientific Software Inc.: Chicago, IL, USA, 1998. [Google Scholar]
  64. Browne, M.W. Predictive Validity of a Linear Regression Equation. Br. J. Math. Stat. Psychol. 1975, 28, 79–87. [Google Scholar] [CrossRef]
  65. Watson, D.; Clark, L.A.; Chmielewski, M.; Kotov, R. The value of suppressor effects in explicating the construct validity of symptom measures. Psychol. Assess. 2013, 25, 929–941. [Google Scholar] [CrossRef]
  66. MacKinnon, D.P.; Lockwood, C.M.; Hoffman, J.M.; West, S.G.; Sheets, V. A comparison of methods to test mediation and other intervening variable effects. Psychol. Methods 2002, 7, 83–104. [Google Scholar] [CrossRef]
  67. Preacher, K.; Leonardelli, G. Calculation for the Sobel Test: An Interactive Calculation Tool for Mediation Tests. 2003. Available online: http://quantpsy.org/sobel/sobel.htm (accessed on 12 November 2017).
  68. Tofighi, D.; MacKinnon, D.P. RMediation: An R package for mediation analysis confidence intervals. Behav. Res. Methods 2011, 43, 692–700. [Google Scholar] [CrossRef] [PubMed] [Green Version]
  69. Hurtz, G.M.; Donovan, J.J. Personality and job performance: The Big Five revisited. J. Appl. Psychol. 2000, 85, 869–879. [Google Scholar] [CrossRef] [PubMed]
  70. Organ, D.W.; Ryan, K. A meta-analytic review of attitudinal and dispositional predictors of organizational citizenship behavior. Personal. Psychol. 1995, 48, 775–802. [Google Scholar] [CrossRef]
  71. Nonis, S.; Swift, C.O. An examination of the relationship between academic dishonesty and workplace dishonesty: A multicampus investigation. J. Educ. Bus. 2001, 77, 69–77. [Google Scholar] [CrossRef]
  72. Sims, R.L. The relationship between academic dishonesty and unethical business practices. J. Educ. Bus. 1993, 68, 207–211. [Google Scholar] [CrossRef]
  73. McCabe, D.L. Cheating among college and university students: A North American perspective. Int. J. Educ. Integr. 2005, 1, 1–11. [Google Scholar] [CrossRef]
  74. Rettinger, D.A.; Jordan, A.E.; Peschiera, F. Evaluating the motivation of other students to cheat: A vignette experiment. Res. High. Educ. 2004, 45, 873–890. [Google Scholar] [CrossRef]
  75. Smyth, M.L.; Davis, J.R. Perceptions of dishonesty among two-year college students: Academic versus business situations. J. Bus. Ethics 2004, 51, 63–73. [Google Scholar] [CrossRef]
  76. Witherspoon, M.; Maldonado, N.; Lacey, C.H. Undergraduates and academic dishonesty. Int. J. Bus. Soc. Sci. 2012, 3, 76–86. [Google Scholar]
  77. Christiansen, N.D.; Burns, G.N.; Montgomery, G.E. Reconsidering Forced-Choice Item Formats for Applicant Personality Assessment. Hum. Perform. 2005, 18, 267–307. [Google Scholar] [CrossRef]
  78. Jackson, D.N.; Wroblewski, V.R.; Ashton, M.C. The impact of faking on employment tests: Does forced choice offer a solution? Hum. Perform. 2000, 13, 371–388. [Google Scholar] [CrossRef]
  79. McAbee, S.T.; Oswald, F.L. The criterion-related validity of personality measures for predicting GPA: A meta-analytic validity competition. Psychol. Assess. 2013, 25, 532–544. [Google Scholar] [CrossRef] [PubMed]
  80. Trapmann, S.; Hell, B.; Hirn, J.O.W.; Schuler, H. Meta-analysis of the relationship between the Big Five and academic success at university. J. Psychol. 2007, 215, 132–151. [Google Scholar] [CrossRef]
  81. Glass, G.V.; McGaw, B.; Smith, M.L. Meta-Analysis in Social Research; Sage: London, UK, 1981. [Google Scholar]
  82. Ozer, D.J. Correlation and the coefficient of determination. Psychol. Bull. 1985, 97, 307–315. [Google Scholar] [CrossRef]
Figure 1. Relationships among the variables of Model 1.
Sustainability 11 06062 g001
Note: C = conscientiousness, A = agreeableness; GMA = general mental ability; AD = academic dishonesty; GPA = grade point average.
Figure 2. Relationships among the variables of Model 2.
Sustainability 11 06062 g002
Note: C = conscientiousness, A = agreeableness; GMA = general mental ability; AD = academic dishonesty; CP = contextual performance.
Figure 3. Relationships among the variables of Model 1. * p < 0.05. ** p < 0.01.
Sustainability 11 06062 g003
Figure 4. Graphical representation of Model 2. * p < 0.05. ** p < 0.01.
Sustainability 11 06062 g004
Table 1. GPA reliability distribution.
StudyNα
[52] DeRosier and Lloyd (2011)12550.88
[53] Hanks and Beier (2012)600.78
[54] LeBlanc III (2005)16170.88
[55] McNeal (2014)12,1010.88
[56] Salgado and Moscoso (2012)4100.87
[57] Schmitt, Oswald, Friede, Imus, and Merrit (2008)9030.85
[58] Thompson and Zamboanga (2004)3470.98
Σ = 16,693M = 0.87
SD = 0.06
Table 2. Descriptive statistics of academic dishonesty.
MSDN Max. Min.
Academic Dishonesty62.0413.0237912330
Cheating15.174.29379306
Inappropriate use of resources 7.852.28379216
Absenteeism14.893.97379286
Breach of rules9.903.08379286
Low effort 14.224.34379296
Table 3. Percentage of subjects engaging in AD behaviors at each level of frequency.
CheatingInappropriate Use of ResourcesAbsenteeismBreach of RulesLow Effort
Never23.576.522.156.623.8
Hardly ever25.517.226.126.531.3
Sometimes32.35.537.213.332.6
Usually12.10.510.82.78.7
Always6.60.33.80.93.6
Note: N = 379.
Table 4. Observed and corrected correlations among the variables.
MeanSDSexAgeESEXOPACGMAGPACPADCHERESABSBRLE
1. Sex0.670.47−0.09−0.34 **−0.01−0.15 **0.010.27 **−0.16 **0.050.21 **−0.22 **−0.13 *−0.20 **−0.25 **−0.10 *−0.17 **
2. Age21.323.36−0.090.15 **−0.060.07−0.040.00−0.050.03−0.01−0.07−0.12 *−0.02−0.05−0.090.00
3. ES22.826.74−0.28 **0.12 *0.67−0.14 *−0.110.01−0.26 **−0.03−0.10−0.24 **0.130.000.24 **0.20 **0.040.05
4. EX28.397.89−0.01−0.05−0.100.75−0.11−0.33 **−0.64 **−0.07−0.33 **−0.000.39 **0.36 **0.23 **0.38 **0.29 **0.23 **
5. OP27.669.63−0.14 **0.06−0.08−0.090.84−0.22 **−0.16 **0.23 **0.09−0.040.03−0.15 *0.14 *0.15 *−0.120.10
6. A29.716.710.01−0.030.01−0.24 **−0.17 **0.69−0.19 **−0.16 *−0.130.12−0.14 *−0.18 **−0.26 **−0.10−0.22 **−0.10
7. C25.228.280.24 **0.00−0.19 **−0.49 **−0.13 *−0.14 **0.78−0.010.51 **0.27 **−0.49 **−0.33 **−0.26 **−0.46 **−0.24 **−0.54 **
8. GMA22.585.25−0.14 **−0.04−0.02−0.050.19 **−0.12 *−0.010.780.33 **−0.12 *−0.05−0.100.06−0.06−0.06−0.01
9. GPA6.950.860.050.03−0.08−0.21 **0.08−0.080.35 **0.25 **0.870.09−0.34 **−0.15 *−0.03−0.26 **−0.25 **−0.50 **
10. CP109.3712.490.19 **−0.01−0.15 **−0.00−0.030.080.18 **−0.090.16 **0.85−0.50 **−0.15 *−0.38 **−0.51 **−0.34 **−0.55 **
11. AD62.0413.02−0.21 **−0.070.080.27 **0.02−0.09−0.35 **−0.04−0.26 **−0.37 **0.890.80 **0.72 **0.95 **0.99 **0.88 **
12. CHE15.174.29−0.12 *−0.11 *0.000.24 **−0.10−0.11−0.22 **−0.07−0.11 **−0.100.69 **0.830.31 **0.47 **0.59 **0.36 **
13. RES7.852.28−0.17 **−0.020.14 *0.14 *0.09−0.15 **−0.14 *0.04−0.02−0.25 **0.58 **0.24 **0.730.59 **0.58 **0.37 **
14. ABS14.893.97−0.22 **−0.040.12 *0.24 **0.10−0.06−0.30 **−0.04−0.18 **−0.35 **0.78 **0.37 **0.44 **0.760.64 **0.63 **
15. BR9.903.08−0.08−0.070.020.17 **−0.07−0.12 *−0.14 *−0.04−0.16 **−0.21 **0.76 **0.44 **0.40 **0.45 **0.660.70 **
16. LE14.224.34−0.16 **0.000.030.15 **0.070.06−0.38 **−0.01−0.37 **−0.40 **0.76 **0.30 **0.29 **0.50 **0.52 **0.84
Note: N = 343–488; Cronbach alfa coefficients are presented in italics in the diagonal; Observed correlations are presented below the diagonal; Corrected correlations are presented above the diagonal; Sex was coded 0 for male and 1 for female; ES = emotional stability; EX = extraversion; OP = openness to experience; A = agreeableness; C = conscientiousness; GMA = general mental ability; GPA = grade point average; CP = contextual performance; AD = academic dishonesty; CHE = cheating; RES = inappropriate use of resources; ABS = absenteeism; BR = breach of rules; LE = low effort. * p < 0.05. ** p < 0.01.
Table 5. Analyses of Suppressor Effects of Model 1 and 2.
βR2Sobel Testαβ (z Test)95% CI αβ
LLUP
Model 1
Effects on C
w/o A−0.410.252.95 (p = 0.00)0.050.020.08
Effects on A
w/o C−0.010.153.43 (p = 0.00)0.100.050.16
Model 2
Effects on EX
w/o C0.240.33−6.34 (p = 0.00)−0.30−0.41−0.19
w/o A0.320.33−2.15 (p = 0.03)−0.04−0.09−0.01
Effects on C
w/o A0.200.33−0.49 (p = 0.01)−0.04−0.07−0.01
w/o EX−0.010.29−4.22 (p = 0.00)−0.19−0.29−0.04
Effects on A
w/o C0.120.33−3.04 (p = 0.00)−0.06−0.10−0.02
w/o EX0.060.29−0.70 (p = 0.49)−0.04−0.05+0.02
Note: For model 1, the initial predictive weights of the variables involved in the suppressor effects are β = −0.60 **, β = −0.28 **, for conscientiousness and agreeableness. Initial R2 (AD) is 0.30. For model 2, the initial predictive weights of the variables involved in the suppressor effects are β = 0.68 **, β = 0.59 **, and β = 0.40 ** for extraversion, conscientiousness, and agreeableness. Initial R2 (CP) is 0.41; C = conscientiousness; A = agreeableness; EX = extraversion; β = new predictive weight of each personality dimension after removing from the regression equation one of the remaining two personality variables; R2 (CP) = explained variance of CP; αβ (test z) = level of significance for the confidence interval; 95% CI αβ LL/UL = lower limit and upper limit of the 95% confidence interval of the suppressor effects.

