Article

Realizing Sustainable Development via Modified Integrated Weighting MCDM Model for Ranking Agrarian Dataset

1
School of Information Technology and Engineering, Vellore Institute of Technology, Vellore 632 014, Tamil Nadu, India
2
Department of Computer Science and Information Engineering, National Yunlin University of Science and Technology, Douliu City 64002, Yunlin County, Taiwan
*
Author to whom correspondence should be addressed.
Sustainability 2019, 11(21), 6060; https://doi.org/10.3390/su11216060
Submission received: 18 September 2019 / Revised: 22 October 2019 / Accepted: 28 October 2019 / Published: 31 October 2019

Abstract

:
One of the crucial elements in decision-making is the calculation of criteria weights. In this paper, a new Modified Integrated Weighting (MIW) method was proposed to combine the weights obtained using different weight calculation methods into a single set of weights. The weights express the relative significance of the criteria and play an essential role in making correct decisions. The proposed method considered both subjective knowledge of the experts and the objectivity of the problem by combining the subjective and objective weight assignment methods. The proposed weight calculation method was applied to the agriculture dataset for the evaluation of groundnut crop sites. A decision-making model was developed via the proposed MIW method and Complex Proportional Assessment (COPRAS) method to rank the given groundnut crop site dataset. The ranking results of the developed decision model were compared with the ranking results of average yield data and other methods for validation purposes. The developed model exhibited better results for the given dataset and could be used to solve various other decision-making problems, thereby realizing sustainable development.

1. Introduction

Decision-making is the process of identifying the best option from the given set of alternatives, which is characterized by multiple criteria [1]. Multi-criteria decision-making (MCDM) methods are applied to assist the decision-makers in selecting the best alternative based on some purpose [2,3,4]. There are three main steps in solving decision-making problems with multiple criteria: the first step is to obtain the criteria and alternatives relevant to the decision problem, the second step is to find the relative importance (weights) of the criteria, and the third step is to find the ranking index of the alternatives. Since multiple criteria are involved in the decision-making process, it is mandatory to find the relative importance of these criteria. The relative importance of criteria plays a vital role in evaluating the alternatives in decision-making problems. Also, weight calculation can improve the reliability and accuracy of decision-making. There are several weight calculation techniques used with MCDM methods for solving decision problems [5]. Mainly, weight calculation methods are divided into two types: Subjective method and Objective method.
Objective weight assignment methods calculate weights based on the information obtained from the available dataset and by applying relevant mathematical formulae. The criteria weights are assigned directly by analyzing the behavior of the dataset using the mathematical equations. The advantage of the objective weight assignment method is that it does not depend on experts’ opinions. The disadvantage of using an objective weight assignment method is that the obtained results may sometimes be inconsistent with the actual weights of criteria.
Subjective weight assignment methods calculate the weights based on the expertise knowledge obtained from the decision-makers, and it provides subjective importance to the criteria. The subjective weight assignment methods also rely on some mathematical formulae for the calculation of weights based on the opinion gathered from experts. The disadvantage of subjective weight assignment methods is that sometimes, the flexibility of these methods may lead to subjective randomness and give inaccurate results [6]. Several research works have been carried out so far by using these objective and subjective weight assignment methods [7,8,9,10,11,12,13,14].
A mathematical model was built for agriculture development using the subjective weight assessment method, namely the rank-sum method and objective weight assignment method, namely the grey correlation method [15]. A multivariate application was developed using GIS for land suitability analysis by applying the MCDM method, and weights were calculated using the ranks obtained from the experts [16]. A decision model was developed for the assessment of agriculture land suitability using a fuzzy approach and MCDM method in which a subject weight assignment method, namely the analytical hierarchy process (AHP), was applied [17]. A decision model was built in order to rank the concrete bridge repair projects using VlseKriterijumska Optimizcija I Kaompromisno Resenje (VIKOR) method by applying objective weight calculation method [18].
A mathematical model was built using subjective and objective weight calculation methods for ranking purposes [19]. Subjective weights were calculated using the step-wise weight assessment ratio analysis (SWARA) method to rank the assessment indicators of the energy system [20]. The advantage of these subjective weight assignment methods is that it gives importance to the subjectivity of the criteria. The disadvantage of these subjective weight assignment methods is the accuracy of the weights assigned to the criteria depends upon the experience of experts working in that area, and sometimes, it may lead to random values [21].
The dominance-based rough set approach was used for the calculation of objective weights of the criteria, which eliminates the decision from the experts [22]. A hybrid decision model was developed for agriculture crop selection by integrating soft set and MCDM methods. The objective weights of the criteria were calculated using the weight assignment method, namely Shannon’s entropy method [8]. An evaluation model was developed to rank the economics journals by applying objective weight assignment method, namely, grey correlation method and technique for order of preference by similarity to ideal solution (TOPSIS) method [23]. An extended SWARA method was proposed to improve the weighting process in decision-making problems [24]. An MCDM model was developed using a multi-objective genetic algorithm (MOGA) by calculating objective weights using Shannon’s entropy method in construction project scheduling [25]. A mathematical programming model was established to calculate the objective weights of criteria for implementing the technique for order of preference by similarity to ideal solution (TOPSIS) method [26]. The advantages of these objective weight assignment methods are they calculate weights based on the dataset associated with each criterion by applying the mathematical formula, and they do not depend on the opinion of the experts. The disadvantage of these objective weight assignment methods is that occasionally, the weights calculated are inconsistent with the actual weights when the dataset associated with the criteria contains random values.
There is no specific way of selecting a suitable weight calculation method to solve decision problems using MCDM methods. In order to improve the accuracy, researchers have applied more than one weight assignment methods for the evaluation of weights of criteria [27,28,29]. The basic idea behind combining the different weight calculation methods is to utilize the distinct features of these methods in solving decision problems by considering their advantages and disadvantages [30].
A combined weight calculation method was developed using subjective, objective weight assignment methods and applied to the TOPSIS method to select optimum fiber types [26]. A comprehensive weight calculation method was used by integrating the analytical network process (ANP) and entropy weights along with the decision-making trial and evaluation laboratory (DEMATEL) and game theory for the evidential supplier selection problem [27]. A hybrid weight calculation method was used by combining AHP weights and Shannon’s entropy weights along with the VIKOR method to rank the failure modes [28]. A new fuzzy evaluation based on distance from the average solution (EDAS) method was proposed using comprehensive weights obtained from SWARA and criteria importance through inter-criteria correlation (CRITIC) methods for the evaluation of construction equipment [29]. The CRITIC method was used to calculate the objective weights of the criteria by considering standard deviation and correlation among the criteria to solve interdependencies between the criteria [30]. A combined weight method was proposed using the grey correlation method for the optimization of a deep foundation pit scheme [31]. A combinative weight calculation method was developed for the optimization of composites [32].
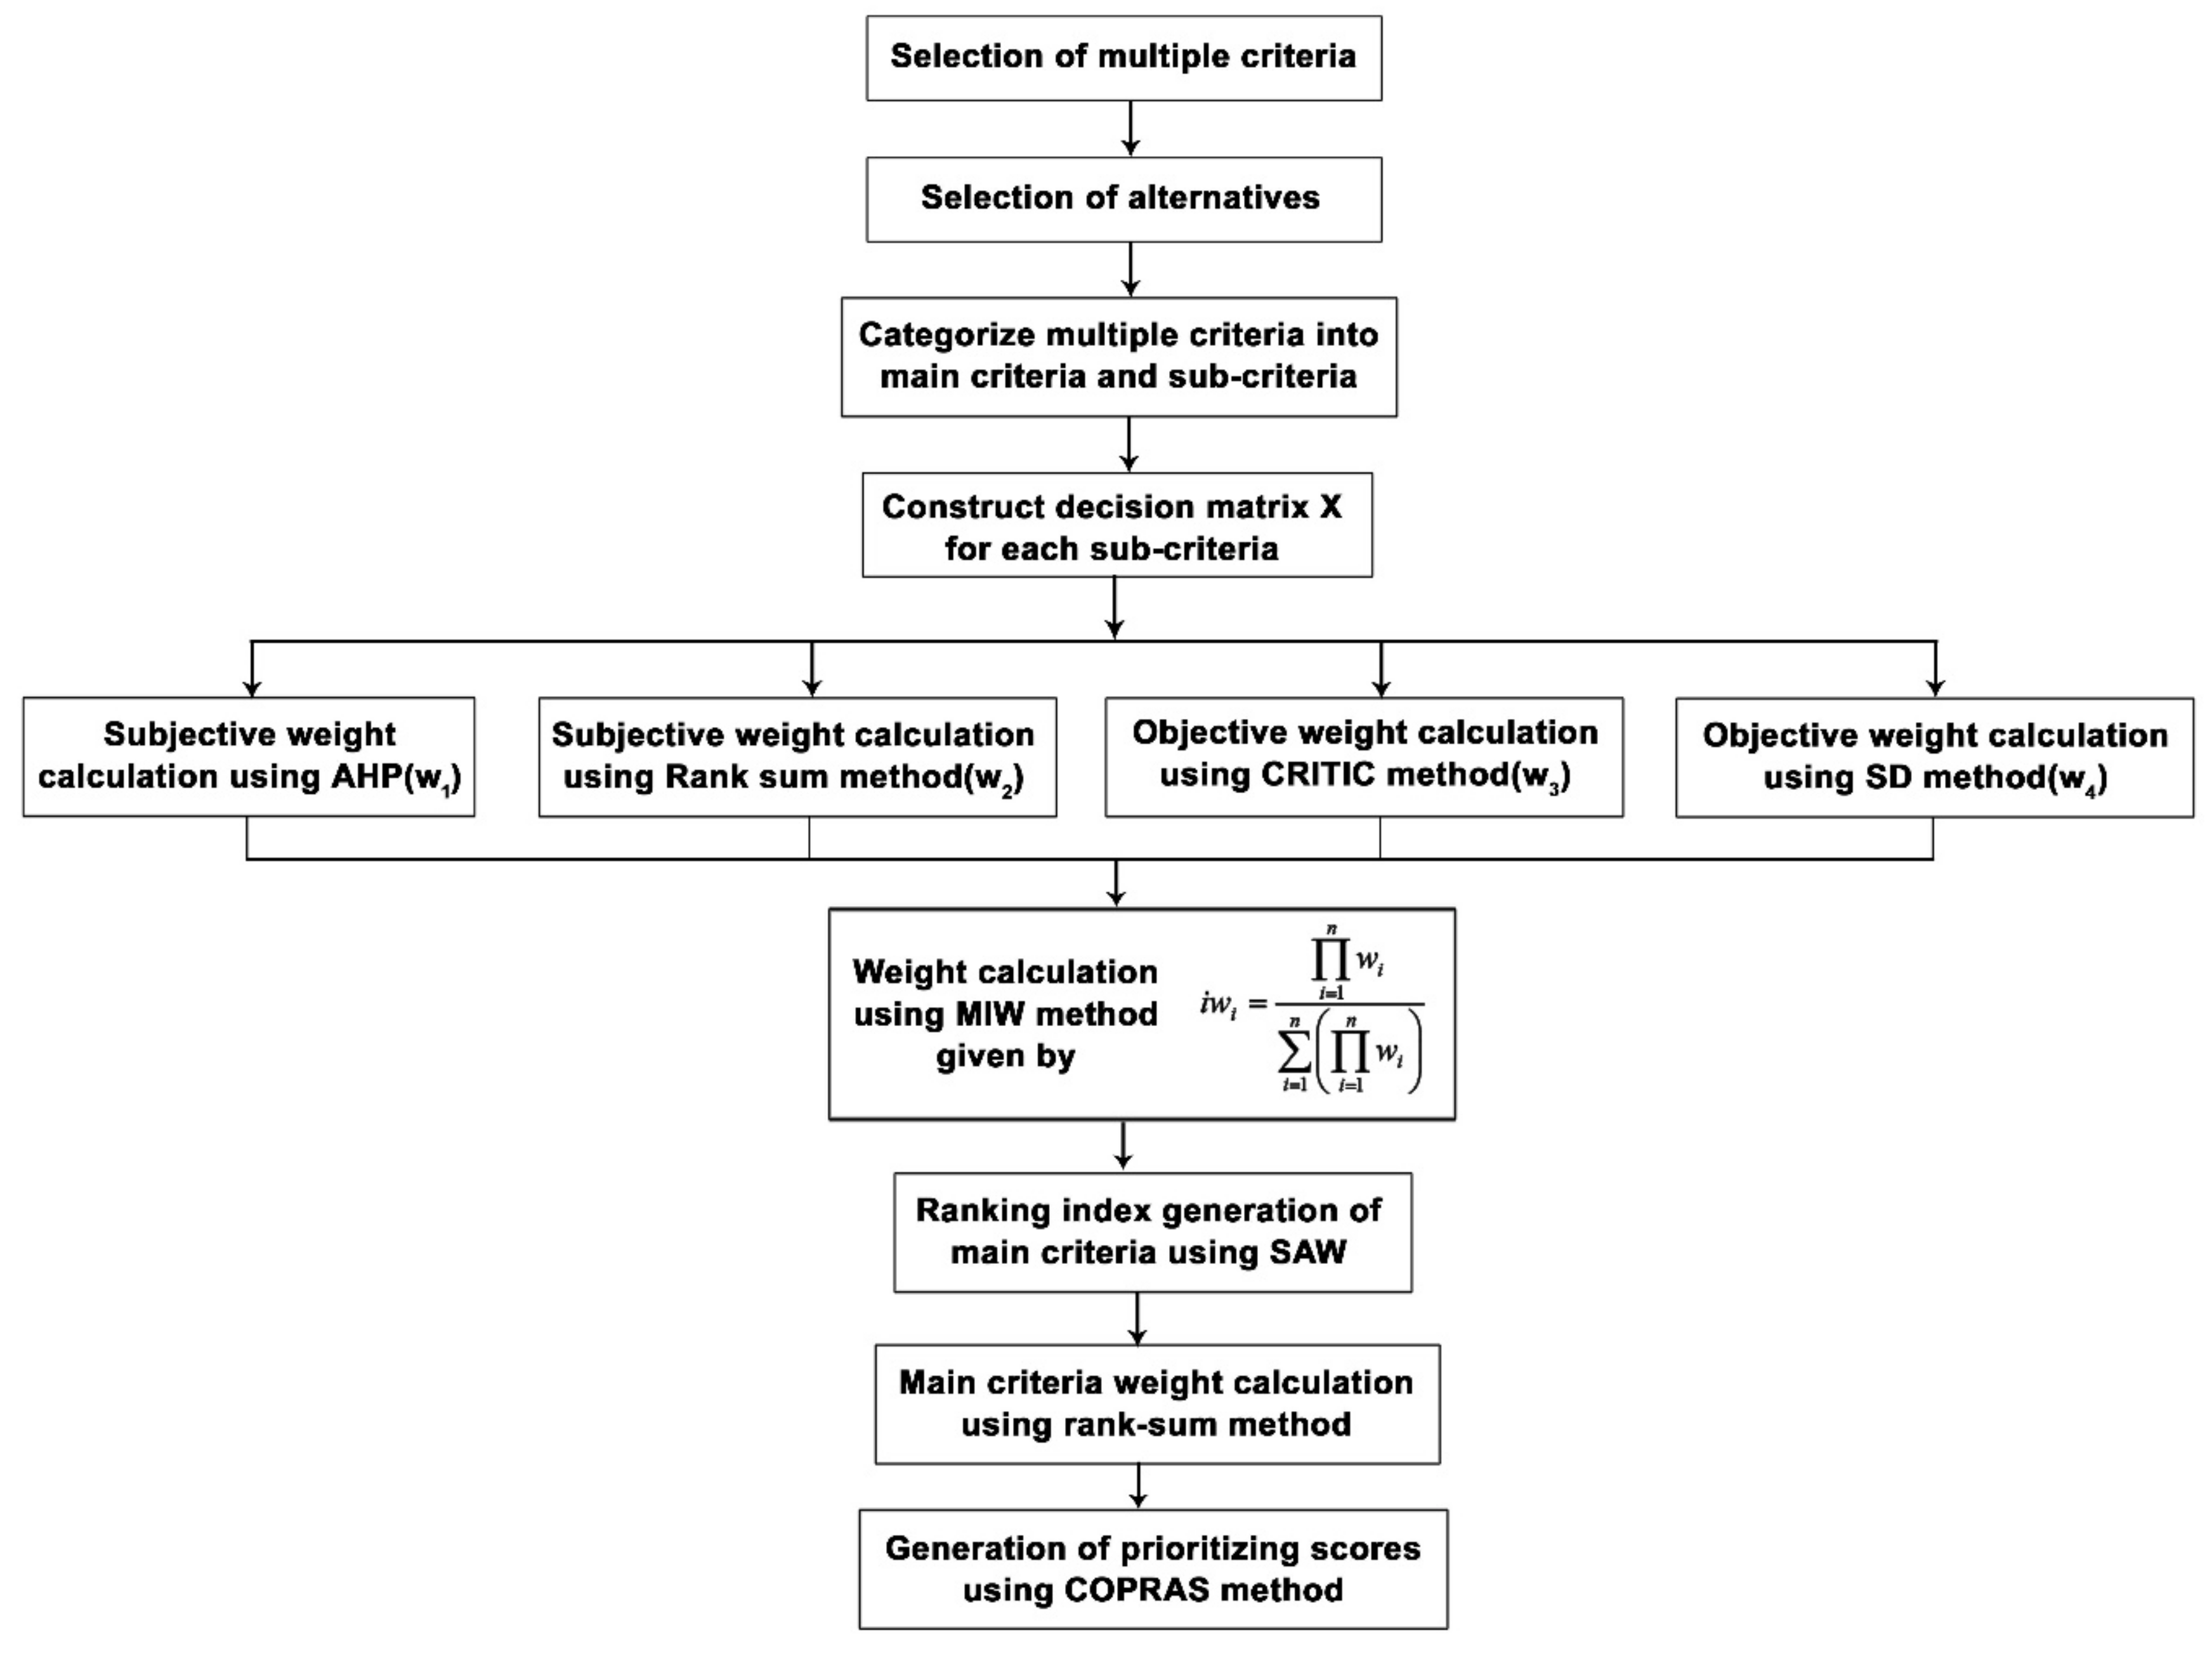
The advantages of these combined weight assignment methods are they assign weights by examining the opinion of the experts and also the objectivity of the decision problem. The disadvantages of these combined weight assignment methods are that there is no specific objective and subjective weight assignment problem used in MCDM methods. In this work, a framework was established to combine objective and subjective weight assignment methods to solve decision problems based on the purpose. In order to combine the benefits of various subjective and objective weight assignment methods in decision-making, a new modified integrated weighting (MIW) method was proposed in this work. The proposed method combined two subjective weight assignment methods, namely AHP and rank-sum method and two objective weight assignment methods, such as CRITIC and standard deviation (SD) methods. In order to apply the proposed MIW method, a decision model was developed using COPRAS and integrated weights obtained using the MIW method. COPRAS is one of the most popular MCDM methods used for the evaluation of the given alternatives.
The rest of the work is organized as follows: In the next section, the various methodologies used in this work, and the proposed weight calculation method have been explained. In Section 3, a new decision-making model and the case study are discussed, the results of various methodologies have been described in Section 4, and discussions related to the results of the proposed method and comparative analysis are explained in Section 5.

2. Techniques Tested for Coming Up with the Modified Integrated Weighting Method

2.1. Subjective Weight Assignment of Criteria Using Analytical Hierarchy Process

The analytical hierarchy process, developed by Saaty, American Operation Researcher, is a simple MCDM method used popularly for subjective weight assignment of criteria [33,34]. It includes natural and straightforward mathematical calculations for weight assignment. Since all the criteria will not have the same importance, it is necessary to find the relative priorities of each criterion. As the criteria priorities are measured concerning other criteria, it is mentioned as relative. The relative priorities of each criterion were obtained by constructing a pairwise comparison matrix. The pairwise comparison matrix was developed by assigning a numerical scale for specifying the relative priority of each criterion concerning other criteria. The numerical scale for criteria comparison was developed by Saaty, which is shown in Table 1.
The steps involved in subjective weight assignment using AHP are as follows:
  • Construct pairwise comparison matrix X by using the numerical scale in Table 1 and considering the experts’ judgments. The pairwise comparison matrix can be stated as follows:
    X = [ X i j ] = c 1 c 2 c n C 1 C 2 C n 1 x 12 x 1 n 1 x 12 1 x 2 n 1 x 1 n 1 x 2 n 1
    where c 1 , c 2 , , and c n represent criteria, and Xij denotes experts judgment defined using a numerical scale on a pair of criteria ci and cj.
  • Normalize the pairwise comparison matrix by adding the elements in the column and divide each cell value by its column total.
  • Find the overall priorities by calculating the average of values in each row.
  • The obtained overall priorities represent the relative importance (weights w1, w2, …, wn) of each criterion.
  • After obtaining the weights of criteria, it is mandatory to check the consistency of the weights. As the numerical values are obtained from the subjective opinion of the experts, inconsistencies cannot be avoided. Some level of inconsistency is allowed in AHP. Consistency ratio (CR) is calculated using the following formula:
    C R = C I R I
    where   C I = λ max n n 1
    and   λ max = j = 1 n X i j w j w i
    where CI is Consistency Index, and Random Consistency Index (RI) is the consistency index of some randomly generated pairwise comparison matrix defined by Saaty (shown in Table 2) to verify the consistency of the pairwise comparison matrix of the given problem. λ max is the largest eigenvalue, as defined by Saaty.
  • If the consistency ratio (CR) value thus obtained is less than 0.1, then the judgments obtained from experts for constructing the pairwise comparison matrix are accepted. Otherwise, a new pairwise comparison matrix is constructed until the CR value becomes less than 0.1.

2.2. Subjective Weight Assignment of Criteria Using the Rank-Sum Method

Rank order weight methods are simple subjective weight assignment methods used in MCDM problems [35]. In general, decision-makers are more comfortable in ranking the given criteria than assigning weights directly. The ranks need to be converted to numerical weights. Rank order weight methods are used to convert the ranks obtained from decision-makers to numerical weights. There are two steps involved in rank order weight methods: Ranking the given criteria based on their importance and find the weights of the ranks using any one of the rank order weight methods. Among the rank order weight methods, the rank-sum method is a popular subjective weight calculation method. The formula for converting ranks to numerical weights in rank-sum weight method is as follows:
w j = n r j + 1 / i n r i + 1
where w j is the subjective weight of the jth criteria, n is the number of criteria, and r j is the rank assigned by the decision-maker to the jth criteria.

2.3. Objective Weight Assignment of Criteria using Critic Method

In MCDM problems, it has been found that during a higher level of interdependency between the criteria, there is a possibility of additional errors in the ranking results of the decision problem [36]. Criteria importance through inter-criteria correlation (CRITIC) method was proposed as an objective weight assignment method, which deals with the interdependencies between the criteria [36]. It considers both the standard deviation of each criterion and the correlation between the attributes for the calculation of weights of criteria. The steps for determining the objective weights of the criteria using CRITIC are as follows:
  • Let Y be the decision matrix with ‘n’ alternatives and ‘m’ criteria. The primary step is the calculation of the correlation coefficient between ‘n’ criteria using the formula given as follows:
    C j k = i = 1 n ( Y i j Y j ¯ ) ( Y i k Y k ¯ ) i = 1 n ( Y i j Y j ¯ ) 2 . i = 1 n ( Y i k Y k ¯ ) 2
The amount of information each criterion transmits is calculated using the standard deviation of the ‘m’ criteria as follows:
R j = σ j . k = 1 m ( 1 C j k )
where σ j denotes the standard deviation of ‘m’ criteria.
  • The weights of criteria are calculated using the formula given as follows:
    w j = R j / k = 1 m R k where   j   = 1 ,   2 ,   . ,   m

2.4. Objective Weight Assignment of Criteria using the SD Method

The standard deviation (SD) method calculates the weights using the standard deviations of criteria by applying the formula given as follows:
w j = σ j / k = 1 m σ k ,   where   j = 1 , 2 ,   ,   m
where σ j denotes the standard deviation of ‘m’ criteria and ‘n’ alternatives from the decision matrix, identified for the decision problem.

2.5. Modified Integrated Weighting (MIW) Method

In this proposed method, two subjective weight assignment methods and two objective weight assignment methods were integrated to calculate the weights of the given criteria. When there are multiple sets of weights considered in the decision-making problem, it is mandatory to integrate the weights into one single set. Numerous researches have established the process of combining the weights (subjective and objective) of the criteria [9,30,31,32]. A modified integrated weighting method was proposed in this paper to combine the weights obtained using different weight assignment methods into a single set of weights. The MIW method is defined as follows:
i w i = i = 1 n w i i = 1 n i = 1 n w i
where iwi represents integrated weights of the criteria, wi denotes the weights of the criteria calculated using one of the weight calculation methods, and i = 1,2, …, n, where n is the number of methods used to calculate the weights of the criteria. By applying this method, different subjective and objective weight calculation methods can be used to calculate the weights, and the benefits of these methods may lead to building a reliable decision model.

2.6. Simple Additive Weighting (SAW) Method

A simple additive weighting method is a simple MCDM method used for calculating the evaluation scores of the alternatives in decision-making problems. The ranking index of alternatives concerning criteria are obtained using a simple additive weighting method and is given as follows:
R I = j i w j D i j
where iwi is the weights of criteria, and Dij is the decision matrix, where i = 1,2,3,…,m, and j = 1,2,3,…,n, where ‘m’ is the number of alternatives, and n is the number of criteria.

2.7. The COPRAS Method

The complex proportional assessment (COPRAS) method was proposed by [37], and it is a simple technique that takes less calculation time when compared with other MCDM methods [37]. The COPRAS method solves the decision problems by determining the ratio of the ideal solution and the worst ideal solution. Therefore, it is considered a compromising solution method. The critical steps of the COPRAS method are as follows [38]:
  • Construct decision matrix D with ‘m’ alternatives and ‘n’ criteria.
  • Normalize the decision matrix using the formula given as
    X i j = D i j i = 1 m D i j
  • Calculate the weighted normalized matrix using the weights obtained from the proposed modified integrated weighting method as follows:
    Z i j = i w j × X i j
    where i = 1,2, …, m, and j = 1,2, …, n.
  • Calculate the sums of maximizing criteria and minimizing criteria as follows:
    M + i = j = 1 n Z + i j
    M i = j = 1 n Z i j
    where Z+ij is maximizing the criteria with maximum values and is preferable for each alternative, and Z-ij is minimizing the criteria with minimum values and is preferable the least.
  • Determine the relative priority values using the formula given as follows:
    R i = M + i + i = 1 m M i M i i = 1 m 1 M i
  • Determine the utility degree of each alternative as follows:
    U i = R i R max
    where Rmax is the maximum relative priority value obtained from Equation (16).
Thus, utility degree provides a prioritizing score (ranking index), which is used to rank the given alternatives.

3. Decision-Making Model Using COPRAS and MIW Method

In order to apply the proposed MIW method, a decision model was developed using COPRAS and integrated weights obtained using the MIW method. The schematic diagram of the decision model using the COPRAS and MIW method is shown in Figure 1.

Case Study

In order to meet our agriculture-based food demands, sustainable agriculture is significant in today’s world. Also, agriculture contributes the maximum share to the national income of many developing countries. Farmers face many problems, such as unexpected natural disasters, soil infertility, lack of awareness related to modern farming techniques, etc.; several decision models have been developed so far to improve the development of sustainable agriculture [8,12,13,14,15,16,17]. Identification of relevant parameters and the site dataset concerning agriculture problems is essential for the decision problem. Evaluation of these agriculture parameters to find the relative importance of each criterion plays a vital role in sustainable agriculture development. In the developed model, an agriculture groundnut crop dataset was taken to identify the best groundnut site from the given agriculture dataset.
Through various works of literature and after consulting with the experts working in the agriculture field, seven main criteria were chosen, and each main criteria had its sub-criteria used to rank the groundnut crop dataset in agriculture development. Soil main criteria with 11 sub-criteria, water with two sub-criteria, season with no sub-criterion, input with six sub-criteria, support with two sub-criteria, facilities with three sub-criteria, and risk with two sub-criteria were the criteria chosen for groundnut crop selection, as shown in Figure 2.
After selecting the necessary criteria and sub-criteria, the alternatives for groundnut agriculture site datasets were identified and collected from various villages in Tiruvannamalai District in Tamil Nadu, India. This site was selected because the groundnut is one of the major crops cultivated in this area. Twenty groundnut site dataset was taken in this study to identify the best groundnut site in this work.
The decision matrix for each main criterion was constructed to calculate the weights of sub-criteria under each main criterion. Weight calculation plays a vital role in decision-making. The proposed MIW method was used in this work to calculate the weights of sub-criteria in each main criteria. In the MIW method, weights are calculated using two subjective and two objective weight assignment methods. The proposed MIW method considered both the subjective opinions of the experts and the objectivity of the problem in weight calculation. The two subjective weight assignment methods chosen in this work were the AHP and the rank-sum method. The two objective weight assignment methods selected were CRITIC and SD methods. After finding the weights using four weight assignment methods, weights of sub-criteria were calculated by applying the formula given in Equation (10).
In the experimental study, twenty-seven criteria selected for ranking the groundnut sites were classified into main criteria and sub-criteria. The sub-criteria sequences in the form of decision matrix needed to be converted to the main criteria sequence for further ranking purposes. The conversion could be done by calculating the ranking index of the main criteria using MCDM methods. In this work, the SAW method was used for ranking index generation of main criteria. The ranking index of the main criteria was generated by the SAW method using the formula given in Equation (17) by applying the weights of sub-criteria obtained from the proposed MIW method.
The obtained main criteria matrix thus formed the decision matrix for ranking the given groundnut agriculture site dataset. COPRAS is another popularly used MCDM method nowadays for ranking the given alternatives. The main criteria matrix was applied to the COPRAS method to generate prioritizing scores of alternatives. The scores were then employed to rank the given groundnut site dataset and to identify the best groundnut site.

4. Results

4.1. Results of Subjective Weight Assignments using AHP Method

The subjective weights of the sub-criteria were calculated using the AHP method. The first step in AHP was the construction of a pairwise comparison matrix. The values of the pairwise comparison matrix were collected from various experts working in the agriculture field. The relative priorities of each sub-criteria were obtained by constructing a pairwise comparison matrix. The pairwise comparison matrix constructed for the sub-criteria under each main criteria is presented in Table 3, Table 4, Table 5, Table 6, Table 7 and Table 8.
Then, the values of the pairwise comparison matrix have to be normalized by adding the elements in the column and divide each cell value by its column total. The overall priority values are calculated by finding the average of values in each row. The overall priorities define the relative importance (weights) of each sub-criteria. The subjective opinion of the experts may sometimes include inconsistencies in data. Some level of inconsistency is allowed in AHP. The consistency ratio of the weights obtained using AHP was calculated for each main criteria using the formula given in Equation (2). If the consistency ratio is lesser than 0.1, then the subjective opinion of the experts is considered to be accurate. Otherwise, the pairwise comparison matrix has to be constructed again with another set of values for weight calculation. The CR values obtained for each main criteria are shown in Table 9.
From Table 9, it has been identified that all the CR values were less than 0.1, and the subjective opinion of the experts could be considered for the calculation of weights of sub-criteria.

4.2. Results of Subjective Weight Assignments using Rank-Sum Method

Subjective weights of sub-criteria under each main criteria were obtained from the rank-sum method using the formula given in Equation (5). Agriculture experts were asked to rank the given criteria, and the ranks were converted to numerical weights using the rank-sum method.

4.3. Results of Objective Weight Assignments using CRITIC Method

The objective weight assignment of sub-criteria was calculated using the CRITIC method. CRITIC method is a popular objective weight calculation method, which solves the problem of interdependencies between the variables by considering the correlation between the variables while calculating the weights. Each sub-criteria matrix was applied to the CRITIC method. The correlation coefficient between the sub-criteria was calculated using the formula given in Equation (6). A sample correlation coefficient matrix constructed for sub-criteria under the soil-main criteria is shown in Table 10. The amount of information each attribute transmits was calculated by finding the standard deviation of criteria using the formula given in Equation (7). Finally, weights were obtained using the formula given in Equation (8).

4.4. Results of Objective Weight Assignments using the SD Method

The objective weights of sub-criteria in each main criteria were obtained using the SD method by applying the formula given in Equation (9).
Thus the subjective weights and objective weights of sub-criteria in each main criterion calculated using AHP, Rank-sum, CRITIC and SD methods are tabulated in Table 11, Table 12, Table 13, Table 14, Table 15 and Table 16.

4.5. Results of Proposed MIW Method

In the proposed modified integrated weight method, two subjective weight assignment methods, such as AHP, rank-sum method, and two objective weight assignment methods, such as CRITIC, SD method, were integrated to obtain a new set of weights of sub-criteria under each main criteria. The integration was done to apply the main features of the weight assignment methods to calculate the weights, which can improve the results of decision-making. The integrated weights of sub-criteria in each main criteria were obtained from the MIW method using the formula given in Equation (10). In this equation, i = 1 to 4, where w1 denotes subjective weight obtained using AHP, w2 denotes the subjective weight obtained using the rank-sum method, w3 represents the objective weight obtained using CRITIC method, and w4 denotes the objective weight obtained using SD method. The weights obtained using AHP, rank-sum, CRITIC, SD methods, and the integrated weights obtained for each sub-criteria under every main criterion using the MIW method are listed in Table 11, Table 12, Table 13, Table 14, Table 15 and Table 16.

4.6. Results of Ranking Index Generation using the SAW Method

The integrated weights of sub-criteria obtained using the MIW method and the main criteria decision matrix were applied to the SAW method for generating the ranking index of main criteria concerning the alternatives using the formula given in Equation (11). The resultant final main criteria matrix was used for identifying the best groundnut site for agriculture development. The ranking index of the main criteria for ranking groundnut sites is shown in Table 17.

4.7. Ranking Results of the Decision-Making Model

COPRAS is a compromising solution method that considers the ratio of the ideal solution and the worst ideal solution. The integrated weights obtained using the MIW method and the decision matrix obtained from the SAW method were applied to COPRAS for the generation of prioritizing scores of alternatives. Therefore, for determining the weights of the main criteria that were applied to CORPAS, the rank-sum method was used in this paper.
The first step was the normalization of the decision matrix obtained from the SAW method using the formula given in Equation (12). Also, the weighted normalized matrix was constructed using the main weights obtained from the rank-sum method using the formula given in Equation (5). Maximizing criteria and minimizing criteria were calculated for every alternative in the decision matrix using the formula given in Equation (14) and Equation (15), which is shown in Table 18. Relative priority values of each alternative were obtained using maximizing criteria and minimizing criteria by applying the formula given in Equation (16). Then finally, the utility degree, which represents the prioritizing scores of alternatives, was obtained by the relative priority values using the formula given in Equation (17). Thus the prioritizing scores of the alternatives shown in Table 18 served as ranking scores of the alternatives, and they were ranked according to the scores. Apart from results obtained from the decision model using COPRAS and MIW method, other ranking results were generated using different weight calculation methods identified in this work and the COPRAS method for validation purposes. Thus, ranking scores were obtained by applying AHP and COPRAS, rank-sum and COPRAS, CRITIC and COPRAS, SD, and COPRAS. Further ranks were generated from these ranking scores, as shown in Table 19.

5. Discussions

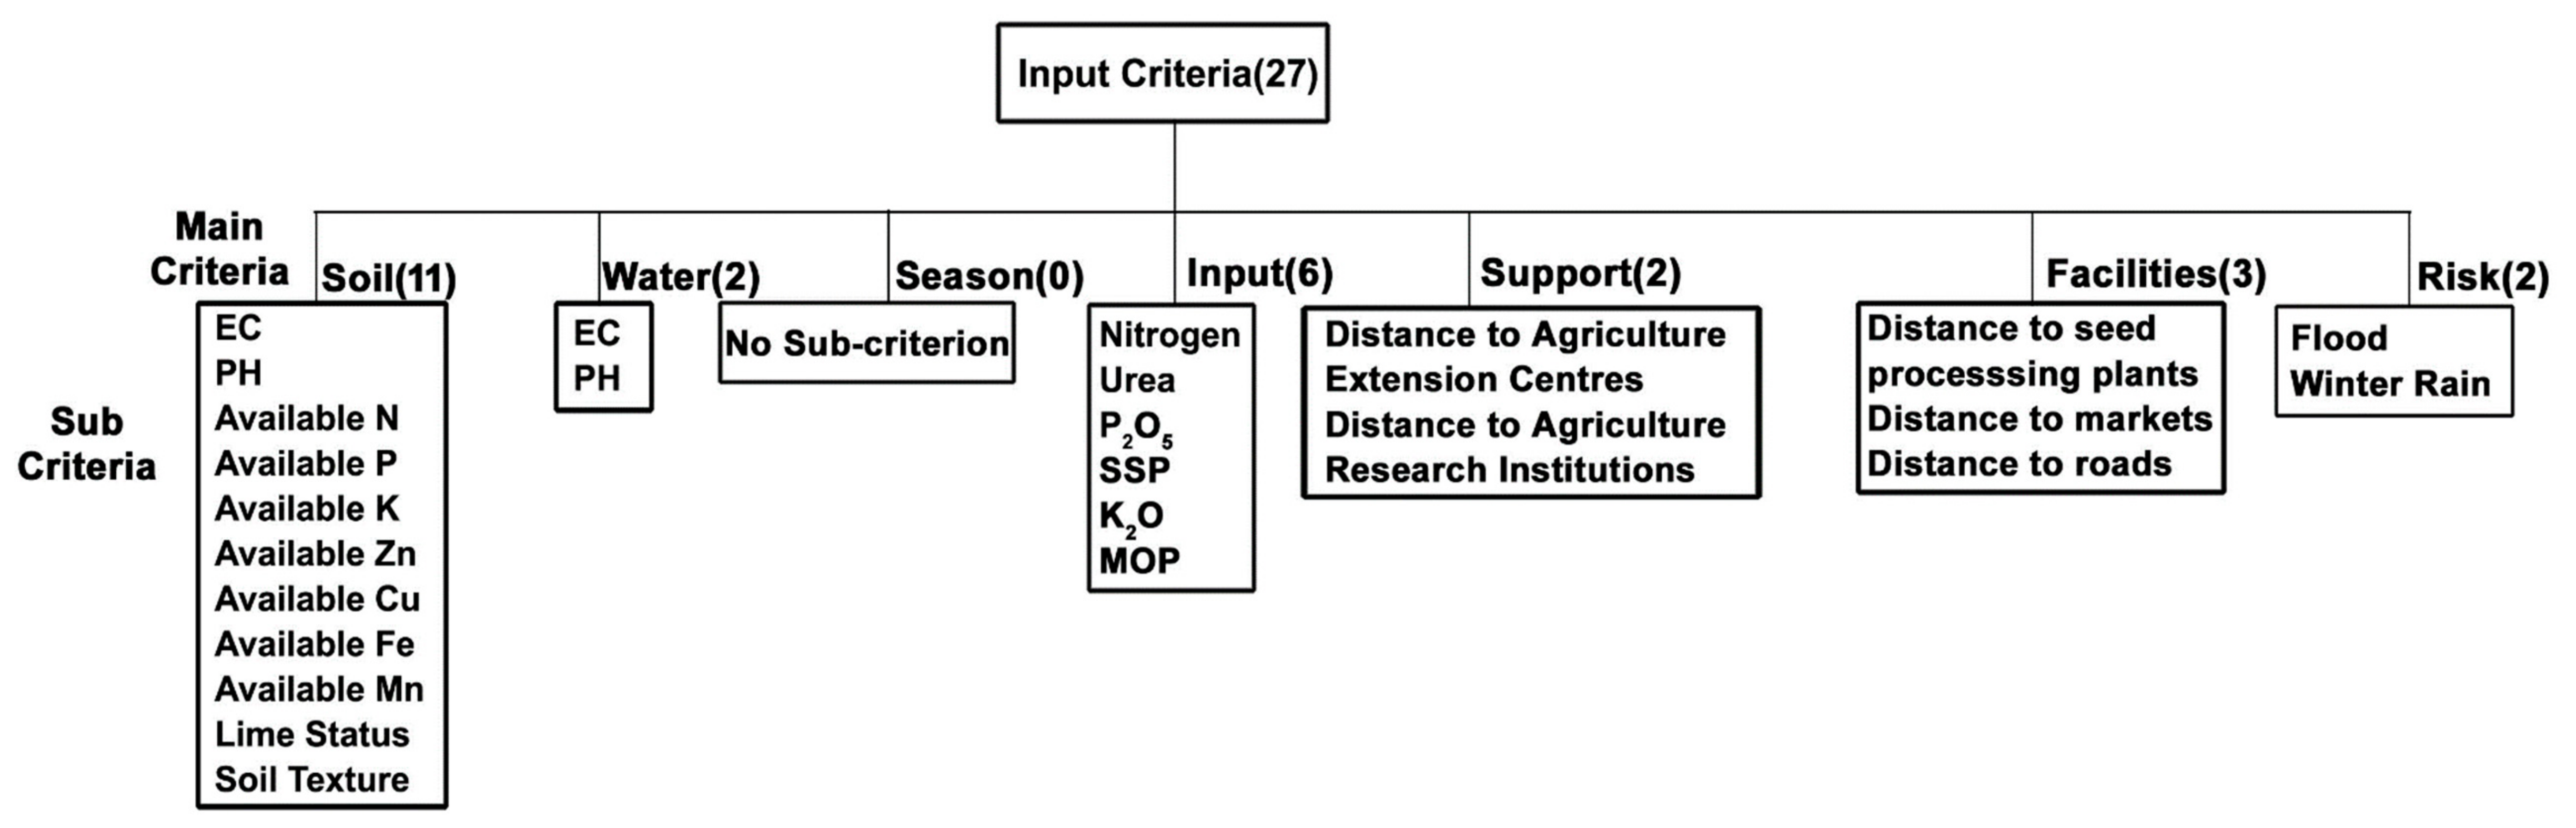
Sustainable agriculture development requires several parameters with different units of measurements for obtaining maximum profit [39]. In this work, twenty-seven parameters were considered for building a reliable decision model to rank the groundnut sites. The average groundnut crop yield data per hectare during the last five years were taken for the validation of ranking results obtained using the proposed decision model, as shown in Table 19. When compared to the ranking results of yield data, the decision model correctly ranked 17 groundnut sites out of 20, thus producing 85% of accuracy. The top 12 groundnut sites were appropriately ranked by the model and thus provided details about the best groundnut sites concerning yield data.
The ranking results of the decision model predicted the groundnut site a17 as 13. However, the ranking results obtained using yield for the site a17 was 14. Similarly, the ranking result obtained from the decision model for site a18 was 15, and the yield rank was 13. Also, site a19 was ranked as 14 by the decision model and 15 by the yield rank. Thus out of 20 sites, the decision model had ranked 17 sites accurately concerning the yield data taken per hectare during the last five years. There were minor variations between the ranking results obtained using the decision model and the average yield data for the three sites a17, a18, and a19. Thus, the ranking results of the decision model with the MIW method achieved superior performance for the experimental dataset. When compared with the ranking results of rice paddy crops obtained from the developed mathematical model, which had produced 80% accuracy, the present work had given 85% accuracy [19].
Further, the ranking results of the decision model were compared with the results obtained from the subjective (AHP and rank-sum) and objective (CRITIC and SD) weight calculation methods applied to the COPRAS MCDM method, as shown in Table 19. In Table 19, the ranking patterns obtained from AHP and COPRAS appropriately ranked nine agriculture sites, ranks obtained from rank-sum and COPRAS appropriately ranked ten sites, results obtained from CRITIC and COPRAS, as well as SD method and COPRAS, ranked 14 agriculture sites correctly. The AHP and rank-sum methods are subjective weight assignment techniques. The decision model developed using these subjective weight assignment methods produced inferior results compared to other models. Further, this may be because the opinions gathered from the experts are not consistent with the actual weights of the criteria [21]. The decision model developed using the objective weight assignment methods, such as CRITIC and SD, produced better results compared to the results of subjective weight assignment method.
Moreover, this is because the mathematical formula is applied to the dataset related to criteria, and the measurements are accurate [21]. However, when we compared these results with the ranking results of the decision model developed using the MIW method, the proposed method produced outstanding results. The reason behind this is that the integration of these methods have eliminated the disadvantages of the selected subjective weight assignment methods and utilized the distinct pros of the selected weight assignment methods [31].
From these results, it is validated that the decision model built using COPRAS and MIW showed excellent results compared to the other ranking results obtained.
Thus, the integrated weights of criteria calculated using more than one subjective and objective weight assignment method provided better results in solving MCDM problems. Even though the groundnut crop dataset was applied in this work to prove the efficiency of the model, the proposed MIW method could be used with any real-world dataset where multiple criteria are involved in decision-making problems. Besides, the proposed MIW method could be used in other MCDM methods for building a reliable decision-making model.

6. Conclusions

Weight calculation plays a vital role in building a reliable decision-making model for realizing sustainable development. Several research works have been carried out so far by combining weight calculation methods. In this paper, a new modified integrated weighting method was proposed to combine the weights obtained using different methods into a single set of weights. The method integrated two subjective weight assignment methods and two objective weight assignment methods. The proposed MIW method integrated the four weight assignment methods and calculated a single set of weights. The proposed method considered the subjective opinion of the experts obtained from two methods and also the objectivity of the problem. In order to apply the proposed MIW method, a decision-making model was proposed using the COPRAS method. A case study was done on agriculture groundnut crop datasets to prove the effectiveness of the developed model. The ranking results obtained from the model were compared with the ranking results of the average yield obtained during the last five years. Further, the ranking results of the decision model were compared with the ranking patterns obtained from different weight calculation methods applied to the COPRAS method, and the developed decision model with the MIW method illustrated superior results with an accuracy of 85%. Thus the developed MIW method could be used with any MCDM method for making accurate decisions.

Author Contributions

This research specifies below the individual contributions “Conceptualization, K.G. and C.-Y.C.; Methodology, N.D.; Software, K.S.; Validation, K.G., C.-Y.C., and K.S.; Formal analysis, N.D.; Investigation, K.S.; Resources, N.D.; Data curation, K.S.; Writing—original draft preparation, N.D.; Writing—review and editing, K.G., K.S.; Visualization, N.D.; Supervision, K.G.; Project administration, C.Y.C.; Funding acquisition, C.-Y.C.

Funding

This research was partially funded by the “Intelligent Recognition Industry Service Research Center” from The Featured Areas Research Center Program within the framework of the Higher Education Sprout Project by the Ministry of Education (MOE) in Taiwan. Grant number: N/A and the APC were funded by the project mentioned above.

Conflicts of Interest

The authors declare no conflict of interest.

References

  1. Keeney, R.L.; Raiffa, H. Decisions with Multiple Objectives: Preferences and Value Trade-Offs; Cambridge University Press: Cambridge, UK, 1993. [Google Scholar]
  2. Velasquez, M.; Hester, P.T. An analysis of multi-criteria decision making methods. Int. J. Oper. Res. 2013, 10, 56–66. [Google Scholar]
  3. Linkov, I.; Satterstrom, F.K.; Kiker, G.; Batchelor, C.; Bridges, T.; Ferguson, E. From comparative risk assessment to multi-criteria decision analysis and adaptive management: Recent developments and applications. Environ. Int. 2006, 32, 1072–1093. [Google Scholar] [CrossRef] [PubMed]
  4. Zardari, N.H.; Ahmed, K.; Shirazi, S.M.; Yusop, Z.B. Literature review. In Weighting Methods and Their Effects on Multi-Criteria Decision Making Model Outcomes in Water Resources Management; Springerbriefs in Water Science and Technology; Springer: Berlin, Germany, 2015. [Google Scholar]
  5. Aruldoss, M.; Lakshmi, T.M.; Venkatesan, V.P. A survey on multi criteria decision making methods and its applications. Am. J. Inf. Syst. 2013, 1, 31–43. [Google Scholar]
  6. Wu, H.Y.; Chen, J.K.; Chen, I.S.; Zhuo, H.H. Ranking universities based on performance evaluation by a hybrid MCDM model. Measurement 2012, 45, 856–880. [Google Scholar] [CrossRef]
  7. Roszkowska, E. Multi-criteria decision making models by applying the TOPSIS method to crisp and interval data. MultoCriteria Decis. Mak. Univ. Econ. Katow. 2011, 6, 200–230. [Google Scholar]
  8. Mustafa, A.A.; Singh, M.; Sahoo, R.N.; Ahmed, N.; Khanna, M.; Sarangi, A.; Mishra, A.K. Land suitability analysis for different crops: A multi criteria decision making approach using remote sensing and GIS. Researcher 2011, 3, 1–24. [Google Scholar]
  9. Ma, J.; Fan, Z.P.; Huang, L.H. A subjective and objective integrated approach to determine attribute weights. Eur. J. Oper. Res. 1999, 112, 397–404. [Google Scholar] [CrossRef]
  10. Mufazzal, S.; Muzakkir, S.M. A new multi-criterion decision making (MCDM) method based on proximity indexed value for minimizing rank reversals. Comput. Ind. Eng. 2018, 119, 427–438. [Google Scholar] [CrossRef]
  11. Li, Q.; Meng, X.X.; Liu, Y.B.; Pang, L.F. Risk assessment of floor water inrush using entropy weight and variation coefficient model. Geotech. Geolog. Eng. 2019, 37, 1493–1501. [Google Scholar] [CrossRef]
  12. Deepa, N.; Ganesan, K. Decision-making tool for crop selection for agriculture development. Neural Comput. Appl. 2019, 31, 1215–1225. [Google Scholar] [CrossRef]
  13. Deepa, N.; Ganesan, K. Multi-class classification using hybrid soft decision model for agriculture crop selection. Neural Comput. Appl. 2018, 30, 1025–1038. [Google Scholar] [CrossRef]
  14. Deepa, N.; Ganesan, K. Hybrid Rough Fuzzy Soft classifier based Multi-Class classification model for Agriculture crop selection. Soft Comput. 2019, 23, 10793–10809. [Google Scholar] [CrossRef]
  15. Talukder, B.; Hipel, K.W.; vanLoon, G.W. Using multi-criteria decision analysis for assessing sustainability of agricultural systems. Sustain. Dev. 2018, 26, 781–799. [Google Scholar] [CrossRef]
  16. Bojorquez-Tapia, L.A.; Diaz-Mondragon, S.; Ezcurra, E. GIS-based approach for participatory decision making and land suitability assessment. Int. J. Geographical Inf. Sci. 2001, 15, 129–151. [Google Scholar] [CrossRef]
  17. Prakash, T.N. Land Suitability Analysis for Agricultural Crops: A Fuzzy Multicriteria Decision Making Approach; ITC: Enchede, The Netherlands, 2003. [Google Scholar]
  18. Gao, Z.; Liang, R.Y.; Xuan, T. VIKOR method for ranking concrete bridge repair projects with target-based criteria. Results in Engineering 2019, 3, 100018. [Google Scholar] [CrossRef]
  19. Deepa, N.; Ganesan, K.; Sethuramasamyraja, B. Predictive Mathematical Model for Solving Multi-Criteria Decision-Making Problems. Neural Comput. Appl. 2019, 31, 6733–6746. [Google Scholar] [CrossRef]
  20. Zolfani, S.H.; Saparauskas, J. New application of SWARA method in prioritizing sustainability assessment indicators of energy system. Eng. Econ. 2013, 24, 408–414. [Google Scholar] [CrossRef]
  21. Hongjiu, L.; Yanrong, H. An evaluating method with combined assigning-weight based on maximizing variance. Sci. Program. 2015, 2015, 3. [Google Scholar] [CrossRef]
  22. Rong, Z.; Sifeng, L.; Bin, L. A method for weight assignment by Dominance-based Rough Sets Approach. In Proceedings of the 2009 Chinese Control and Decision Conference, Guilin, China, 17–19 June 2009; pp. 6060–6065. [Google Scholar]
  23. Huang, M.J.; Zhang, Y.B.; Luo, J.H.; Nie, H. Evaluation of Economics Journals Based on Reduction Algorithm of Rough Set and Grey Correlation. J. Manag. Sustain. 2015, 5, 140. [Google Scholar] [CrossRef]
  24. Zolfani, S.H.; Yazdani, M.; Zavadskas, E.K. An extended stepwise weight assessment ratio analysis (SWARA) method for improving criteria prioritization process. Soft Comput. 2018, 1–7. [Google Scholar] [CrossRef]
  25. Monghasemi, S.; Nikoo, M.R.; Fasaee, M.A.K.; Adamowski, J. A novel multi criteria decision making model for optimizing time–cost–quality trade-off problems in construction projects. Expert Syst. Appl. 2015, 42, 3089–3104. [Google Scholar] [CrossRef]
  26. Shen, H.; Hu, L.; Lai, K.K. A Mathematical Programming Model to Determine Objective Weights for the Interval Extension of TOPSIS. Math. Probl. Eng. 2018, 2018, 1–6. [Google Scholar] [CrossRef] [Green Version]
  27. Liu, T.; Deng, Y.; Chan, F. Evidential supplier selection based on DEMATEL and game theory. Int. J. Fuzzy Syst. 2018, 20, 1321–1333. [Google Scholar] [CrossRef]
  28. Mohsen, O.; Fereshteh, N. An extended VIKOR method based on entropy measure for the failure modes risk assessment—A case study of the geothermal power plant (GPP). Saf. Sci. 2017, 92, 160–172. [Google Scholar] [CrossRef]
  29. Ghorabaee, M.K.; Amiri, M.; Zavadskas, E.K.; Antucheviciene, J. A new hybrid fuzzy MCDM approach for evaluation of construction equipment with sustainability considerations. Arch. Civil Mech. Eng. 2018, 18, 32–49. [Google Scholar] [CrossRef]
  30. Wang, Y.-M.; Luo, Y. Integration of correlations with standard deviations for determining attribute weights in multiple attribute decision making. Math. Comput. Model. 2010, 51, 1–12. [Google Scholar] [CrossRef]
  31. Xuan, L.; Jinwei, L.; Mengxin, X.; Guowei, H.; Changming, L. Application of Combination Weighting Grey Correlation Model in the Optimization for Deep Foundation Pit Supporting Scheme. Electron. J. Geotech. Eng. 2015, 20, 6915–6926. [Google Scholar]
  32. Alemi-Ardakani, M.; Milani, A.S.; Yannacopoulos, S.; Shokouhi, G. On the effect of subjective, objective, and combinative weighting in multiple criteria decision making: A case study on impact optimization of composites. Expert Syst. Appl. 2016, 46, 426–438. [Google Scholar] [CrossRef]
  33. Saaty, T.L. The Analytic Hierarchy Process; McGraw-Hill: New York, NY, USA, 1980. [Google Scholar]
  34. Saaty, T.L. Decision making with the analytic hierarchy process. Int. J. Serv. Sci. 2008, 1, 83–98. [Google Scholar] [CrossRef]
  35. Roszkowska, E. Rank ordering criteria weighting methods—A comparative overview. Optimum Studia Ekonomiczne Nr 2013, 5, 14–33. [Google Scholar] [CrossRef]
  36. Diakoulaki, D.; Mavrotas, G.; Papayannakis, L. Determining objective weights in multiple criteria problems: The CRITIC method. Comput. Oper. Res. 1995, 22, 763–770. [Google Scholar] [CrossRef]
  37. Zavadskas, E.K.; Kaklauskas, A.; Sarka, V. The new method of multicriteria complex proportional assessment of projects. Technol. Econ. Dev. Econ. 1994, 1, 131–139. [Google Scholar]
  38. Mousavi-Nasab, S.H.; Sotoudeh-Anvari, A. A comprehensive MCDM-based approach using TOPSIS, COPRAS and DEA as an auxiliary tool for material selection problems. Mater. Des. 2017, 121, 237–253. [Google Scholar] [CrossRef]
  39. Talukder, B.; Hipel, K.W.; vanLoon, G.W. Developing composite indicators for agricultural sustainability assessment: Effect of normalization and aggregation techniques. Resources 2017, 6, 66. [Google Scholar] [CrossRef]
Figure 1. Schematic diagram of the decision model using complex proportional assessment (COPRAS) and Modified integrated weighting (MIW); Analytical hierarchy process (AHP); CRITIC, criteria importance through inter-criteria correlation (CRITIC); SAW (simple additive weighting).
Sustainability 11 06060 g001
Figure 2. Main criteria and sub-criteria selected for ranking groundnut sites. Electrical Conductivity (EC), Nitrogen (N), Phosphorus (P), Potassium (K), Zinc (Zn), Copper (Cu), Iron (Fe), Manganese (Mn), Phosphorus pentoxide (P2O5), Single Super Phosphate (SSP), Potassium Oxide (K2O), Muriate of Potash (MOP).
Sustainability 11 06060 g002
Table 1. Analytical Hierarchy Process (AHP) Saaty’s numerical scale and description for pairwise comparison matrix.
Numerical ScaleDescription
9Extremely more important
7Strongly more important
5More important
3Moderately important
1Equally important
2, 4, 6, 8Intermediate scales
Table 2. Consistency indices of randomly generated pairwise comparison matrix; Random Consistency Index (RI).
N34567891011
RI0.52450.88151.10861.24791.34171.40561.44991.48541.5141
Table 3. Pairwise comparison matrix constructed for soil—main criteria; Electrical Conductivity(EC)
SoilECPHNPKZnCuFeMnLime StatusTexture
EC11777777744
PH11777777744
N1/71/712222221/21/2
P1/71/71/21222221/21/2
K1/71/71/21/2122221/21/2
Zn1/71/71/21/21/212221/21/2
Cu1/71/71/21/21/21/21221/21/2
Fe1/71/71/21/21/21/21/2121/21/2
Mn1/71/71/21/21/21/21/21/211/21/2
Lime status1/41/4222222211
Texture1/41/4222222211
Table 4. Pairwise comparison matrix constructed for water—main criteria.
WaterECPH
EC11/2
PH21
Table 5. Pairwise comparison matrix constructed for input main criteria. Single Super Phosphate (SSP), Muriate of Potash (MOP).
InputNitrogenUreaP2O5SSPK2OMOP
Nitrogen129999
Urea1/219999
P2O51/91/91222
SSP1/91/9½122
K2O1/91/9½1/211
MOP1/91/9½1/211
Table 6. Pairwise comparison matrix constructed for support—main criteria.
SupportDistance to Agriculture Extension CentersDistance to Agriculture Research Centers
Distance to Agriculture Extension Centers13
Distance to Agriculture Research Centers1/31
Table 7. Pairwise comparison matrix constructed for facilities—main criteria.
FacilitiesDistance to Seed Processing PlantsDistance to MarketsDistance to Roads
Distance to Seed Processing Plants11/41/3
Distance to Markets411/2
Distance to Roads321
Table 8. Pairwise comparison matrix constructed for risk—main criteria.
RiskFloodWinter Rain
Flood11/3
Winter Rain31
Table 9. Consistency ratio values calculated for each main criterion.
CriteriaSoilWaterInputSupportFacilitiesRisk
CR0.086000.076400.00790
Table 10. Correlation coefficient matrix constructed for soil-main criteria.
SoilECpHNPKZnCuFeMnLime StatusSoil Texture
EC1.00000.23460.01160.10340.24970.08990.08630.10520.30470.05260.1683
pH0.23461.00000.77730.28420.38300.16100.66740.66900.04910.25570.1104
N0.01160.77731.00000.28810.60330.10660.78730.69150.02510.27500.2055
P0.10340.28420.28811.00000.41490.08810.12920.01180.28310.04430.2769
K0.24970.38300.60330.41491.00000.02730.22830.35670.55780.02960.0520
Zn0.08990.16100.10660.08810.02731.00000.03950.42860.10440.16620.0770
Cu0.08630.66740.78730.12920.22830.03951.00000.67650.01330.42670.0664
Fe0.10520.66900.69150.01180.35670.42860.67651.00000.04020.57780.1574
Mn0.30470.04910.02510.28310.55780.10440.01330.04021.00000.00600.2563
Lime Status0.05260.25570.27500.04430.02960.16620.42670.57780.00601.00000.1683
Soil Texture0.16830.11040.20550.27690.05200.07700.06640.15740.25630.16831.0000
Table 11. Subjective, objective, and MIW weights of sub-criteria for soil; Analytical Hierarchy Process (AHP), Criteria importance through inter-criteria correlation (CRITIC), Standard Deviation (SD), Modified Integrated Weighting (MIW).
SoilAHPRank-sumCRITICSDMIW
EC0.27610.16670.10340.06850.4692
PH0.27610.15150.07710.01500.0696
N0.05870.13640.07500.13150.1137
P0.05270.12120.09720.08850.0791
K0.04720.10610.08540.11090.0683
Zn0.04190.09090.10480.16770.0963
Cu0.03700.07580.08280.06000.0201
Fe0.03230.06060.07560.10300.0219
Mn0.02780.04550.10060.07420.0136
Lime Status0.07510.01520.09620.06850.0108
Soil Texture0.07510.03030.10180.11220.0374
Table 12. Subjective, objective, and MIW weights of sub-criteria for water.
WaterECPH
AHP0.66670.3333
Rank-sum0.66670.3333
CRITIC0.03640.9636
SD0.25770.7423
MIW0.04980.9502
Table 13. Subjective, objective, and MIW weights of sub-criteria for input.
InputNUreaP2O5SSPK2OMOP
AHP0.44880.35760.06600.05430.03660.0366
Rank-sum0.28570.23820.19050.09520.14290.0476
CRITIC0.08310.17770.05310.33620.13130.2186
SD0.23370.23190.07250.07330.19440.1942
MIW0.39010.54990.00760.02000.02090.0116
Table 14. Subjective, objective, and MIW weights of sub-criteria for support.
SupportDistance to Agriculture Extension CentersDistance to Agriculture Research Stations
AHP0.75000.2500
Rank-sum0.66670.3333
CRITIC0.62300.3770
SD0.91630.0837
MIW0.99090.0091
Table 15. Subjective, objective, and MIW weights of sub-criteria for facilities.
FacilitiesDistance to Seed Processing PlantsDistance to MarketsDistance to Roads
AHP0.12630.45770.4160
Rank-sum0.16670.50000.3333
CRITIC0.20770.29700.4953
SD0.32850.32210.3494
MIW0.03040.46260.5070
Table 16. Subjective, objective, and MIW weights of sub-criteria for risk.
ThreatsFloodWinter Rain
AHP0.25000.7500
Rank-sum0.33330.6667
CRITIC0.00430.9957
SD0.83780.1622
MIW 0.00370.9963
Table 17. Ranking index of main criteria obtained using the SAW method.
SitesSoilWaterInputSupportFacilitiesThreats
a10.21620.23950.15460.19120.18680.1810
a20.21840.23510.15580.20230.19940.1828
a30.19660.23520.26130.22460.22450.1828
a40.24670.23080.15700.24690.24960.2262
a50.23980.22650.16050.19120.18680.1810
a60.20900.23510.15610.20230.19940.2714
a70.22170.23520.15490.22460.22450.2262
a80.30380.23950.19970.24690.24960.2733
a90.21080.23510.21960.23580.23700.1810
a100.20520.23950.15490.25800.26210.1810
a110.21490.23510.15480.19120.18680.1810
a120.18020.23520.20450.20230.19940.2714
a130.18950.23080.20330.22460.22450.2733
a140.20960.22650.15760.24690.24960.2714
a150.19900.23950.29810.23580.23700.2262
a160.20970.23510.29790.25800.26210.2714
a170.18810.23520.29790.19120.18680.2262
a180.21150.23950.29790.20230.19940.1810
a190.20480.03000.29790.22460.22450.1810
a200.20740.02990.29790.24690.24960.2262
Table 18. Maximizing, minimizing, and prioritizing scores obtained using COPRAS.
SitesMaximizing CriteriaMinimizing CriteriaPrioritizing Scores
a10.12050.04810.9958
a20.12110.04890.9799
a30.12910.05220.9170
a40.13340.05650.8481
a50.12620.05230.9156
a60.12420.0510.9391
a70.12560.05170.9264
a80.16050.07030.6811
a90.12820.05220.9168
a100.11960.0480.9984
a110.11940.04791.0000
a120.12190.04920.9732
a130.12470.05130.9338
a140.12480.05230.9158
a150.13850.05690.8417
a160.14480.0610.7845
a170.1330.0540.8869
a180.1380.05620.8515
a190.10360.05570.8598
a200.10820.05850.8181
Table 19. Ranking results of decision model compared with yield ranking and other weight calculation methods.
SitesAverage Yield for Five Years Yield RanksRanks Obtained from Decision Model Using COPRAS and MIWRanks Obtained from AHP and COPRAS Ranks Obtained from Rank-sum and COPRASRanks Obtained from CRITIC and COPRASRanks Obtained from SD and COPRAS
a18.9331434
a28.54441416
a36.4997999
a4416161616163
a55.5121212121212
a67.86618686
a778891868
a82.8202020102020
a96101010201010
a109.2223322
a119.7112551
a128.2555215
a137.47787711
a145.7111111131717
a153.817171717117
a163.2191919191919
a174.8141314141414
a185.2131513111313
a194.4151415151515
a203.41818681818

