Article

Greenhouse Gas Emissions and Blue Water Use of Dutch Diets and Its Association with Health

Centre for Nutrition, Prevention and Health Services, National Institute for Public Health and the Environment (RIVM), Antonie van Leeuwenhoeklaan 9, Bilthoven 3721 MA, The Netherlands
*
Author to whom correspondence should be addressed.
Sustainability 2019, 11(21), 6027; https://doi.org/10.3390/su11216027
Submission received: 2 October 2019 / Revised: 25 October 2019 / Accepted: 27 October 2019 / Published: 30 October 2019
(This article belongs to the Special Issue Healthy Sustainable Diets)

Abstract

:
Food consumption patterns affect the environment as well as public health, and monitoring is needed. The aim of this study was to evaluate the Dutch food consumption patterns for environmental (greenhouse gas (GHG) emissions and blue water use) and health aspects (Dutch Healthy Diet index 2015), according to age, gender, and consumption moments. Food consumption data for 4313 Dutch participants aged 1 to 79 years were assessed in 2012 to 2016, by two non-consecutive 24-h recalls. The environmental impact of foods was quantified using a life cycle assessment for, e.g., indicators of GHG emissions and blue water use. The healthiness of diet, operationalized by the Dutch Healthy Diet index 2015, was assessed for 2078 adults aged ≥19 years. The average daily diet in the Netherlands was associated with 5.0 ± 2.0 kg CO2-equivalents of GHG emissions and 0.14 ± 0.08 m3 of blue water use. Meat, dairy and non-alcoholic beverages contributed most to GHG emissions, and non-alcoholic beverages, fruits, and meat to blue water use. More healthy diets were associated with a lower GHG emission and higher blue water use. Different associations of environmental indicators (GHG emissions and blue water use) with health aspects of diets need to be considered when aligning diets for health and sustainability.

1. Introduction

The effect of diet on health and the environment has led to growing concerns [1,2] and should be addressed globally as well as on national and regional levels [3,4]. The link between diet and human health is well established while the link between diet and a sustainable food system is less known but of major importance [1]. A growing body of evidence shows the impact current western dietary patterns and global food production systems have on our environment [5].
The production and consumption of foods is responsible for 30% of total greenhouse gas (GHG) emissions [6]. Moreover, it is a major determinant of biodiversity loss, land use [7], and freshwater use [8]. Blue (surface water and ground water) and green (soil moisture) water resources are considered scarce due to human activities [9,10]. Agriculture consumes the largest amount of water and is responsible for 70% of global freshwater withdrawal [10]. Changes in our food system need to be made, aiming to reduce the impact on planetary boundaries (climate change, biodiversity loss) while optimizing nutritional quality of diets (taking into account the population growth and “expansion” of nutritional-related chronic diseases) [1,11].
Numerous studies have been conducted in recent years to assess the environmental impact of diets [12,13]. Earlier research has highlighted the positive associations between animal-based foods (meat and dairy), beverages and GHG emissions [5,12,14,15,16]. Moreover, positive associations between energy intake and GHG emissions were identified [17]. In contrast, lower emissions were found for plant-based food such as vegetables, legumes, and fruits [18,19]. Those studies most often operationalized environmental impact of diets via climate change, however associations between diet and other indicators, e.g., blue water use, are less known.
Next to associations between environmental impact and diet, the health aspects of diets need to be considered as well. Methods to quantitatively assess dietary quality or adherence to (county specific) dietary guidelines are widely used. The knowledge, however, of how those can be applied within a sustainable food system is still limited. Previous studies have investigated the environmental impact of healthy and sustainable diets, however most were often assessed by GHG emissions [12]. Associations between blue water use of diets and health are not yet assessed in detail. A systematic review and meta-analysis of Harris et al., (2019) shows that shifting towards a healthier diet, and by reducing animal-based foods, the water footprint decreases, however evidence is not clear for the blue water footprint [20]. In healthy patterns, fruits, nuts, and vegetables contributed most to water use [20].
Food consumption patterns and consumption moments differ according to gender, age, and other factors such as lifestyle factors and socio-economic factors [21]. Insights about different environmental impact indicators of food consumption by e.g., gender, age, and consumption moments are needed and can help to develop useful interventions, food policy, and dietary guidelines towards a more sustainable and healthy food consumption pattern.
Therefore, the aim of this study was to evaluate the Dutch food consumption patterns for greenhouse gas emission and blue water use according to age and gender, food groups, and consumption moments, and the association with healthiness of diets according to the Dutch Healthy Diet index 2015.

2. Materials and Methods

2.1. Study Population

Data for this present analysis were obtained from the Dutch National Food Consumption Survey (DNFCS) 2012–2016 [21]. The survey aimed to gain insight into diets of children and adults living in the Netherlands. Dutch children and adults aged 1–79 years were drawn from a representative consumer panel. The response rate was 65%. Pregnant and lactating women and people who were institutionalized or those without adequate command of the Dutch language were excluded. For the current cross-sectional study, the target population for analysis comprised 4313 Dutch children and adults aged 1–79 years of which 1192 boys and girls aged 1–8 years, 1043 boys and girls aged 9–18 years, 1043 men and 1035 women, both aged 19–79 years. A full explanation and description of this survey is described elsewhere [21].

2.2. General Questionnaire

Participants were asked to fill in an age dependent general questionnaire, which covered questions about various background factors, such as educational level, working status and family composition, and various lifestyle factors such as patterns of physical activity, smoking, and use of alcoholic beverages. The educational level concerned the highest completed educational level of the participants or, in case of participants under the age of 19 years, of the head of household. Educational level was categorized as low (primary education, lower vocational education, advanced elementary education), moderate (intermediate vocational education, higher secondary education) and high (higher vocational education and university). Information on region and degree of urbanization was provided by the market research agency. Region was categorized as North, East, South, and West. The degree of urbanization was divided into high urbanized (1500 or more addresses/km2), moderately urbanized (1000–1500 addresses/km2) and hardly or not urbanized (fewer than 1000 addresses/km2).
Information on body composition was gathered in different ways depending on age. Height was not measured for adults aged 71–79 y due to practical reasons. Body Mass Index (BMI) was calculated as the average body weight (in kg) divided by average height (in m) squared (kg/m2). Categories for BMI were underweight (<20), normal weight (20–25), overweight (>25–30), and obese (>30).

2.3. Description of Study Population

Reported population descriptives were weighted for demographic properties, season, and combination of both consumption days (week or weekend). Among 2235 Dutch children aged 1–18 years, fifty percent were boys (Supplementary Table S1). Mean age was 5 ± 1 years (mean ± SD) and 13 ± 2 years (mean ± SD) for children aged 1–8 years and 9–18 years, respectively. Most children aged 1–8 years (82%) and 9–18 years (72%) had a normal weight. Both caregivers were higher educated for 61% and 45% of 1–8 and 9–18 year-old children. Almost half of the children lived in the Western part of the Netherlands and most of them lived in extremely or strongly urbanized areas.
Of the 2078 adults aged 19–79 years, 50% was male (Supplementary Table S1). Mean age was 48 ± 21 years (mean ± SD) for men and 48 ± 21 years (mean ± SD) for women. Respectively, 34% and 33% of the men and women (19–70 years; because for adults >70 years, height was not measured so BMI could not be calculated) had a normal weight and 40% of the adults (19–70 years) were overweight or obese. About 20% of the adults smoked. The percentage of higher education was higher in men (38%) than in women (28%). More than 40% of the adults lived in the western part of the Netherlands and almost half of the adults lived in strongly urbanized areas.

2.4. Dietary Assessment

Participants were interviewed by telephone or face-to-face by a trained dietitian to assess dietary intake based on two non-consecutive 24-h dietary recalls. The period between the two 24-h dietary recalls was about four weeks. Interview dieticians used the GloboDiet system, which is computer-controlled interview software that enables answers to be directly entered in a computer [22].
Food consumption data were linked to food composition data derived from the Dutch Food Composition Database in order to calculate energy and nutrients (NEVO-online version 2016/5.0) [23]. Originally, food consumption data were categorized according to 23 GloboDiet food groups [22] and were adapted into 16 main groups for analysis or were stratified (e.g., cheese was excluded from dairy because its important role in determining environmental impact) (Supplementary Table S2). Aggregated food groups were used to determine important groups during the consumption moments of breakfast, lunch, dinner, and in between meals (Supplementary Table S2).

2.5. Environmental Impact Assessment

To calculate the environmental impact throughout the life cycle of foods and beverages, the life cycle assessment (LCA) approach was applied. The LCAs had an attributional approach and hierarchical perspective and were performed following the ISO 14040 and 14044 guidelines. A time horizon of 100 years was used and GHG emissions were recalculated following IPCC-guidelines (2006) [24]. Blue water use, indicating the total amount of water sourced from surface or groundwater resources and that is evaporated, incorporated into products, transferred to other watersheds, or disposed into the sea was calculated based on Mekonnen and Hoekstra (2011) [25]. Life cycle inventories (LCI) representative of the Dutch situation were delivered by Blonk Consultants (Gouda, the Netherlands) for 242 foods and beverages, and are referred to as primary data [26]. These foods were selected based on frequency of consumption in the DNFCS and variation in types of food. The National Institute for Public Health and the Environment (RIVM) performed the life cycle impact assessment (LCIA) using ReCiPe-2016 [27] and SimaPro software (version 8.52) (PRe Consultancy B.V., Amersfoort, The Netherlands).
The functional unit used was 1 kg of prepared food at plate or drink. All life cycle stages from cradle till plate were included in the analyses, including phases from primary production, processing, primary packaging, distribution, retail, supermarket, storage, preparation by the consumer (e.g., cooking), and incineration of packaging waste. Transport between all phases, except from retail to the consumer was included. Food waste was included by using food group specific percentages for avoidable and unavoidable food losses throughout the food chain. Land use change was included as direct land use change [28]. Disinfectants in the processing phase, refrigerant use and losses, secondary and tertiary packaging materials, and surface albedo change were not included. Economic allocation was applied when production processes lead to more than one food product, except for milk, where physical allocation was used. The following midpoint indicators for environmental impact were incorporated: land use (m2 * year), blue water use (m3), greenhouse gas (GHG) emission (kg CO2-eq), acidification (kg SO2-eq), fresh water eutrophication (kg P-eq), and marine eutrophication (kg N-eq).
Primary LCA data was available for 242 foods covering 71% of all foods consumed in the DNFCS. The environmental impact of foods and beverages for which primary data were not available but that were consumed in the DNFCS 2012–2016 [23] were estimated using extrapolations from the primary data. These extrapolations were carried out by expert judgement of a panel of (nutritional) scientists (I.B.T, M.v.d.K, S.B, R.E.V) and were based on similarities in types of food, production systems and ingredient composition. For composite dishes, standardized recipes from the Dutch Food composition table (NEVO-online version 2016/5.0) were used where available and if not available, recipes were based on label information [23]. The panel of scientists crosschecked all extrapolations.

2.6. Correlation Environmental Impact Indicators

Spearman rank correlation coefficients based on the 242 foods and beverages with primary LCA data were obtained in order to examine the relationship between the indicators for environmental impact. Significant (p < 0.0001) correlation were found between primary LCA data for GHG emission and acidification, fresh water eutrophication, marine eutrophication and land use, ranging from 0.70–0.86 (Supplementary Table S3). Blue water use had a weak correlation with GHG emission (0.51; p < 0.0001). Further analyses therefore focused on GHG emission and blue water use. The supplemental material provides descriptive analyses, for all environmental indictors analyzed (Supplementary Table S6; GHG emission, acidification, fresh water eutrophication, marine eutrophication, land use, and blue water use).

2.7. Dutch Healthy Diet Index 2015

The Dutch Healthy Diet index 2015 (DHD15) was used to measure health aspects of diets of Dutch adults aged 19–79 years [29]. For children aged 1–18 years, no DHD15 scores were obtained due to different underlying nutritional guidelines for that age group. The method gives a ranking to dietary intake based on the level of adherence to Dutch dietary guidelines for a healthy diet for the components: vegetables, fruits, wholegrain products, legumes, nuts, dairy, fish, tea, fats and oils, coffee, red meat, processed meat, sweetened beverages and fruit juices, alcohol and sodium [30] (Supplementary Table S4).
Components were scored based on their type: adequacy, moderate, optimum, ratio, or quality. Adequacy components are vegetables, fruit, legumes, nuts, fish and tea and reflect the recommendation to consume the minimum mentioned quantity. Moderate components are red meat, processed meat, sweetened beverages and fruit juices, alcohol and sodium and are components of which consumption should be eaten in moderation. Fats and oils are a ratio component and reflect the ratio between consumption of desired food products and less desired food products. The wholegrain component is divided in two sub-components: an adequacy component for wholegrain consumption and a ratio component to reflect replacement of refined grain products by wholegrain products. Dairy is an optimum component, which reflects the consumption in an optimal range. Coffee is a quality component and scoring was based on quality, which was filtered or unfiltered coffee. However, the consumption data used in this study did not distinguish between filtered or unfiltered coffee and therefore the component coffee was excluded.
For all components average food consumption was determined over two days (Supplementary Table S5) and a score of 0 to 10 points was allotted based on type of component. Intakes between minimum and maximum values were scored proportionally. All components had a similar weight and were summed up for the overall DHD15 score. This resulted in a range of 0 to 140 points, whereby 0 points indicated minimal adherence and 140 points indicated maximal adherence to the Dutch dietary guidelines for a healthy diet in 2015.

2.8. Statistical Analysis

Daily means over two consumption days were calculated for each participant in order to investigate food consumption, GHG emissions, blue water use, DHD15 scores and associations. Participants were categorized into children aged 1–8 years, children aged 9–18 years, men aged 19–79 years, and women aged 19–79 years to explore differences according to age and gender. Sixteen main food groups were used to identify important food groups and four different consumption moments with nine aggregated food groups were used to determine important consumption moments (Supplementary Table S2).
Descriptive statistics are displayed for the entire population as well as stratified for gender and age. Numbers are displayed as mean (standard deviation (SD)) or number (proportion) where appropriate. Reported values were weighted for demographic properties, season, and combination of both consumption days (week or weekend).
Multiple regression models were applied to investigate associations between total DHD15 scores, individual DHD15 components, GHG emissions, and blue water use. GHG emissions and blue water use were the dependent variables in the models. The variables age (continuous), sex (male, female), and energy intake (kcal, continuous) were included in the models. Regression coefficients (β) and p-values obtained from the regression model were used to determine associations between DHD15 component and GHG emissions and blue water use. The statistical analysis was performed using SAS software, version 9.4 (SAS Institute Inc., Cary, NC, USA). A two sided p-value of < 0.05 was considered as statistically significant.

3. Results

3.1. Nutritional and Environmental Aspects

Nutritional aspects and GHG emissions in kg CO2-eq and blue water use in m3 per person per day of diets were assessed for the total population and for children aged 1–8 years, children aged 9–18 years, men and women (Table 1). The Dutch population consumed on average 3.1 kg of food per day of which 1.8 kg was (non-alcoholic and alcoholic) beverages (Table 1). Mean protein intake was 79 g/d, and varied between 60 and 103 g/d (25th and 75th percentile). Current consumption patterns provided around 62% of the protein intake from animal-based foods.

3.2. Food Consumption Acording to Age and Gender

In older children (9–18 years), consumption of meat (+41 g/day) and sugary and savory discretionary foods was higher, compared with younger children (aged 1–8 years) (Table 2). Consumption of dairy (−50 g/day) and fruits (−42 g/day) was lower in older children. Circa half of non-alcoholic beverages consumed by children were soft drinks with 469 and 654 mL/day for younger and older children, respectively. Men consumed more animal-based foods, more plant-based foods (potatoes and cereals (+93 g/day) and nuts (+6 g/day)) but lower amounts of fruits (−26 g/day) than women. Men also drank more soft drinks (+113 mL/day), fruit- and vegetable juices (+14 mL/day) and alcoholic beverages (+193 mL/day) but less water (−189 mL/day), coffee and tea (−112 mL/day) compared to women.

3.3. Greenhouse Gas Emissions

The average daily GHG emission was 5.0 ± 2.0 kg CO2-eq (mean ± SD) and varied between 3.0 kg CO2-eq for children aged 1–8 years and 6.0 kg CO2-eq for men aged 19–79 years (Table 1). For the total population, main contributing food groups to total GHG emissions were: meat (33%); dairy (14% (of which more than half are dairy drinks 8%)) and non-alcoholic beverages (9%). Dairy (26%) and sugary and savory foods (9%) were more important contributing food groups for children aged 1–8 years and children aged 9–18 years, respectively. Plant-based foods, such as vegetables (5%), fruits (3%), nuts (2%), and legumes (0.2%) contributed less to daily GHG emissions. The majority of beverages-related GHG emissions were from soft drinks for children (1–18 y). Emissions from coffee and tea were the most important beverages contributing to beverages-related emissions for adults. The GHG emission from alcoholic beverages was twice as high in men (0.27 kg CO2-eq), compared to women (0.13 kg CO2-eq).

3.4. Blue Water Use

Blue water use was on average 0.14 ± 0.08 m3 (mean ± SD) per person per day for the Dutch population. Estimated blue water use was lower for younger and older children (1–18 years) compared to adults (Table 2). Non-alcoholic beverages (31%) and fruits (14%) mainly determined daily blue water use. Meat contributed 11% to daily water use, remaining animal-based foods contributed less, for instance dairy (4%) and cheese (2%). Of the beverages, fruit- and vegetable juices (13%) and coffee and tea (12%) consumption were associated with the highest use of blue water. For younger and older children, fruit and vegetable juices and soft drinks contributed most to beverage-related blue water use. Compared to adults, contribution from fruits was higher in children aged 1–8 years but contribution from nuts was lower in children aged 1–18 years. Men had higher daily blue water use from animal-based foods and plant-based foods (potatoes and cereals and nuts) compared to women. Contribution from fruits was lower for men (11%) than for women (17%).

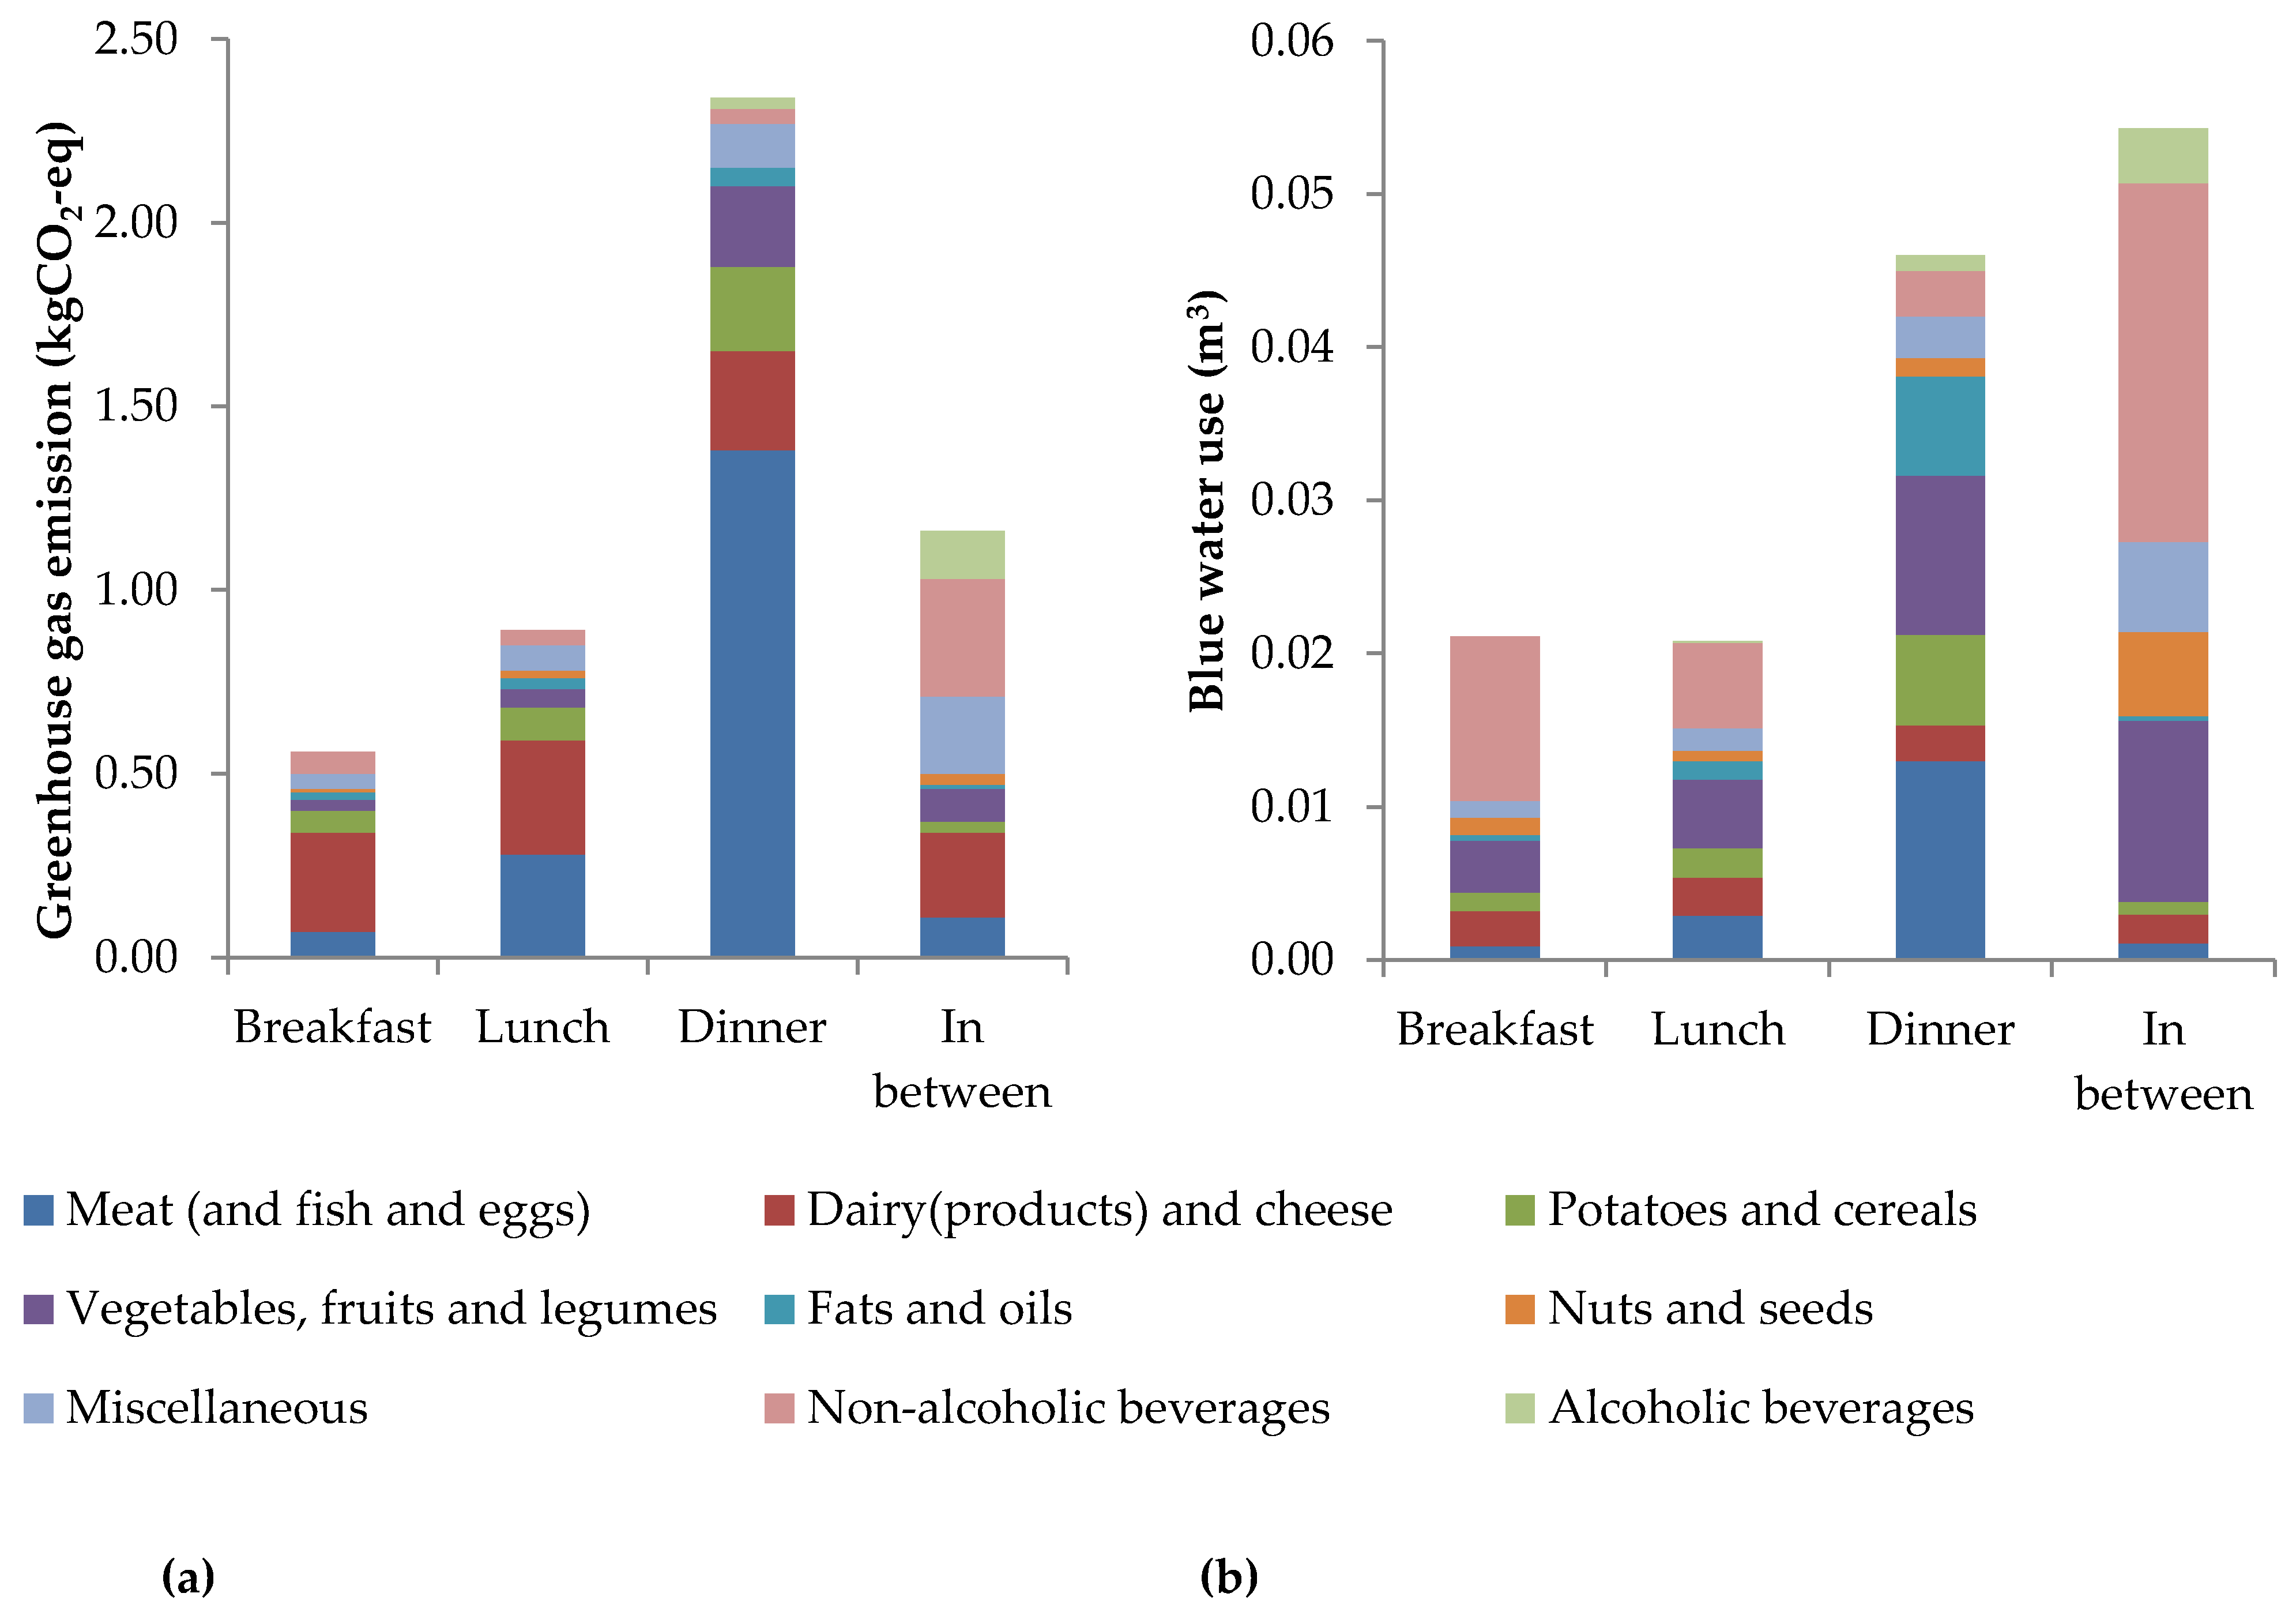
3.5. Consumption Moments

On average, dinner contributes 47% to daily GHG emission. At dinner, animal-based foods (meat, fish and eggs (28%), dairy, and cheese (5%)) and potatoes and cereals (5%) contributed the most (Figure 1a). Twenty-three percent of the daily dietary emissions were in between meals. Important sources were non-alcoholic beverages (6%) and dairy and cheese (5%).
For blue water use the most important consumption moment was in between meals (38% of daily blue water use) (Figure 1b). Non-alcoholic beverages (16%) and vegetables, fruits and legumes (8%) were important food groups that contributed for more than half of blue water use within the consumption moment in between meals. Dinner contributed with 32% to daily blue water use and during dinner, animal-based foods (meat, fish and eggs (9%)) and vegetables, fruits and legumes (7%) were the most important sources.

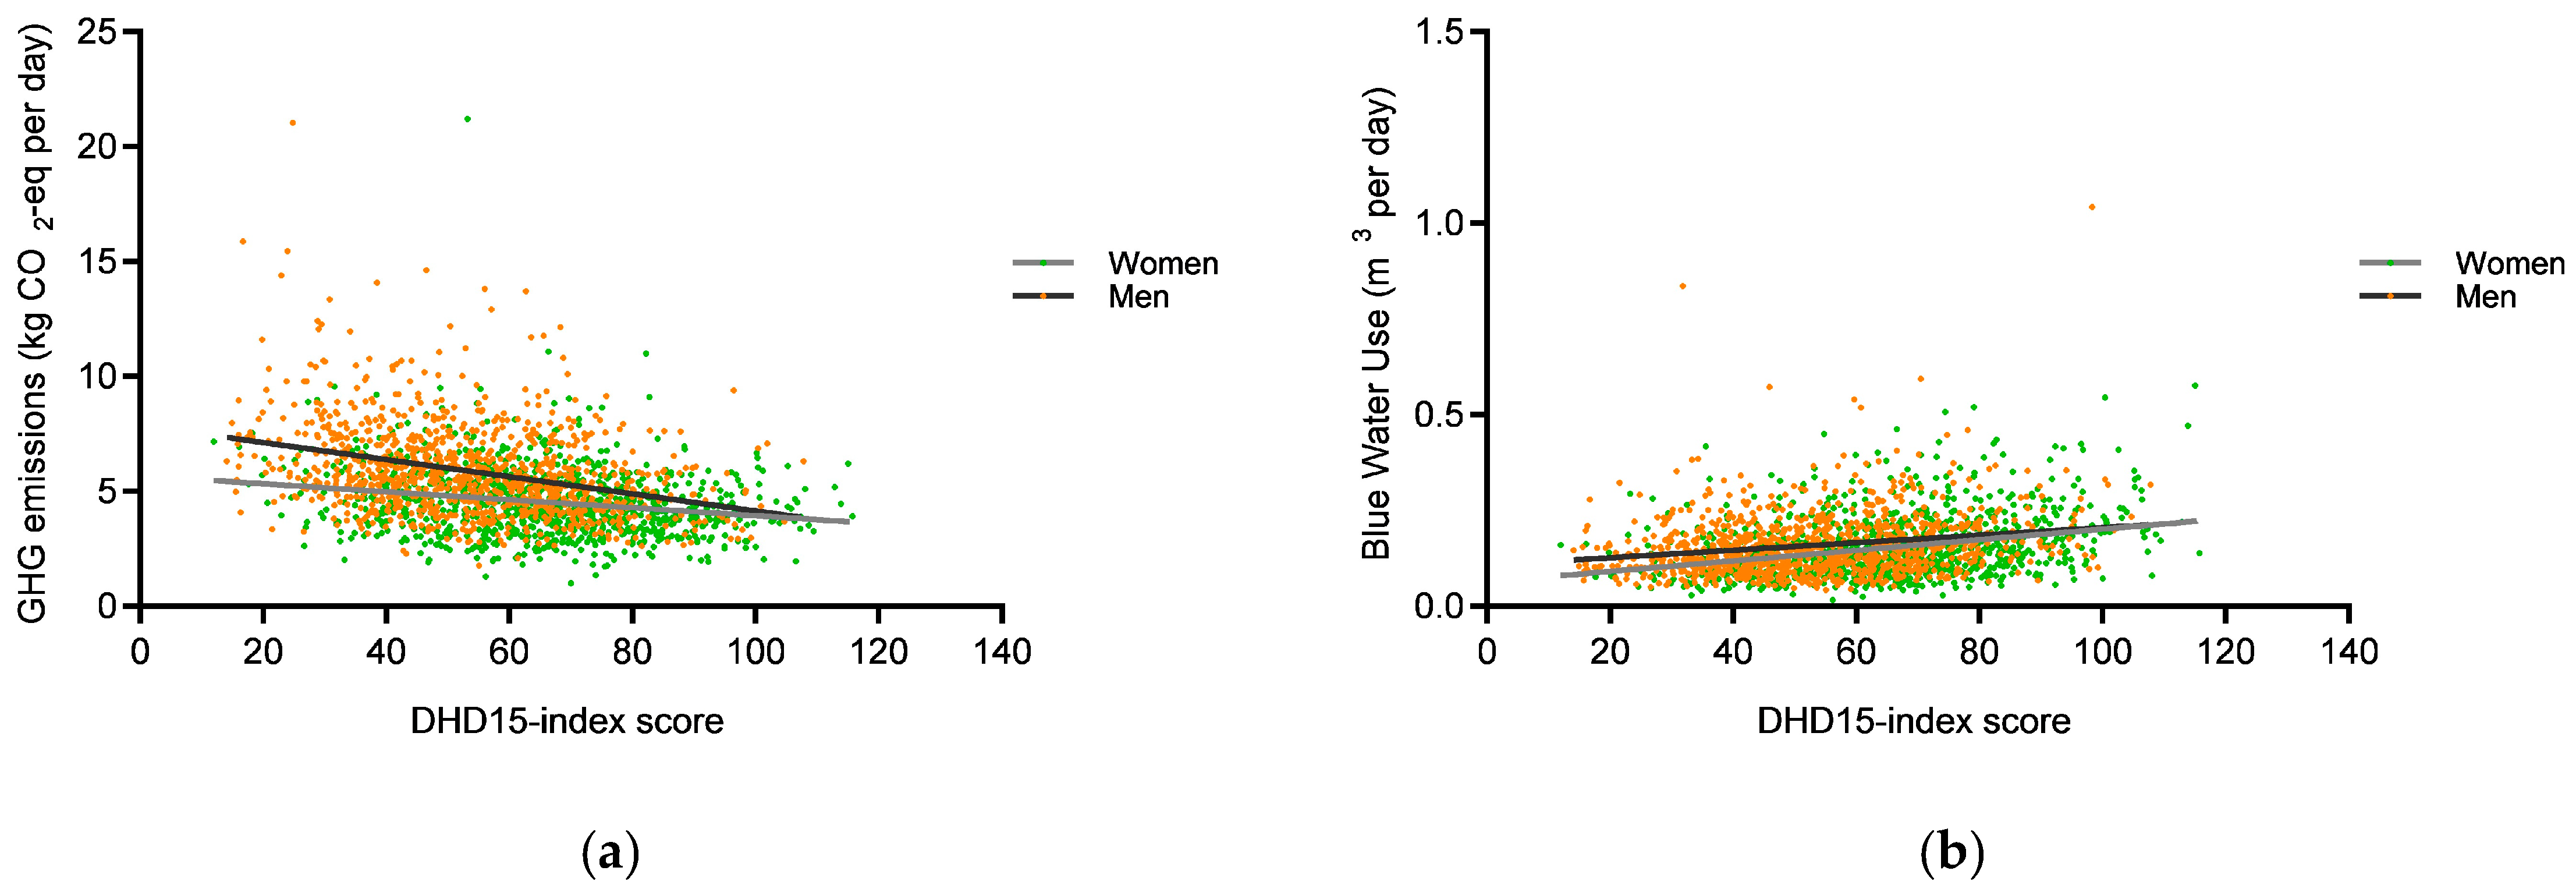
3.6. Dutch Healthy Diet Index 2015

DHD15 scores (maximum 140) showed that women had a significantly higher adherence to DHD15 with 64 ± 24 points (mean ± SD) compared to men with 52 ± 22 points (mean ± SD) (Table 3). On 9 out of 14 components (fruit, nuts, tea, red meat, processed meat, sweetened beverages and fruit juices, alcohol, and sodium) women scored significantly higher compared to men. The DHD15 score was significantly inversely (p < 0.0001) correlated with GHG emissions and significantly positively correlated with blue water use (Figure 2a,b).
After adjustments for age, sex, and energy intake, DHD15 score was still significant inversely associated with GHG emissions and positively with blue water use (Table 4). Thus, when DHD15 score increases with 1 point, emissions decrease with 0.011 kg CO2-eq and blue water use increases with 0.002 m3 (~2 L). To further explore adherence to individual components, the 14 individual DHD15 components were included in a similar model. Inverse significant associations were found between GHG emissions and the components of red meat, ratio fats, ratio fats and alcohol. Implying that better adherence to these components was associated with lower emissions. The components vegetables, fruit, dairy, ratio fish and processed meat were significantly associated with higher emissions. No associations were found for legumes, nuts, tea, sugared beverages, and sodium.
Significant associations for lower blue water use were found for more adherence to the components of ratio grains, sugared beverages, and alcohol. The components of vegetables, fruit, nuts, ratio fish, tea, processed meat and sodium were positively associated with blue water use. No associations were found for blue water use with legumes, dairy, ratio fats, and red meat.

4. Discussion

In this study, the food consumption patterns for the Dutch population in general as well as for children, men and women separately, were evaluated for environmental impact (GHG emissions and blue water use) and healthiness of diet (measured with the Dutch Healthy Diet index 2015). Climate change potential (GHG emissions) and blue water use among 4313 Dutch children and adults was on average 5.0 ± 2.0 kg CO2-eq and 0.14 ± 0.08 m3 per person per day. Daily environmental impact varied between children and adults. Men had overall a higher environmental impact compared to women. Meat, dairy, non-alcoholic beverages, and the consumption moment dinner mainly determined daily GHG emissions. Non-alcoholic beverages, fruits, and meat were main determinants of blue water use, with main consumption in between meals. Healthier diets, as scored on the DHD15, were associated with lower GHG emissions but higher blue water use. Better adherence to Dutch healthy diet guidelines for red and processed meat (less consumption); vegetables (more consumption) determined the strongest association with GHG emissions. Better adherence to Dutch guidelines for nuts, vegetables, and fruits (more consumption) determined the association with blue water use.
These results highlight the importance of investigating several environmental indicators in relation to healthy diets. Most research to date was focused on associations between GHG emission and healthy diets. This study shows that this focus on GHG emissions ignores important effects of foods and beverages, which have opposing associations between GHG emissions, blue water use and healthy diets. As far as we know, this is the first study investigating healthiness of diet (DHD15) in relation to blue water use in Dutch diets. In our regression analysis, we found that better adherence to the Dutch dietary guidelines of plant-based foods (nuts, vegetables, and fruits) significantly led to higher blue water use. These guidelines advise to increase consumption of vegetables and fruits and to consume moderate intakes of unsalted nuts compared to the current consumption [29]. Thus, while those foods benefit human health, they are associated with higher blue water use. Therefore, shifting towards a more plant-based diet may decrease GHG emissions and increase blue water use based on current origin, production, and consumption of foods.
Our conclusions are in line with previous studies investigating daily blue water use of diets. Meier and Christen (2013) investigated environmental impact, including blue water use, of several dietary scenarios in a German population [31]. They found, similar to our findings, that diets associated with increased blue water use were caused by the consumption of higher quantities of plant-based foods such as vegetables, fruits, and nuts [31]. Moreover, Springmann et al., (2018) showed in a modelling study that increased water use was associated with vegetable and fruit (and legume) consumption [3]. In order to stabilize and/or reduce blue water use from foods and beverages while meeting dietary requirements, different food choices can be considered within food groups. Foods and beverages using less blue water, such as (local) apples instead of oranges or mangoes, or hazelnuts instead of cashew nuts, can improve health aspects of diets while limiting the increase of- or even reducing blue water use [26]. Besides, changing from more animal-based foods to more plant-based foods can reduce (green) water footprint [20].
A body of literature evaluating dietary GHG emissions exists, which confirm our results. Meat, dairy (products), cheese, and beverages were shown to be major contributors to daily GHG emissions [5,12,14,15,16]. In the previous Dutch National Food Consumption Survey (DNFCS) 2007–2010, Temme et al., (2015) investigated GHG emissions in Dutch diets among a population aged 9–69 years and showed that younger children and women had a lower GHG emissions compared to men, similar to the current study [32]. The comparison of absolute GHG emissions of previous and current diets according to the DNFCS is not in the scope of this study. We used updated LCA data, included more age groups, and the current DNFCS was conducted in a different sample of the Dutch population. However, consumed quantities of animal-based foods (meat (−8%) and dairy and cheese (−12%)), alcoholic beverages (−19%) and sugar containing beverages decreased and plant-based foods (vegetables (+3%), legumes (+8%) and fruits (+8%) increased [21].
In the literature there is some inconsistency concerning the association between health aspects of diets and GHG emission [1,5,12,14,15,17,32,33,34,35]. Apart from the association between healthy diets (DHD15) and the environmental indicators, we investigated individual DHD15 components to evaluate the impact of underlying Dutch dietary guidelines on GHG emissions and blue water use. Biesbroek et al., (2017) found in a Dutch cohort (EPIC-NL) that had better adherence to the Dutch dietary guidelines, assessed with DHD15, was associated as well with lower GHG emission [33] but did not investigate individual components of the DHD15. Studies investigating individual components of dietary quality scores [36] were not comparable with our results due to underlying country specific dietary guidelines [37].
This study also has some limitations that should be addressed. First, in our study the environmental impact was estimated using primary LCA data and extrapolations. Extrapolations can affect the results due to data uncertainty. However, primary LCA data covered 71% of consumed foods and beverages. The remaining contribution of extrapolated LCA data was small and did not influence the ranking of contributing foods in our study. As a result, our LCA data is more complete, which enables us to determine the entire daily food pattern and allows extended analyses in the future such as scenario analyses.
Secondly, food consumption data was based on two 24-h dietary recalls following the guidelines of the European Food and Safety Authority (EFSA) [38]. Although it is methodologically valid to obtain food consumption data this way, misreporting, underreporting, or overreporting occurs [21]. The amount of misreporting is unknown and not corrected for in this study thus the actual environmental impact might be influenced by misreporting. The estimation of the DHD15 score was based on the average of two 24-h dietary recalls and not on the habitual daily intake, and therefore the actual DHD15 score might be influenced as well.
Lastly, although we found that healthier diets (DHD15) were associated with lower emissions but higher blue water use, associations depend on the underlying method to define healthy and sustainable diets [2]. Our results concerning the association between the environmental impact indicators and health aspects of diets is based on DHD15, but this instrument was initially developed to assess adherence to Dutch dietary guidelines for foods associated with health [29]. Dietary quality scores, such as the DHD15, are suited to combine health aspects of diets and environmental impact, but choosing the most suitable method is of major importance because it can influence the results [2]. Previous studies showed inverse associations between food-based diet quality scores and GHG emissions [33,36,39,40], and no clear association between nutrient-based diet quality scores and GHG emissions [13,41,42]. In our study, we used a food-based quality score to investigate the association between health aspects of diet and GHG emissions. This food-based dietary quality score method assesses whole foods and easily categorizes specific foods as animal-based or plant-based, which may influence the association. Nutrient-based scores do not consider nutrient sources of foods and this could explain why no clear associations were found using nutrient-based scores [40]. The DHD15 is currently not yet a sufficient instrument to qualify healthy as well as the sustainable aspects of diets. Underlying Dutch dietary guidelines should be updated first in order to capture a healthy and sustainable diet.
For the development of healthy and sustainable dietary guidelines, advice and policies, research should not only address the proportion of animal-based foods in diets [43] but also other dietary aspects such as overconsumption and other foods and beverages that significantly contribute to environmental impact. Indeed, the ratio of animal- versus vegetable protein should shift in favor of vegetable protein, and intake of animal protein should also decrease (except for the elderly due to higher protein requirements) because in high-income countries, such as the Netherlands, total protein intake is often easily exceeding recommendations [44]. However, this is socially and culturally difficult to target because drivers for the consumption of animal-based foods are influenced by an inter-related system of culture, taste, costs, religion, gender, and socio-economic status [44]. Therefore, addressing other dietary aspects, overconsumption is important because regardless of the source, energy intake is associated with higher environmental impact [17] and discretionary foods [45]. Our results showed that the consumption of discretionary foods, that do not contribute to human health, such as sweet and savory snacks (and salted nuts), soft drinks, and alcoholic beverages (adults only) consumed by the entire population, certainly contribute towards daily environmental impact. Targeting those foods could lower environmental impact and benefit human health. This is in line with results from a modelling study in the Netherlands showing that reducing the consumption of soft and alcoholic drinks throughout the day leads to significantly lower dietary GHG emissions of people in the Netherlands, while also having health benefits [46]. In addition to this, our results suggest that reducing the consumption of non-alcoholic beverages, such as coffee and tea and fruit- and vegetable juice, during the day could decrease blue water use.
Overall, when aligning dietary recommendations, the aspects of sustainability should be included. In order to capture healthy and sustainable dietary guidelines and diets, total protein intake, overconsumption, and consumption of discretionary foods should be included next to the shift from animal-based toward plant-based diets. Those aspects should be accounted for in improved methods, such as diet quality scores to evaluate healthy and sustainable food patterns. Further research is needed to investigate methods to assess healthy and sustainable diets.
To conclude, environmental impact varied between age and gender. Meat, dairy, and cheese and non-alcoholic beverages, and the consumption moments dinner and in between meals determined the daily GHG emission of Dutch diets mostly. For blue water use, non-alcoholic beverages, fruits and meat were main contributors, and foods with high blue water impacts were consumed mostly in between meals. The DHD15 score includes food groups associated with health and does not (yet) give the full association of all food consumed and associated environmental impacts. Besides, different associations of environmental indicators with health aspects of diets need to be considered when aligning diets for health and sustainability.

Supplementary Materials

The following are available online at https://www.mdpi.com/2071-1050/11/21/6027/s1, Table S1: Population characteristics for 4313 Dutch participants aged 1–79 y derived from the Dutch National Food Consumption Survey 2012–2016, Table S2: Categorization and shortened names for 16 main groups and 9 aggregated groups for analysis adapted from GloboDiet, Table S3: Spearman correlation coefficients for greenhouse gas emission and acidification, fresh water eutrophication, marine eutrophication, land use and water use for 242 foods with primary life cycle analysis data, Table S4: Components and recommendations (threshold and cut-off) of the Dutch Healthy Diet index 2015 and their minimum and maximum scores, Table S5: Mean (standard deviation) food consumption per component of the Dutch Healthy Diet index 2015 for 2078 Dutch men and women aged 19–79 y derived from the Dutch National Food Consumption Survey 2012–2016, Table S6: Environmental impact of daily diets and nutritional aspects for total population (n = 4313) aged 1–79 y derived from the Dutch National Food Consumption Survey 2012–2016.

Author Contributions

E.H.M.T. initiated the study. R.E.V. was involved in data analysis. R.E.V. prepared the first draft of the manuscript, which was critically evaluated and refined by E.H.M.T., I.B.T., M.v.d.K., S.B., E.d.V., A.H. R.E.V. prepared the final draft of the manuscript. All authors participated intellectually in the development of the paper. We thank C.T.M.v.R. for conducting the DNFCS.

Funding

The present study was funded by the Ministry of Agriculture, Nature and Food Quality, the Netherlands.

Conflicts of Interest

The authors declare no conflict of interest.

References

  1. Tilman, D.; Clark, M. Global diets link environmental sustainability and human health. Nature 2014, 515, 518–522. [Google Scholar] [CrossRef] [PubMed]
  2. Hallström, E.; Davis, J.; Woodhouse, A.; Sonesson, U. Using dietary quality scores to assess sustainability of food products and human diets: A systematic review. Ecol. Indic. 2018, 93, 219–230. [Google Scholar] [CrossRef]
  3. Springmann, M.; Wiebe, K.; Mason-D’Croz, D.; Sulser, T.B.; Rayner, M.; Scarborough, P. Health and nutritional aspects of sustainable diet strategies and their association with environmental impacts: A global modelling analysis with country-level detail. Lancet Planet. Health 2018, 2, e451–e461. [Google Scholar] [CrossRef]
  4. FAO; UNICEF; WFP; WHO. The State of Food Security and Nutrition in the World 2018. Building Climate Resilience for Food Security and Nutrition; FAO: Rome, Italy, 2018; Licence: CC BY-NC-SA 3.0 IGO. [Google Scholar]
  5. Aleksandrowicz, L.; Green, R.; Joy, E.J.; Smith, P.; Haines, A. The impacts of dietary change on greenhouse gas emissions, land use, water use, and health: A systematic review. PLoS ONE 2016, 11, e0165797. [Google Scholar] [CrossRef]
  6. Vermeulen, S.J.; Campbell, B.M.; Ingram, J.S. Climate change and food systems. Annu. Rev. Environ. Resour. 2012, 37, 195–222. [Google Scholar] [CrossRef]
  7. Foley, J.A.; DeFries, R.; Asner, G.P.; Barford, C.; Bonan, G.; Carpenter, S.R.; Chapin, F.S.; Coe, M.T.; Daily, G.C.; Gibbs, H.K.; et al. Global Consequences of Land Use. Science 2005, 309, 570–574. [Google Scholar] [CrossRef] [Green Version]
  8. Steffen, W.; Richardson, K.; Rockström, J.; Cornell, S.E.; Fetzer, I.; Bennett, E.M.; Biggs, R.; Carpenter, S.R.; De Vries, W.; De Wit, C.A. Planetary boundaries: Guiding human development on a changing planet. Science 2015, 347, 1259855. [Google Scholar] [CrossRef] [PubMed] [Green Version]
  9. Vanham, D.; Comero, S.; Gawlik, B.M.; Bidoglio, G. The water footprint of different diets within European sub-national geographical entities. Nat. Sustain. 2018, 1, 518–525. [Google Scholar] [CrossRef]
  10. Campbell, B.M.; Beare, D.J.; Bennett, E.M.; Hall-Spencer, J.M.; Ingram, J.S.; Jaramillo, F.; Ortiz, R.; Ramankutty, N.; Sayer, J.A.; Shindell, D. Agriculture production as a major driver of the Earth system exceeding planetary boundaries. Ecol. Soc. 2017, 22, 8. [Google Scholar] [CrossRef]
  11. Springmann, M.; Godfray, H.C.J.; Rayner, M.; Scarborough, P. Analysis and valuation of the health and climate change cobenefits of dietary change. Proc. Natl. Acad. Sci. USA 2016, 113, 4146–4151. [Google Scholar] [CrossRef] [Green Version]
  12. Perignon, M.; Vieux, F.; Soler, L.-G.; Masset, G.; Darmon, N. Improving diet sustainability through evolution of food choices: Review of epidemiological studies on the environmental impact of diets. Nutr. Rev. 2017, 75, 2–17. [Google Scholar] [CrossRef] [PubMed]
  13. Payne, C.L.; Scarborough, P.; Cobiac, L. Do low-carbon-emission diets lead to higher nutritional quality and positive health outcomes? A systematic review of the literature. Public Health Nutr. 2016, 19, 2654–2661. [Google Scholar] [CrossRef]
  14. Macdiarmid, J.I. Is a healthy diet an environmentally sustainable diet? Proc. Nutr. Soc. 2013, 72, 13–20. [Google Scholar] [CrossRef]
  15. Hallström, E.; Carlsson-Kanyama, A.; Börjesson, P.; Schenck, R.; Huizen, D. Effect of Dietary Change on Greenhouse Gas Emissions and Land Use Demand—The State of Knowledge in 2014. In Proceedings of the 9th International Conference on Life Cycle Assessment in the Agri-Food Sector (LCA Food 2014), San Francisco, CA, USA, 8–10 Octboter 2014; ACLCA: Vashon, DC, USA, 2015. [Google Scholar]
  16. Hallström, E.; Röös, E.; Börjesson, P. Sustainable meat consumption: A quantitative analysis of nutritional intake, greenhouse gas emissions and land use from a Swedish perspective. Food Policy 2014, 47, 81–90. [Google Scholar] [CrossRef]
  17. Vieux, F.; Darmon, N.; Touazi, D.; Soler, L.G. Greenhouse gas emissions of self-selected individual diets in France: Changing the diet structure or consuming less? Ecol. Econ. 2012, 75, 91–101. [Google Scholar] [CrossRef]
  18. Scarborough, P.; Appleby, P.N.; Mizdrak, A.; Briggs, A.D.; Travis, R.C.; Bradbury, K.E.; Key, T.J. Dietary greenhouse gas emissions of meat-eaters, fish-eaters, vegetarians and vegans in the UK. Clim. Chang. 2014, 125, 179–192. [Google Scholar] [CrossRef] [Green Version]
  19. Carlsson-Kanyama, A.; González, A.D. Potential contributions of food consumption patterns to climate change. Am. J. Clin.Nutr. 2009, 89, 1704S–1709S. [Google Scholar] [CrossRef] [Green Version]
  20. Harris, F.; Moss, C.; Joy, E.J.M.; Quinn, R.; Scheelbeek, P.F.D.; Dangour, A.D.; Green, R. The Water Footprint of Diets: A Global Systematic Review and Meta-analysis. Adv. Nutr. 2019, 8, 1–12. [Google Scholar] [CrossRef]
  21. Van Rossum, C.T.M.; Buurma-Rethans, E.J.M.; Vennemann, F.B.C.; Beukers, M.; Brants, H.A.M.; De Boer, E.J.; Ocké, M.C. The Diet of the Dutch: Results of the First Two Years of the Dutch National Food Consumption Survey 2012–2016; Environment, N.I.f.P.H.a.t., Ed.; RIVM Letter Report 2016-0082: Bilthoven, The Netherlands, 2016. [Google Scholar]
  22. Slimani, N.; Ferrari, P.; Ocke, M.C.; Welch, A.; Boeing, H.; Van Liere, M.; Pala, V.; Amiano, P.; Lagiou, A.; Mattisson, I.; et al. Standardization of the 24-hour diet recall calibration method used in the European Prospective Investigation into Cancer and Nutrition (EPIC): General concepts and preliminary results. Eur. J. Clin. Nutr. 2000, 54, 900–917. [Google Scholar] [CrossRef]
  23. The National Insitute for Public Health and the Environment. NEVO Online Version 2016/5.0. Available online: https://nevo-online.rivm.nl/ (accessed on 1 August 2019).
  24. De Klein, C.; Novoa, R.S.; Ogle, S.; Smith, K.A.; Rochette, P.; Wirth, T.C.; McConkey, B.G.; Mosier, A.; Rypdal, K.; Walsh, M. N2O Emissions from Managed Soils, and CO2 Emissions from Lime and Urea Application. In IPCC Guidelines for National Greenhouse Gas Inventories, Prepared by the National Greenhouse Gas Inventories Programme; IPCC: Geneva, Switzerland, 2006; Volume 4, pp. 1–54. [Google Scholar]
  25. Mekonnen, M.M.; Hoekstra, A.Y.J.H.; Sciences, E.S. The green, blue and grey water footprint of crops and derived crop products. Hydrol. Earth Syst. Sci. Discuss. 2011, 15, 1577–1600. [Google Scholar] [CrossRef] [Green Version]
  26. The National Institute for Public Health and the Environment. LCA Database Food. Available online: https://statline.rivm.nl/#/RIVM/nl/dataset/50060NED/table (accessed on 4 October 2019).
  27. Huijbregts, M.; Steinmann, Z.; Elshout, P.; Stam, G.; Verones, F.; Vieira, M.; Hollander, A.; Zijp, M.; Van Zelm, R. ReCiPe 2016: A Harmonized Life Cycle Impact Assessment Method at Midpoint and Endpoint Level Report I: Characterization; RIVM Offical Report: Bilthoven, The Netherlands, 2016. [Google Scholar]
  28. Blonk Consultants. Direct Land Use Change Assessment Tool Version 2016.1; Blonk Consultants: Gouda, The Netherlands, 2016. [Google Scholar]
  29. Looman, M.; Feskens, E.J.; de Rijk, M.; Meijboom, S.; Biesbroek, S.; Temme, E.H.; de Vries, J.; Geelen, A. Development and evaluation of the Dutch Healthy Diet index 2015. Public Health Nutr. 2017, 20, 2289–2299. [Google Scholar] [CrossRef] [PubMed]
  30. Kromhout, D.; Spaaij, C.; de Goede, J.; Weggemans, R. The 2015 Dutch food-based dietary guidelines. Eur. J. Clin. Nutr. 2016, 70, 869–878. [Google Scholar] [CrossRef] [PubMed]
  31. Meier, T.; Christen, O. Environmental impacts of dietary recommendations and dietary styles: Germany as an example. Environ. Sci. Technol. 2012, 47, 877–888. [Google Scholar] [CrossRef] [PubMed]
  32. Temme, E.H.M.; Toxopeus, I.B.; Kramer, G.F.H.; Brosens, M.C.C.; Drijvers, J.M.M.; Tyszler, M.; Ocké, M.C. Greenhouse gas emission of diets in the Netherlands and associations with food, energy and macronutrient intakes. Public Health Nutr. 2015, 18, 2433–2445. [Google Scholar] [CrossRef]
  33. Biesbroek, S.; Verschuren, W.M.M.; Boer, J.M.A.; van de Kamp, M.E.; Van Der Schouw, Y.T.; Geelen, A.; Looman, M.; Temme, E.H.M. Does a better adherence to dietary guidelines reduce mortality risk and environmental impact in the Dutch sub-cohort of the European Prospective Investigation into Cancer and Nutrition? Br. J. Nutr. 2017, 118, 69–80. [Google Scholar] [CrossRef] [Green Version]
  34. Macdiarmid, J.I.; Kyle, J.; Horgan, G.W.; Loe, J.; Fyfe, C.; Johnstone, A.; McNeill, G. Sustainable diets for the future: Can we contribute to reducing greenhouse gas emissions by eating a healthy diet? Am. J. Clin. Nutr. 2012, 96, 632–639. [Google Scholar] [CrossRef]
  35. Scarborough, P.; Allender, S.; Clarke, D.; Wickramasinghe, K.; Rayner, M. Modelling the health impact of environmentally sustainable dietary scenarios in the UK. Eur. J. Clin. Nutr. 2012, 66, 710–715. [Google Scholar] [CrossRef] [Green Version]
  36. Monsivais, P.; Scarborough, P.; Lloyd, T.; Mizdrak, A.; Luben, R.; Mulligan, A.A.; Wareham, N.J.; Woodcock, J. Greater accordance with the Dietary Approaches to Stop Hypertension dietary pattern is associated with lower diet-related greenhouse gas production but higher dietary costs in the United Kingdom. Am. J. Clin. Nutr. 2015, 102, 138–145. [Google Scholar] [CrossRef] [Green Version]
  37. Mertens, E.; van’t Veer, P.; Hiddink, G.J.; Steijns, J.M.; Kuijsten, A. Operationalising the health aspects of sustainable diets: A review. Public Health Nutr. 2017, 20, 739–757. [Google Scholar] [CrossRef]
  38. Authority, E.F.S. General principles for the collection of national food consumption data in the view of a pan-European dietary survey. EFSA J. 2009, 7, 1435. [Google Scholar] [CrossRef]
  39. Murakami, K.; Livingstone, M.B.E. Greenhouse gas emissions of self-selected diets in the UK and their association with diet quality: Is energy under-reporting a problem? Nutr. J. 2018, 17, 27. [Google Scholar] [CrossRef] [PubMed]
  40. Mertens, E.; Kuijsten, A.; Geleijnse, J.M.; Boshuizen, H.C.; Feskens, E.J.M.; van’t Veer, P. FFQ versus repeated 24-h recalls for estimating diet-related environmental impact. Nutr. J. 2019, 18, 2. [Google Scholar] [CrossRef] [PubMed]
  41. Walker, C.; Gibney, E.R.; Hellweg, S. Comparison of Environmental Impact and Nutritional Quality among a European Sample Population–findings from the Food4Me study. Sci. Rep. 2018, 8, 2330. [Google Scholar] [CrossRef] [PubMed]
  42. Masset, G.; Vieux, F.; Verger, E.O.; Soler, L.-G.; Touazi, D.; Darmon, N. Reducing energy intake and energy density for a sustainable diet: A study based on self-selected diets in French adults. Am. J. Clin. Nutr. 2014, 99, 1460–1469. [Google Scholar] [CrossRef] [PubMed]
  43. Macdiarmid, J.I.; Douglas, F.; Campbell, J. Eating like there’s no tomorrow: Public awareness of the environmental impact of food and reluctance to eat less meat as part of a sustainable diet. Appetite 2016, 96, 487–493. [Google Scholar] [CrossRef]
  44. Clonan, A.; Roberts, K.E.; Holdsworth, M. Socioeconomic and demographic drivers of red and processed meat consumption: Implications for health and environmental sustainability. Proc. Nutr. Soc. 2016, 75, 367–373. [Google Scholar] [CrossRef]
  45. Hendrie, G.; Baird, D.; Ridoutt, B.; Hadjikakou, M.; Noakes, M. Overconsumption of energy and excessive discretionary food intake inflates dietary greenhouse gas emissions in Australia. Nutrients 2016, 8, 690. [Google Scholar] [CrossRef]
  46. van de Kamp, M.E.; Seves, S.M.; Temme, E.H.M. Reducing GHG emissions while improving diet quality: Exploring the potential of reduced meat, cheese and alcoholic and soft drinks consumption at specific moments during the day. BMC Public Health 2018, 18, 264. [Google Scholar] [CrossRef]
Figure 1. (a) Average greenhouse gas emission in kg CO2-equivalents and (b) average blue water use in m3 by consumption moment of 4313 Dutch children and adults derived from the Dutch National Food Consumption Survey 2012–2016, weighted for demographic properties, season, and combination of both consumption days.
Sustainability 11 06027 g001
Figure 2. (a) Scatterplot illustrating the relation between the Dutch Healthy Diet index 2015 score and daily greenhouse gas emissions in kg CO2-equivalents for 2078 Dutch men and women aged 19–79 years derived from the Dutch National Food Consumption Survey 2012–2016. (b) Scatterplot illustrating the relation between the Dutch Healthy Diet index 2015 scores and daily blue water use in m3 for 2078 Dutch men and women aged 19–79 years derived from the Dutch National Food Consumption Survey 2012–2016.
Sustainability 11 06027 g002
Table 1. Daily mean (standard deviation) nutritional (in grams per day) and environmental aspects (per day) for total population and for children aged 1–8 years, children aged 9–18 years, men and women aged 19–79 years derived from the Dutch National Food Consumption Survey 2012–2016. a.
Total Population
(n = 4313)
Children, 1–8 y
(n = 1192)
Children, 9–18 y
(n = 1043)
Men, 19–79 y
(n = 1043)
Women, 19–79 y
(n = 1035)
Mean SDMean SDMean SDMean SDMean SD
Nutritional aspects
Quantity3053989168222823934403427116131921127
Energy21267171495222212042325439541860656
Carbohydrates23684201302665327011720284
Fat843652118121102507534
Protein7928488691795367226
Animal protein4822287411458304524
Vegetable protein301220429737172713
Fiber2071421842310189
Environmental impact
Greenhouse gas emission (kg CO2-eq)4.961.992.950.684.361.175.982.604.582.02
Blue water use (m3)0.140.080.070.020.100.040.160.110.150.11
SD, standard deviation; CO2-eq, carbon dioxide equivalents. a reported values weighted for demographic properties, season, and combination of both consumption days.
Table 2. Daily means of greenhouse gas emissions in kg CO2-equivalents and blue water use in m3 by food group for total population and for children aged 1–8 years, children aged 9–18 years, men and women aged 18–79 years, derived from the Dutch National Food Consumption Survey 2012–2016. a.
Total Population (n = 4313)Children, 1–8 y (n = 1192)Children, 9–18 y (n = 1043)Men, 19–79 y (n = 1043)Women, 19–79 y (n = 1035)
Food GroupgkgCO2eqm3gkgCO2eqm3gkgCO2eqm3gkgCO2eqm3gkgCO2eqm3
Animal based foods
Meat971.660.016520.820.008931.520.0151212.110.020831.440.014
Red processed meat430.690.006310.440.004450.690.006540.860.008360.580.005
Red unprocessed meat320.740.007120.280.002270.610.005430.980.009280.650.006
White processed meat50.040.00130.020.00060.050.00150.040.00150.040.001
White unprocessed meat170.190.00360.070.001150.180.002200.230.003160.180.003
Dairy3100.700.0063680.780.0073180.720.0063280.740.0062760.640.006
Dairy drinks2010.410.0032820.570.0052270.480.0042110.420.0031640.330.003
Cheese330.380.003150.170.001220.250.002400.470.004330.380.003
Fish160.130.00160.050.00070.060.001190.160.001180.150.001
Eggs130.050.00170.030.001100.040.001150.070.002120.050.001
Plant-based foods
Potatoes and cereals2660.400.0101780.260.0062670.440.0093230.480.0122300.350.009
Vegetables1310.230.010660.120.005890.160.0071420.250.0111470.250.012
Fruits (and olives)1200.150.0201380.160.017940.120.0131080.130.0171340.190.025
Nuts and seeds100.120.00850.040.00270.090.003140.150.01080.110.010
Legumes50.010.00020.000.00030.010.00050.010.00050.010.000
Beverages
Non-alcoholic beverages17080.470.0437280.200.01812610.390.03118010.550.04619730.460.049
Soft drinks3550.180.0064690.150.0066540.300.0123570.200.0062400.130.004
Coffee and tea7080.200.017430.010.0021300.030.0058140.240.0169260.250.026
Fruit and vegetable juice550.070.019430.040.009490.060.014650.080.023510.070.018
Water5890.020.0011730.000.0004280.010.0015660.020.0017550.020.001
Alcoholic beverages1390.160.00500.000.000280.020.0002680.270.007750.130.005
Miscellaneous
Sweets and snacks920.300.008690.220.0051120.390.0091050.340.009790.250.007
Fats and oils220.110.009140.060.003190.090.005280.140.010190.100.009
Broth, sauces and cond.780.060.003230.040.001540.050.002960.090.004790.050.002
Other150.020.001100.010.00090.010.000120.020.000210.030.001
SD, standard deviation; CO2-eq, carbon dioxide equivalents a reported values weighted for demographic properties, season, and combination of both consumption days.
Table 3. Means (standard deviations) for Dutch Healthy Diet index 2015 scores and individual components for 2078 men and women aged 19–79 years derived from the Dutch National Food Consumption Survey 2012–2016. a.
Men, 19–79 y
(n = 1043)
Women, 19–79 y
(n = 1035)
MeanSDMeanSD
DHD15 score total51.822.464.2 ***23.6
DHD15 Components b
Red meat4.25.56.2 ***5.3
Processed meat3.24.94.3 ***5.2
Ratio dairy4.84.85.24.7
Ratio fish1.74.21.74.3
Ratio grains4.73.84.63.9
Vegetables6.23.86.24,0
Fruit4.15.14.9 **5,0
Nuts0.83.11.1 *3.7
Legumes0.73.30.93.7
Sugared beverages and fruit juices3.75.44.7 ***5.5
Tea3.55.26.0 ***5.4
Alcohol6.75.48.3 ***4.5
Ratio fat2.24.62.44.9
Sodium5.24.67.8 ***3.5
SD, standard deviation; DHD15, Dutch Healthy Diet index 2015. a reported values weighted for demographic properties, season, and combination of both consumption days. b 0 points indicates minimal adherence to dietary guidelines, 10 points indicates maximal adherence to dietary guidelines. Level of significant difference of men and women *** <0.0001, ** <0.01, * <0.05.
Table 4. Regression coefficients for adjusted Dutch healthy diet scores and individual components and greenhouse gas emissions and blue water use for 2078 men and women derived from the Dutch National Food Consumption Survey 2012–2016. a.
GHG EmissionBlue Water Use
Model 1 DHD15 a,bββ
DHD15 score−0.011 ***0.002 ***
Model 2 DHD15 Components a,b
Red meat−0.168 ***−0.001
Processed meat0.020 *0.001 *
Dairy0.023 **−0.001
Ratio fish0.020 *0.002 ***
Ratio grains−0.025 **−0.001 **
Vegetables0.090 ***0.005 ***
Fruit0.022 **0.004 ***
Nuts−0.0010.008 ***
Legumes−0.0150.001
Sugared beverages−0.000−0.003 ***
Tea−0.0030.004 ***
Alcohol−0.021 **−0.002 ***
Ratio fats−0.026 **0.001
Sodium0.0030.002 **
GHG, greenhouse gas; DHD15, Dutch Healthy Diet index 2015. a models were weighted for demographic properties, season, and combination of both consumption days. b models were adjusted for age (continuous), sex (male, female) and energy intake (kcal continuous). Level of significance *** <0.0001, ** <0.01, * <0.05.

