Article

Finding a Suitable Niche for Cultivating Cactus Pear (Opuntia ficus-indica) as an Integrated Crop in Resilient Dryland Agroecosystems of India

1
Geoinformatics Unit, International Center for Agricultural Research in the Dry Areas (ICARDA), 2 Port Said, Victoria Square Ismail El-Shaaer Building Maadi, Cairo 11140, Egypt
2
Department of Geography & Environment Management, Vidyasagar University, Midnapore 721102, India
3
Resilient Agricultural Livelihood Systems Program, ICARDA, Amman 11195, Jordan
4
ICARDA South Asia & China Regional Program Office Block-C, NASC Complex DPS Marg, Pusa, New Delhi 110012, India
*
Author to whom correspondence should be addressed.
Sustainability 2019, 11(21), 5897; https://doi.org/10.3390/su11215897
Submission received: 28 August 2019 / Revised: 26 September 2019 / Accepted: 27 September 2019 / Published: 23 October 2019
(This article belongs to the Special Issue Suitable Agronomic Techniques for Sustainable Agriculture)

Abstract

:
Climate change poses a significant threat to agroecosystems, especially in the dry areas, characterized by abrupt precipitation pattern and frequent drought events. Ideal crops, tolerant to these events, such as cactus, can perform well under such changing climatic conditions. This study spatially maps land suitability for cactus (Opuntia ficus-indica) cultivation in India using the analytical hierarchical process (AHP). Nine essential growth factors that include the climate and edaphic components were considered for the period 2000 to 2007. About 32% of the total geographic area of the country is in the high to moderate suitable category. Remaining 46% falls under the marginally suitable and 22% under the low to very low suitable category. The suitability analysis, based on the precipitation anomaly (2008–2017), suggests a high probability of cactus growth in the western and east-central part of India. The relationship with aridity index shows a decreasing rate of suitability with the increase of aridity in the western and east-central provinces (β~−1 to −2). We conclude that integrating cactus into dryland farming systems and rangelands under changing climate can be one plausible solution to build resilient agro-ecosystems that provide food and fodder while enhancing the availability of ecosystem services.

1. Introduction

Cactus pear (Opuntia ficus-indica) has been known for its food, fodder and medicinal values for the last 3000 years [1,2], as well as its low water requirements, high temperature tolerance and high growth rate [3,4]. These characteristics make it an ideal crop for cultivation in arid and semi-arid environments, where farming largely depends on the available rainfall [1,5]. However, rainfall fluctuations and uncertainty usually result in agricultural losses [6]. Thus, the selection of appropriate crops, which tolerate harsh conditions, becomes the utmost important issue, especially to smallholder farmers who rely on rainfed agriculture for livelihood sustenance [3]. Although the conventional irrigation-based agricultural system continues to serve as a major food bowl to the global human and livestock populations, questions remain regarding its sustainability under increasing food demand and changing climate [7]. Currently, at least 20% of global cropland, providing 40% of the total food supply, is under irrigation. The remaining 60% of food comes from dryland rain-fed farming systems [8,9]. Recent estimates show that the present global population is 7.3 billion and, by 2050, the projected population could be more than 9 billion, a 34% increase over today’s population [10,11]. This will increase the demand for food by up to 70% from current levels because of increase in per capita incomes by 2050 [10]. However, an increase in demand for agricultural food products can be partially met through an intensive focus on dryland farming [11]. The global experience of the advances in dryland farming indicates that under proper technical interventions, the efficiency of farm management and yields increases to a substantial level [12,13].
Of the 141 million ha of agricultural land in India, 80 million ha is under dryland farming systems, producing 40% of the food grain; it also supports at least 65% of the livestock population [14,15]. On this agricultural land, more than 80% of coarse cereals, oilseed and pulses, 40% of rice and 60% of cotton is produced under dryland agricultural systems [16]. Although notable yield gains have been achieved in some places in the last few years, this situation is not the same in other parts of the dryland areas in India [17]. The limited access to basic resources, especially for small to marginal landholders, has contributed to reducing the desirable gain from dryland farming. The uncertainty, in terms of rainfall availability, is further posing an additional restriction to dryland farming systems [17,18]. Given the high level of spatial and temporal variation in annual rainfall and with little or almost no facility for surface irrigation, dryland farming in India is moving towards unsustainability [19,20,21,22].
Thus, it is important to identify and test the suitability of different crop species that are adaptable to the different climatic and soil challenges in drylands, to improve the livelihoods of smallholder farmers. In this context, multipurpose fodder plants, such as cactus, which adapt to harsh environments and are a considerable source of energy with minimum inputs, have the potential to fill the feed gap and maintain livestock production and survival [23,24]. The high water-use efficiency and high temperature tolerance of cactus also make it suitable for dryland areas distributed mostly in arid, semi-arid and sub-humid climatic regions [25]. In this study, we analyse the spatial suitability of cactus, based on its appropriate growing requirements across India. Using geo-informatics, the mapping of crop suitability can be done under multi-criteria decision-making strategies [26,27]. Rainfall is one of the decisive factors determining yields in dryland agriculture farming systems [28,29]. This study also focuses on the spatio-temporal variability of land suitable for cactus cultivation based on the variations in the amounts of precipitation over time. We also discuss the interaction between the spatio-temporal variation of aridity and cactus suitability.

2. Materials and Methods

The growth factors chosen for mapping suitability are precipitation, minimum and maximum temperature, mean annual temperature and mean annual relative humidity, as climatic factors and soil salinity, soil texture, soil pH and soil organic matter as edaphic factors. All these input layers are raster layers taken from multiple sources having different pixel resolutions (Table 1). Since habitat suitability is based on the average conditions of the growth factors, the selected variables were averaged for the period 2000 to 2007, except for relative humidity which was averaged for the period 2003 to 2010. The time domain for the selected variables was chosen based on their availability. Table 1 present details concerning these variables and the time period over which the average was calculated.

2.1. Selection of the Major and Sub-Criteria of the Growth Factors

2.1.1. Precipitation

The amount of rainfall suitable for the growth of cactus ranges from 250 to 1000 mm/year, while the optimum rainfall range for its growth is 400 to 800 mm/year [4]. The growth of cactus is reduced when the rainfall amount ranges between 250 and 400 mm/year and it becomes unsuitable at rainfall amounts of less than 250 mm/year and more than 1000 mm/year [30]. In arid and semi-arid zones, the optimum rainfall amount for its growth is 400–600 mm/year [31]. Under sub-humid to humid Mediterranean climatic conditions, where annual rainfall is greater than 600 to 800 mm/year, cactus can grow in well-drained areas, especially on steep slopes [32,33,34,35]. Although the rainfall amount determines the growth pattern of cactus, this is often moderated by the soil texture. As reported by Inglese et al., 2009 [30], for a deep sandy soil, the absolute minimum amount of rainfall required for cactus growth is 200 mm/year, while in silty and loamy soils, the crucial rainfall amount is 300–400 mm/year. To map soil suitability, we used monthly precipitation data from the Tropical Rainfall Measuring Mission (TRMM) monthly data (3B43 V7) for 2000–2007. Additionally, the monthly precipitation data of TRMM from 2008–2017 was further used to estimate the spatio-temporal variation of cactus suitability based only on precipitation variation. The inter-annual rainfall variability was analysed based on a precipitation anomaly, computed from the long-term monthly average precipitation for 2000–2017. The standardized precipitation index (SPI) [36] was used to compute inter-annual precipitation anomaly. SPI was computed as given in Equation (1).
S P I = ( x i μ x ) σ x
μx is the long-term (2000-17) mean of precipitation, σx is the standard deviation of the time series precipitation (2000-17) and xi is the annual average precipitation.
The non-parametric Mann-Kendall (MK) trend test was also used to estimate the spatial pattern of the precipitation trend over the Indian sub-continent [37,38]. The MK trend statistic (Tmk) is given in Equations (2)–(5).
T m k = i = 1 n 1 j = i + 1 n s g n ( x j x i ) s g n ( x j x i ) = { < 0     i f   x j   l e s s   t h a n   x i 0     i f   x j =   x i > 0     i f   x j     g r e a t e r   t h a n   x i
where, xj is an observation at time t1 and xi is another observation at time t1 + 1 in a time series data. Tmk > 0 indicates an increasing trend, while Tmk < 0 indicates a negative trend of the time series.
V a r ( T m k ) = n ( n 1 ) ( 2 n + 5 ) p = 1 q t p ( t p 1 ) ( 2 t p + 5 ) 18
Var(Tmk) is the variance of trend statistics; tp is number of ties and q is the number of tie groups. The ties are defined if there are any duplicate observations in the time series and tie group is defined as how many continuous observations for such duplicate values occur in the time series. Under absence of any tie values the variance of Tmk is computed using Equation (4).
V a r ( T m k ) =   n ( n 1 ) ( 2 n + 5 ) 18
Z M K = { T m k 1 V a r ( T m k )   i f   T m k   g r e a t e r   t h a n   0 ,    0   i f   T m k = 0 , T m k + 1 V a r ( T m k )   i f   T m k   l e s s   t h a n   0 .
ZMK is standardized transformation of the S statistic that shows the statistical significance of the estimated trend.
The Moderate Resolution Imaging Spectroradiometer (MODIS) derived potential evapotranspiration (PET) and TRMM precipitation data were used to compute an aridity index (AI) for the period 2001 to 2014. Along with the precipitation anomaly, AI was further used to illustrate the space-time variation of suitability with changing aridity. We used the Google Earth Engine to compute the AI for the period 2001 to 2014 based on the available PET data from MODIS (MOD16A2). AI is computed as the ratio of PET to precipitation as proposed by UNEP, 1992 [39] (Equation (6)).
A I =   P P E T
P in the numerator is the annual average precipitation and the denominator is annual average PET. The computed AI was further standardized using range equalization method.

2.1.2. Temperature

The suitable mean annual temperature for the growth of cactus is 15–18 °C and the optimal mean temperature for its growth is 18–23 °C [31]. At an annual mean temperature less than 15 °C, cactus growth is negatively affected and conditions become unsuitable at annual means less than 10 °C [30]. In conjunction with that, an annual mean minimum temperature less than −5 °C is considered as not suitable for cactus growth. However, minimum temperatures greater than 5 °C are considered conducive for cactus growth and cactus occasionally tolerates temperatures greater than 50 °C in summer months. However, in January, the coldest month in winter, mean daily minimum temperatures less than 1.5 °C and mean daily maximum temperatures greater than 12 °C are not suitable for cactus growth [40,41]. Although cactus occasionally tolerates an absolute minimum temperature between −10 and −8 °C for a few hours when the diurnal temperature is positive, the growth stops and the cells are dead at an absolute minimum temperature between −10 and −14 °C [40,41]. Hence, the killing frost temperature at which the cactus cannot survive is between −14 and −8 °C. The mean temperature data was taken from the Asian Precipitation—Highly Resolved Observational Data Integration Towards the Evaluation (APHRODITE) for the period 2000 to 2007 [42]. The maximum and minimum temperature data were taken from Climate Research Unit (CRU) [43]. Based on the tolerance level of the maximum temperature extreme, an average value within the range of 5 to 41 °C is taken as the optimum decisive temperature condition for cactus growth. We used the average monthly temperature of May (summer month) as the temperature exceeds 50 °C in this month. The average values of both the maximum and minimum temperatures were computed for the period 2000–2007.

2.1.3. Annual Relative Humidity

Annual relative humidity plays a significant role in cactus growth, with a mean annual relative humidity of less than 40% having a negative effect on cactus growth. However, for its optimal growth, the relative humidity should be greater than 60% [41,44,45,46]. The surface relative humidity data was taken from derived observations of the Advanced Infrared Sounder (AIRS) sensor for the period 2003–2010. As the growth of cactus includes a range of precipitation and temperature conditions, annual relative humidity appears to be an important criterion in this context.

2.1.4. Soil Salinity

A suitable soil salinity (in terms of electrical conductivity [EC]) for cactus growth is between 2 and 4 dS/m. As the salinity increases from. 4 to 7 dS/m, the growing conditions become less conducive and at a salinity of greater than 7 dS/m the growth is severely affected [30].

2.1.5. Soil Texture

The textural conditions of the soil that favour cactus growth are sandy to mixed soils. Clay-silty soils are comparatively less suitable for the development of the cactus. However, clay or silt soils as separate textural soil classes are not favourable for cactus growth [30].

2.1.6. Soil pH

An appropriate soil pH for the growth of cactus is between 5 and 8. However, at a pH less than 5 and greater than 8, the conditions are unfavourable for the growth of cactus [30].

2.1.7. Soil Organic Matter

The presence of organic matter (the proportion of organic carbon [OC]) in the soil is an indispensable precondition for the growth of vegetation [47]. Moreover, the absence of organic matter in the soil has the potential to slow down the growth of cactus. For cactus growth, the optimal amount of soil organic matter is 1–2%. However, 0.5–1% organic matter in the soil can also be suitable for cactus growth. All the soil parameters were taken from the harmonized world soil database provided by Food and Agricultural Organization of the United Nations (FAO).
All of the selected variables including their chosen sub-criteria for the growth of the cactus pear were listed in the Supplement Table S1.

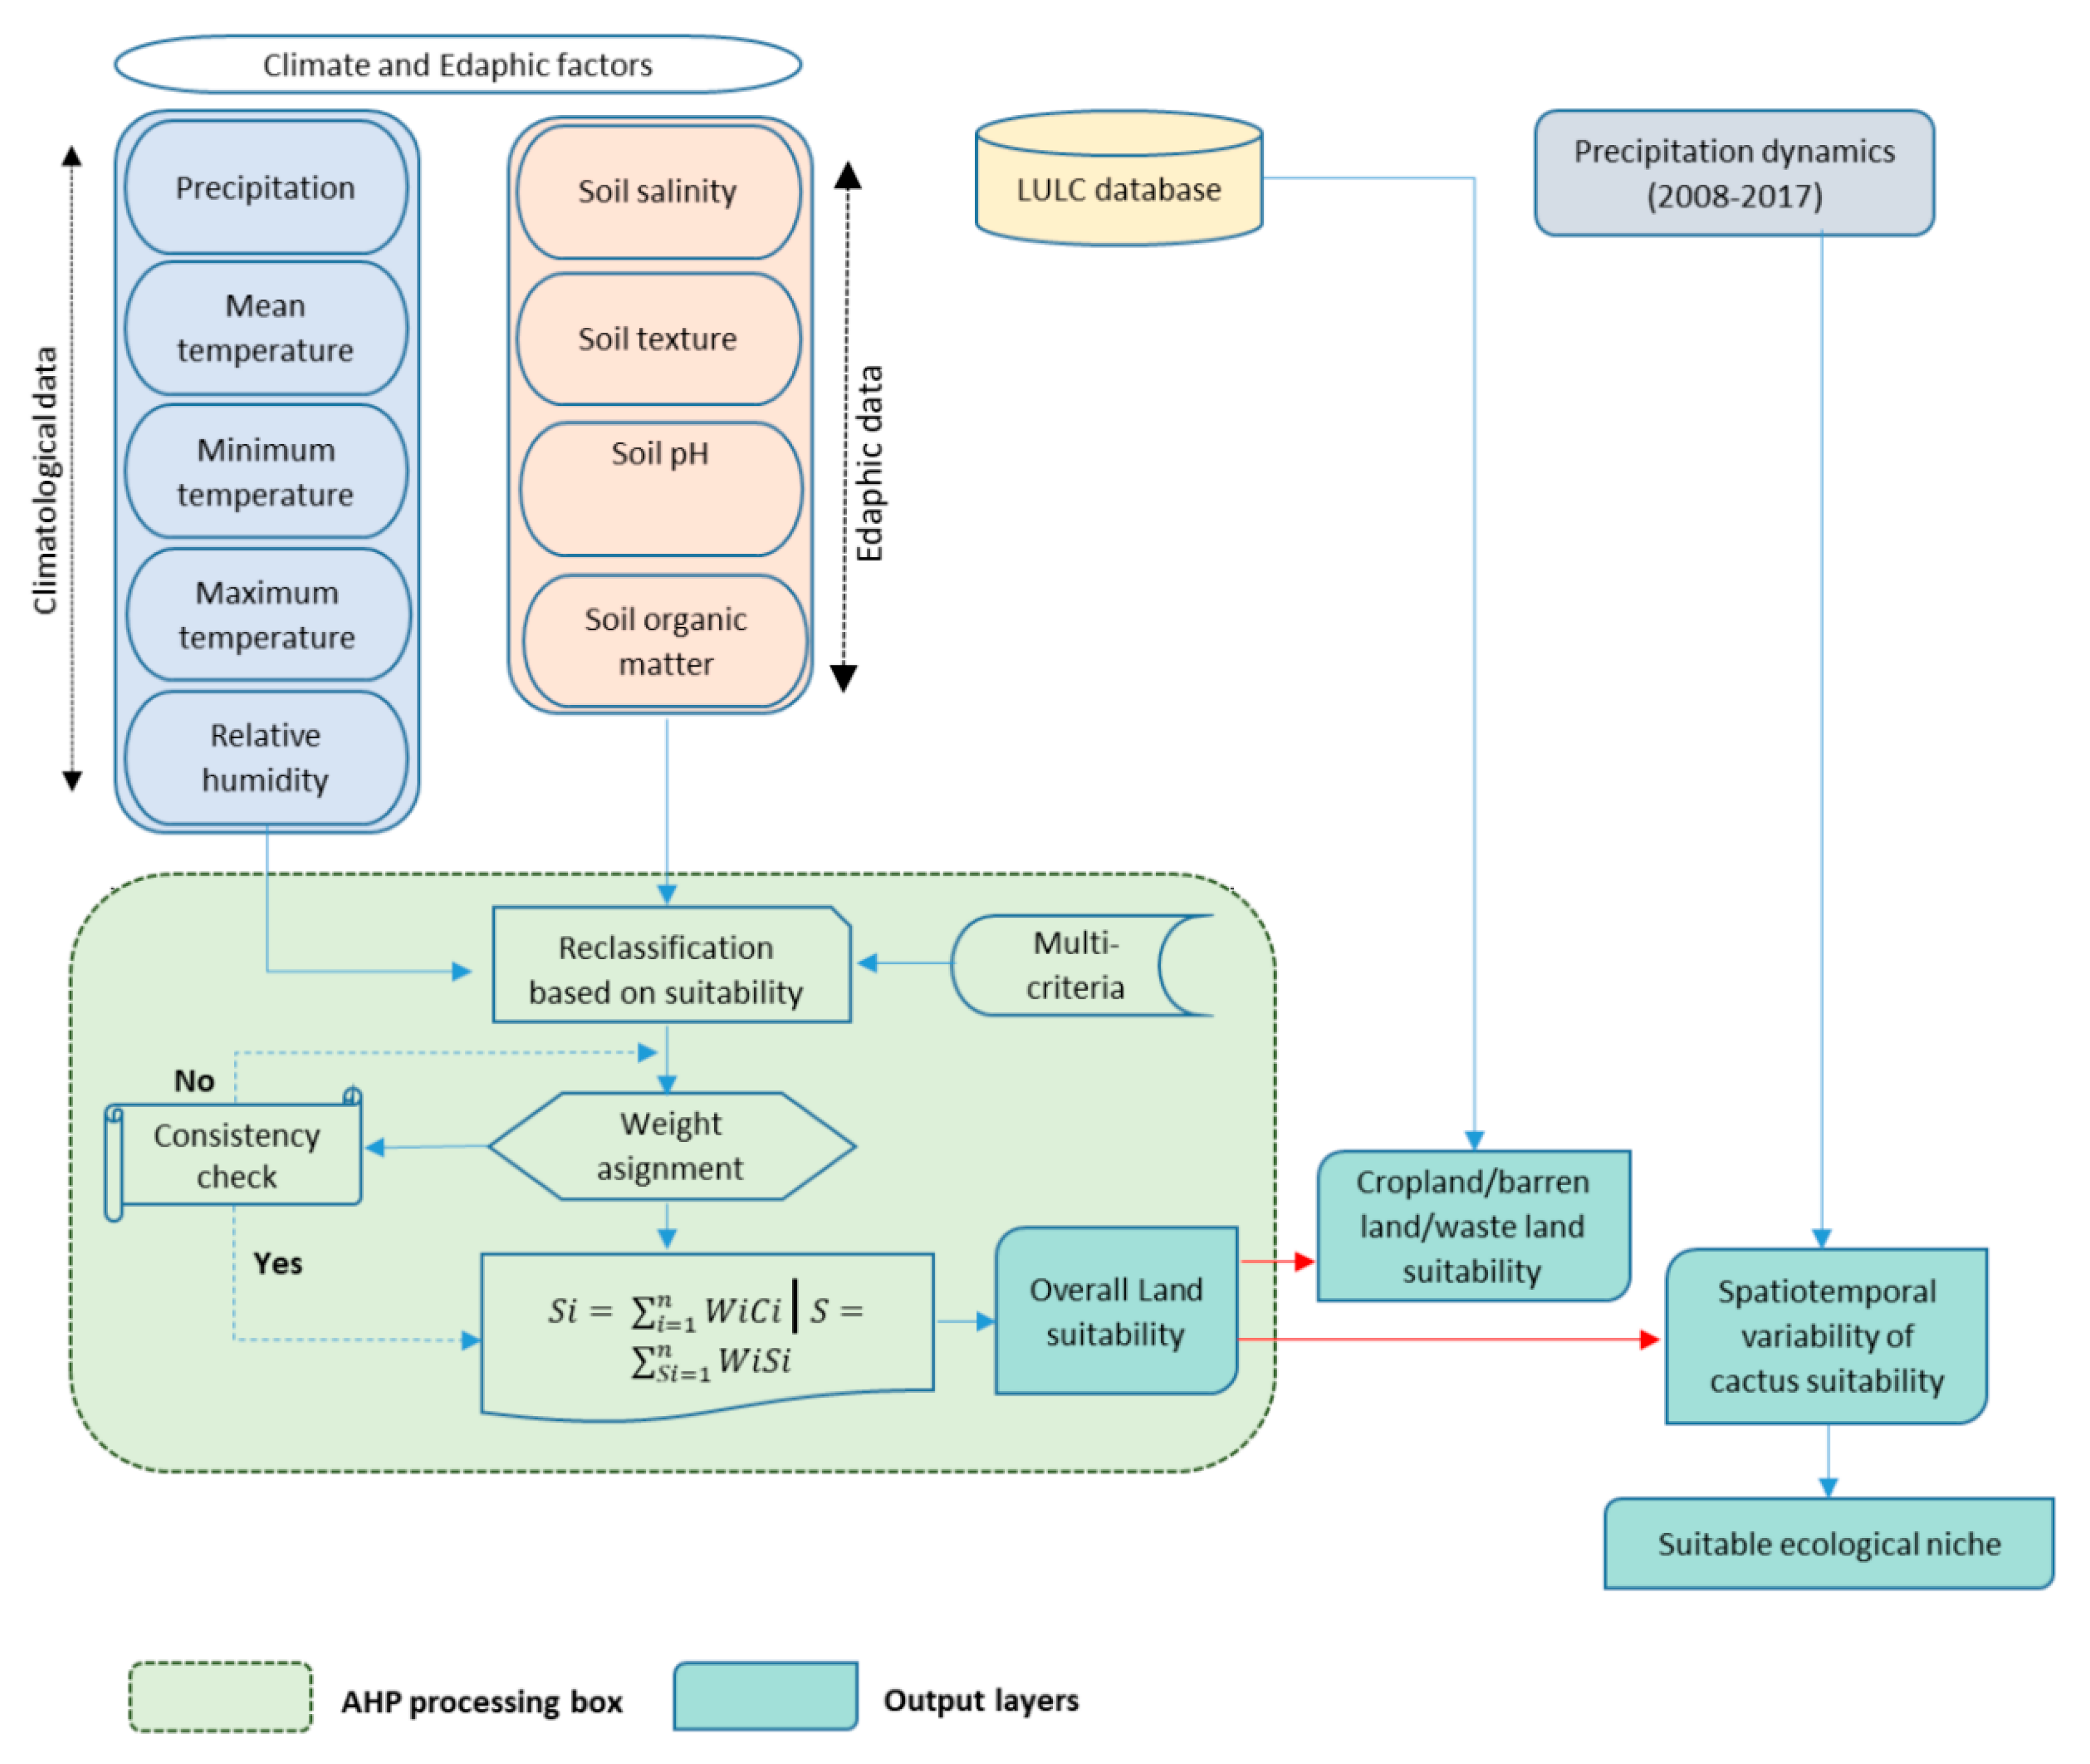
2.2. Analytical Hierarchical Process (AHP)

The analytical hierarchical process (AHP) is an efficient mathematical method that applies to highly complex decision-making processes which incorporate multiple driver variables [48,49,50]. The fundamental principle of AHP is based on the pair-wise comparison of the selected variables depending on the chosen criteria that have been stated above [49,50]. The variables that are involved in this decision-making process are related to each other in a hierarchical order. The AHP uses a 9-point scale of measurement (1 = equal importance, 3 = weak importance of one over another, 5 = strong or essential importance, 7 = established or demonstrated importance, 9 = absolute importance and 2, 4, 6, an 8 are intermediate values) to express individual preferences or judgments. The variables were arranged in n × n square matrix before proceeding to pairwise comparison.
The relative weights—the priority vectors—of each component are computed by taking the average of the normalized values. The normalized values of the weight matrix are the ratios of the individual values in the column of the square matrix to the column sum. Once computed, these normalized values are then summed up row-wise and divided by the number of observations to get a matrix of n × 1 normalized average. This is a close approximation of the Eigenvectors computed through singular value decomposition. To check the consistency of these normalized weights, Saaty [50] proposed an index—the consistency index (CI)—which is a function of the largest Eigenvalue (λmax) (Equation (7)).
C I = ( λ m a x n ) n 1
where, n is the number of comparisons.
Since the judgment in terms of CI is subjective, it needs to be checked with an appropriate consistency ratio (CR). Saaty [49] proposed a random consistency index (RI) to compute this CR. CR is the ratio of CI to RI. A CR less than or equal to 0.1 indicates that a pair-wise comparison matrix has achieved considerable consistency. A CR greater than 0.1 indicates the pair-wise comparison did not achieve the required consistency and the subjective judgment values of the pair-wise comparison need to be updated before proceeding to the next step. The updating of the values in the n × n square matrix involves changing of the integer values and their reciprocals in upper and lower panel of the principle diagonal axis of the matrix as per Saaty’s scale, keeping the hierarchy of the relationship under consideration. This whole process was repeated for the selected sub-criteria of the variables to get the local weights.
Once the required consistency is achieved, each alternative (variable) is multiplied with the weight of the sub-criterion to get the local ratings (Equation (8)). Each local rating is multiplied by the weight of the main criterion and these values are aggregated to get the global rating (Equation (9)) [48,51,52].
S i = w i C i
wi is the weight of the sub-criterion and Ci is the value of the sub-criterion which was obtained from classifying the raster data as per selected range of the sub-criteria. Si is the suitability rating at the local level.
S = i = 1 n W i S i
Si is the suitability rating at the local level, Wi is the weight of the main criteria, n is number of criteria and S is the final suitability rating at the global level (Figure 1).
Table 2 shows the role and relative importance of the variables including their sub-criteria in favouring cactus growth. Soil texture appears as the most important criterion (30%) and it is one of the important features of arid to semi-arid landscapes where proliferation of cactus is generally observed [4]. As cactus tolerates high temperatures and grows in a wide range of diurnal temperatures [53], the minimum and mean temperatures are the second (18%) and third (13%) most important criteria for its growth. Precipitation is the fourth most important criterion (11%) as it determines the soil moisture level, whose optimal availability partially depends on the soil type. This is followed by the maximum temperature as the fifth most important criterion (10%). Since cactus growth also depends on the OC and saline conditions of the soil [47], soil salinity and OC are the sixth (6%) and seventh (5%) important criteria, respectively. Soil pH, which measures the acidic conditions of the soil, also appears with the same weight (5%) as that of OC. The annual relative humidity, which has a 2% influence, appears as the ninth most important factor for cactus growth.
Before applying the AHP model for generating decision support layer of spatial land suitability, the input raster layers were re-sampled to the pixel dimension (0.0083 deg equivalent to 861 × 923 m) of the FAO soil database and the raster cell values were classified as per selected range of sub-criteria. The weights were taken from n × 1 score matrix for the sub-criteria and multiplied them with the classified value of the corresponding raster layers to get the local rating of suitability. These local ratings were further multiplied with the weights of main criteria and summed up to get the final value of the land suitability for the growth of cactus pear. The computed suitability was further rescaled between 0 and 1 following the range equalization method and a classification scheme was developed such as; highly suitable (0.8–1.0), moderately suitable (0.6–0.8), marginally suitable (0.4–0.6), low suitable (0.2–0.4) and very low suitable (0.0–0.2).

2.2.1. Global Cropland Data

Global cropland data (https://croplands.org/app/map?lat=0&lng=0&zoom=2) was used to estimate the spatial variation of cactus-suitable areas under the category of net sown area. We used the 30 m pixel size southeast and northeast Asia cropland extent (GFSAD30SEACE). The cropland data were prepared from time series images of the Thematic Mapper onboard Landsat satellite and MODIS onboard Terra satellite. The focus of the global cropland mapping was to estimate the cropland extent and cropping type with major crops, such as wheat, rice, corn, barley, soya bean, pulses, potato and cotton. The details of the global cropland cover mapping are beyond the scope of this paper and can be found elsewhere [54,55].

2.2.2. Barren Land and Wasteland Data

The decadal land use land cover (LULC) data (http://dx.doi.org/10.3334/ORNLDAAC/1336) prepared by Roy et al. [56] were used to extract the barren land and wasteland data in this study. Barren land is defined as exposed soil, rock, sand and snow surfaces with less than 10% vegetation cover at any time in the year. A wasteland is characterized by sparse vegetation cover sometimes with less than 10% degraded forest cover with signs of erosion caused either naturally or by inappropriate management of soil and water. The dataset is available for 1985, 1995 and 2005 with a pixel resolution of 100 m. The decadal LULC was prepared based on Landsat 4, 5 and Enhanced Thematic Mapper Plus images combining the techniques of ground truth survey and visual image interpretation. The LULC classes were prepared following the classification scheme of the International Geosphere Biosphere Program (IGBP).

3. Results

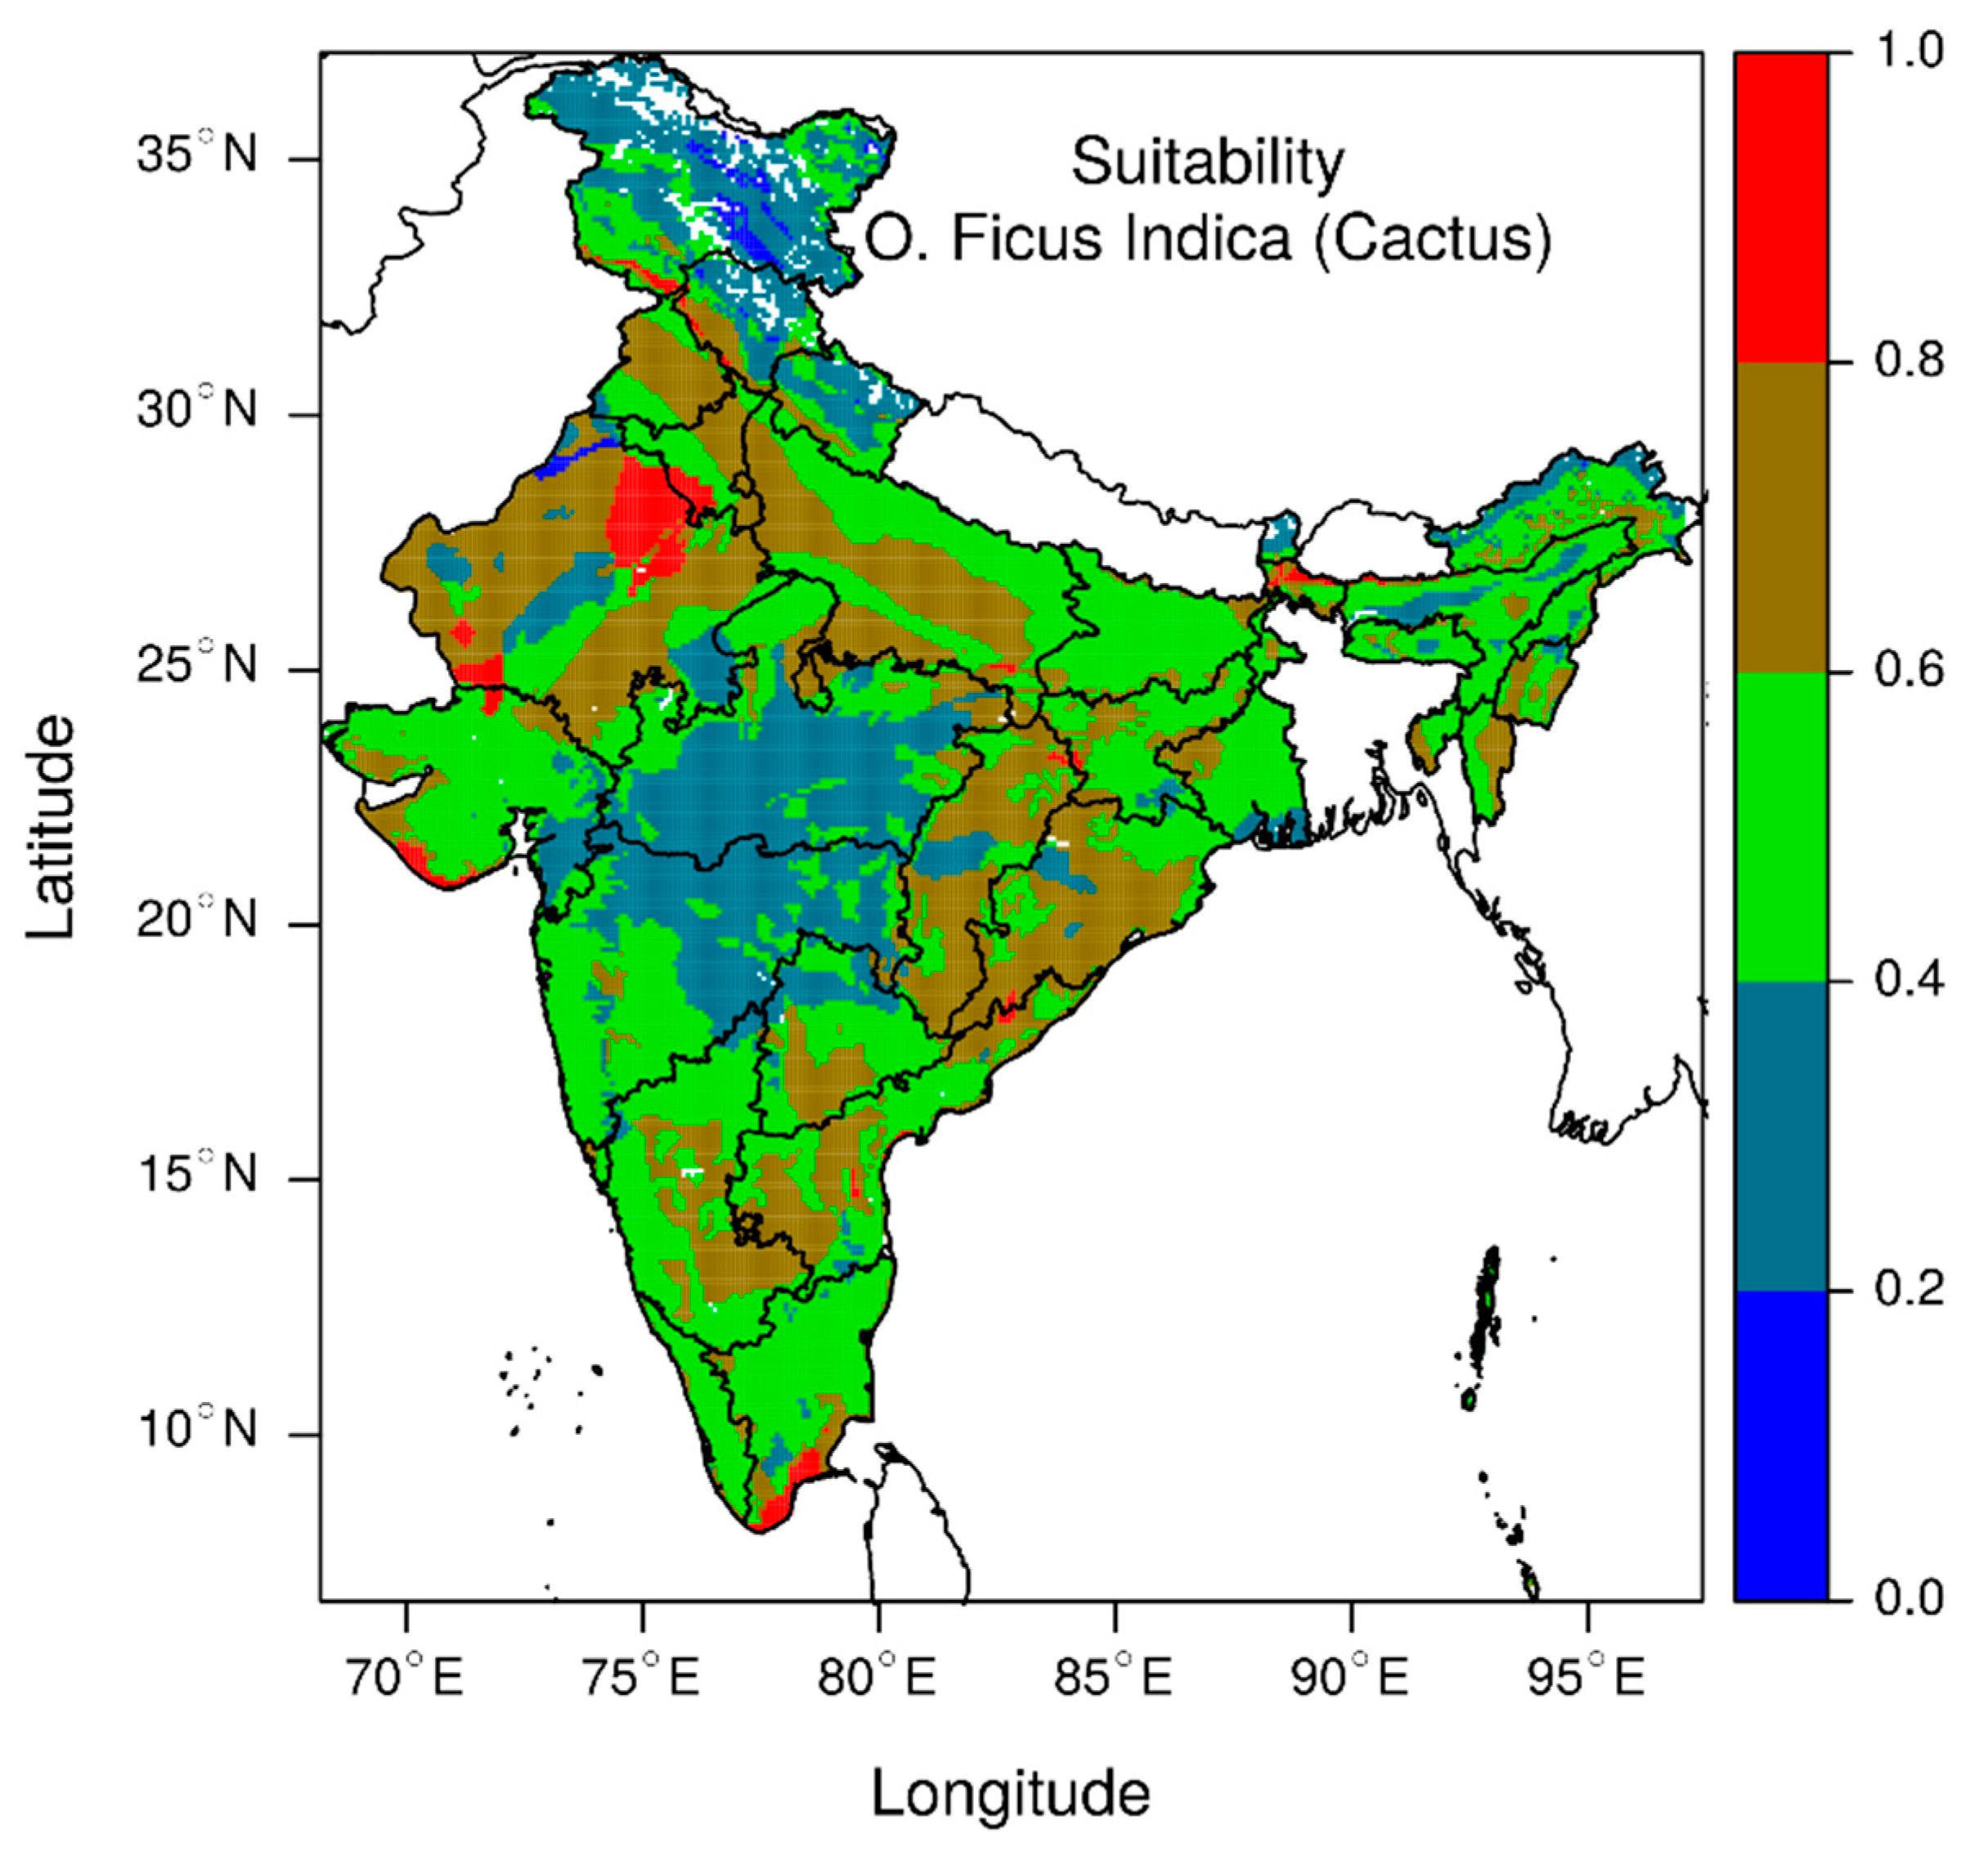
3.1. The Distribution of Cactus-Suitable Areas Across India

The spatial distribution of climatic and edaphic factors for cactus growth are given in Supplement Figure S1. The average climatic state shows drier conditions prevailing in the western and west-central parts of India, which favour cactus growth. The spatial distribution shows that approximately 3% of the total geographical area (TGA) in India falls into the highly (0.8–1.0) suitable class, 29% into moderately (0.6–0.8) suitable category, 46% area is in marginally suitable (0.4–0.6), 21% is in low suitable (0.2–0.4) and 1% can be categorized under very low suitable category (0–0.2). The spatial distribution shows that the high to moderately suitable classes are mostly concentrated in Rajasthan, Chhattisgarh, a larger part in Odisha, southern Telengana and central and western part of Andhra Pradesh and some areas in south-eastern Karnataka (Figure 2).
It was also observed that an extensive plain area in western and central Indo-Gangetic plain (IGP) spreading over Punjab, Haryana and Uttar Pradesh (UP) states are in moderately suitable category. Moreover, the discrete patches of high to moderate suitability classes are also observed in south of coastal Gujarat, the coastal part of southern Tamil Nadu, the southwestern part of West Bengal, the foothill areas of northern mountain in the north-west region including Jammu & Kashmir, Himachal Pradesh, Uttarakhand and in the foothill areas West Bengal in the eastern India. Such patterns are also seen in Tripura, Mizoram, Manipur and in Arunachal Pradesh where the combination of soil texture and precipitation allows land to be fall in moderately suitable category. A significant amount of the area in southern India, a vast area of entire Indo-Gangetic Plains and in northeast India falls into the marginally suitable (0.4–0.6) category (Figure 2). In contrast, most of the areas in central India, covering Madhya Pradesh (MP) and eastern Maharashtra and the northern mountains falls into the low suitable category (0.2–0.4). Very low suitable category (0–0.2) dominates the areas of the entire Himalayan mountain belt in northern India (Figure 2). Table 3 shows an account of state wise areal distribution of various land suitability categories.

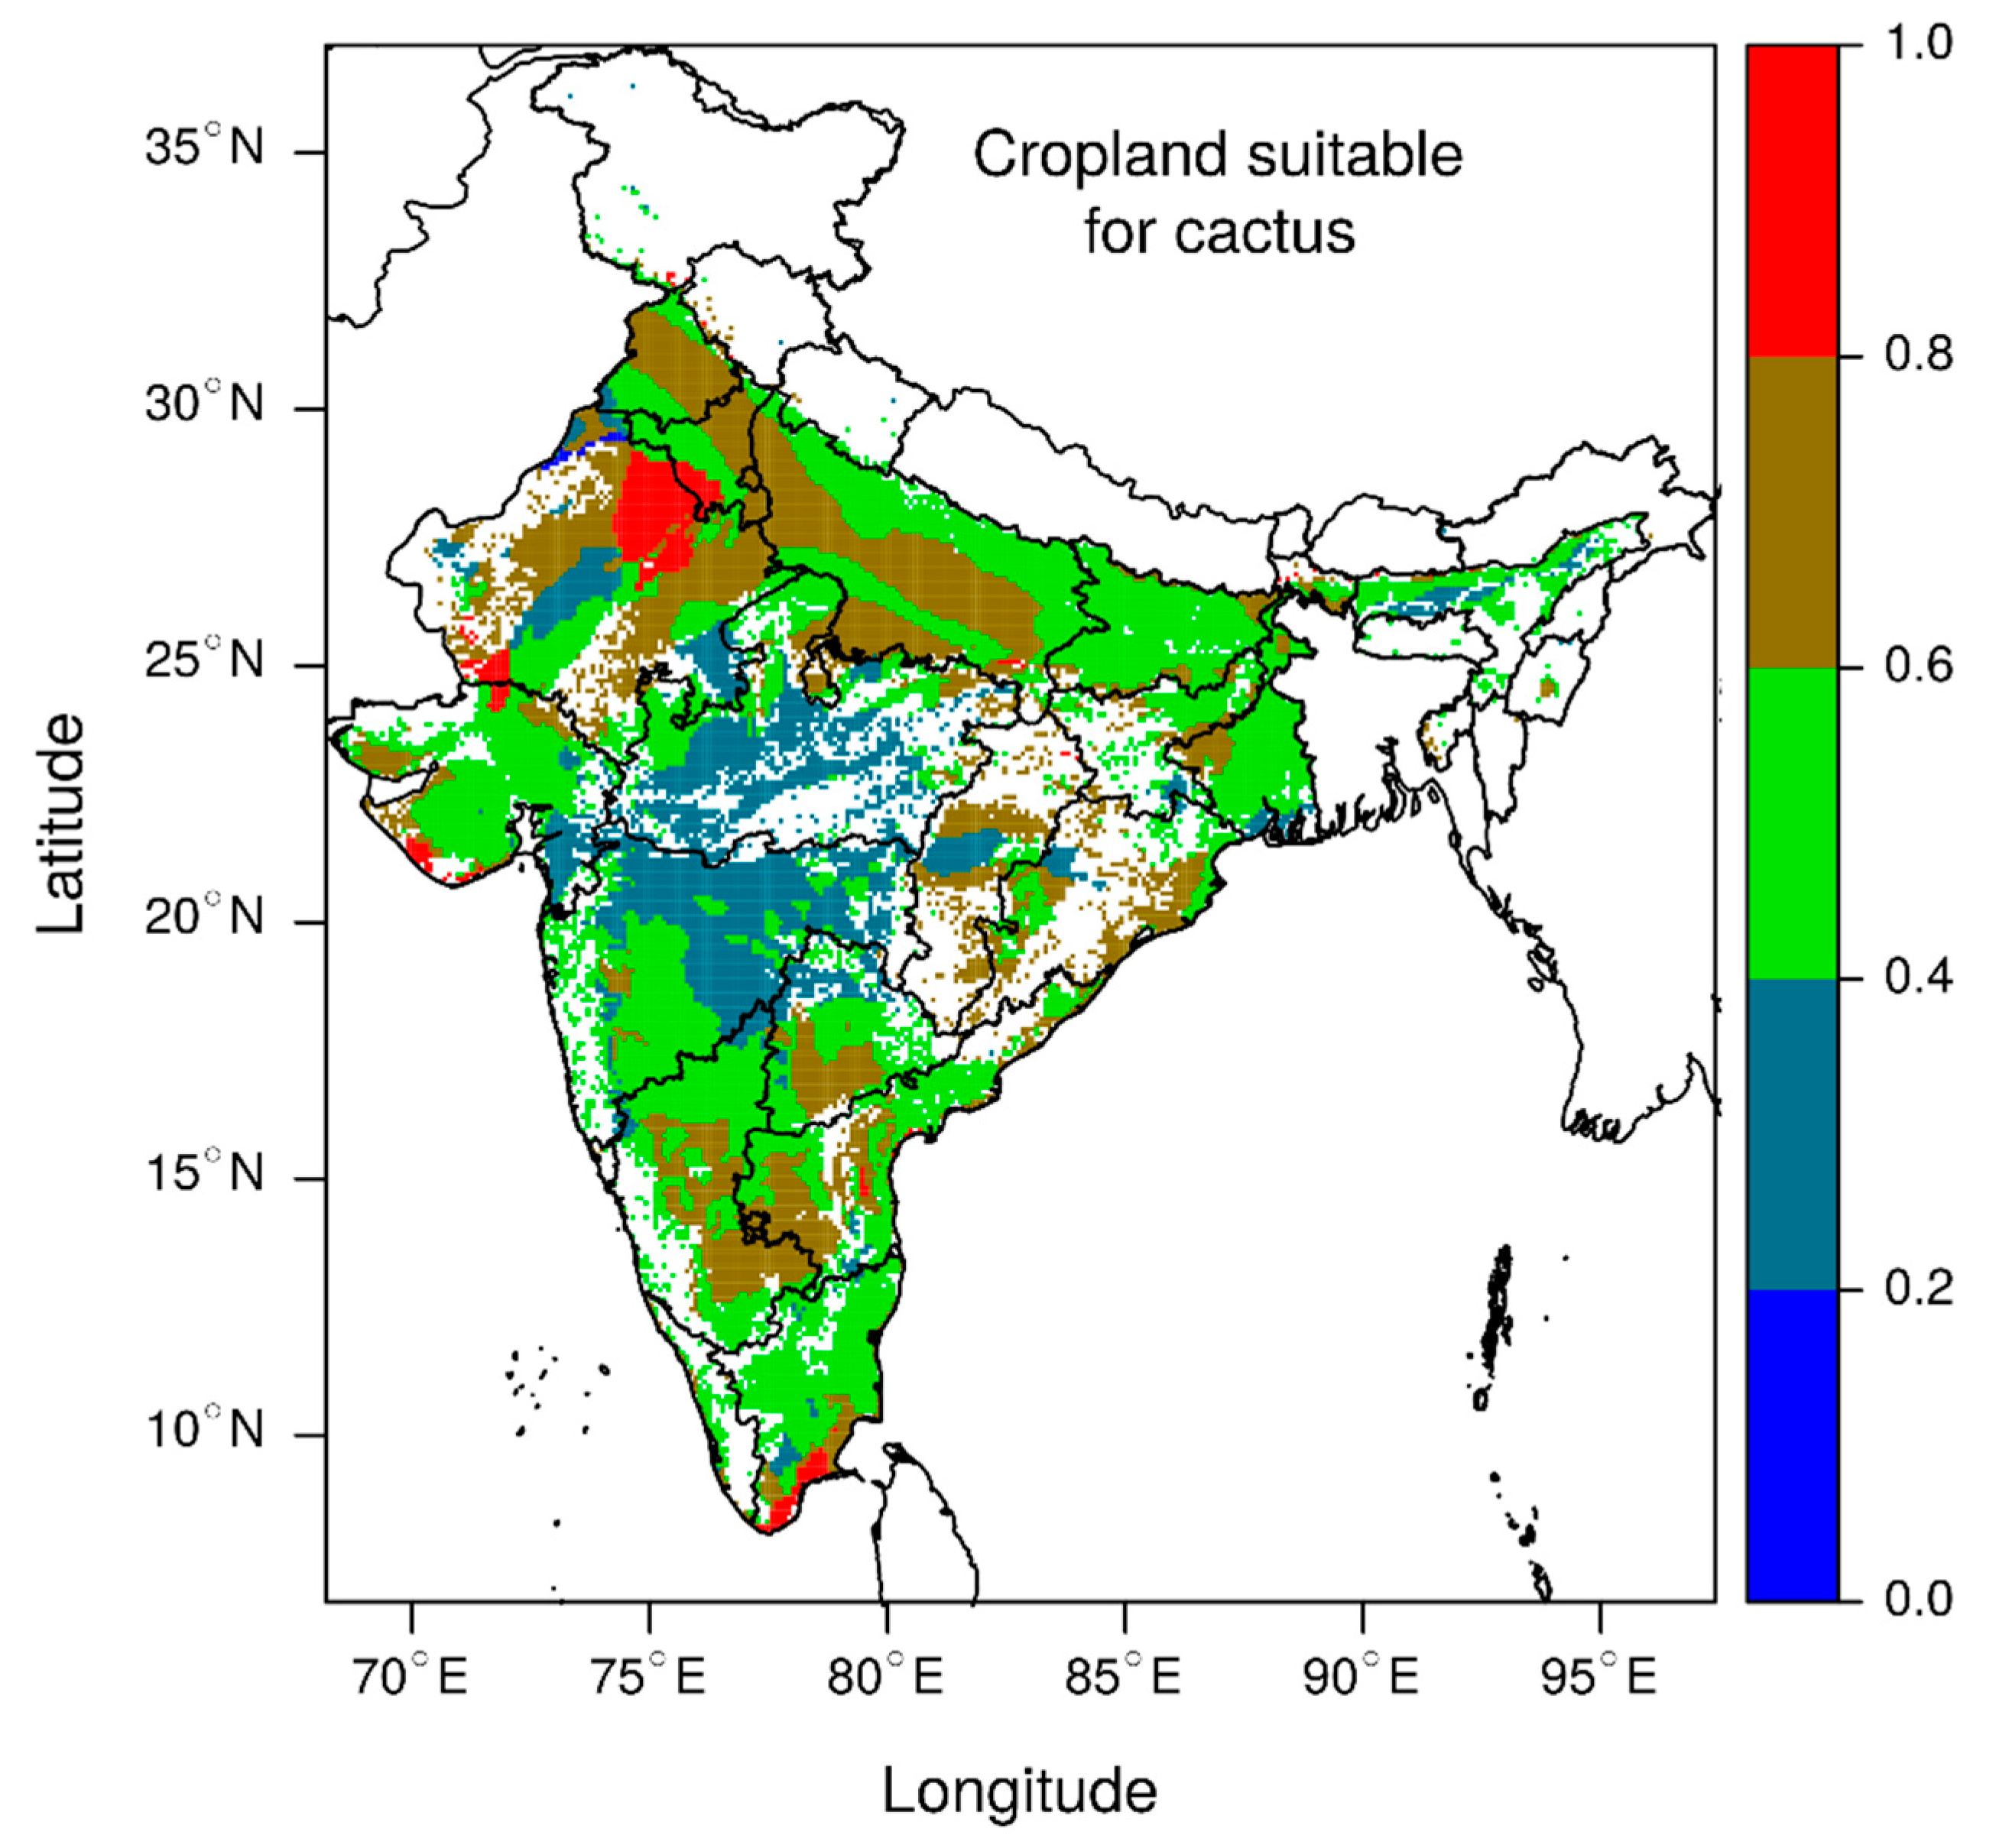
3.2. Suitability of Cropland Areas for Cactus Cultivation

Figure 3 shows the suitability of cropland in India for cactus cultivation. About 3% of the net sown area (NSA) is highly suitable, 30.4% is moderately suitable, about 48% is marginally suitable and about 18% land is low to very low suited for growing cactus. The spatial distribution shows a notable amount of agricultural lands in Rajasthan, Chhattisgarh and Odisha, (greater than 157,000. km2 in Rajasthan, 36,441 km2 in Chhattisgarh and 44,630 km2 in Odisha) are classed as highly suitable to moderately suitable for cactus growth. A significant amount of cropland in Andhra Pradesh, Telengana (formerly in Andhra Pradesh) and Karnataka is also seen under moderate suitable class.

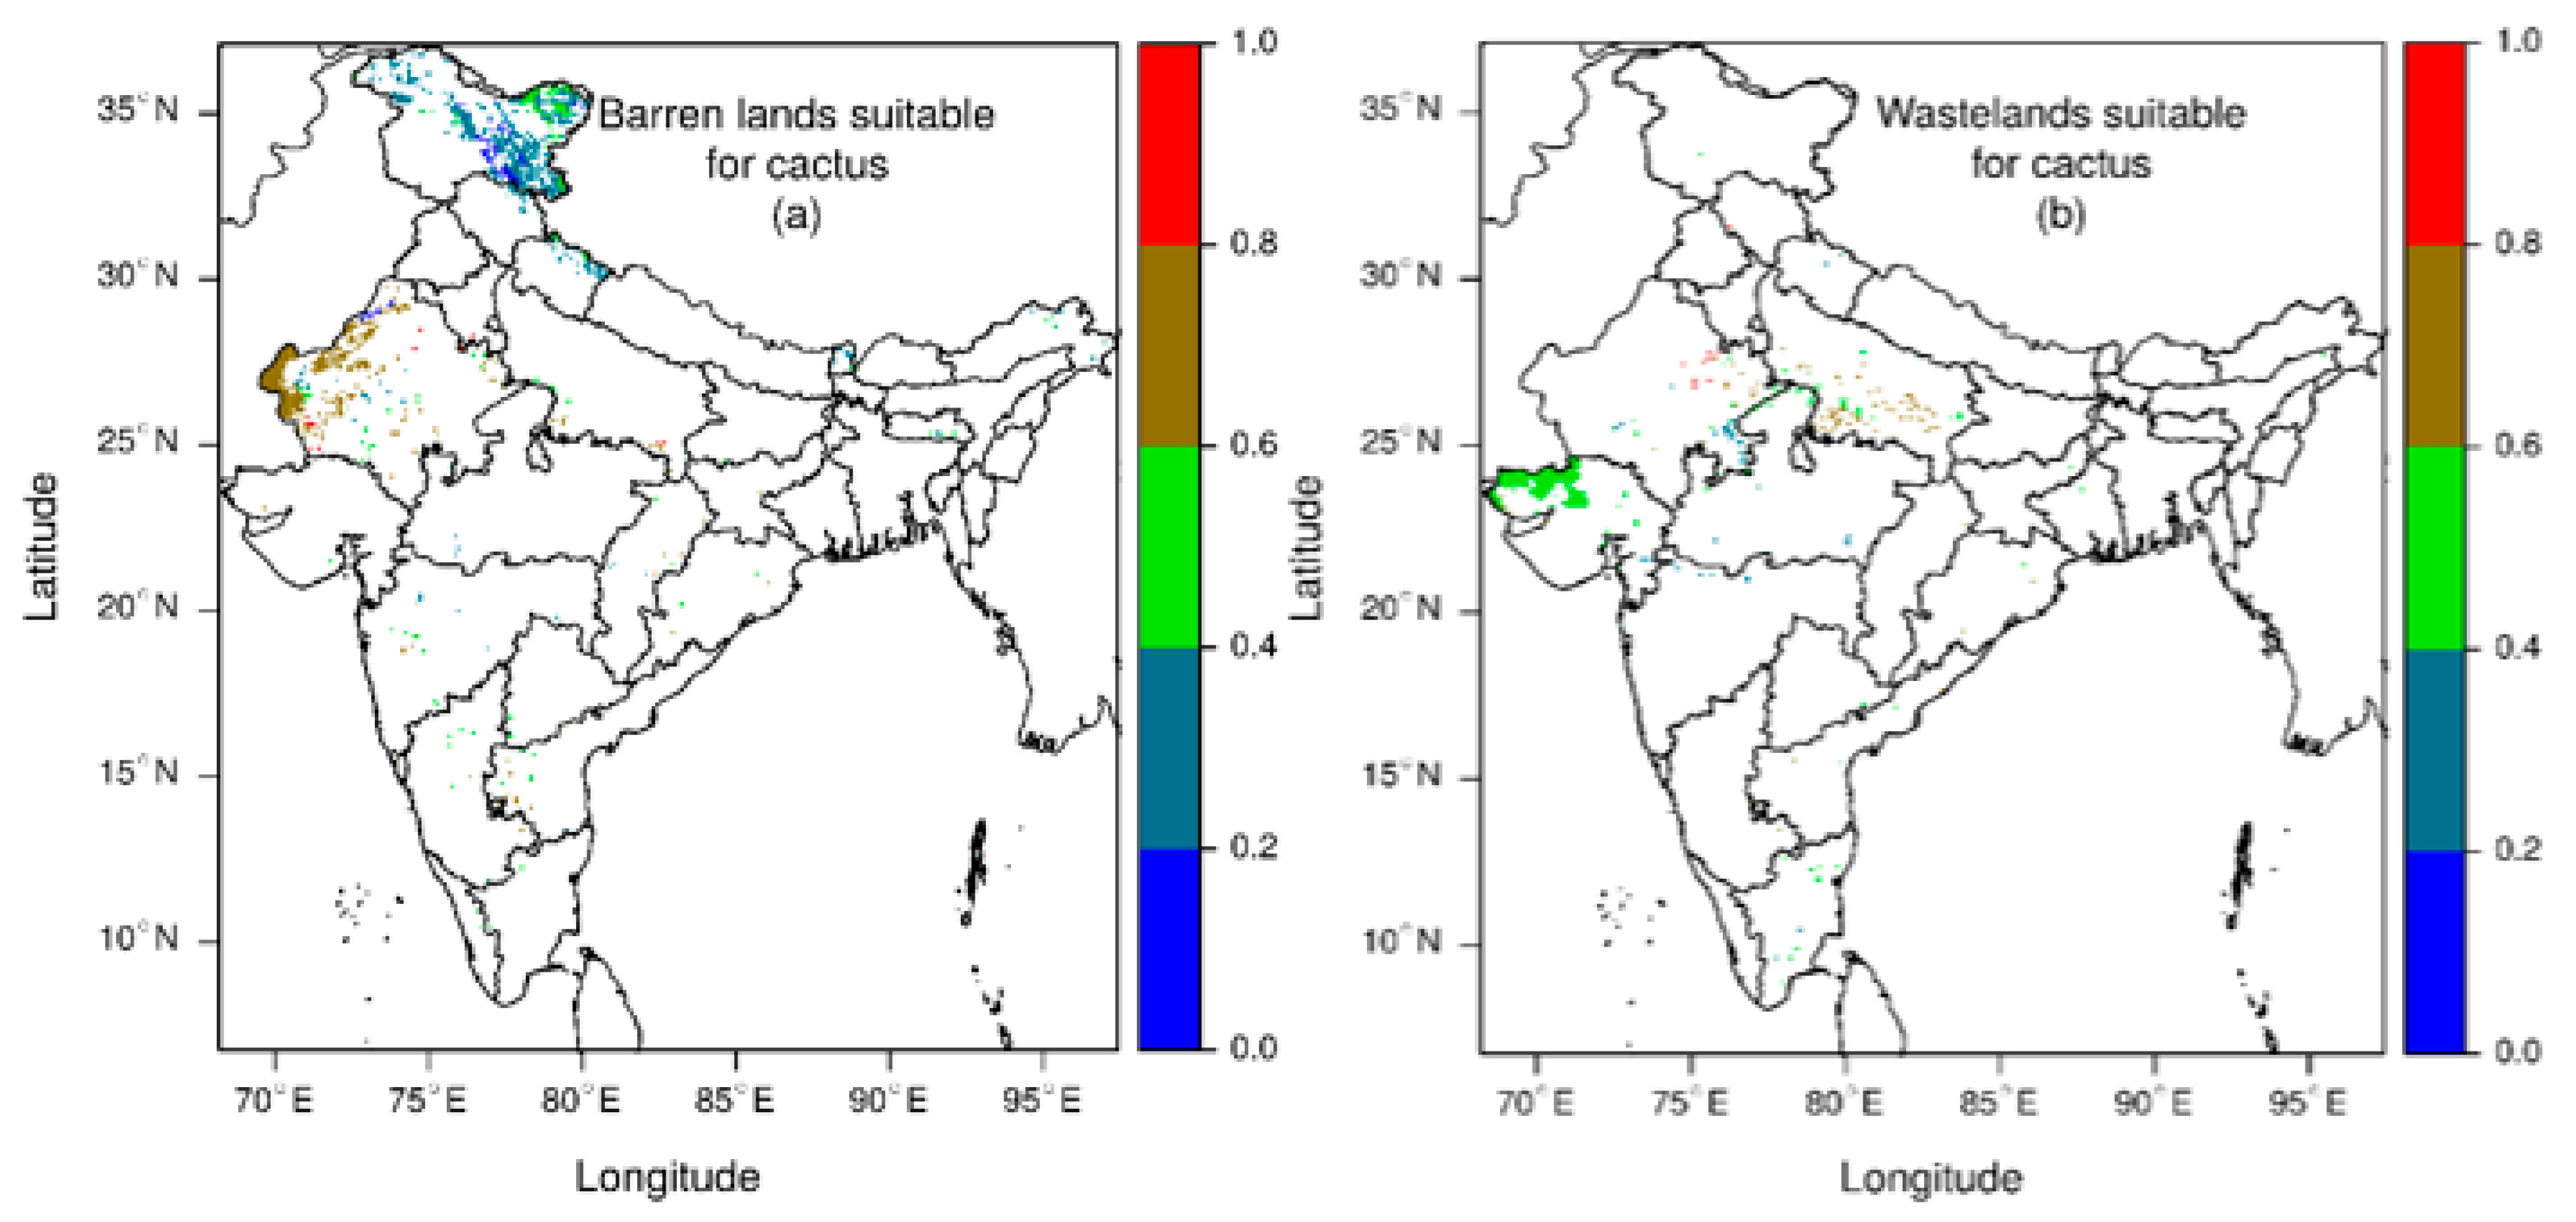
3.3. Distribution in Barren and Waste Lands

About 1.3% of barren lands are in high suitability class and 35% in moderately suitable class, whereas 15% is in marginally suitable class. The spatial distribution of areas suitable for growing cactus in the barren regions and wastelands shows a high level of spatial clustering. In barren lands, the distribution shows that areas in western Rajasthan are eminently suitable; the estimation shows more than 40,000 km2 of such land are high to moderately suitable for growing cactus. Moreover, a few clusters of marginally suitable lands are observed in south India—in Maharashtra (1348 km2), Andhra Pradesh (495 km2) and Karnataka (878 km2) and in the province of southern UP (1174 km2) and northern Madhya Pradesh (MP) (102 km2) (Figure 4a). Low to very low land suitability was observed for the rest of the barren lands distributed in the Himalayan region.
About 2.8% and 21% of wastelands are in high and moderate suitable class, respectively. The wastelands with marginal suitability occupy 66.7% areas. The spatial distribution of wastelands shows an abundance of marginally suitable lands in northern Gujarat. The estimation shows around 23,396 km2 of wasteland are marginally suitable for cactus cultivation in Gujarat. However, about 100 and 785 km2 lands are in high to moderately suitable class scattered in discrete parcels in north and south Gujarat. The discrete parcels of land can also be seen in the marginally and moderate to high suitable categories in Rajasthan (2158 km2 for marginal suitability and 2632 km2 for moderate to high suitability). In southern UP there are 2000 km2 areas classed as marginally suitable and around 5196 km2 lands are classed as moderate to high suitable. In Tamil Nadu, the areas of 529 km2 classed as marginally suitable and 289 km2 rated as moderate to high suitable (Figure 4b).

3.4. Suitability Based on Temporal Precipitation Variability

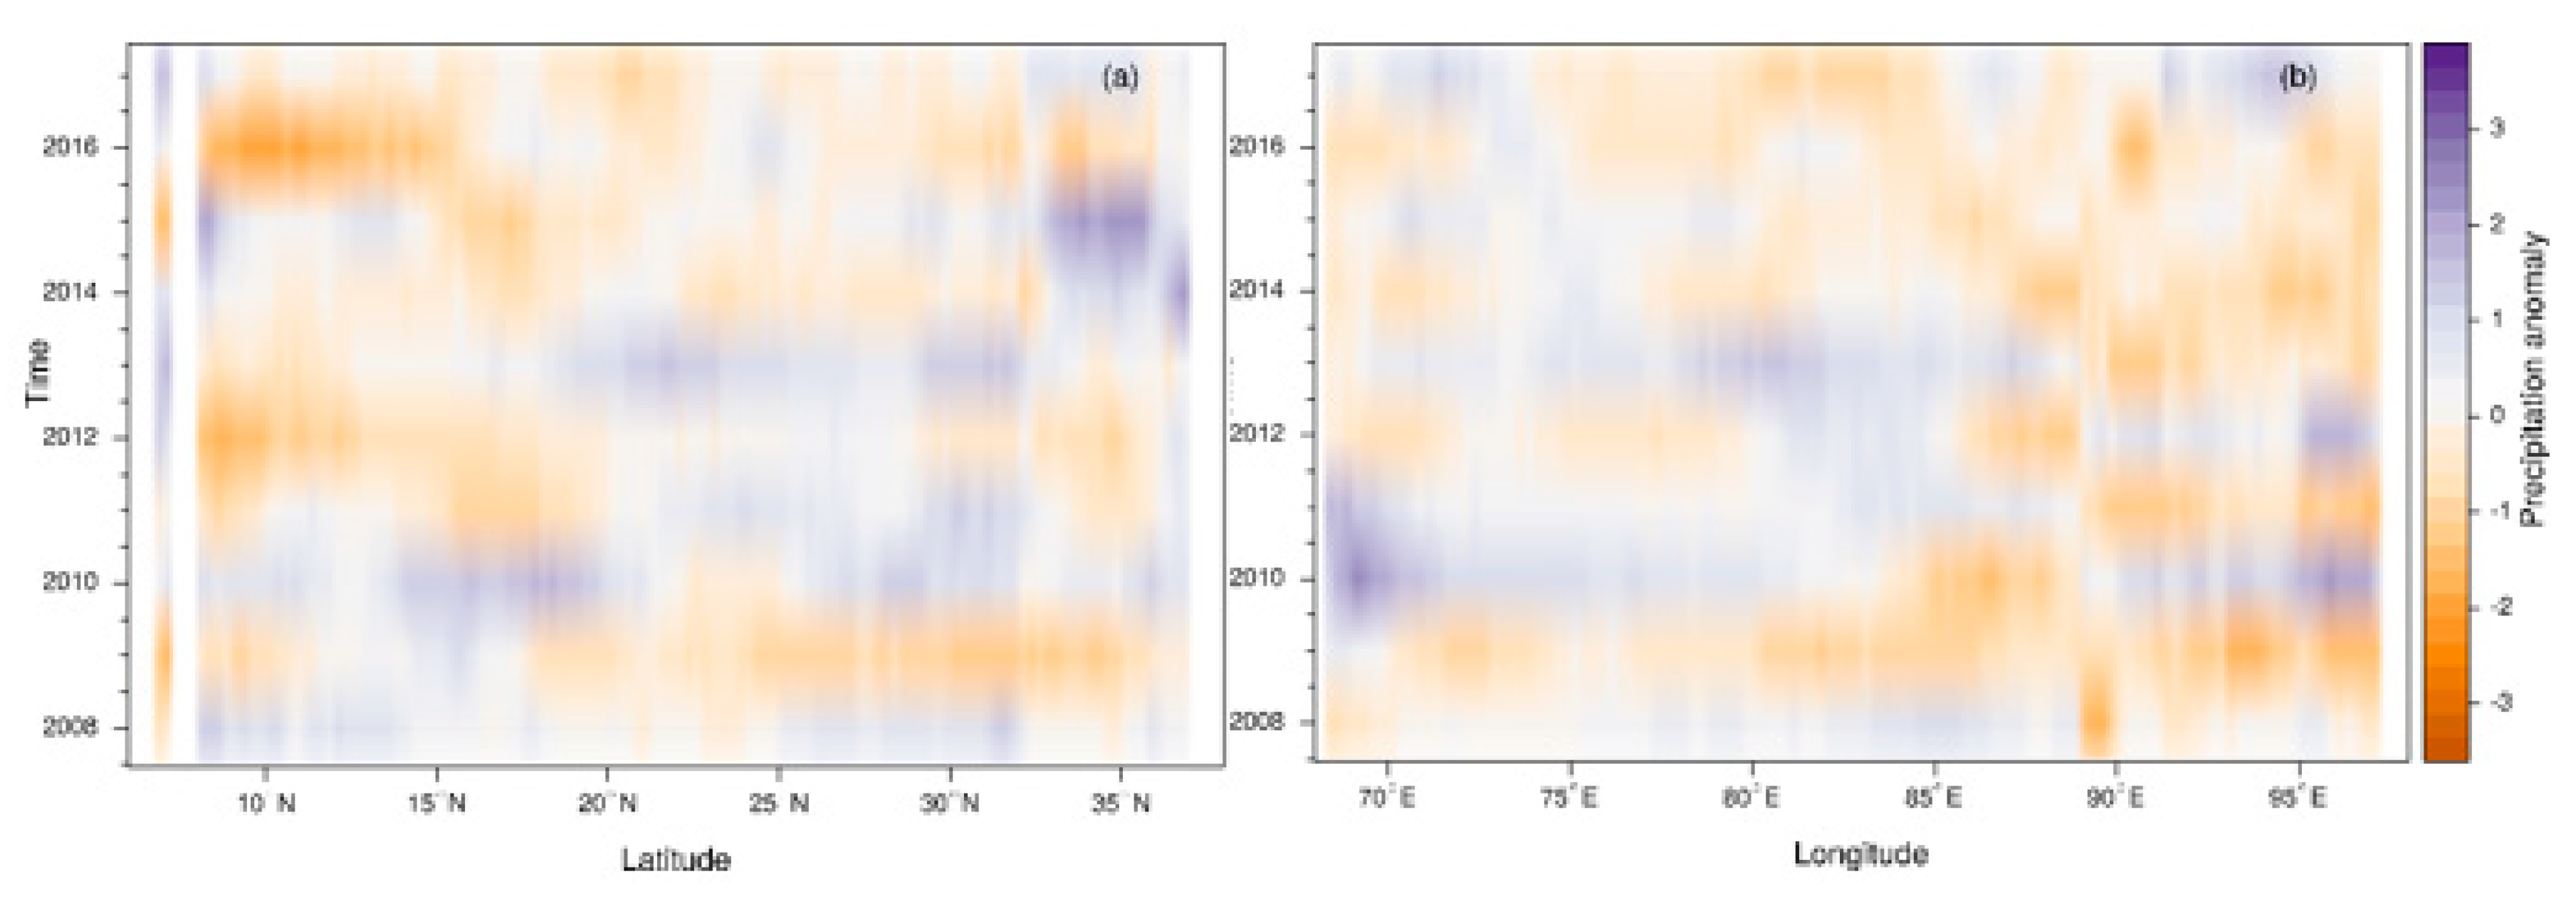
3.4.1. Spatio-Temporal Variation of the Precipitation Anomaly

The precipitation anomaly for the year 2008 to 2017 based on the long-term average of precipitation (2000–2017), shows prevalence of positive rain anomaly in 2008 (Figure 5). The spatial extent of the positive rain anomaly has increased all over India except central India, which experienced a negative rain anomaly. In contrast, the spatial extent of the negative rain anomaly increased in 2009. A larger part of India experienced a negative anomaly, whereas a part of southern India recorded a positive anomaly in this period. In 2010, larger parts of western India experienced a positive rain anomaly, while parts of the eastern and central Indian region recorded a negative rain anomaly. A notable negative rain anomaly was observed in southern India during 2011–2012, while parts of the northern and central Indian regions experienced a positive one. The positive rain anomaly occurred over the larger part of the Indian Territory in 2013, while parts of northeast and southern India notably experienced a negative rain anomaly.
A positive rain anomaly was observed in the west and northwest India during 2014–2015, while a substantial part of the rest of India experienced a negative rain anomaly with the few exceptions of areas close to the coast. A larger part of north India (including the entire Himalayan mountain belt) and southern India show a negative rain anomaly in 2016 and 2017, while central India showed a positive rain anomaly in 2016 and north, west, northeast, east and some parts of southern India experienced a positive anomaly in 2017. In summary, the precipitation anomalies across latitudinal and longitudinal bands over time show that negative rain anomalies occurred in most of the southern Indian territory after 2011 (Figure 6a), however, eastern Indian territory experienced the same in 2009, 2011 and become wide spread after 2013 (Figure 6b). The rest of the latitudinal and longitudinal bands show a notable inter-annual variability of positive rain anomalies.

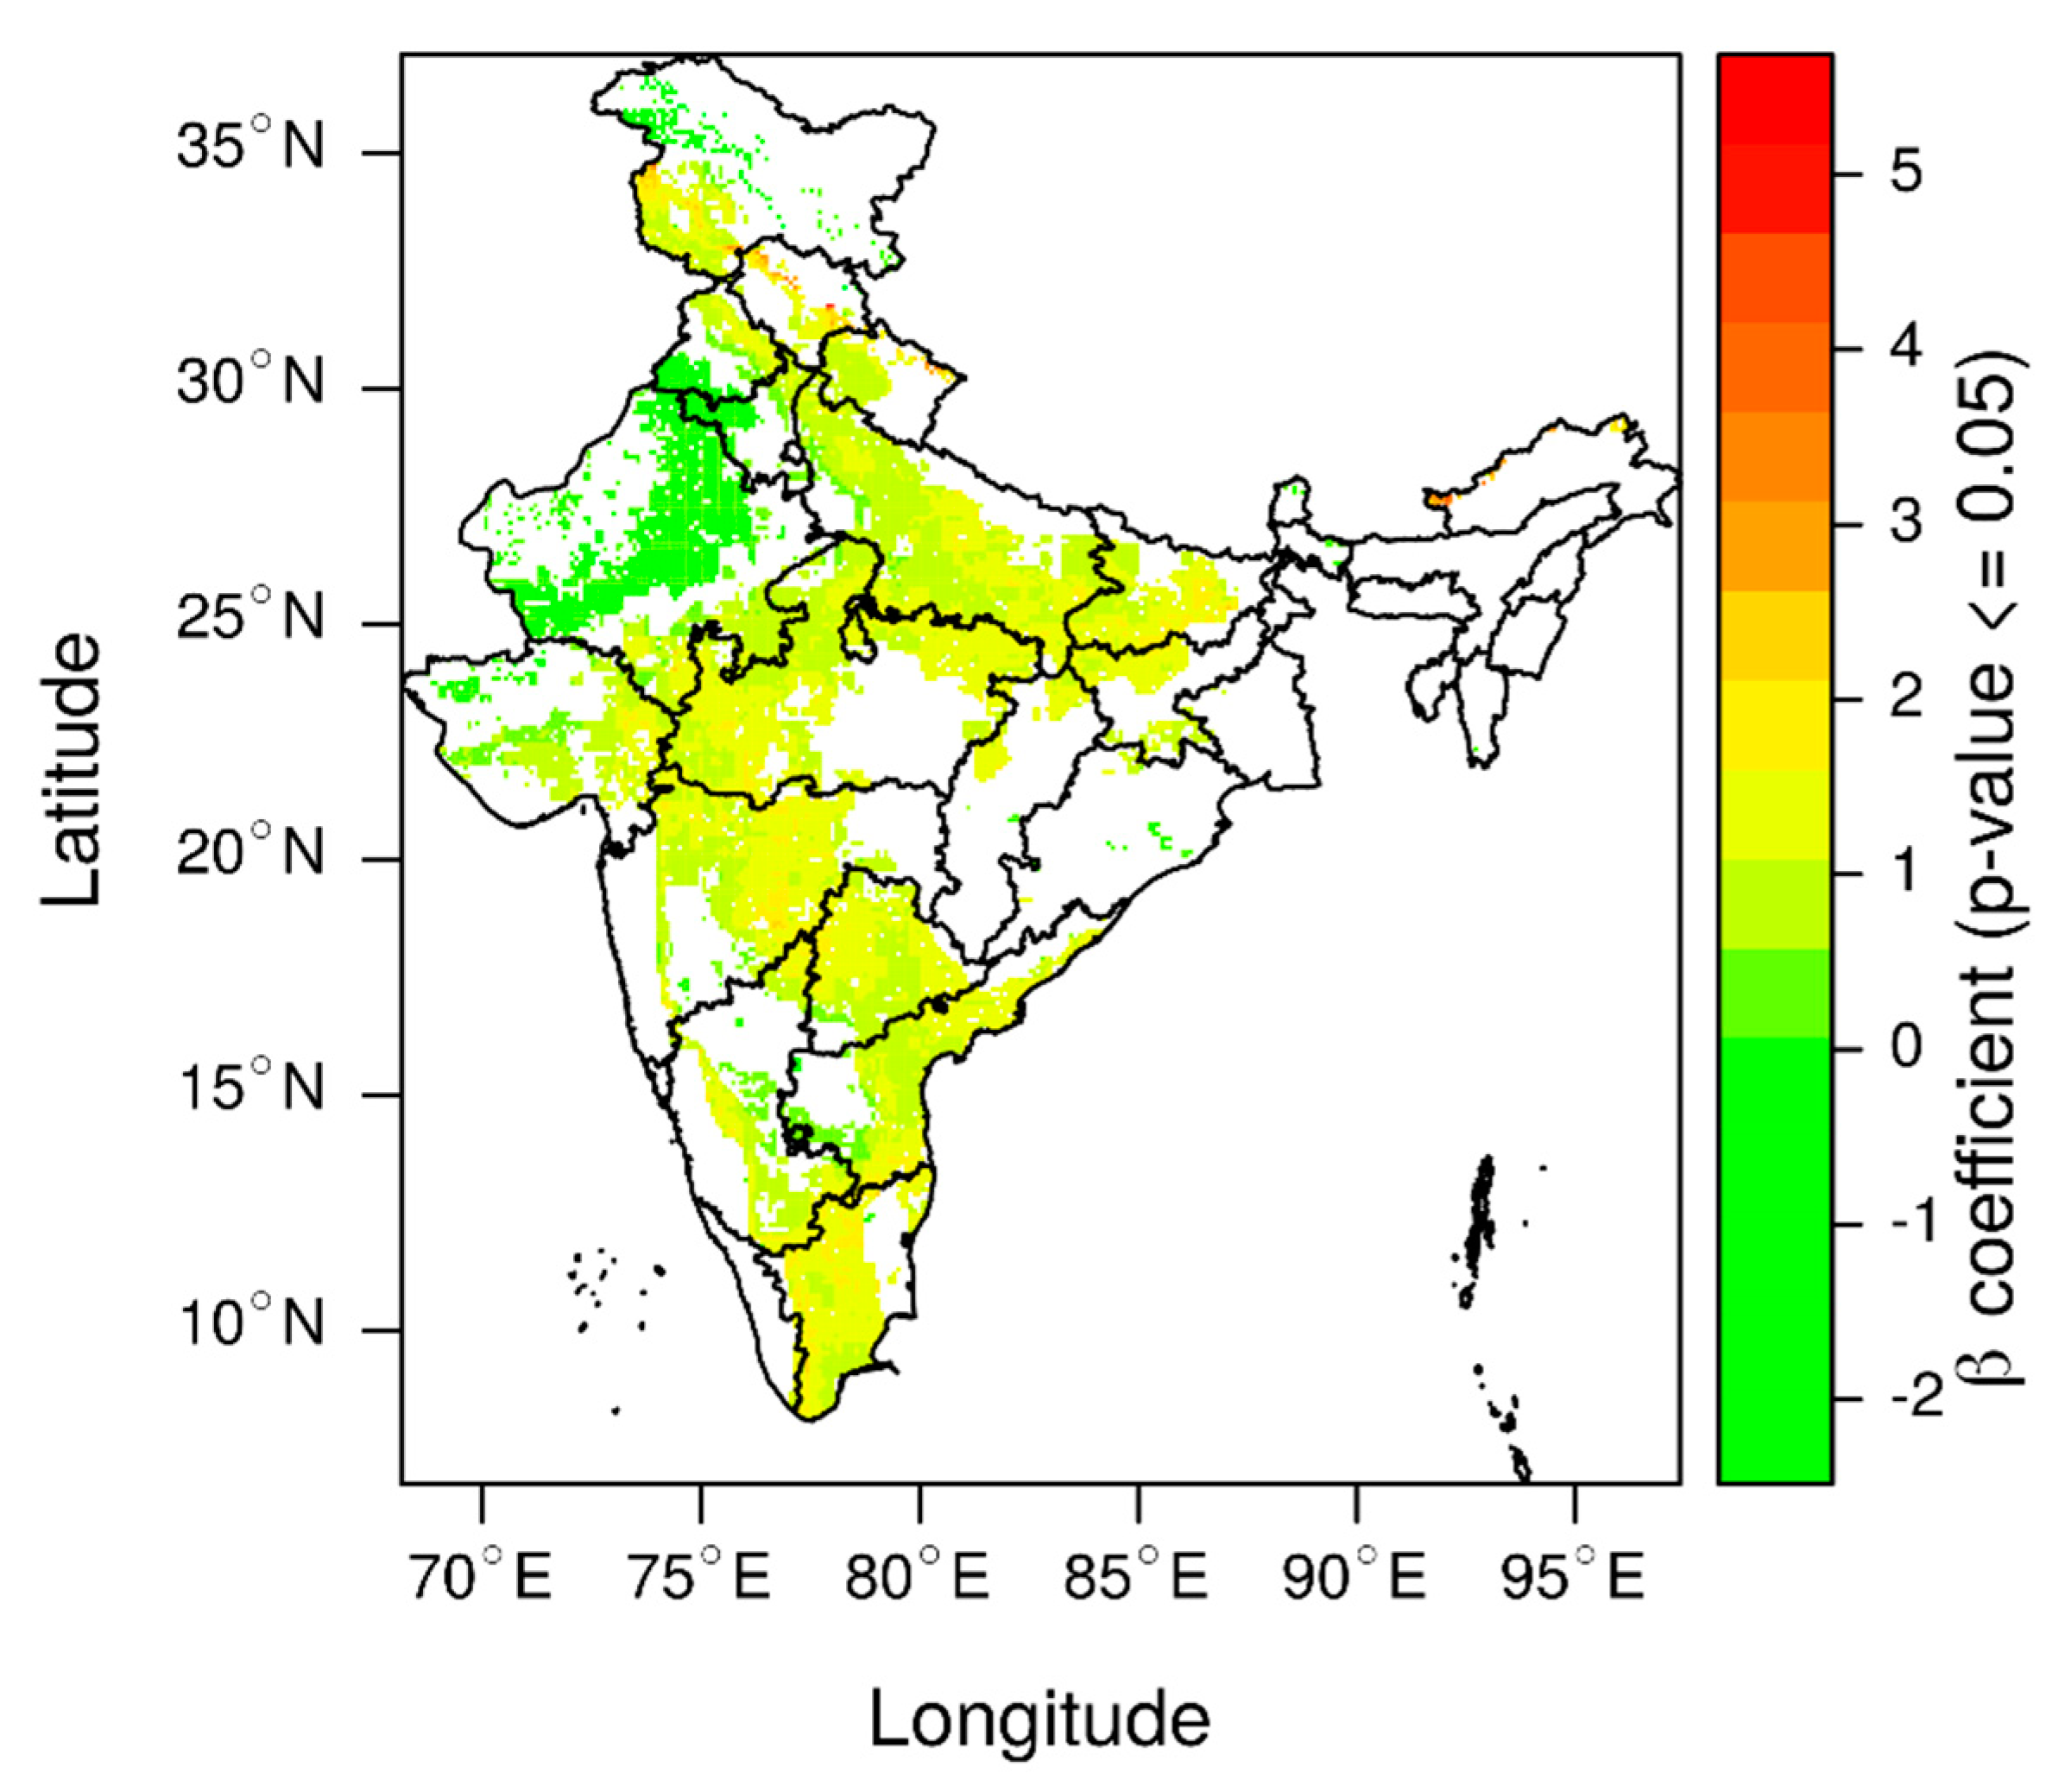
3.4.2. Long-Term Precipitation Trend

The estimated Kendall’s tau statistics for the long-term trend in precipitation shows that monthly precipitation has significantly increased towards the west and northwest Indian regions (Figure 7b). The eastern and north-eastern parts of India have experienced a decreasing trend in monthly precipitation. This decreasing trend in monthly precipitation is also observed in the southern Indian region. The MK trend statistics, thus, show that the spatial tendency of the precipitation regime over time has gradually shifted towards the west, though the absolute amount of precipitation remains highest in northeast India (Figure 7a).

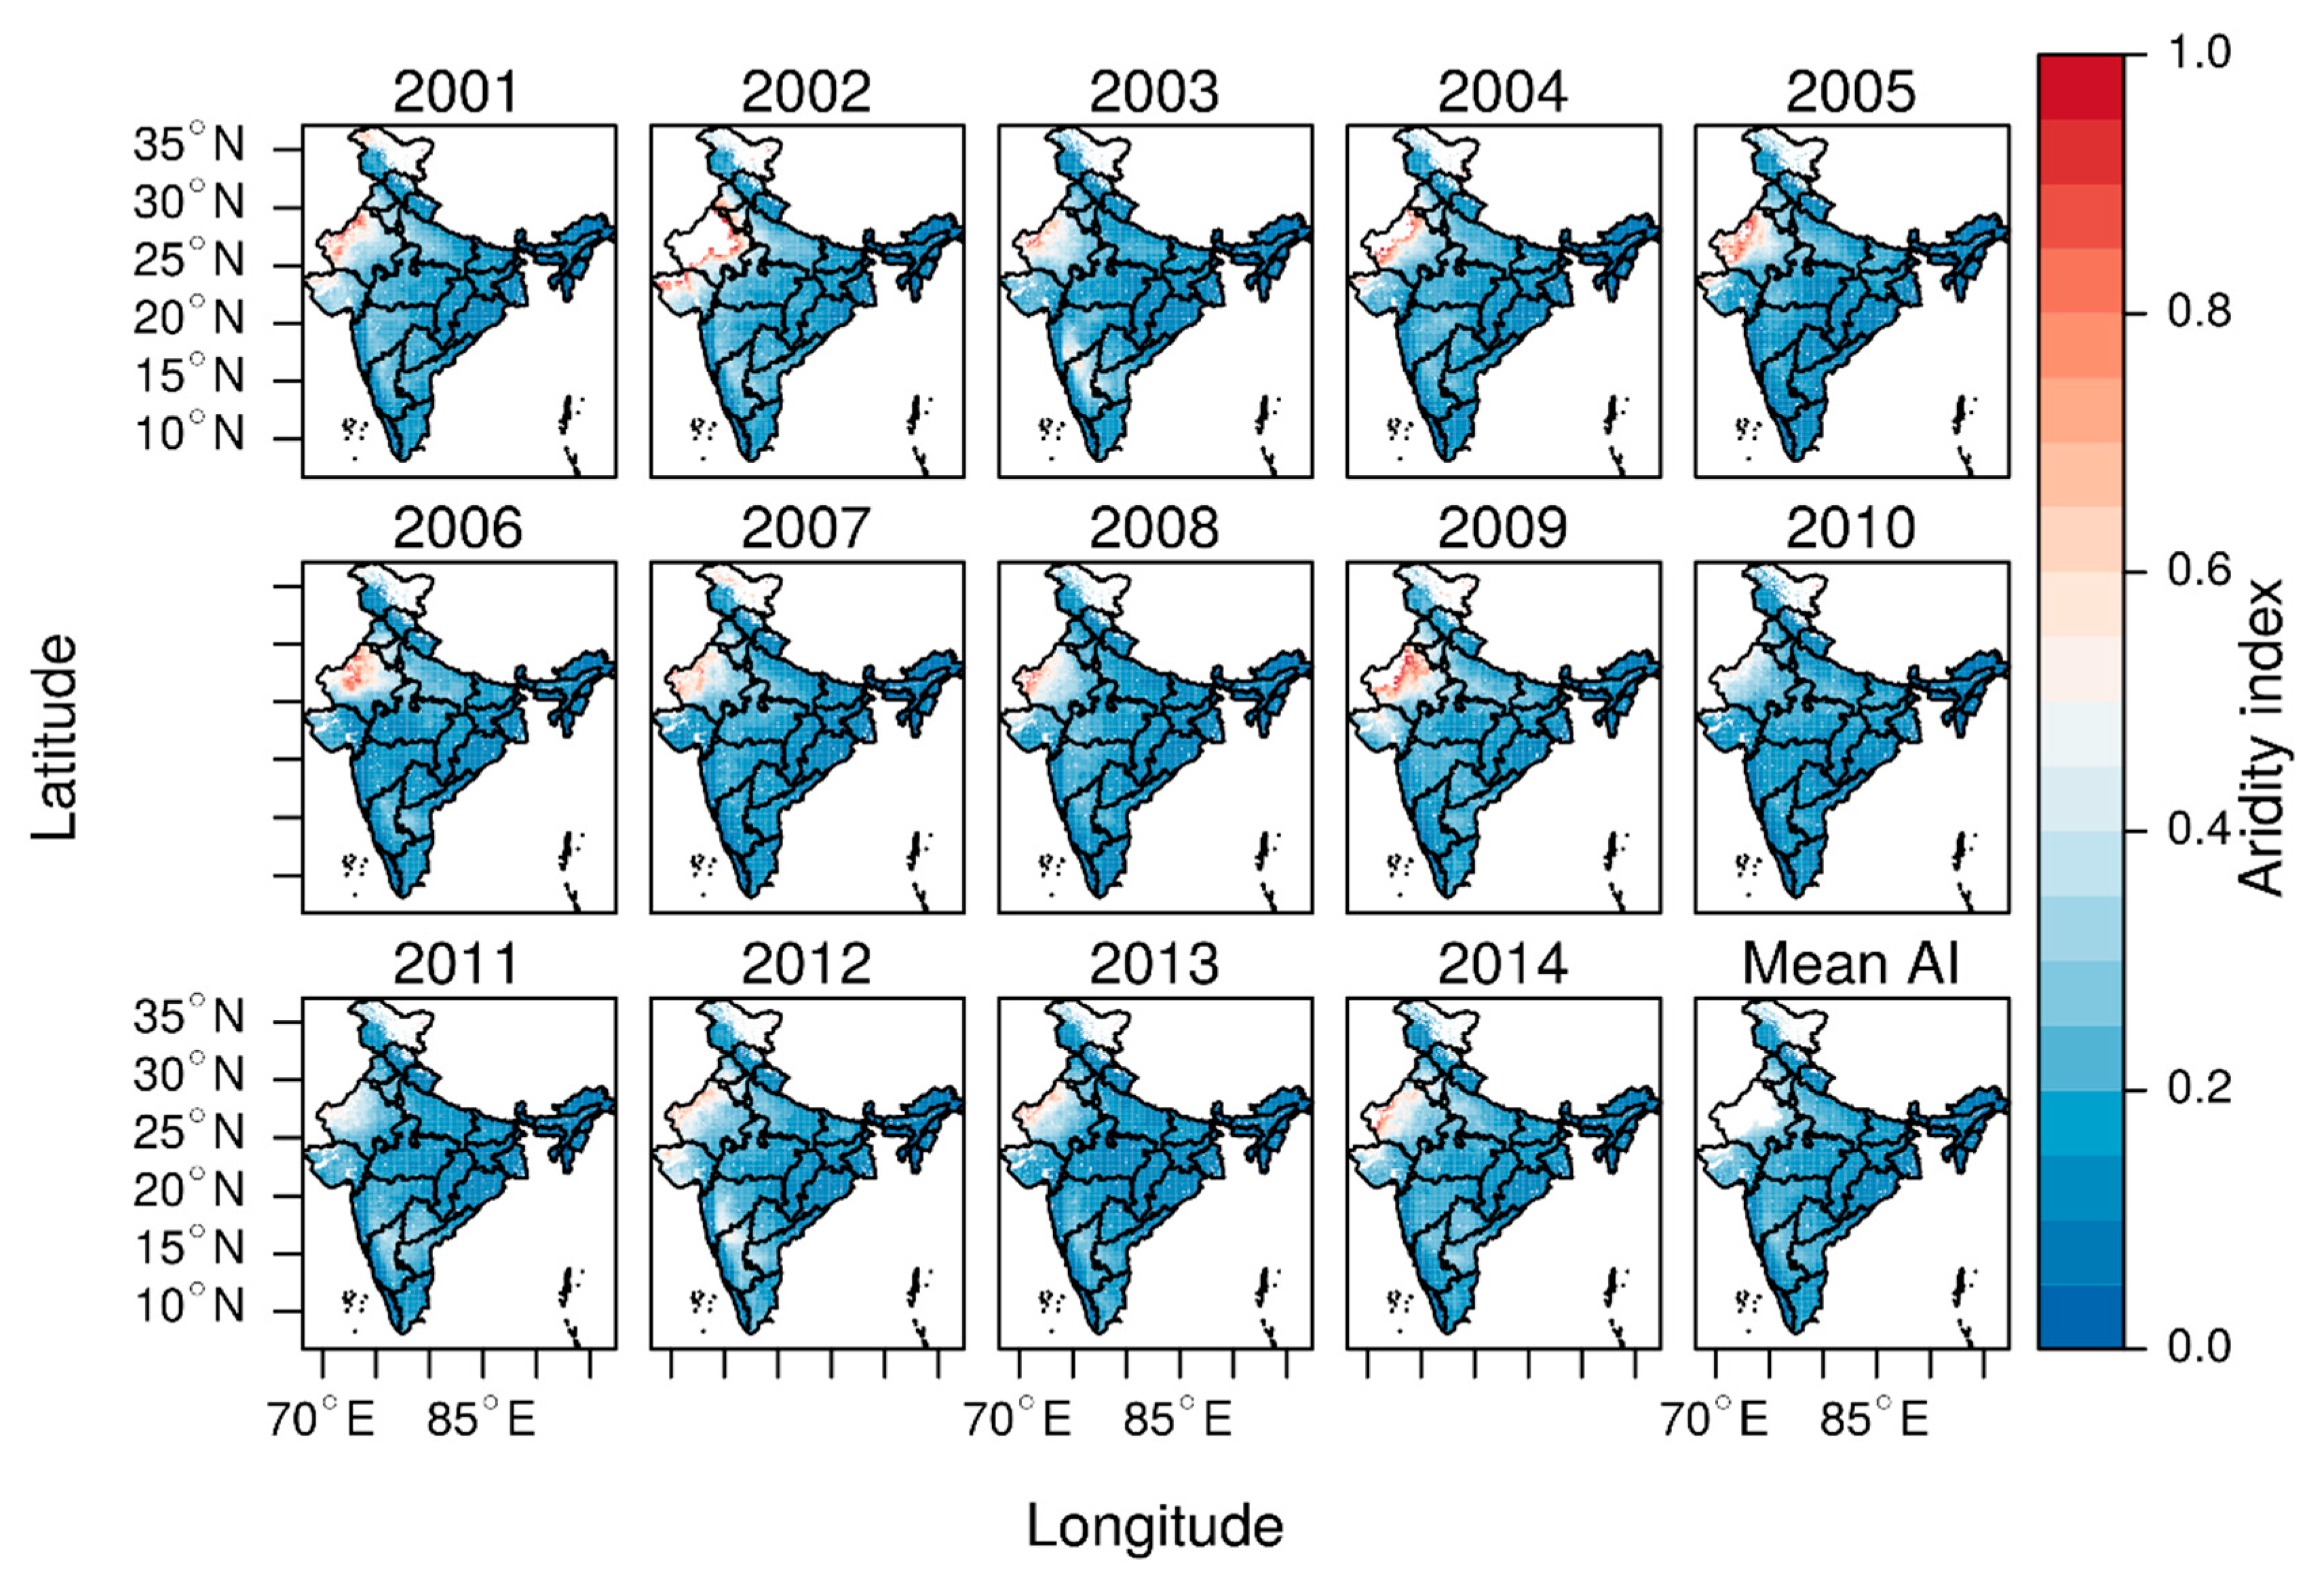
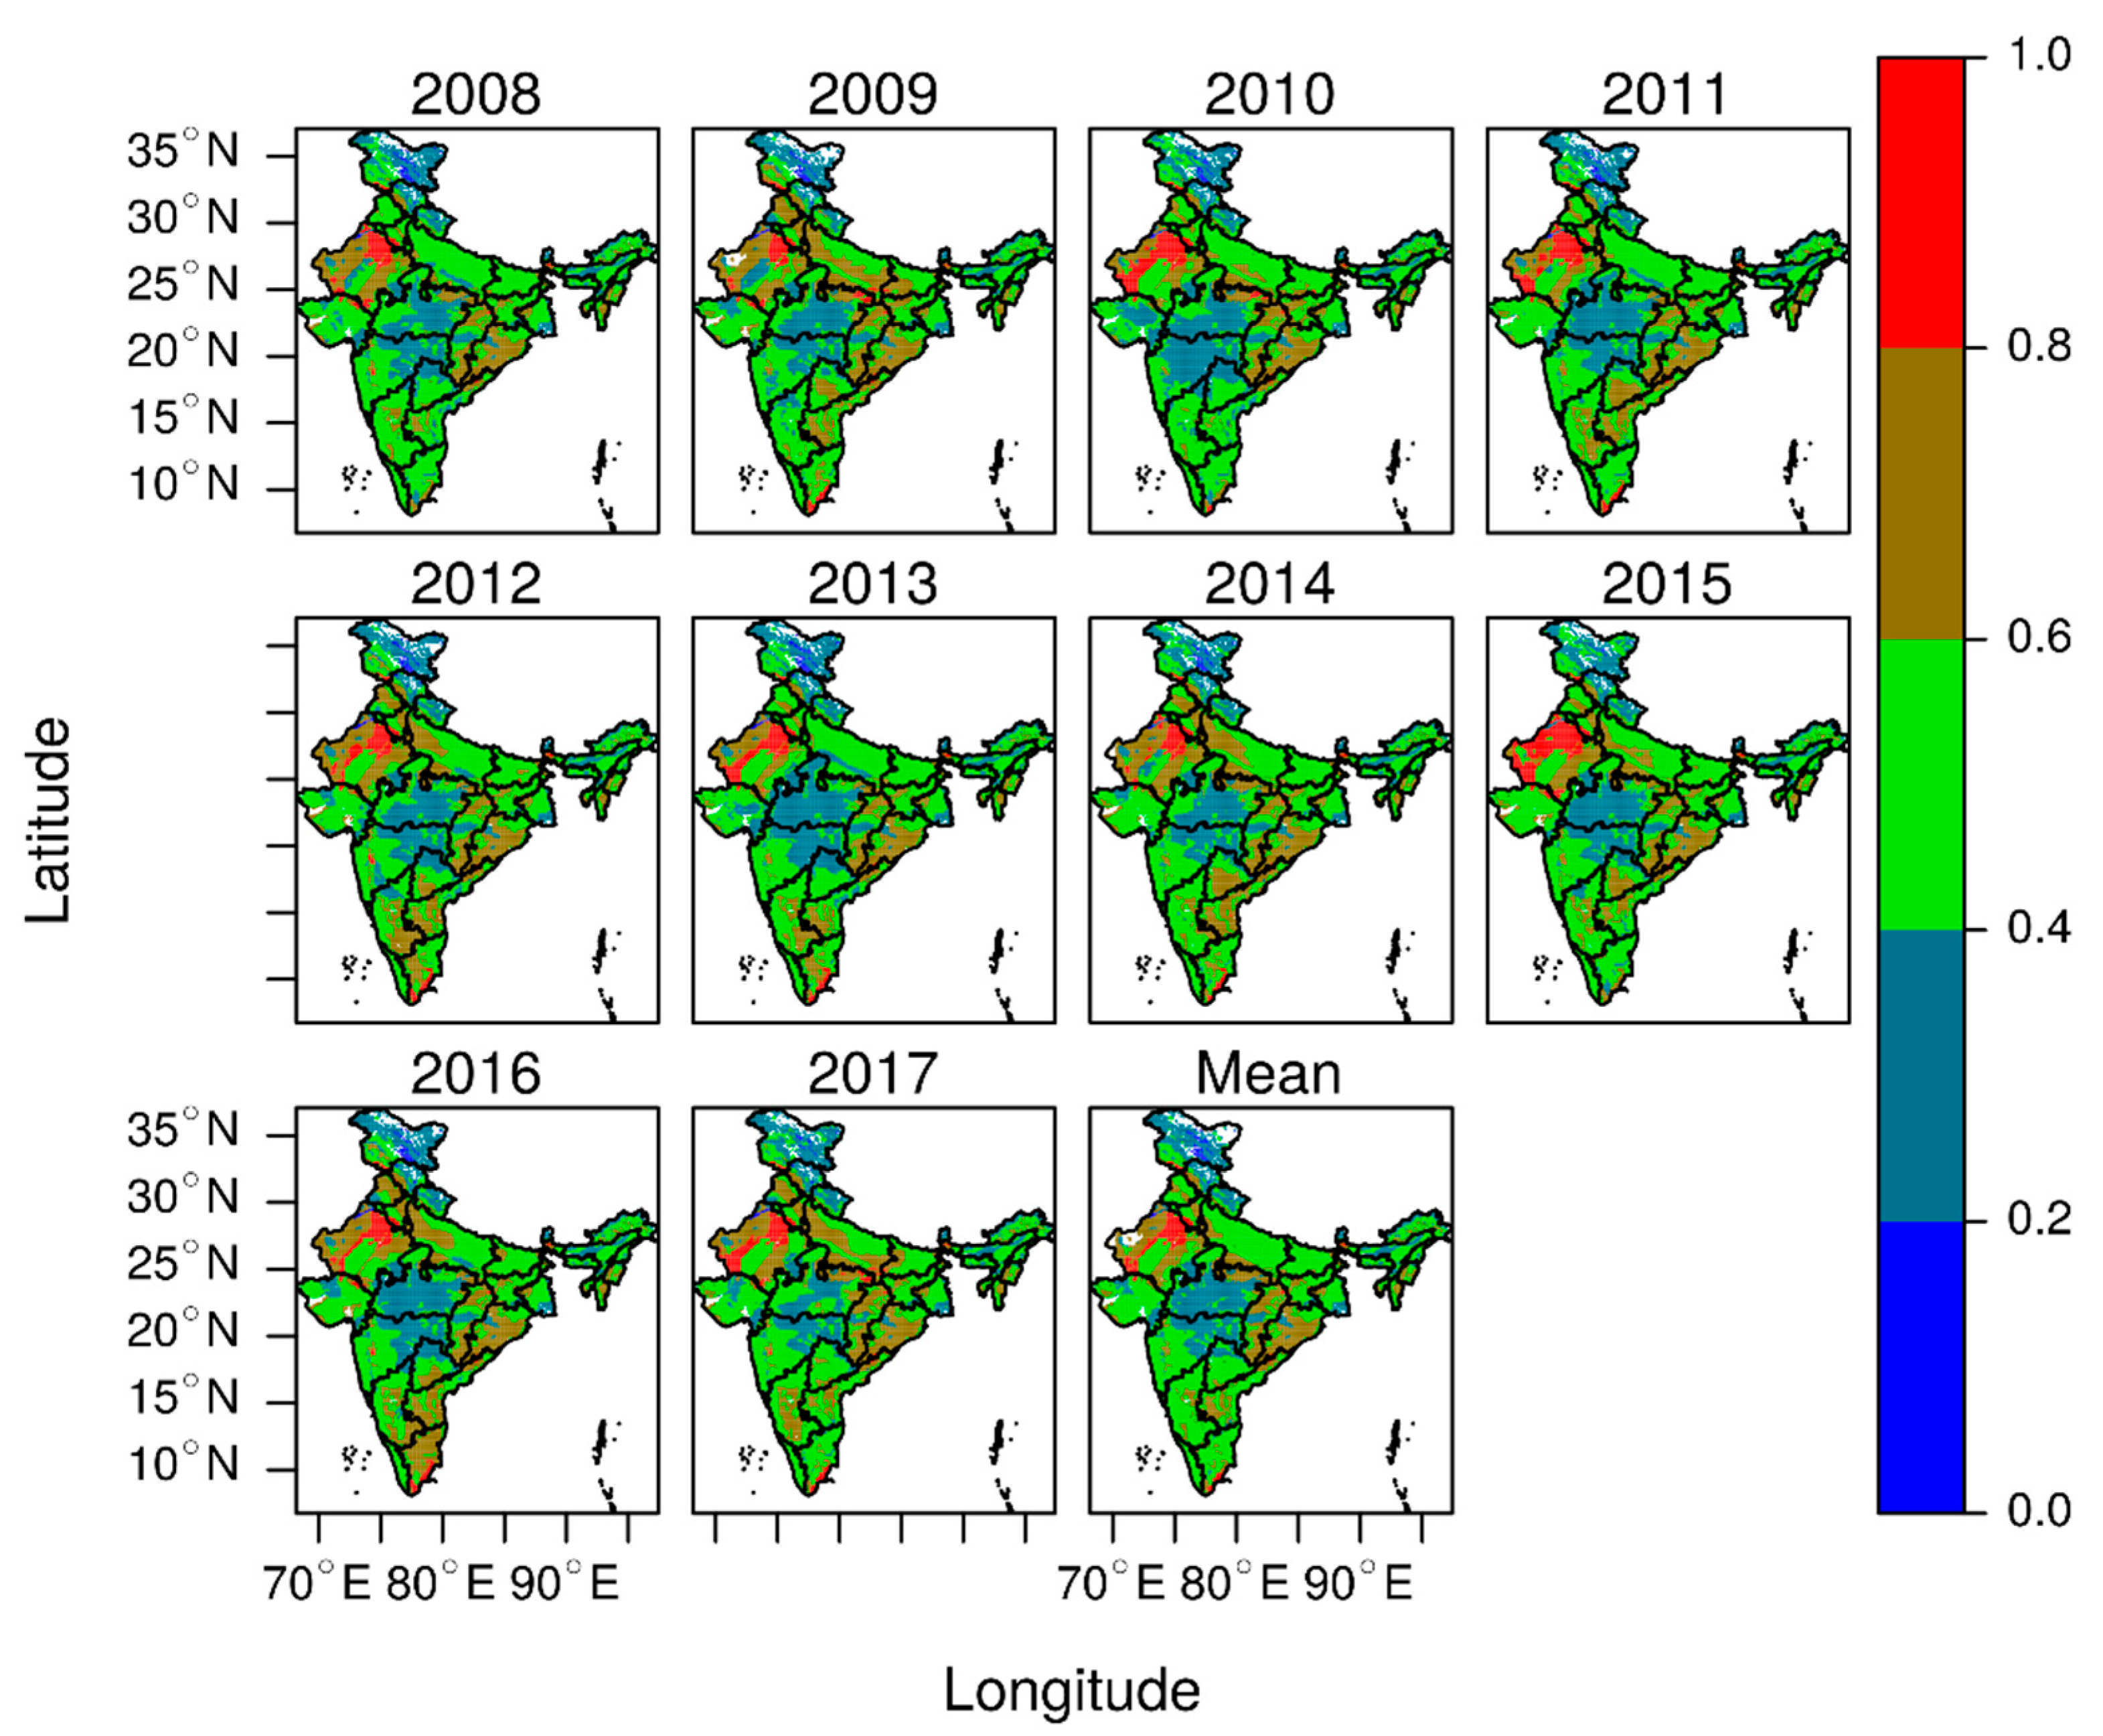
3.4.3. Spatio-Temporal Variation of Aridity

The AI showed a significant reduction in aridity between 2001 and 2010 with a notable inter-annual variation (Figure 8). The spatial extent of moderate to high AI (0.5 to greater than 0.8), which is prevalent in northwest India, also reduced a noticeable amount during this period. However, the spatial extent of moderate to high AI increased again from 2011 to 2014. The average AI computed over time shows that western Rajasthan (the districts of Jaisalmer, Bikaner, Sri Ganganagar, Barmer, Jodhpur, Churu and Hanumangarh), north Gujarat (the districts of Kachchh, Patan, Banas Kantha, Mahesana), southern Punjab (the districts of Fazilika, Muktsar, Mansa, Sangrur and Bhathinda) and south-western Haryana (the districts of Sirsa, Hisar, Bhiwani and Mahendragarh) have been affected by moderate (AI~0.5 to >0.6) to high aridity (AI~ >0.8).
The suitability for cactus cultivation, computed between 2008 and 2017 and based only on precipitation variation, shows a consistent highly (0.8–1.0) to moderate (0.8–1.0) land suitability in western and east-central India. This region covers parts of Rajasthan, Chhattisgarh and Odisha and the southern coastal part of Tamil Nadu. Most of the northern plains, including Punjab, Haryana, UP, Bihar and West Bengal, southern India, including Karnataka, Andhra Pradesh, western Maharashtra, Tamil Nadu and Kerala and the northeast hill states except for the Assam plain, manifested marginal suitability (0.4–0.6) in this period. The prevalence of moderate suitability in western part of IGP including Punjab, Haryana and western and southern UP was observed in 2009, 2010, 2012, 2014, 2015, 2016 and 2017 (Figure 9). Marginal suitability, with periodic interjections of low suitable class (≤0.4) also prevailed in eastern Rajasthan and Gujarat (2010, 2012–2014 and 2016–2017). Such periodic variations of low suitable class interspersed with marginal suitable class match with the positive rain anomalies over these areas (Figure 5). A very high degree of inter-annual spatial variation is observed in the low suitable category in the central Indian region and the northeast plain that encompasses parts of MP, eastern Maharashtra and the northeast plain in Assam. The negative rain anomalies that occurred in many parts of these regions in 2008, 2012, 2014–2015 and in 2017, keep the suitability value relatively higher (marginally suitable). The positive rain anomalies, in contrast, in the years of 2010–2011, 2013 and 2016 keep the land suitability value low in these regions.
The result of the linear regression of time series suitability and time series AI from 2008 to 2014 shows a significant decreasing trend of the suitability of cactus with increasing AI over the areas that are belonged to high land suitable class (Figure 10). So, a vast amount of areas in Rajasthan, Gujarat and some areas over Odisha that were consistently showing moderate to high land suitability exhibit a significant falling tendency with increase of AI (β~−1 to −2). However, the areas including the parts of UP, northern Haryana and Punjab, Bihar in the northern plain (IGP) and areas under western MP, central Maharashtra, Telangana, eastern Andhra and west-central Tamilnadu in central and southern provinces exhibit a significant increasing linear trend of suitability under increasing AI (β~0.5 to 2).

4. Discussion

The spatially coherent cluster of high to moderate suitable class in western and east-central provinces is appeared due to interaction of climate and edaphic factors. The climatic factors, such as a precipitation of 50 to 150 mm/m (S1a), mean temperatures greater than 25 °C (S1b), minimum temperatures of 15 to 25 °C (S1c) and maximum temperatures of 38 to 45 °C (S1d) and edaphic factors, such as, sandy loam to sandy soils with pH around 6 and OC between 0.5 and 0.75%, favour the cactus growth in these areas. The areas in western and central IGP that showed moderate land suitability are, in fact, highly fertile for cereal crops. However, due to temperature (maximum and minimum temperature) and precipitation levels, the suitability for the cactus has increased in these alluvial surfaces. The discrete patches of high and moderate suitable areas that are observed in coastal plains in coastal states of south India and in the foothill zones of northern mountain, many of these areas have come under the sub-humid to humid climatic conditions. The dominance of ideal edaphic factors, such as a soil texture that varies from loam, loamy sand to sandy loam with a pH around 6 and OC around 0.5 to 1%, result in these areas falling into the highly suitable category.
While dealing with the suitability over cropland, the state wise average food grain productivity from 2009 to 2014 shows that Rajasthan, Odisha and Chhattisgarh are constantly facing low productivity (less than 1.7 t/ha, which is less than the national average of 2.25 t/ha) in cereal production (S2a). The average productivity of pulses remains below the national average (0.83 t/ha) in these states (S2b) and the productivity of oilseed also shows less than the national average (1.06 t/ha) in Chhattisgarh and Odisha (S2c). Moreover, the productivity of pulses and oilseed in Karnataka and Andhra Pradesh including Telengana also remains below the national average. Previous studies related to crop production and precipitation trends in many of these areas show a significant reduction of food grain production because of a combination of decreasing precipitation and low agricultural inputs [57,58]. Thus, in the context of falling food grain production because of precipitation uncertainty, cultivating cactus can be integrated with the existing cropping pattern to maintain agro-ecological sustainability.
The areas under barren land with high to moderate land suitability in western, northern and southern provinces have a variety of soil types. The soil type ranges from– sandy soil (in the western part of Rajasthan), sandy loam (in southern UP) and loam to light clay soil (in Andhra Pradesh and Maharashtra)—with less than 0.5% OC content and mean annual precipitation of 60 mm. With an exposed soil surface unsuitable for food grains, these lands are very suitable for growing cactus. A similar growth conditions prevailed over wastelands of western, northern and southern provinces that rendered it classified into marginal to high suitable class.
The field trials of the cactus pear under dryland farming systems were carried out through Indian Council of Agricultural Research (ICAR) institutions in five states such as Odisha, Karnataka, UP, MP and Gujarat. A substantial part of these states, in the analysis, appeared as moderate to high land suitability for the cactus pear. The successful cultivation of cactus in these areas would venture other suitable areas from this analysis. As the analysis was carried out at a spatial resolution of ~ 861 × 923 m the pursuance of farm level suitability of the cactus pear could be attempted under the presence of a set of additional factors which were not considered in this analysis such as; terrain slope, aspect, wind pattern, soil depth and ambient soil moisture and soil nutrition level. The edaphic factor at this farm level could outweighs the climatic factors which have the least variability at this micro-spatial scale. The interactive web application tool that was developed for exploring the suitability values at a spatial resolution of ~861 × 923 m can facilitate the users to navigate through the levels of land suitability of cactus pear under different agroclimatic regions. The tool was intended for the purpose of regional managers for the development and agriculture policy. The outcome could help them to furnish the quantum of investment and disinvestment approach towards regional management of dryland farming. The application, however, could be used by broader audience such as practitioners of GIS and farming community under certain knowledge of climate and edaphic variables used in this analysis.
The spatio-temporal variations of rain anomalies (Figure 6 and Figure 7) indicate inconsistency in the occurrence of a dependable rainfall amount across India. Therefore, growing crops that heavily rely on a dependable amount of precipitation become unsustainable and it becomes more untenable in those areas that are in the category of dryland farming. The findings of the precipitation trend analysis suggest that in the western dryland areas—where average thermal conditions that sometimes causes severe loss of cactus remain high—the increasing trend in precipitation may lead to a restoration of the optimal environment for the growth of the cactus pear. Keeping other climatic and edaphic factors constant, the inter-annual variation in precipitation and its long-term trend show that the western and east-central parts of the sub-continent (covering parts of Rajasthan, Odisha, Jharkhand, eastern MP and Chhattisgarh) may offer an ecological niche conducive to the growth of the cactus pear. Given the high degree of uncertainty of a dependable rainfall, which is a prerequisite for producing any food grain crops in these areas, cultivating cactus may offer a plausible alternative option to farmers. Further findings from time series AI suggest that in-spite of high food grain production that remains well above the national average in Punjab and Haryana, farm production would become unsustainable, due to the occurrence of high degree of rain anomaly and spatially coerced arid conditions at least for the areas of moderate to high aridity. Introducing cactus within the regular crops, given its tolerance of dry condition, would help preserve farm production.
The result of cactus suitability based on the precipitation variation keeping the other controlling factors constant implies the occurrence of negative rain anomalies yields land that is suitable for the optimum growth of cactus. It is observed that western India (the western part of Rajasthan) and the east-central part of India (the larger parts of Chhattisgarh and Odisha) have consistently shown high to moderate suitable class for all the years, irrespective of rainfall anomalies. Moreover, a substantial portion of these areas have below average food grain productivity and follow dryland farming systems where the availability of surface irrigation becomes an important issue in periods when the amounts of precipitation are low. Further outcome of the linear modelling of suitability with AI suggests the areas—that appeared with high to moderate land suitability (preferably the western and east-central provinces)—are no longer suitable for growing cactus due to further increase of AI. Although the space-time trend of precipitation in the western part is increasing a significant quantity of dry land farming systems in these provinces are facing the issue of moderate to high aridity. Instead, a substantial amount of lands in the northern plains and southern India, which belong to cropland category, show an increase of cactus suitability with increasing AI. As the ambient soil moisture content is decisive for the growth of the crop, under the situation of increasing aridity when soil moisture content become critical, the cactus pear can be induced to ensure farm production. Moreover, due to the minimum water requirement throughout the phenological cycle and high drought tolerance, cactus can be one of the favourable crops in dryland farming system. Thus, bringing cactus into agricultural system can maintain the agro-ecological sustainability by sustaining farm productivity and fodder supply to the livestock population in these areas.

5. Conclusions

The analysis presented comprehensive details of the land suitability for cactus cultivation across India, indicating that the highest potential for optimum cactus growth lies in the western parts and east-central India (about 32% of TGA). However, marginal (~46% of TGA) land suitability was observed in the northern plains, north eastern states and the southern Indian plateau. However, 22% of the TGA was land of low suitable to very low suitable, which is primarily concentrated in the central Indian region and the northern mountains. The results also show a varying degree of spatio-temporal suitability under changing precipitation and aridity conditions. The estimation showed that, at the time of negative precipitation anomalies, the suitability increases in the southern parts of the northern plain and in central India. In contrast, during positive precipitation anomalies, the suitability decreases in those areas. It was remarkable that irrespective of the pattern of precipitation anomaly, the western part of India (which includes a larger portion of western Rajasthan) and the east-central part of India (which includes a substantial portion of Chhattisgarh and Odisha) appeared consistent with high to moderate suitability values. A significant amount of these areas follows dryland agricultural farming systems, where cultivation is heavily dependent on the certainty of rainfall. The findings from the analysis of agricultural productivity also reflect a low average food grain production for these areas. Thus, integrating cactus as a crop in the dryland farming systems and rangelands can be one plausible solution to build resilient agro-ecosystems, which provide food and fodder while enhancing ecosystem services.

Supplementary Materials

The following are available online at https://www.mdpi.com/2071-1050/11/21/5897/s1. Figure S1—Spatial distribution of climatic and edaphic factors indicating the conditions for cactus growth across India. Figure S2—Interface of the decision support tool. Figure S3—Average food grain production by state (or province) for (a) cereal, (b) pulses and (c) oilseed in India. Table S1—The criteria and sub-criteria for the growth of Cactus pear.

Author Contributions

P.A. and C.B. developed the concept and framework for the study as well as the data analysis and wrote the first draft. M.L., S.H., H.M., S.G. and A.S. contributed to manuscript writing and review. All authors contributed to the discussion and outcome of the manuscript.

Funding

This research was funded by ICARDA and the APC was funded by CGIAR Research Program on Livestock and CGIAR Bigdata Platform.

Acknowledgments

The author acknowledge the support from ICARDA, a CGIAR institute working for the agricultural development in dry areas. CGIAR is a global research partnership for a food-secure future. Its science is carried out by 15 research centres in close collaboration with hundreds of partners across the globe. The authors acknowledge the editor and the efforts from two anonymous reviewers for their critical reviews towards improving the quality of manuscript.

Conflicts of Interest

The authors declare no conflict of interest.

References

  1. Makumbe, M.T. A review of the distribution use and potential of cactus pear (Opuntia ficus-indica (L.) mill.) as ruminant feed in Zimbabwe. In Improved Utilization of Cactus Pear for Food, Feed, Soil and Water Conservation and Other Products in Africa. In Proceedings of the International Workshop Held in Mekelle, Mekelle, Ethiopia, 19–21 October 2009; Tigray Agricultural Research Institute: Mekelle, Ethiopia, 2010; pp. 14–19. [Google Scholar]
  2. Inglese, P.; Mondragon, C.; Nefzaoui, A.; Saenz, C. Crop Ecology, Cultivation and Uses of Cactus Pear; Food and Agriculture Organization of the United Nations (FAO): Rome, Italy, 2017. [Google Scholar]
  3. Brutsch, M.O.; Zimmermann, H.G. The prickly pear (Opuntia ficus-indica [Cactaceae]) in South Africa: Utilization of the naturalized weed, and of the cultivated plants. Econ. Bot. 1993, 47, 154–162. [Google Scholar] [CrossRef]
  4. Louhaichi, M.; Park, A.G.; Mata-Gonzalez, R.; Johnson, D.E.; Mohawesh, Y.M. A preliminary model of Opuntia ficus-indica (L.) Miller suitability for Jordan. Acta Hortic. 2015, 1067, 267–273. [Google Scholar] [CrossRef]
  5. Nefzaoui, A.; Louhaichi, M.; Ben Salem, H. Cactus as a tool to mitigate drought and to combat desertification. J. Arid Land Stud. 2014, 24, 121–124. [Google Scholar]
  6. Lemma, H.; Haile, M.; Fetene, M.; Belay, T. Cactus in Southern Tigray: Current Status, Potential Use, Utilization and Threats; Nefzaoui, A., Inglese, P., Belay, T., Eds.; International Workshop: Mekelle, Ethiopia, 2009. [Google Scholar]
  7. Tscharntke, T.; Clough, Y.; Wanger, T.C.; Jackson, L.; Motzke, I.; Perfecto, I.; Vandermeer, J.; Whitbread, A. Global food security, biodiversity conservation and the future of agricultural intensification. Biocon 2012, 151, 53–59. [Google Scholar] [CrossRef]
  8. Food and Agriculture Organization of the United Nations (FAO). FAO Statistical Pocketbook FAO; FAO: Rome, Italy, 2015; ISBN 978-92-5-108802-9. [Google Scholar]
  9. Biradar, C.M.; Thenkabail, P.S.; Noojipady, P.; Yuanjie, L.; Dheeravath, V.; Velpuri, M.; Turral, H.; Gumma, M.K.; Reddy, O.G.P.; Xueliang, L.C.; et al. A global map of rainfed cropland areas (GMRCA) at the end of last millennium using remote sensing. Int. J. Appl. Earth Obs. Geoinf. 2009, 11, 114–129. [Google Scholar] [CrossRef]
  10. Food and Agriculture Organization of the United Nations (FAO). How to Feed the World in 2050; High Level Expert Forum; FAO: Rome, Italy, 2009. [Google Scholar]
  11. Laurance, W.F.; Sayer, J.; Cassman, K.G. Agricultural expansion and its impacts on tropical nature. Trends Ecol. Evol. 2014, 29, 107–116. [Google Scholar] [CrossRef]
  12. Tilman, D.; Balzer, C.; Hill, J.; Befort, B.L. Global food demand and the sustainable intensification of agriculture. Proc. Natl. Acad. Sci. USA 2011, 108, 20260–20264. [Google Scholar] [CrossRef] [Green Version]
  13. Li, F.M.; Xiong, Y.C.; Li, X.G.; Zhang, F.; Guan, Y. Integrated dryland agriculture sustainable management in northwest China. In Innovations in Dryland Agriculture; Farooq, M., Siddique, K., Eds.; Springer: Cham, Switzerland, 2017; pp. 393–413. ISBN 978-3-319-47927-9. [Google Scholar]
  14. Scoones, I. Wetlands in drylands: Key resources for agricultural and pastoral production in Africa. Dryland Networks Program. Issues Pap. 1991, 38, 366–371. [Google Scholar]
  15. Ravindranath, N.H.; Lakshmi, C.S.; Manuvie, R.; Balachandra, P. Biofuel production and implications for land use, food production and environment in India. Energy Policy 2011, 39, 5737–5745. [Google Scholar] [CrossRef]
  16. Srinivasarao, C.; Venkateswarlu, B.; Lal, R.; Singh, A.K.; Kundu, S. Sustainable management of soils of dryland ecosystems of India for enhancing agronomic productivity and sequestering carbon. Adv. Agron. 2013, 121, 253–329. [Google Scholar]
  17. Rao, C.S.; Lal, R.; Prasad, J.V.; Gopinath, K.A.; Singh, R.; Jakkula, V.S.; Sahrawat, K.L.; Venkateswarlu, B.; Sikka, A.K.; Virmani, S.M. Potential and challenges of rainfed farming in India. Adv. Agron. 2015, 133, 113–181. [Google Scholar]
  18. Srinivasarao, C.; Lal, R.; Kundu, S.; Babu, M.P.; Venkateswarlu, B.; Singh, A.K. Soil carbon sequestration in rainfed production systems in the semiarid tropics of India. Sci. Total Environ. 2014, 133, 587–603. [Google Scholar] [CrossRef] [PubMed]
  19. Dixon, J.A.; James, D.E.; Sherman, P.B. Economics of Dryland Management; Taylor Francis Group, Routledge: London, UK. First published 1989, eBook published 2013. [CrossRef]
  20. Ghosh, S.; Vittal, H.; Sharma, T.; Karmakar, S.; Kasiviswanathan, K.S.; Dhanesh, Y.; Sudheer, K.P.; Gunthe, S.S. Indian summer monsoon rainfall: Implications of contrasting trends in the spatial variability of means and extremes. PLoS ONE 2016, 11, e0158670. [Google Scholar] [CrossRef] [PubMed]
  21. Guhathakurta, P.; Rajeevan, M. Trends in the rainfall pattern over India. Int. J. Climatol. 2008, 28, 1453–1469. [Google Scholar] [CrossRef]
  22. Rahman, S.H.; Sengupta, D.; Ravichandran, M. Variability of Indian summer monsoon rainfall in daily data from gauge and satellite. J. Geophys. Res. Atmos. 2009, 114, D17113. [Google Scholar] [CrossRef]
  23. Ratna, S.B. Summer monsoon rainfall variability over Maharashtra, India. Pure Appl. Geophys. 2012, 169, 259–273. [Google Scholar] [CrossRef]
  24. Louhaichi, M.; Kumar, S.; Tiwari, S.; Islam, M.; Hassan, S.; Yadav, O.P.; Dayal, D.; Moyo, H.P.; Dev, R.; Sarker, A. Adoption and utilization of cactus pear in South Asia–smallholder farmers’ perceptions. Sustainability 2018, 10, 3625. [Google Scholar] [CrossRef]
  25. Nefzaoui, A.; Inglese, P.; Belay, T. Improved utilization of cactus pear for food, feed, soil and water conservation and other products in Africa. In Proceedings of the International Workshop, Mekelle, Ethiopia, 19–21 October 2009. [Google Scholar]
  26. Salem, H.B.; Nefzaoui, A.; Abdouli, H.; Ørskov, E. Effect of increasing level of spineless cactus (Opuntia ficus-indica var. inermis) on intake and digestion by sheep given straw-based diets. Anim. Sci. 1996, 62, 293–299. [Google Scholar] [CrossRef]
  27. Hirzel, A.H.; Hausser, J.; Chessel, D.; Perrin, N. Ecological-niche factor analysis: How to compute habitat-suitability maps without absence data? Ecology 2002, 83, 2027–2036. [Google Scholar] [CrossRef]
  28. Nisar, A.T.R.; Gopal, R.K.; Murthy, J.S.R. GIS-based fuzzy membership model for crop-land suitability analysis. Agric. Syst. 2000, 63, 75–95. [Google Scholar] [CrossRef]
  29. Speranza, C.I.; Kiteme, B.; Wiesmann, U. Droughts and famines: The underlying factors and the causal links among agro-pastoral households in semi-arid Makueni district, Kenya. Glob. Environ. Chang. 2008, 18, 220–233. [Google Scholar] [CrossRef]
  30. Inglese, P.; Scalenghe, R. Cactus pear (Opuntia ficus-indica L. (Mill)). In Manual of Methods for Soil and Land Evaluation; Constantini, E.A.C., Ed.; Science Publisher: Enfield, NH, USA, 2009; pp. 275–285. [Google Scholar]
  31. Le Houérou, H.N. Cacti (Opuntia spp.) as a fodder crop for marginal lands in the Mediterranean Basin. Acta Hortic. 2002, 581, 21–46. [Google Scholar] [CrossRef]
  32. Le Houérou, H.N. Impact of man and his animals on Mediterranean vegetation. In Ecosystems of the World; Mediterranean-Type, S., Di Castri, F., Goodall, D.W., Specht, R.L., Eds.; Elsevier: Amsterdam, The Netherlands, 1981; Volume 11. [Google Scholar]
  33. Granados, S.; Castañeda, P.D.; Castañeda, A.D. El Nopal: Historia, Fisiología, Genética e Importancia Frutícola; Universidad Autoónoma Chapingo: Trillas, México, 1991. [Google Scholar]
  34. Pimienta-Barrios, E. Vegetable cactus pear (Opuntia spp.). In Underutilized Crops, Pulses and Vegetables; Chapman and Hall: London, UK, 1993; pp. 177–191. [Google Scholar]
  35. Le Houérou, H.N. The role of cacti (Opuntia spp.) in erosion control, land reclamation, rehabilitation agricole and agricultural development in the Mediterranean Basin. J. Arid Environ. 1996, 33, 135–159. [Google Scholar] [CrossRef]
  36. Guenang, G.M.; Kamga, F.M. Computation of the Standardized Precipitation Index (SPI) and Its Use to Assess Drought Occurrences in Cameroon over Recent Decades. J. Appl. Meteorol. Climatol. 2014, 53, 2310–2324. [Google Scholar] [CrossRef]
  37. Mann, H.B. Nonparametric tests against trend. Econometrica 1945, 13, 245–259. [Google Scholar] [CrossRef]
  38. Gocic, M.; Trajkovic, S. Analysis of changes in meteorological variables using Mann-Kendall and Sen’s slope estimator statistical tests in Serbia. Glob. Planet Chang. 2013, 100, 172–182. [Google Scholar] [CrossRef]
  39. UNEP World Atlas of Desertification. 1992. Available online: https://wad.jrc.ec.europa.eu/patternsaridity (accessed on 30 September 2019).
  40. Le Houérou, H.N.; Hoste, C.H. Rangeland production and annual rainfall relations in the Mediterranean Basin and in the African Sahelo-Sudanian zone. J. Range Manag. 1977, 30, 181–189. [Google Scholar] [CrossRef]
  41. Le Houérou, H.N. An assessment of the economic feasibility of fodder shrubs plantation (with particular reference to Africa). In The Biology and Utilization of Shrubs; McKell, C.M., Ed.; Academic Press: New York, NY, USA, 1989; pp. 603–630. [Google Scholar]
  42. Yasutomi, N.; Hamada, A.; Yatagai, A. Development of a long-term daily gridded temperature dataset and its application to rain/snow discrimination of daily precipitation. Glob. Environ. Res. 2011, 15, 65–172. [Google Scholar]
  43. Harris, I.; Jones, P.D.; Osborn, T.J.; Lister, D.H. Updated high-resolution grids of monthly climatic observations—The CRU TS3.10 dataset. Int. J. Climatol. 2014, 34, 623–642. [Google Scholar] [CrossRef]
  44. Monjauze, A.; LeHouerou, H.N. Le role des Opuntia dans I’ Economic Nord Africaine; Bulletin de I’Ecole National Superieure d’Agriculture de Tunis; de I’Ecole National Superieure d’Agriculture de Tunis: Tunis, Tunisia, 1965; Volume 8–9, pp. 85–164. [Google Scholar]
  45. Peyre De Fabregues, B. Les Cactées Fourragères Dans le Nord-Est Brésilien; Institut D’élevage et de Médecine Vétérinaire des Pays Tropicaux: Maisons-Alfort, France, 1966. [Google Scholar]
  46. Le Houérou, H.N. Drought-Tolerant and Water-Efficient Fodder Shrubs (DTFS), Their Role as a “Drought Insurance” in the Agricultural Development of Arid and Semi-Arid Zones in Southern Africa; Report to the Water Research Commission of South Africa; Water Research Commission Pretoria: Pretoria, South Africa, 1994. [Google Scholar]
  47. Bot, A.; Benites, J. The Importance of Soil Organic Matter Key to Drought-Resistant Soil and Sustained Food Production; FAO Soils Bulletin 80; Food and Agriculture Organization of the United Nations: Rome, Italy, 2005. [Google Scholar]
  48. Vaidya, O.S.; Kumar, S. Analytic hierarchy process: An overview of applications. Eur. J. Res. 2006, 169, 1–29. [Google Scholar] [CrossRef]
  49. Chivasa, W.; Mutanga, O.; Biradar, C. Mapping land suitability for maize (Zea mays L.) production using GIS and AHP technique in Zimbabwe. S. Afr. J. Geomat. 2019, 8, 249–265. [Google Scholar]
  50. Saaty, T.L. Decision making with the analytic hierarchy process. Int. J. Serv. Sci. 2008, 1, 83–98. [Google Scholar] [CrossRef]
  51. Saaty, T.L. The Analytic Hierarchy Process; McGraw Hill: New York, NY, USA, 1980. [Google Scholar]
  52. Pramanik, M.K. Site suitability analysis for agricultural land use of Darjeeling district using AHP and GIS techniques. In Modeling Earth Systems and Environment; Springer: Cham, Switzerland, 2016; Volume 2, pp. 1–22. [Google Scholar]
  53. Nobel, P.S.; De la Barrera, E. Tolerances and acclimation to low and high temperatures for cladodes, fruits and roots of a widely cultivated cactus. Opuntia Ficus-Indic. New Phytol. 2003, 157, 271–279. [Google Scholar] [CrossRef]
  54. Thenkabail, P.S.; Knox, J.W.; Ozdogan, M.; Gumma, M.K.; Congalton, R.G.; Wu, Z.; Milesi, C.; Finkral, A.; Marshall, M.; Mariotto, I.; et al. Assessing future risks to agricultural productivity, water resources and food security: How can remote sensing help. Photogramm. Eng. Remote Sens. 2012, 78, 773–782. [Google Scholar]
  55. Teluguntla, P.; Thenkabail, P.S.; Xiong, J.; Gumma, M.K.; Giri, C.; Milesi, C.; Ozdogan, M.; Congalton, R.G.; Tilton, J. Global food security support analysis data (GFSAD) at nominal 1 km (GCAD) derived from remote sensing in support of food security in the twenty-first century: Current achievements and future possibilities. In Land Resources Monitoring, Modeling and Mapping with Remote Sensing; CRC Press: Boca Raton, FL, USA, 2015; pp. 131–160. [Google Scholar]
  56. Roy, P.S.; Meiyappan, P.; Joshi, P.K.; Kale, M.P.; Srivastav, V.K.; Srivasatava, S.K.; Behera, M.D.; Roy, A.; Sharma, Y.; Ramachandran, R.M.; et al. Decadal Land Use and Land Cover Classifications across India, 1985, 1995, 2005; ORNL DAAC: Oak Ridge, TN, USA, 2016. [Google Scholar] [CrossRef]
  57. Kumar, K.K.; Kumar, K.R.; Ashrit, R.G.; Deshpande, N.R.; Hansen, J.W. Climate impacts on Indian agriculture. Int. J. Climatol. 2004, 24, 1375–1393. [Google Scholar] [CrossRef]
  58. Mondal, A.; Deepak, K.; Sananda, K. Spatial and temporal analysis of rainfall and temperature trend of India. Theor. Appl. Climatol. 2015, 122, 143–158. [Google Scholar] [CrossRef]
Figure 1. The methodological flow of the analytical hierarchical process (AHP) demonstrating the interlinkages of the various factors influencing the growth of cactus in arid and semi-arid environments. The land use land cover (LULC) database represents the Land use/land cover.
Sustainability 11 05897 g001
Figure 2. The spatial distribution of cactus-suitable areas throughout India. A web-mapping application (Supplement Figure S2) at the Google Earth Engine App platform was developed related to the land suitability for cactus cultivation. The application shows percentage of land suitable for cactus under different suitable classes. Note: The suitability scale is given on the right hand side of the figure.
Sustainability 11 05897 g002
Figure 3. Spatial distribution of the area suitable for cactus masked by the cropland layer across India using global cropland data. Note: The colour scale on the right hand side of the figure is the suitability scale for growing cactus.
Sustainability 11 05897 g003
Figure 4. Spatial distribution of cactus suitability over marginal lands—(a) Barren land and (b) Wastelands in India. Note—The suitability scale is on the right hand side of the figure.
Sustainability 11 05897 g004
Figure 5. Spatio-temporal variation of precipitation anomalies in India, derived from TRMM 3B43 data for the period 2008 to 2017 based on the long term average and standard deviation of 2000 to 2017.
Sustainability 11 05897 g005
Figure 6. Hovmoller plot to show the time series variation of precipitation anomalies along the (a) latitudinal and (b) longitudinal bands based on long term TRMM 3B43 precipitation data for the period of 2000 to 2017.
Sustainability 11 05897 g006
Figure 7. (a) Mean monthly precipitation derived from the time series TRMM 3B43 data and averaged over 2000-17 (b) Kendall’s tau showing the increasing and decreasing trends in annual precipitation. Note—The dots here represent significant increasing or decreasing trends at the 0.05 significance level (p-value = 0.05).
Sustainability 11 05897 g007
Figure 8. Spatio-temporal variation in the AI for India from 2001 to 2014 based on MODIS-derived potential evapotranspiration and TRMM-derived precipitation.
Sustainability 11 05897 g008
Figure 9. Variation of cactus suitability based on the changing amount of precipitation from 2008 to 2017. Note—The suitability colour scale is on the right hand side of the figure.
Sustainability 11 05897 g009
Figure 10. Regression coefficient showing the spatial linear trend of cactus suitability as the aridity index (AI) increases.
Sustainability 11 05897 g010
Table 1. Details of input raster data and their sources.
VariablesDatasetResolutionAveraged OverSource
PrecipitationTRMM0.25 deg2000-07https://giovanni.gsfc.nasa.gov/giovanni
Minimum temperatureCRU monthly data0.25 deg2000-07http://data.ceda.ac.uk/badc/cru/data/cru_ts/cru_ts_3.24.01/
Maximum temperatureCRU monthly data0.25 deg2000-07http://data.ceda.ac.uk/badc/cru/data/cru_ts/cru_ts_3.24.01/
Mean temperatureAPHRODITE mean temperature data0.25 deg2000-07http://search.diasjp.net/en/dataset/AphroTemp
Annual relative humidityAIRS data1 deg2003-10https://giovanni.gsfc.nasa.gov/giovanni/
Soil salinityHarmonized world soil database0.0083 degNot req.http://www.fao.org/soils-portal/soil-survey/soil-maps-and-databases/harmonized-world-soil-database-v12/en/
Soil textureHarmonized world soil database0.0083 degNot req.-do-
Soil pHHarmonized world soil database0.0083 degNot req.-do-
Soil organic matterHarmonized world soil database0.0083 degNot req.-do-
Table 2. Weights of the major and sub-criteria following AHP.
Main CriteriaWeightCICRSub-CriteriaReclassified ValueWeightCICR
Precipitation (mm/year)0.110.110.08>100050.05
800–100040.290.0740.066
400–80030.53
250–40020.09
<25010.04
Minimum temperature (°C)0.18 > 30.670.0230.039
>−5 °C to 520.27
>−510.06
Maximum temperature (°C)0.10 >4130.110.0150.027
5 to 4120.81
<510.08
Mean temperature (°C)0.13 >2350.100.1000.089
18−2340.49
15−1830.26
10−1520.13
<1010.03
Annual relative humidity (%)0.02 >6030.750.0260.045
40−6020.18
<4010.07
Soil salinity (EC dS/m)0.06 >740.060.0110.012
4 to 730.13
2−420.22
<210.59
Soil texture0.30 clay (heavy)10.020.1410.098
clay(light)20.02
clay loam30.02
silty loam40.09
loam50.14
sandy clay loam60.05
sandy loam70.22
loamy sand80.20
sandy90.24
Soil pH0.05 >830.09<0.01<0.001
5 to 820.82
<510.09
Soil organic matter (% weight)0.05 >240.220.0690.077
1–230.53
0.5–120.19
<0.510.06
Table 3. Land distribution under suitability classes. The units are in square kilometres.
StatesSuitability Class
Very Low SuitabilityLow SuitabilityMarginal SuitabilityModerate SuitabilityHigh Suitability
Andhra Pradesh-3844.7772,976.7873,261.292725.83
Arunachal Pradesh38.9404521,552.3545,921.9113,745.981.59
Assam-14,956.3157,282.996049.281873.11
Bihar--83,317.4613,144.39-
Chhattisgarh-13,629.1630,951.389,359.58771.66
Delhi--113.641474.97-
Goa--2399.211037.88-
Gujarat-22,437.64126,795.6626,651.167789.68
Haryana-70.7321,096.9819,711.025966.63
Himachal Pradesh953.643626,726.6610,505.1813,095.121713.38
Jammu & Kashmir13,958.16121,839.160,179.683890.873368.75
Jharkhand-3126.3655,676.8921,503.07599.21
Karnataka-6332.19115,323.3361,574.38-
Kerala-201.0630,440.35407.16-
Madhya Pradesh-179,060.8995,183.1736,480.0595.36
Maharashtra-148,901.91142,932.19898.82-
Manipur-1720.539454.5811,384.92-
Meghalaya-2373.7818,021.482575.63-
Mizoram--11,295.119738.29-
Nagaland-2618.5512,588.891637.09-
Orissa-7809.5543,550.5299,959.33983.05
Punjab-1707.0219,099.133,113.68253.51
Rajasthan3977.48947,875.2965,558.23194,080.7843,049.06
Sikkim-4354.971334.31407.6815.89
Tamil Nadu-5444.5191,760.3816,862.88398.42
Telangana-22,473.4160,187.6329,221.23-
Tripura--6507.033768.48-
Uttar Pradesh-297.22120,997.51127,350.361001.33
Uttaranchal93.7749527,119.2420,961.886113.65-
West Bengal-7617.2358,606.9616,594.992725.04
Total (in Sq. Km)19,022694,090.431,491,020.19949,093.9381,331.50
Total (in %)0.5921.4646.1029.342.51

