Smartphone-Based Data Collection System for Repetitive Concrete Temperature Monitoring in High-Rise Building Construction

Abstract
:1. Introduction
2. Literature Review
2.1. Monitoring System for Concrete Temperature
2.2. Data Collection Systems Using Smartphones
3. A Smartphone-Based Data Collection System (S-DCS)
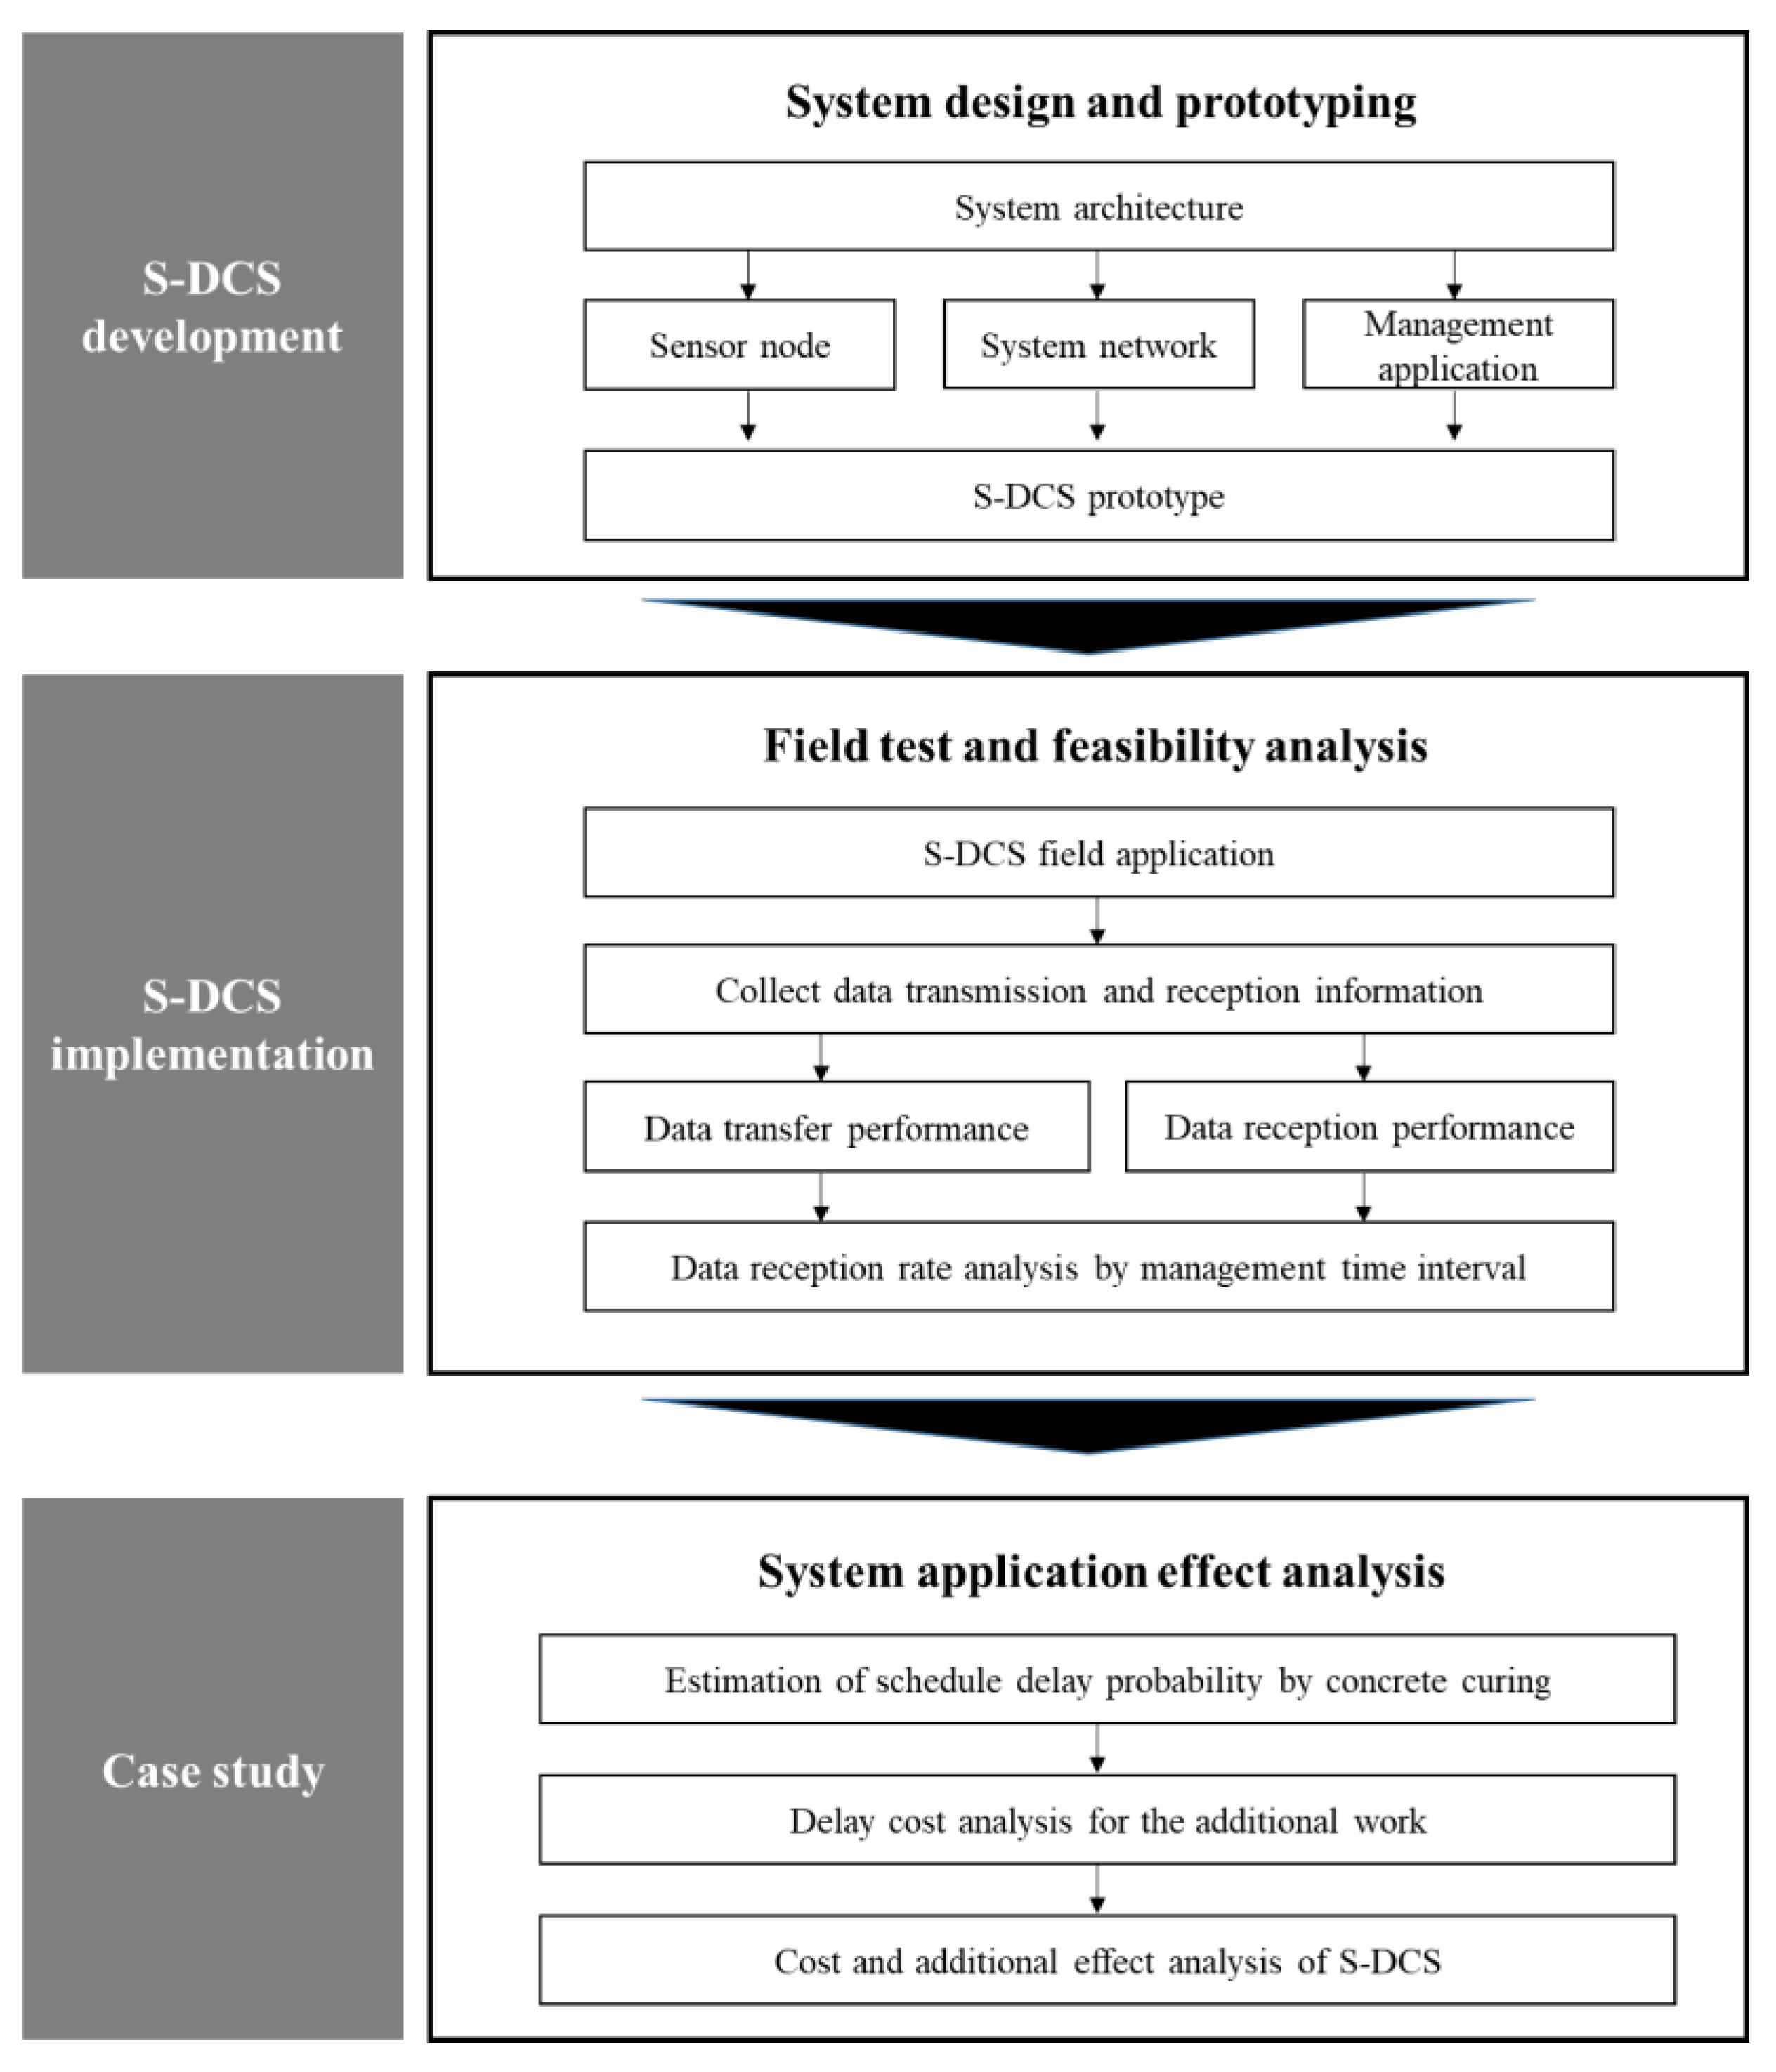
3.1. Research Method
3.2. System Architecture
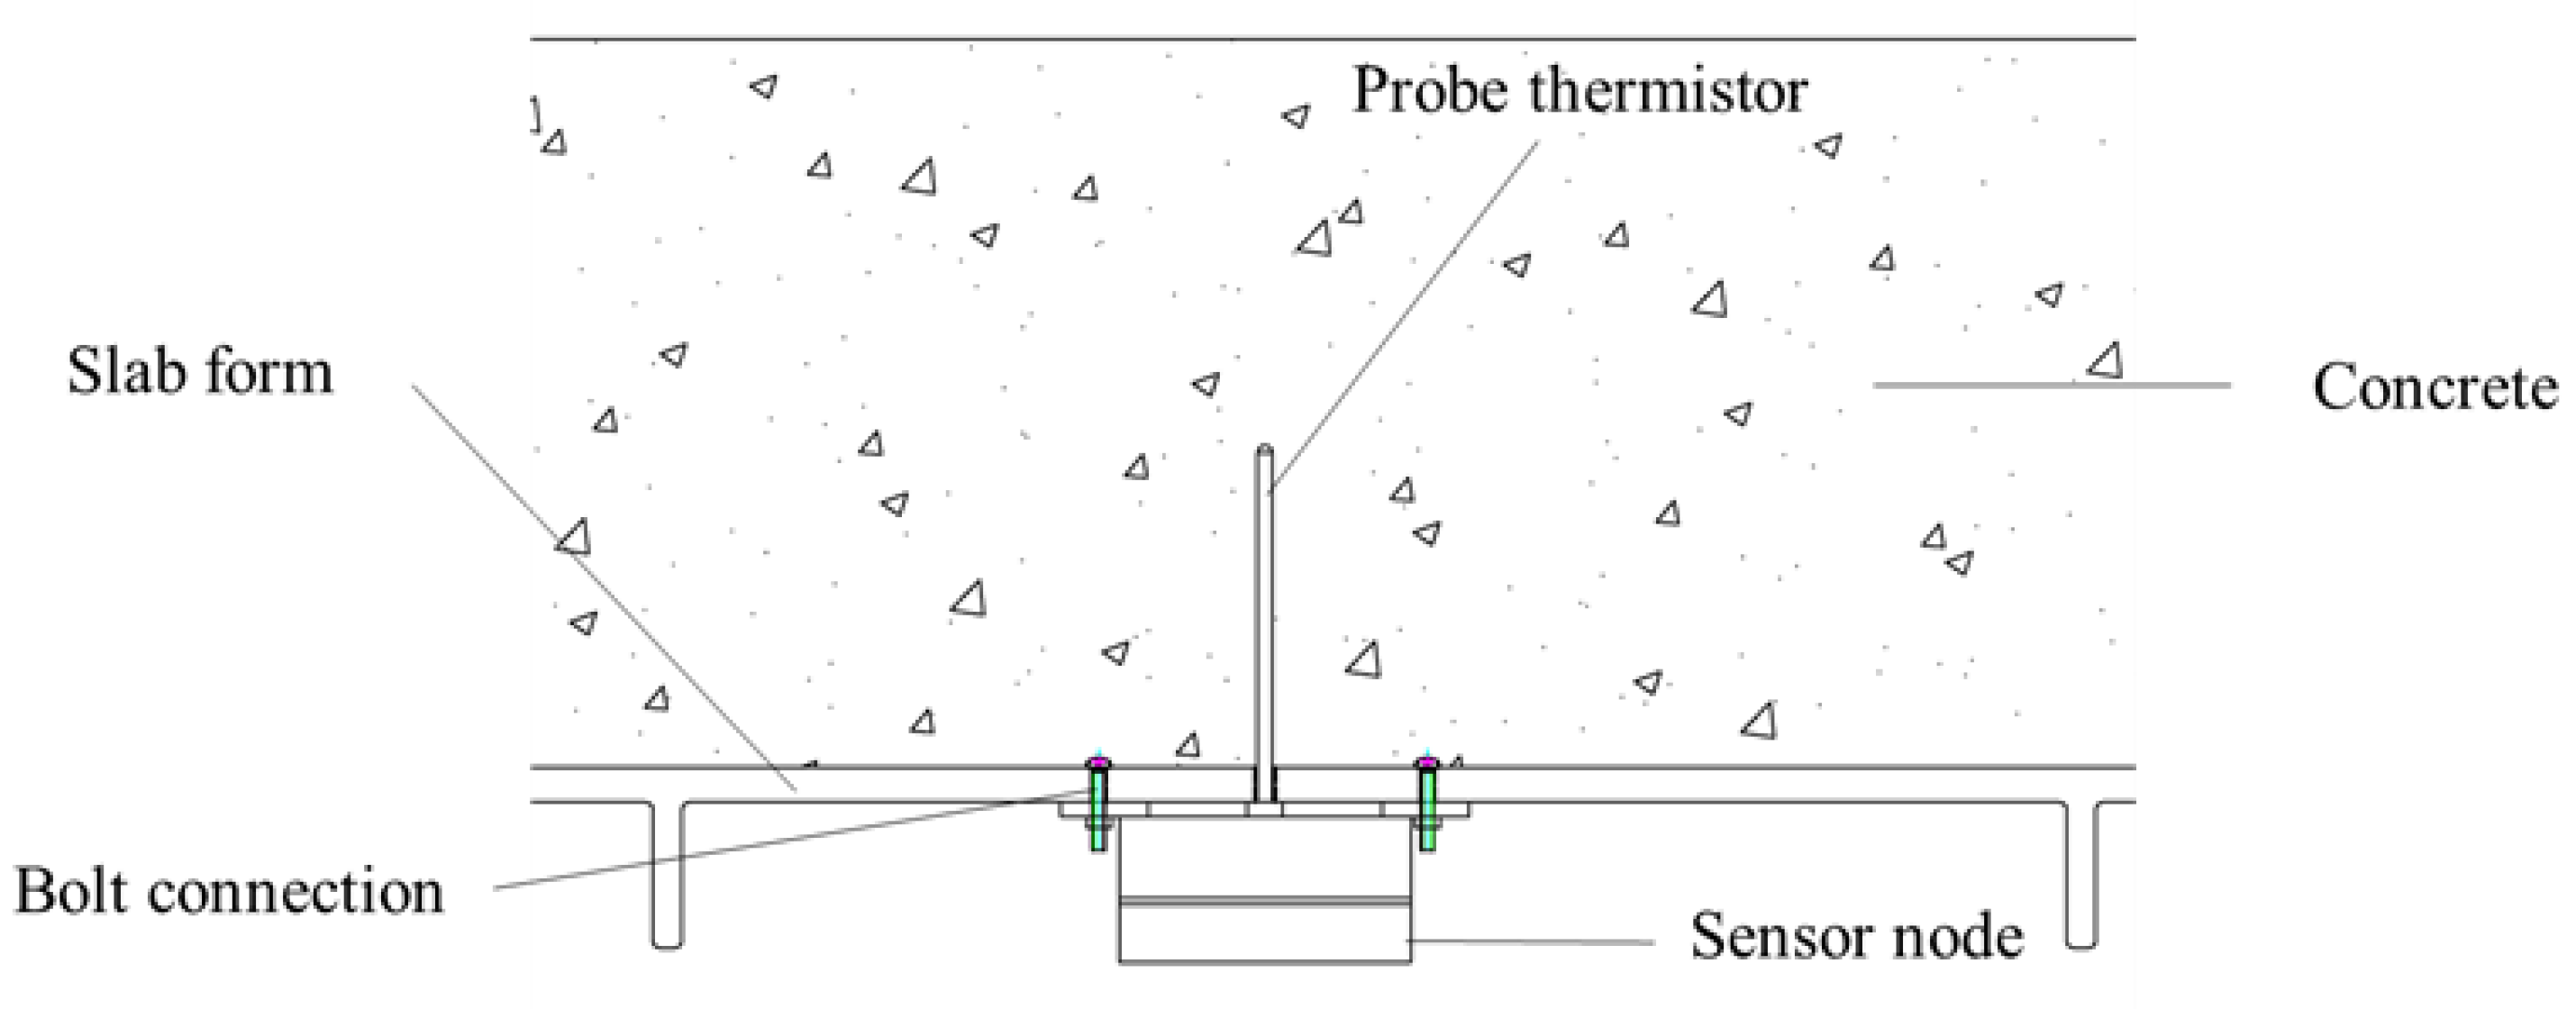
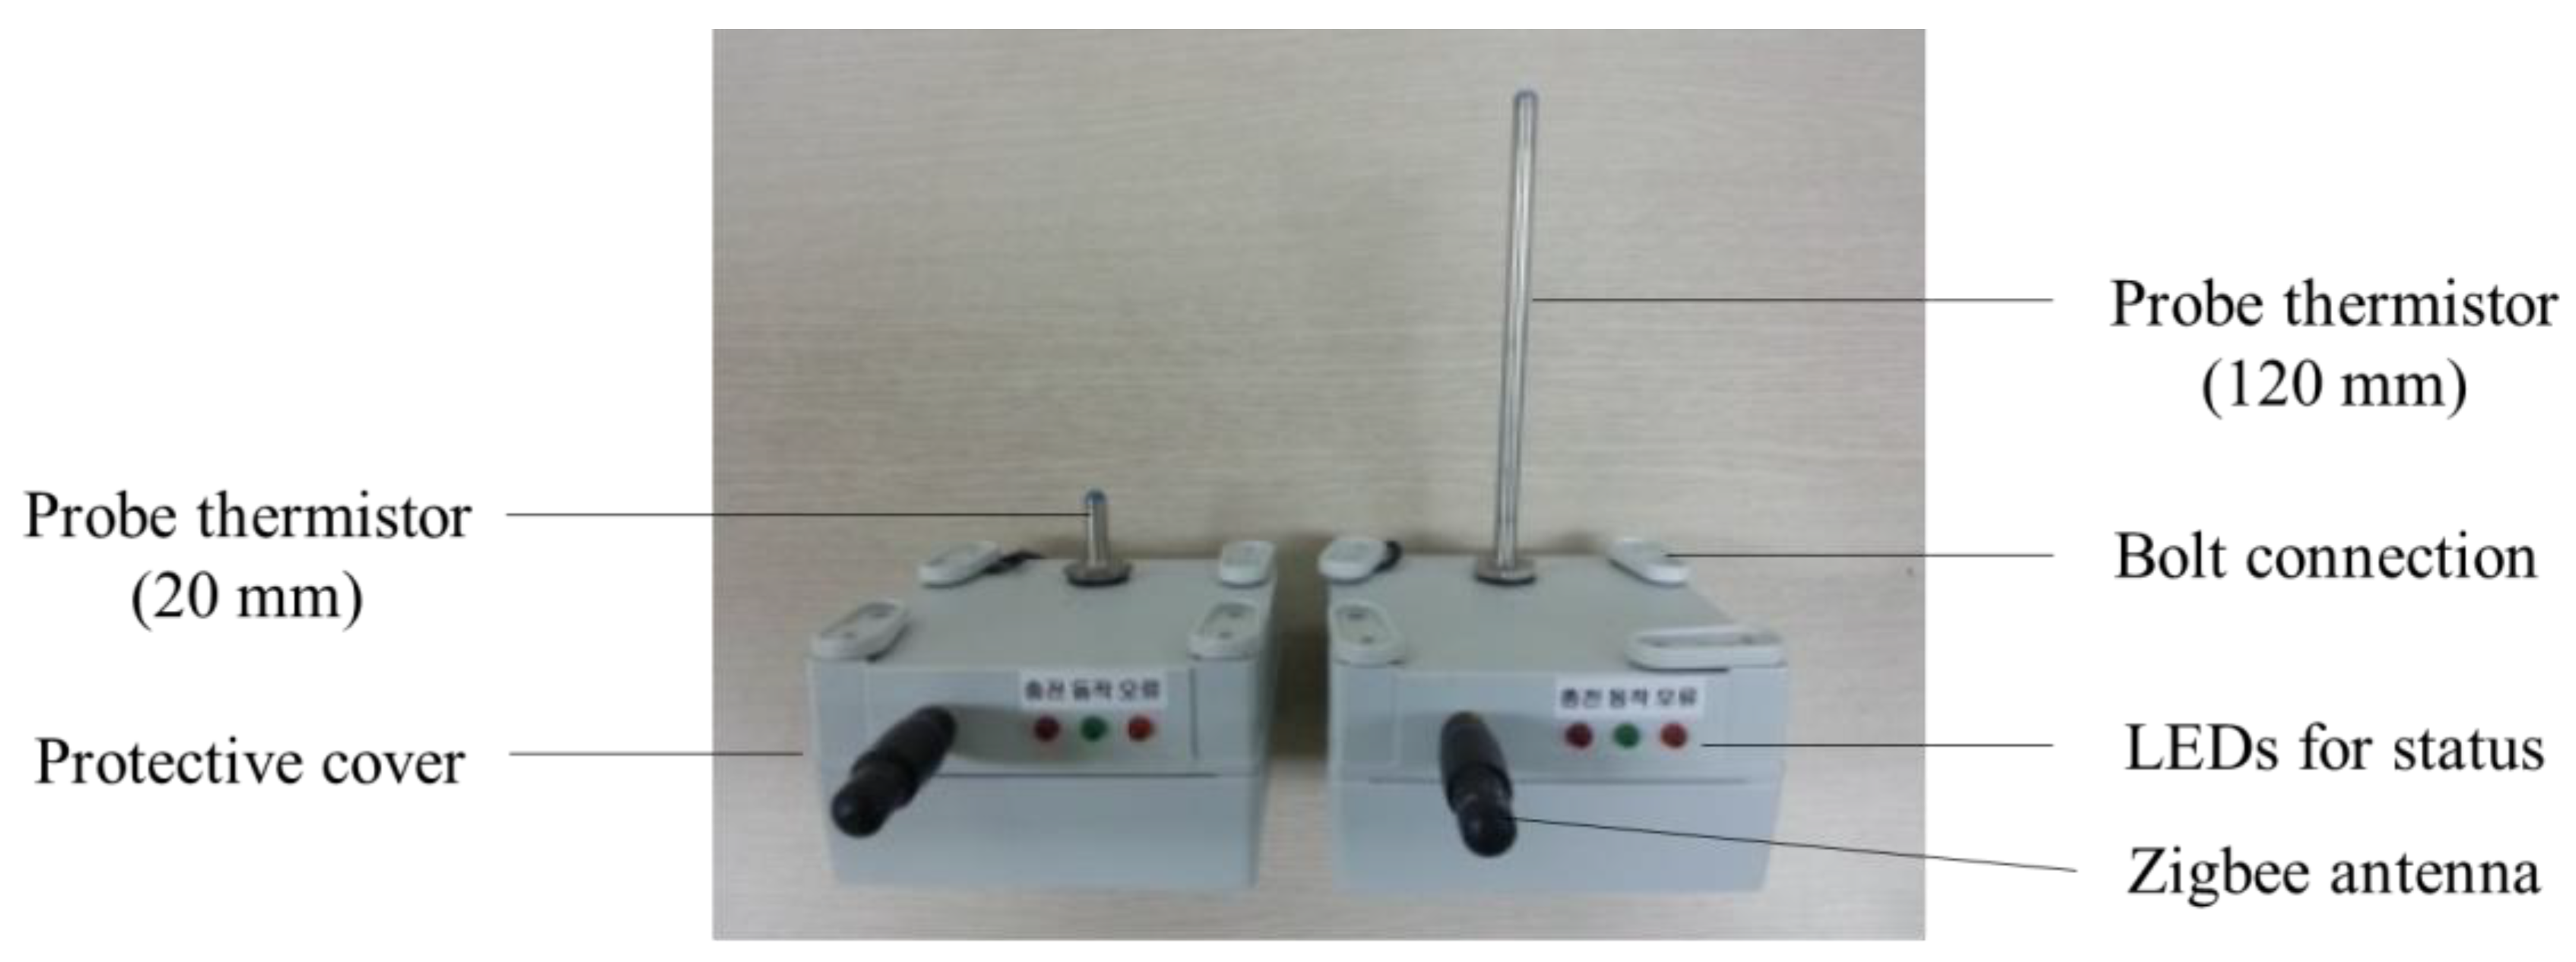
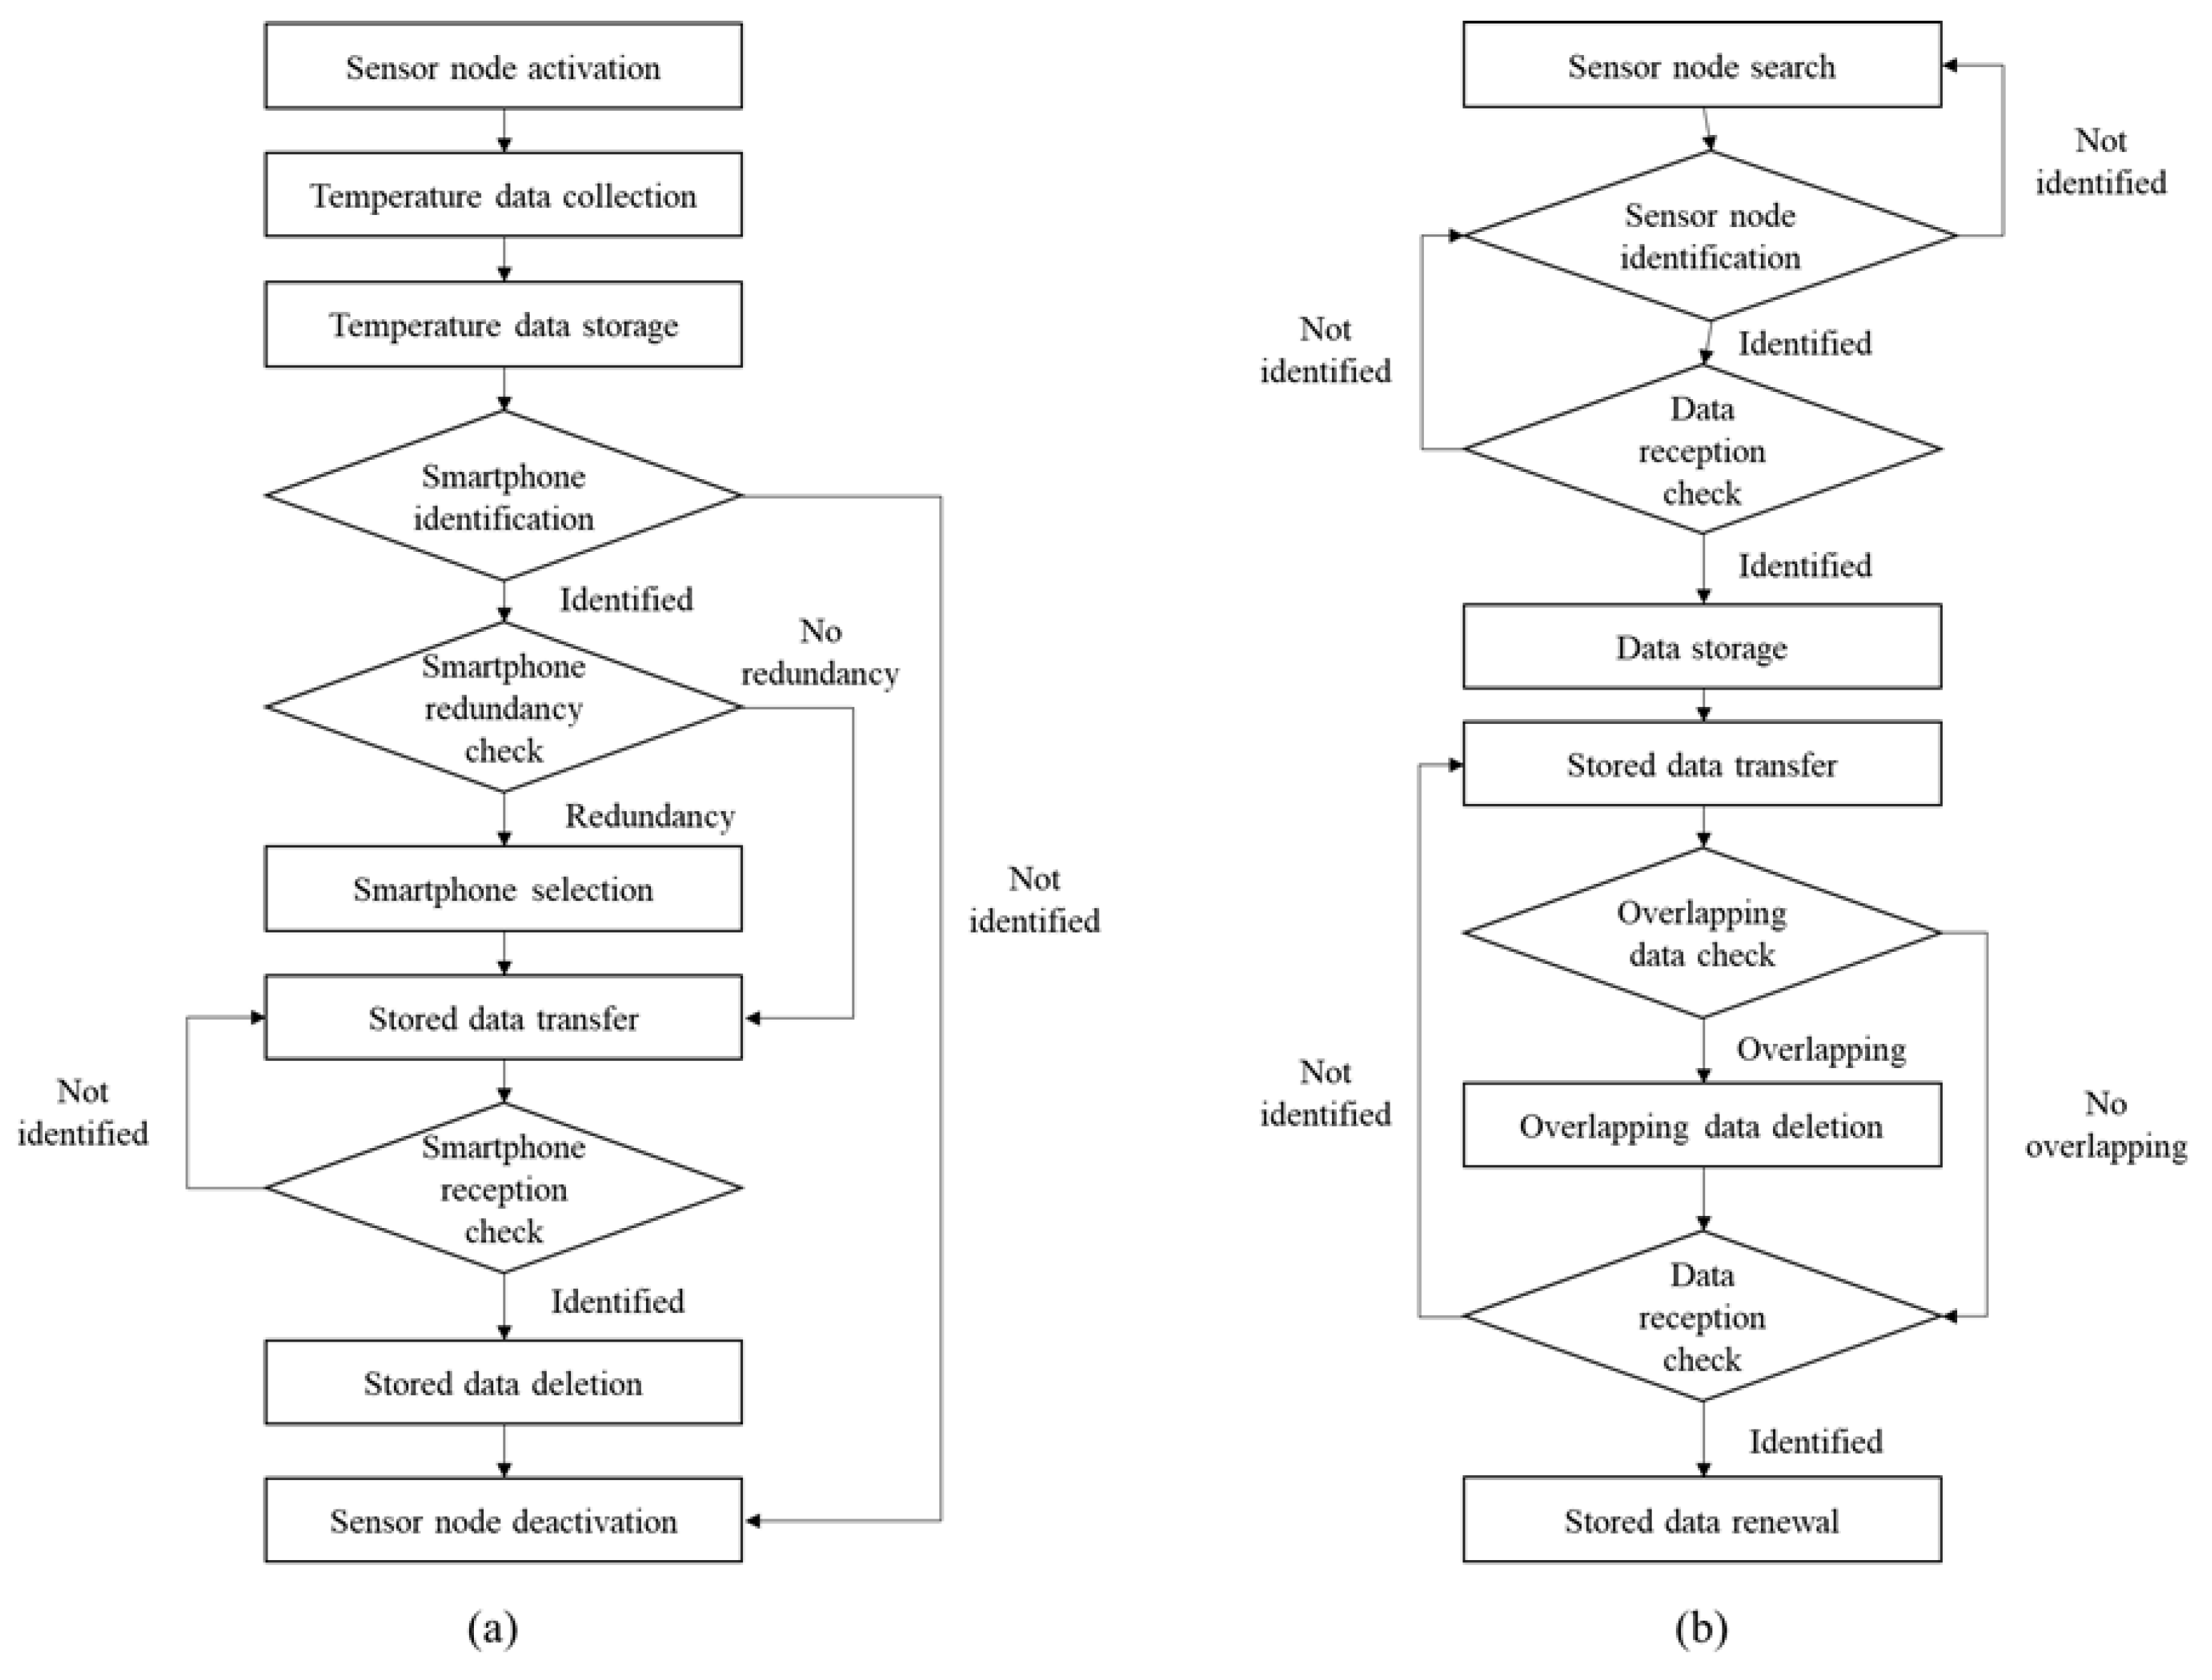
3.3. Sensor Node
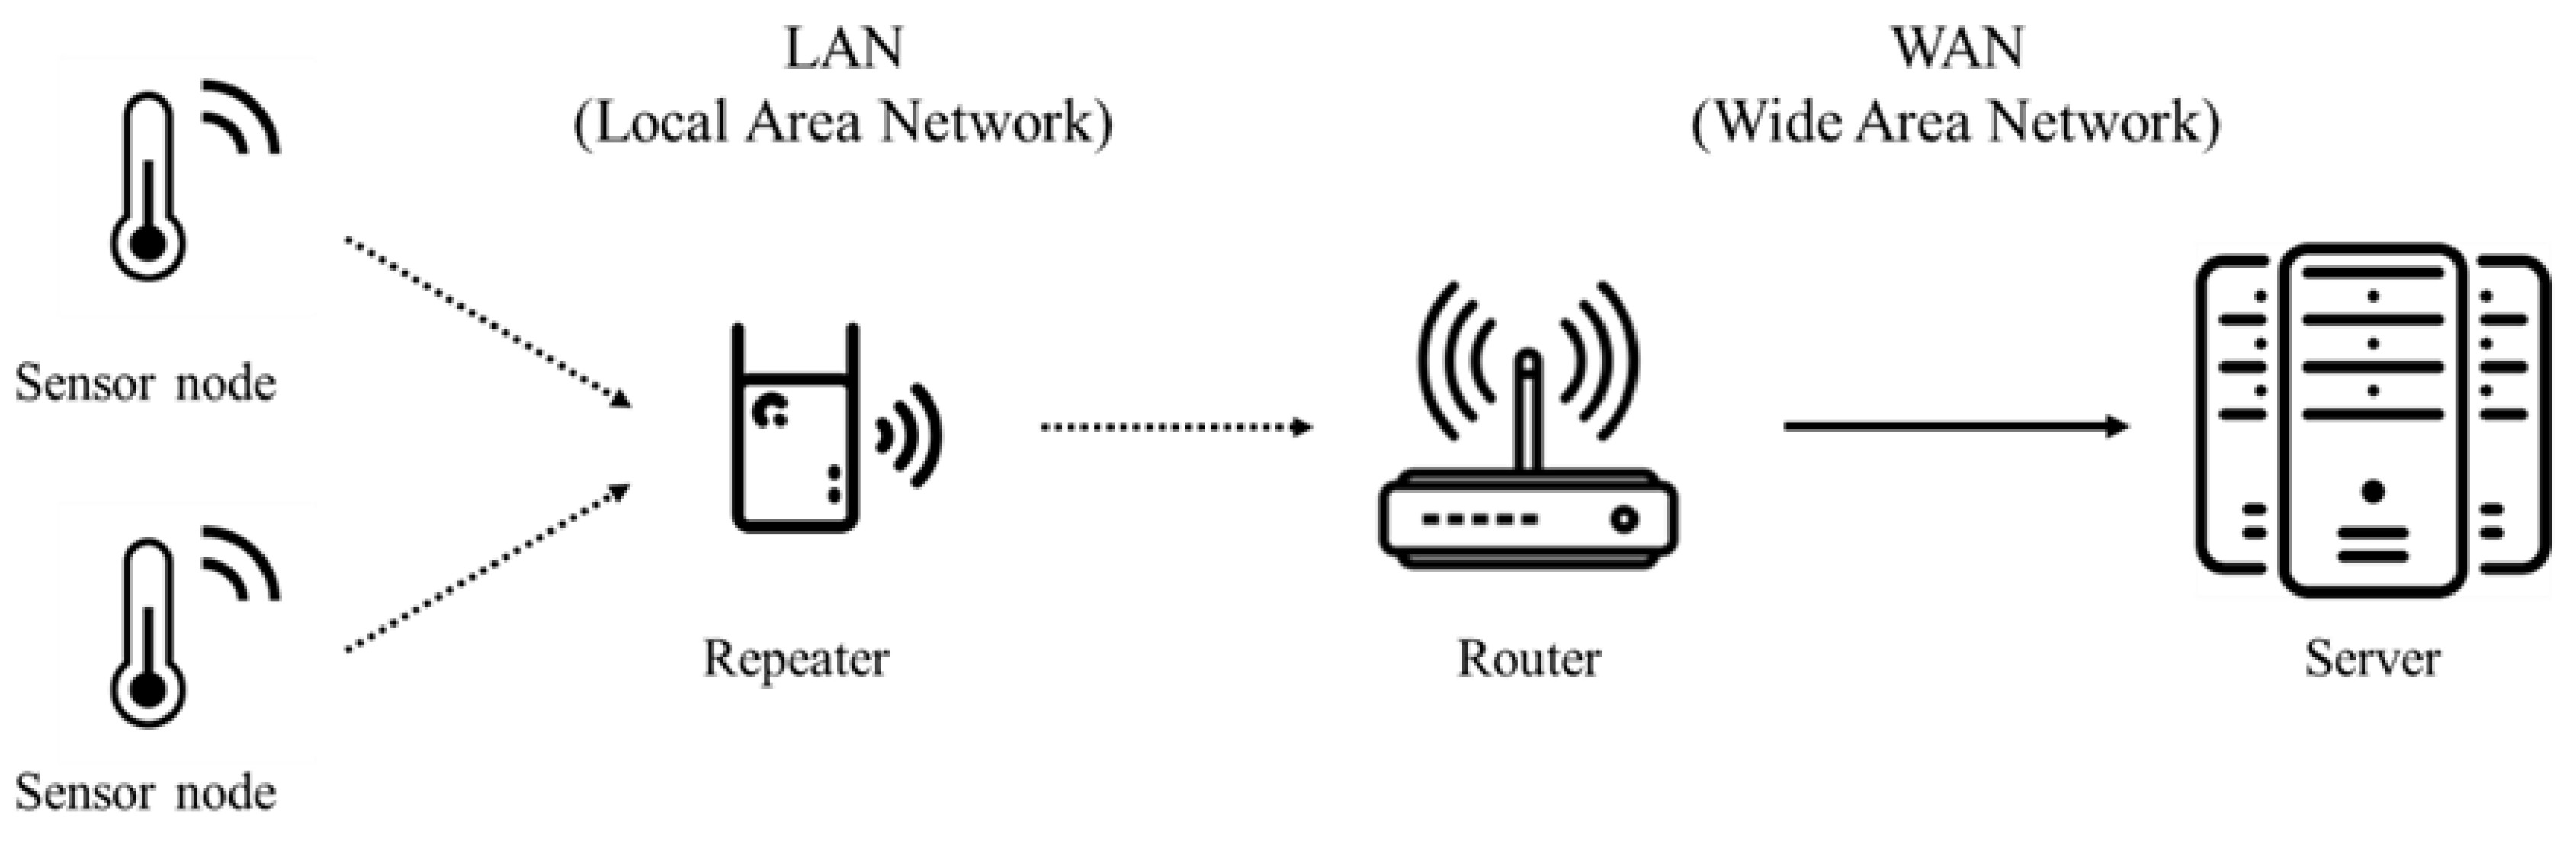
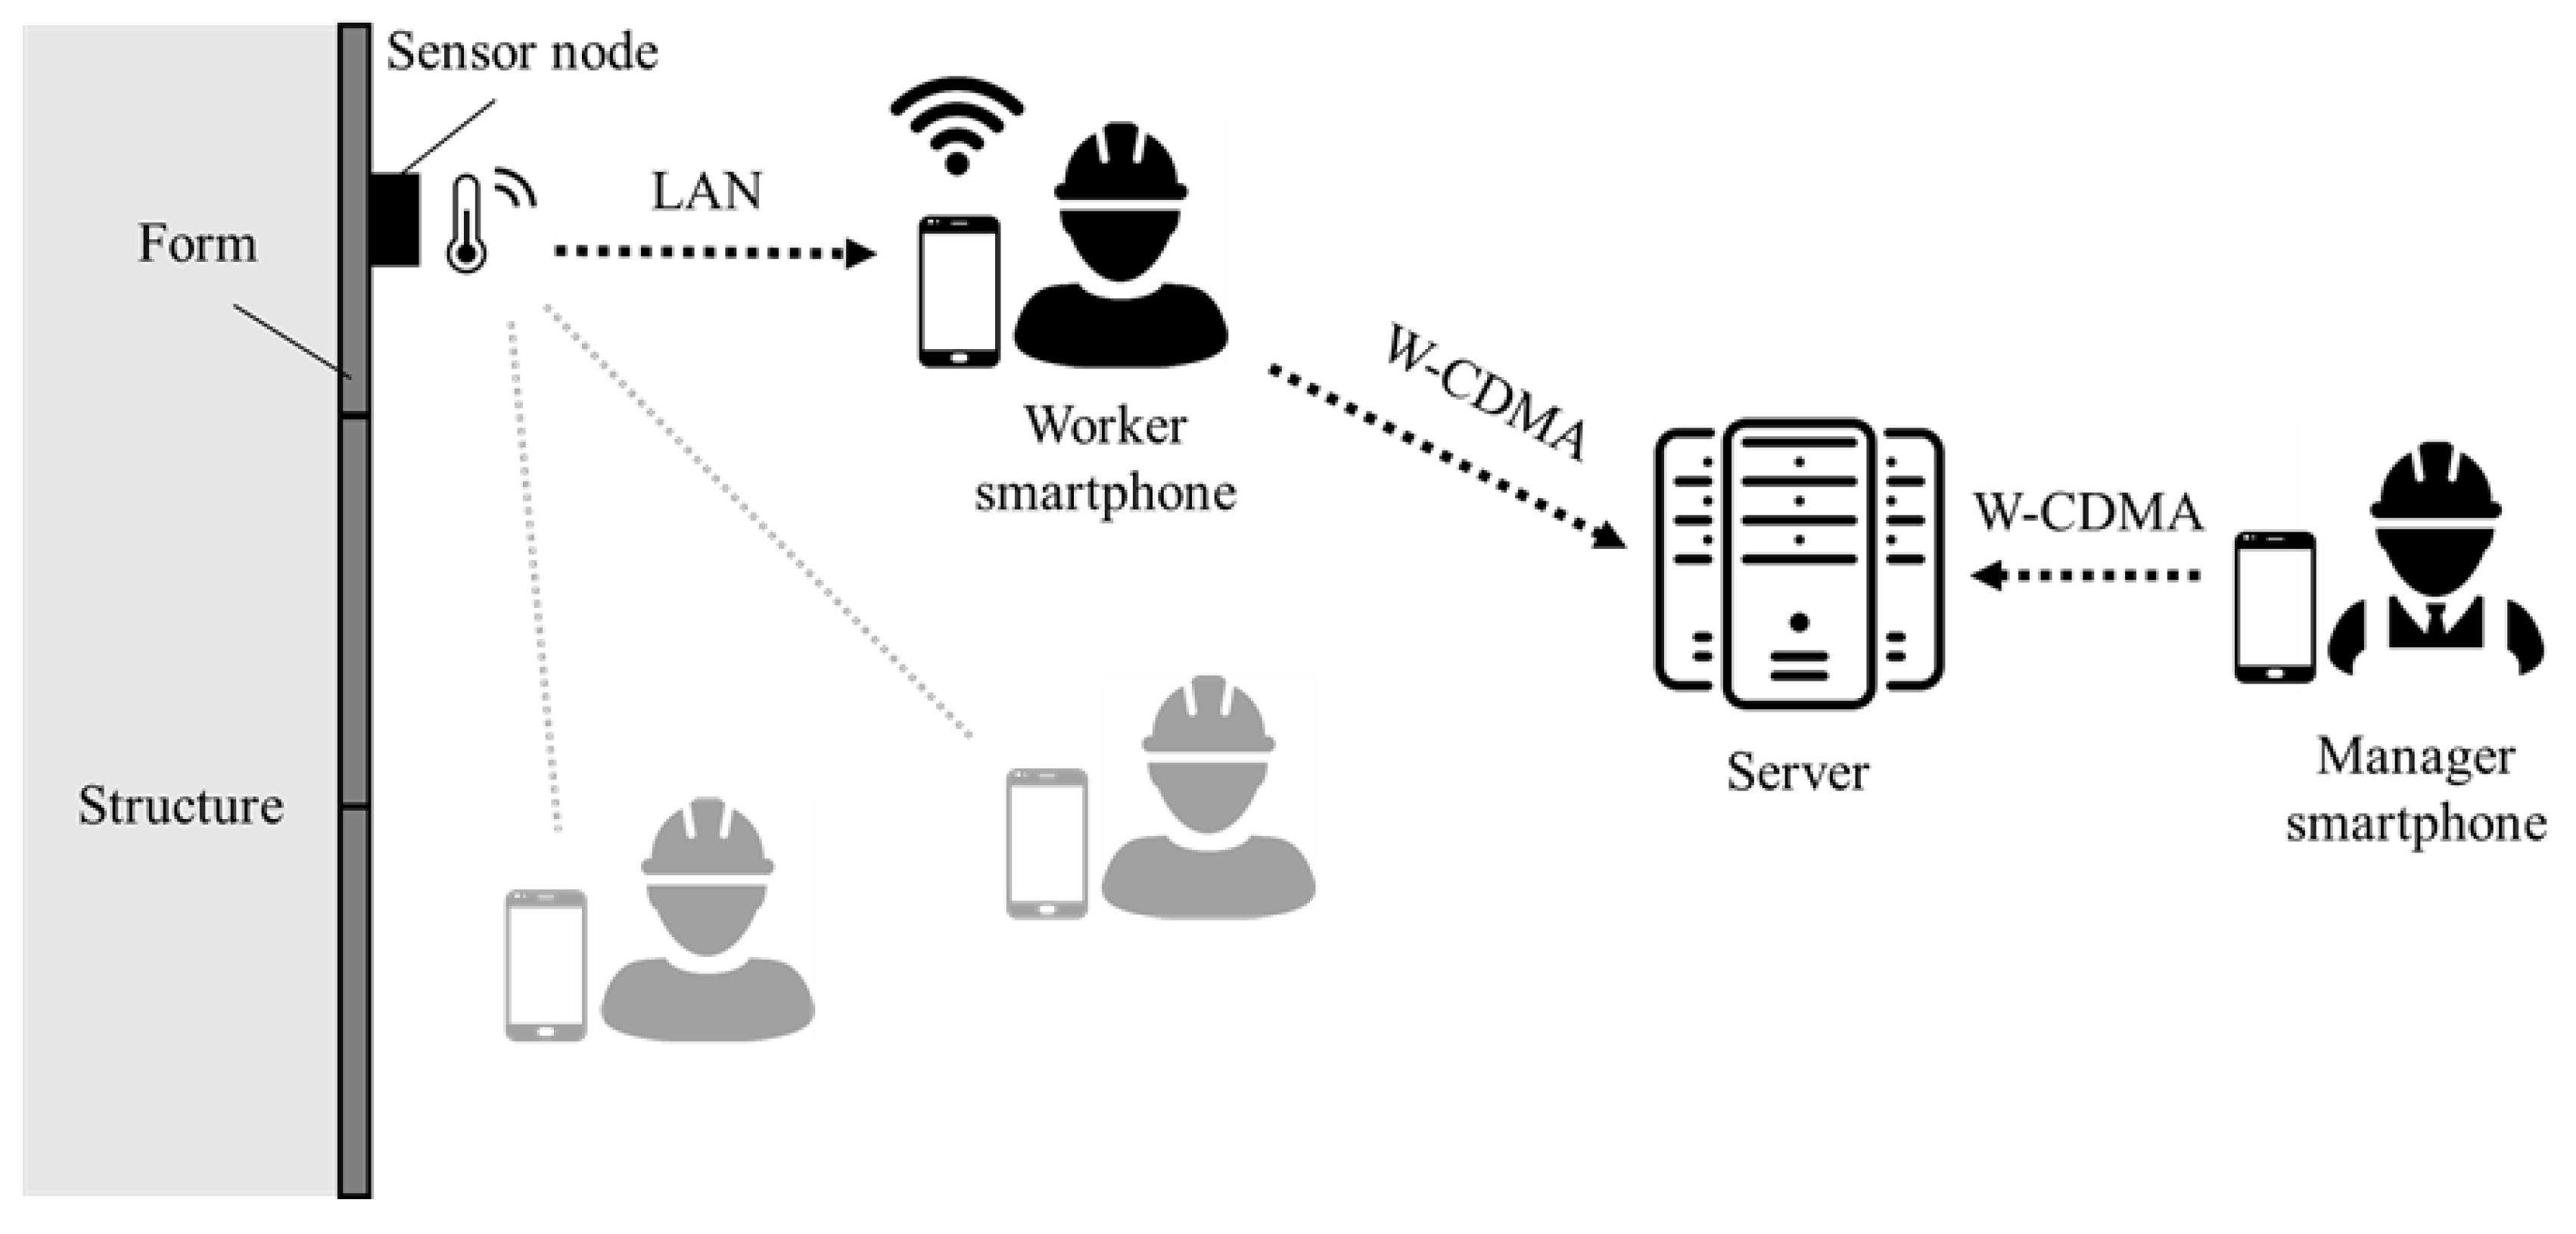
3.4. System Network
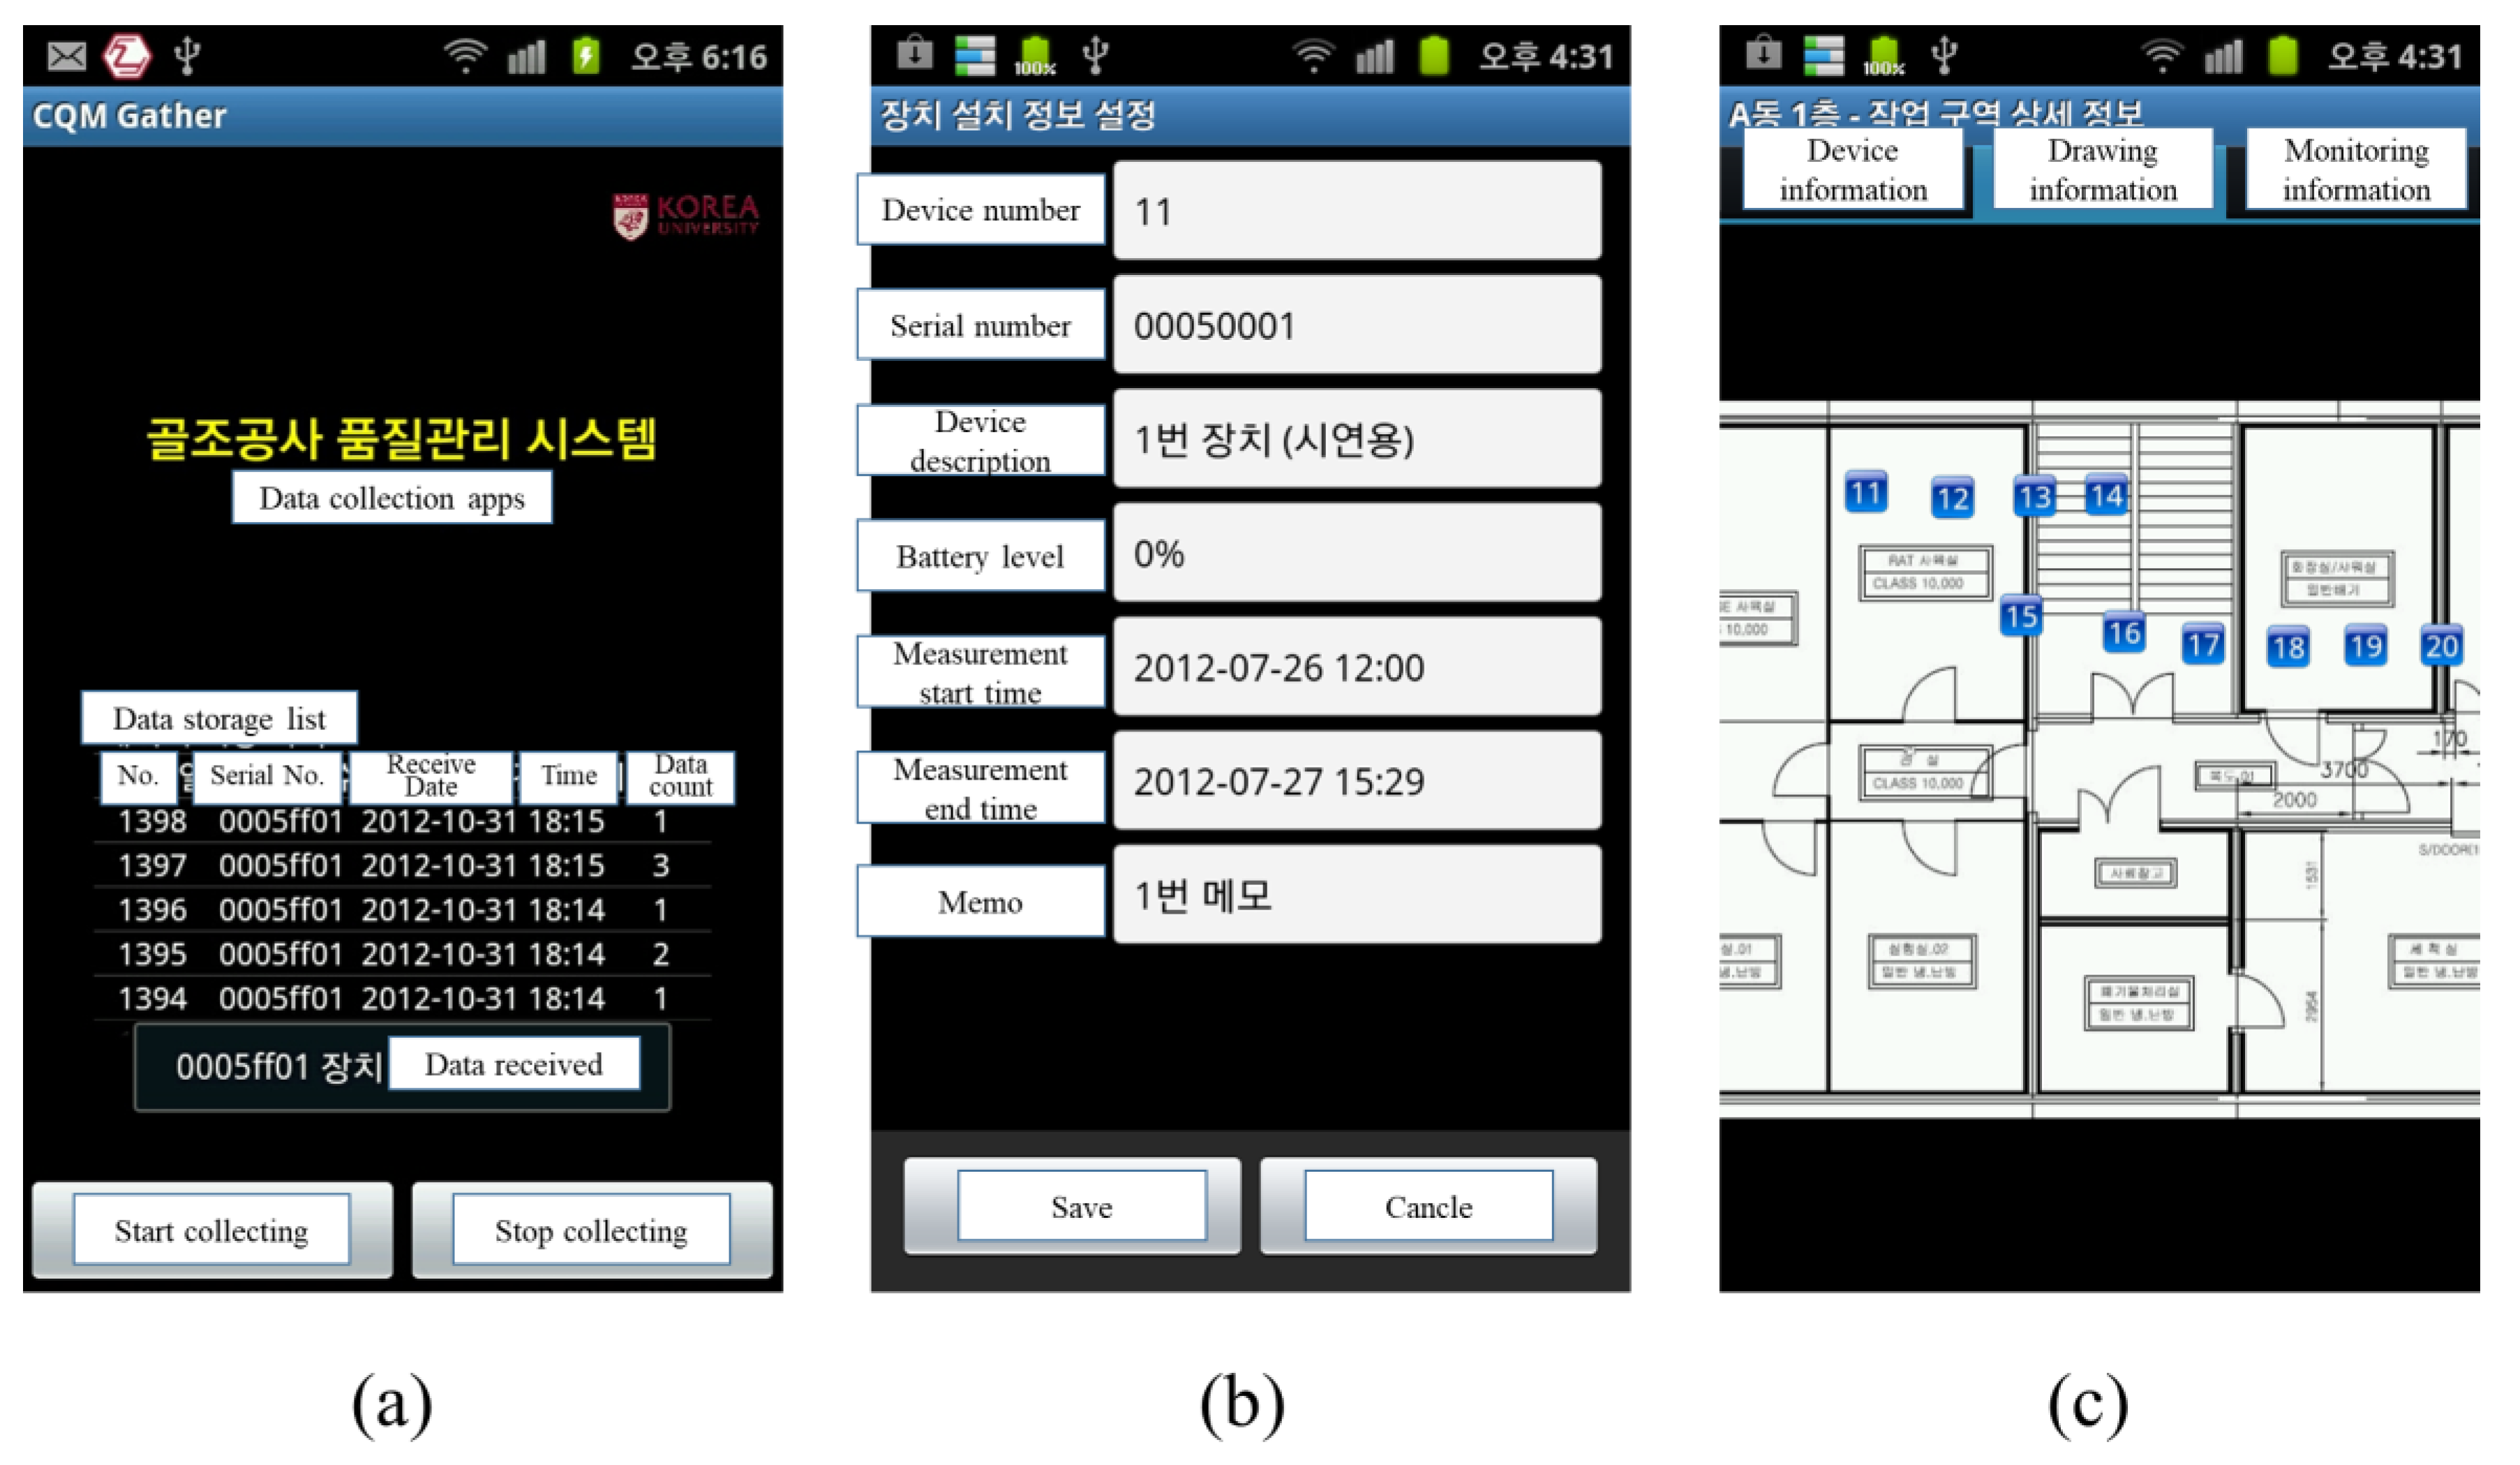
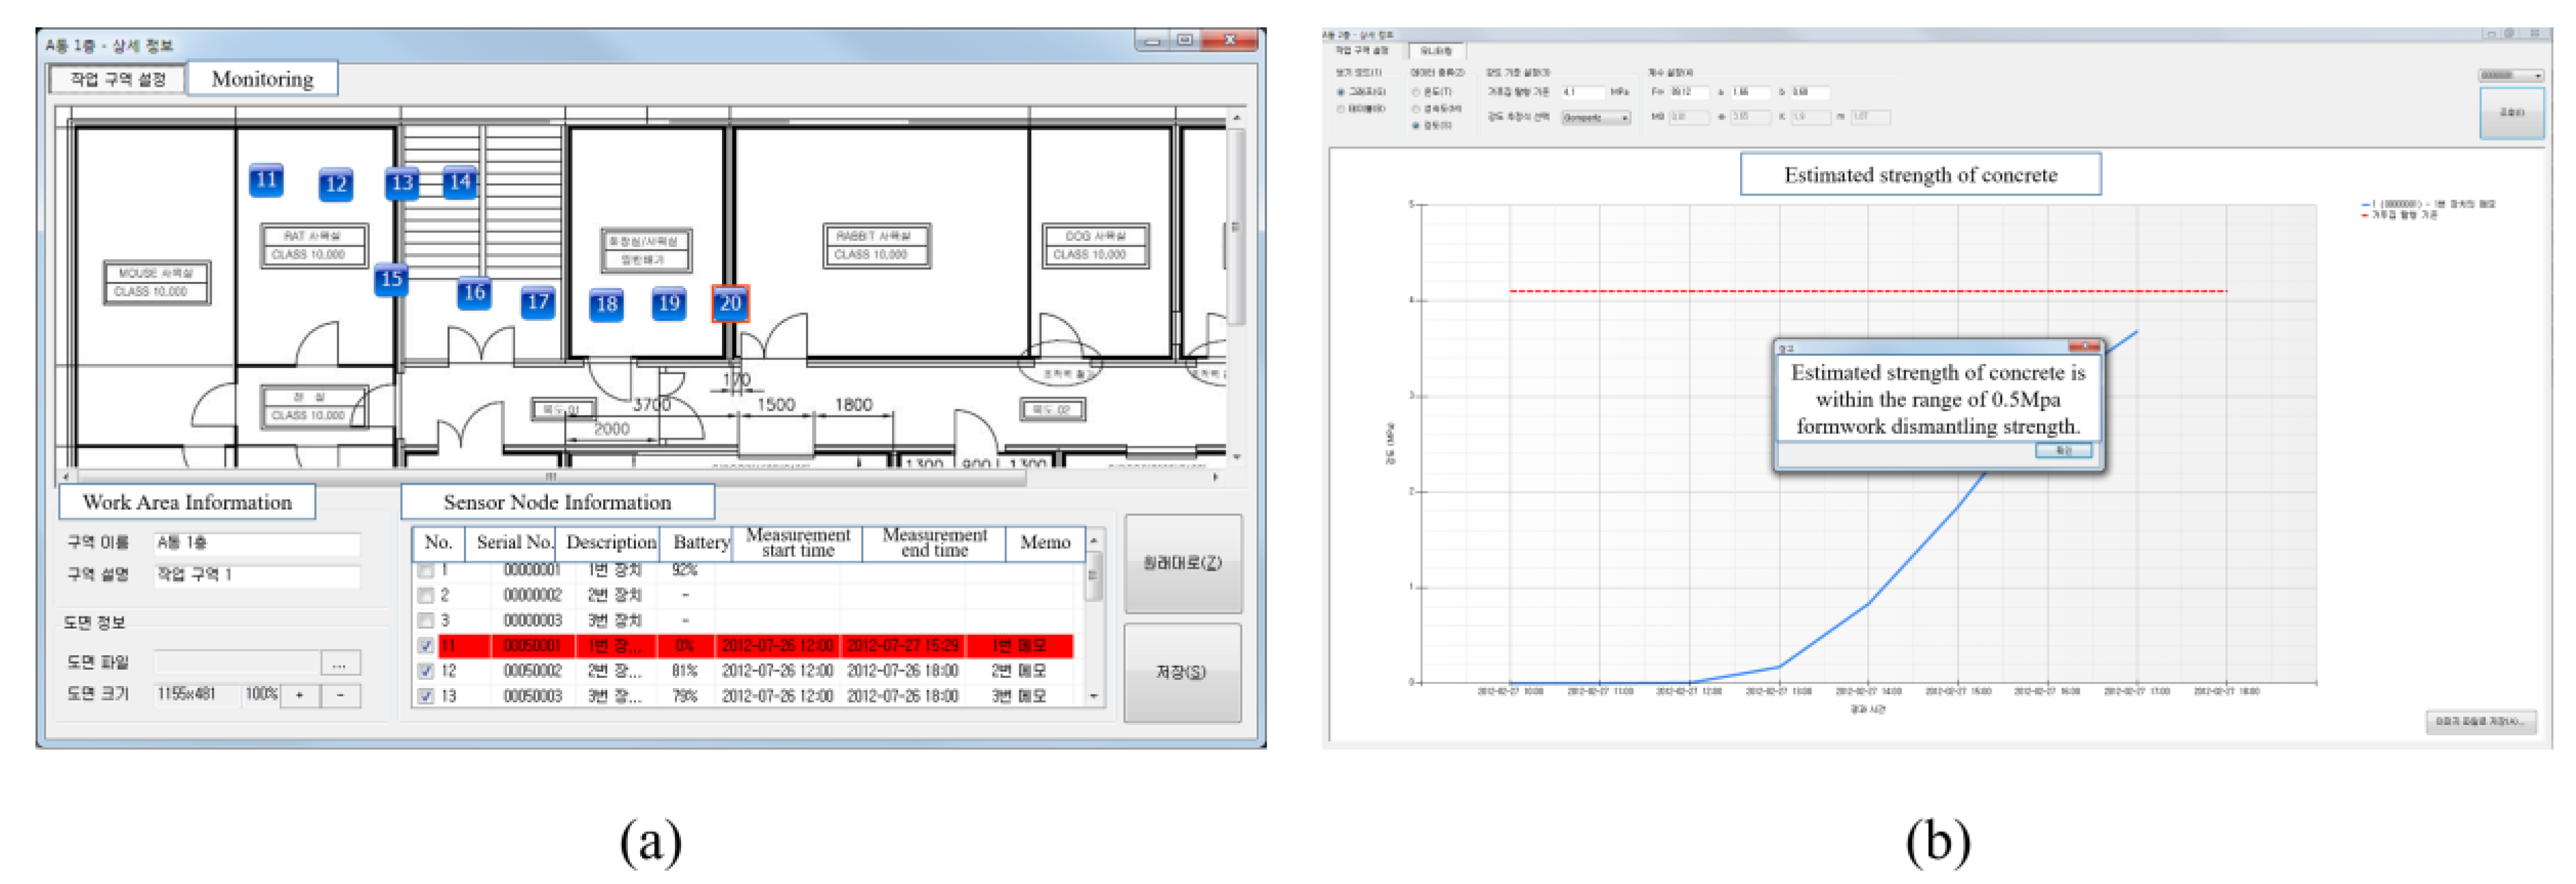
3.5. Management Application
4. S-DCS Implementation
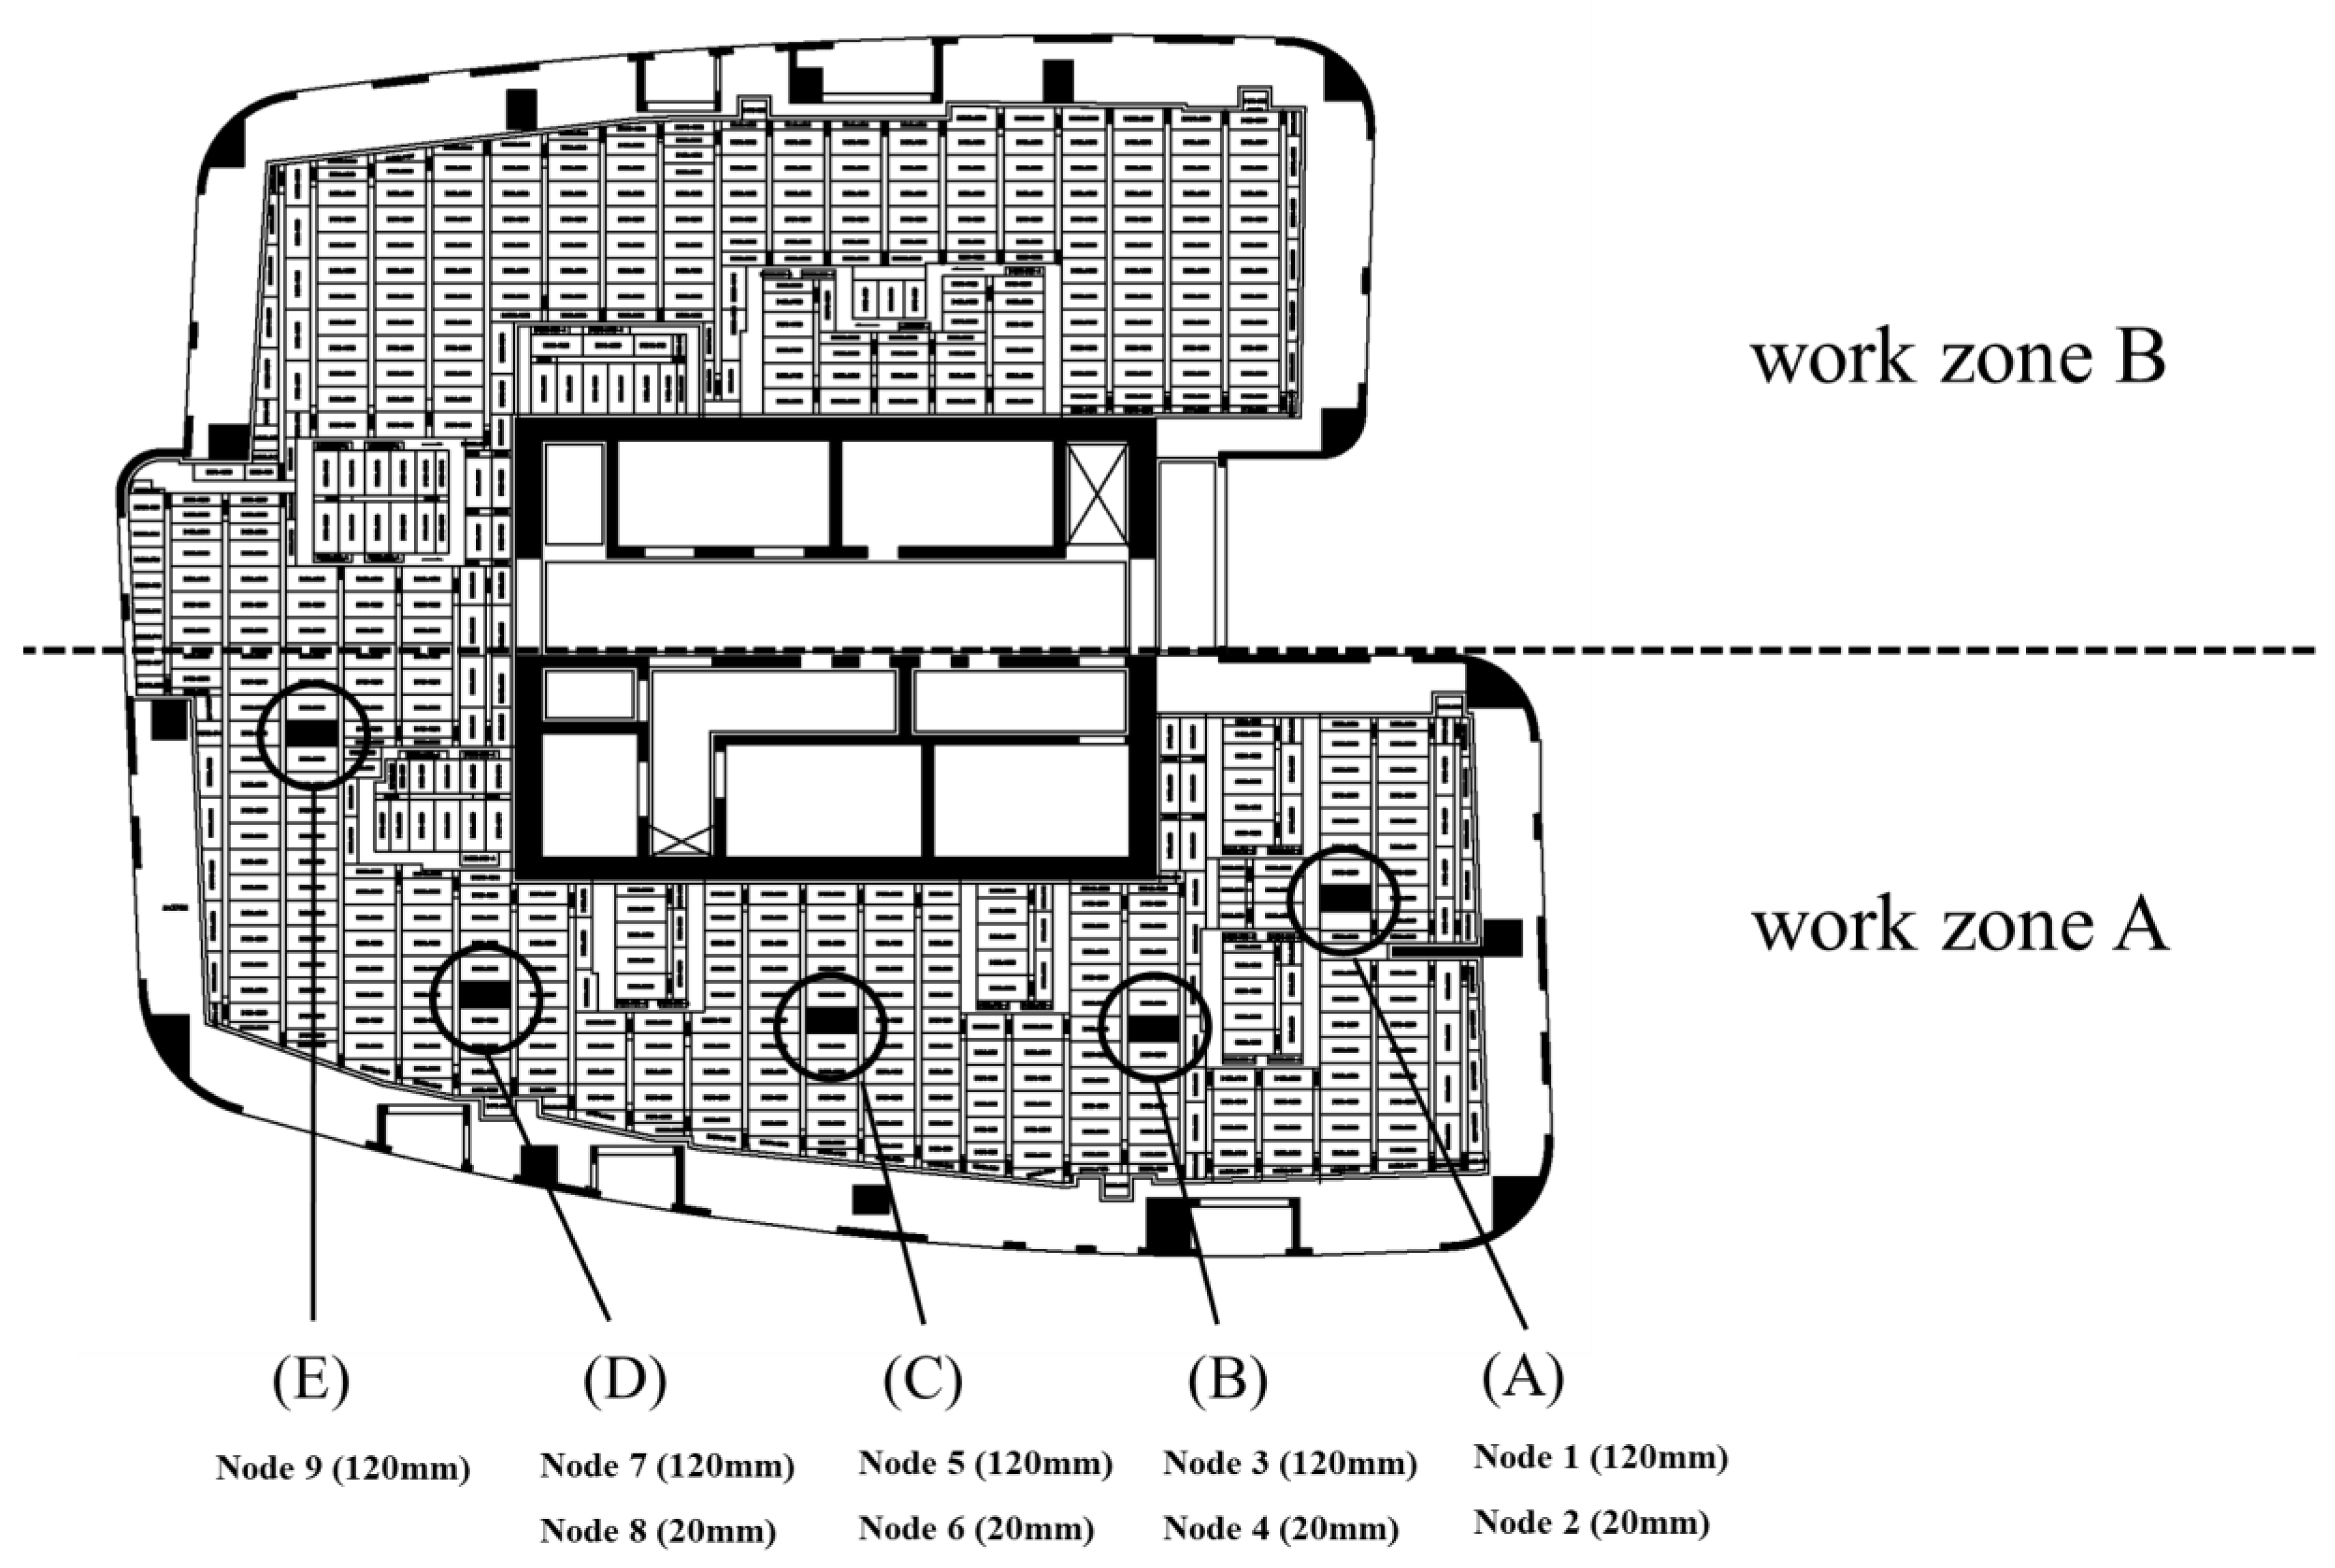
4.1. Outline of the Field Experiment
4.2. Data Transfer Performance
4.3. Data Reception Performance of Smartphones
4.3.1. Reception Ratio by Distance
4.3.2. Reception Ratio by Work Type
4.3.3. Reception Ratio by Work Area
4.4. Data Reception Rate Analysis by Management Time Interval
5. Case Study
5.1. Case Description
5.2. Delay Cost Analysis
6. Conclusions
Author Contributions
Funding
Conflicts of Interest
References
- Kim, C.; Park, T.; Lim, H.; Kim, H. On-site construction management using mobile computing technology. Autom. Constr. 2013, 35, 415–423. [Google Scholar] [CrossRef]
- Quesada-Olmo, N.; Jimenez-Martinez, M.J.; Farjas-Abadia, M. Real-time high-rise building monitoring system using global navigation satellite system technology. Measurement 2018, 123, 115–124. [Google Scholar] [CrossRef]
- Louis, J.; Dunston b, P.S. Integrating IoT into operational workflows for real-time and automated decision-making in repetitive construction operations. Autom. Constr. 2018, 94, 317–327. [Google Scholar] [CrossRef]
- Soman, K.; Rapheal, B.; Varghese, K. A system identification methodology to monitor construction activities using structural responses. Autom. Constr. 2017, 75, 79–90. [Google Scholar] [CrossRef]
- Barroca, N.; Borges, M.; Velez, J.; Monteiro, F.; Górski, M.; Castro-Gomes, J. Wireless sensor networks for temperature and humidity monitoring within concrete structures. Constr. Build. Mater. 2013, 40, 1156–1166. [Google Scholar] [CrossRef] [Green Version]
- Kim, H.R.; Kim, H.G.; Jeon, J.H.; Kim, I.S. Curing Temperature Management of In-Placed Concrete at Early-Ages by Application of the Wireless Sensor Network. J. Korea Concr. Inst. 2009, 21, 50–57. [Google Scholar]
- Lee, S.; Bea, K.; Lee, D. Application for Measurement of Curing Temperature of Concrete in a Construction Site using a Wireless Sensor Network. Korea Inst. Build. Constr. 2011, 11, 283–291. [Google Scholar] [CrossRef] [Green Version]
- Akhavian, R.; Behzadanb, H. Smartphone-based construction workers’ activity recognition and classification. Autom. Constr. 2016, 71, 198–209. [Google Scholar] [CrossRef]
- Kim, S.; Kim, T.; Ok, H. A Study on Developing the System for Supporting Mobile-based Work Process in Construction Site. Smart Media J. 2017, 6, 50–57. [Google Scholar]
- Kim, K. A Study on the Implementation of USN Technologies for Safety Management Monitoring of Architectural Construction Sites. Korea Inst. Build. Constr. 2009, 9, 103–109. [Google Scholar]
- Lee, U.K.; Kang, K.I.; Kim, G.H. Mass concrete curing management based on ubiquitous computing. Comput. Aided Civ. Infrastruct. Eng. 2005, 21, 148–155. [Google Scholar] [CrossRef]
- Norris, A.; Saafi, M.; Romin, P. Temperature and moisture monitoring in concrete structures using embedded nanotechnology/microelectromechanical systems (MEMS) sensors. Constr. Build. Mater. 2008, 22, 111–120. [Google Scholar] [CrossRef]
- Chang, C.; Hung, S. Implementing RFIC and sensor technology to measure temperature and humidity inside concrete structures. Constr. Build. Mater. 2012, 26, 628–637. [Google Scholar] [CrossRef]
- Lee, S.; Park, S. Development of integrated wireless sensor network device with mold for measurement of concrete temperature. J. Korea Inst. Struct. Maint. Insp. 2012, 16, 129–136. [Google Scholar] [CrossRef]
- Kim, J.; Luis, R.; Smith, S.; Figueroa, A.; Maloch, C.; Boo, H. Concrete temperature monitoring using passive wireless surface acoustic wave sensor system. Sens. Actuators A Phys. 2015, 224, 131–139. [Google Scholar] [CrossRef]
- Liu, Y.; Deng, F.; He, Y.; Li, B.; Liang, Z.; Zhou, S. Novel concrete temperature monitoring method based on an embedded passive RFID sensor tag. Sensors 2017, 17, 1463. [Google Scholar] [CrossRef]
- Cabezas, J.; Sanchez-Rodriguez, T.; Gomez-Galan, J.; Cifuentes, H.; Carvajal, R. Compact embedded wireless sensor-based monitoring of concrete curing. Sensors 2018, 18, 876. [Google Scholar] [CrossRef]
- Ouyang, J.; Chen, X.; Huangfu, Z.; Lu, C.; Huang, D.; Li, Y. Application of distributed temperature sensing for cracking control of mass concrete. Constr. Build. Mater. 2019, 197, 778–791. [Google Scholar] [CrossRef]
- Bhatia, A.; Lopez, R.; Moein, T.; Chon, J.; Moon, S. Integrated System for Concrete Curing Monitoring: RFID and Optical Fiber Technologies. J. Mater. Civ. Eng. 2019, 31, 06018028. [Google Scholar] [CrossRef]
- Dong, A.; Maher, M.; Kim, M.; Gu, N.; Wang, X. Construction defect management using a telematic digital workbench. Autom. Constr. 2009, 18, 814–824. [Google Scholar] [CrossRef]
- Lee, J.; Kim, Y. The effective process of tower crane lifting & material management using smart-phone. J. Archit. Inst. Korea Struct. Constr. 2012, 28, 141–150. [Google Scholar]
- Park, C.; Lee, D.; Kwon, O.; Wang, X. A framework for proactive construction defect management using BIM, augmented reality and ontology-based data collection template. Autom. Constr. 2013, 33, 61–71. [Google Scholar] [CrossRef]
- Korea Development Institute. 2016 Mobile Trend Forecast; Digieco: Seoul, Korea, 2016. [Google Scholar]
- Covili, J.; Ochoa, S. A lightweight and distributed middleware to provide presence awareness in mobile ubiquitous systems. Sci. Comput. Program 2013, 78, 2009–2025. [Google Scholar] [CrossRef]
- Ahn, C.; Yoon, S.; Chin, S. Diligence and Indolence Management System for Specialty Contractor on Construction Site -Using GPS of Smart Phone. Korean J. Constr. Eng. Manag. 2012, 13, 56–66. [Google Scholar] [CrossRef]
- Dominicis, C.M.; Depari, A.; Flammini, A.; Rinaldi, S.; Sisinni, E. Smartphone based localization solution for construction site management. In Proceedings of the 2013 IEEE Sensors Applications Symposium, Galveston, TX, USA, 19–21 February 2013; pp. 83–88. [Google Scholar] [CrossRef]
- Dzeng, R.; Fang, Y.; Chen, I. A feasibility study of using smartphone built-in accelerometers to detect fall portents. Autom. Constr. 2014, 38, 74–86. [Google Scholar] [CrossRef]
- Ranza, J.; Aparicioa, S.; Fuenteb, J.V.; Anayaa, J.J.; Hernándeza, M.G. Monitoring of the Curing Process in Precast Concrete Slabs: An Experimental Study. Constr. Build. Mater. 2016, 122, 406–416. [Google Scholar] [CrossRef]
- Yan, X.; Li, H.; Li, A.; Zhang, H. Wearable IMU-based real-time motion warning system for construction workers’ musculoskeletal disorders prevention. Autom. Constr. 2017, 74, 2–11. [Google Scholar] [CrossRef]
- Zhang, M.; Chen, S.; Zhao, X.; Yang, Z. Research on construction workers’ activity recognition based on smartphone. Sensors. 2018, 18, 2667. [Google Scholar] [CrossRef]
- Zhang, M.; Cao, T.; Zhao, X. Using Smartphones to Detect and Identify Construction Workers’ Near-Miss Falls Based on ANN. J. Constr. Eng. Manag. 2018, 145, 04018120. [Google Scholar] [CrossRef]
- Lim, H.; Lee, J.; Kim, T.; Cho, K.; Cho, H. Economic analysis of USN-based data acquisition systems in tall building construction. Sustainability 2017, 9, 1360. [Google Scholar] [CrossRef]
- Jo, A.; Kim, T.; Cho, H.; Kang, K.I. Data acquisition method using a smartphone on construction site. ICCEPM 2013, 5, 245–248. [Google Scholar]
- Construction Association of Korea. Construction Industry Wage Survey Report; CAK: Seoul, Korea, 2018. [Google Scholar]
- Bedon, C. Diagnostic analysis and dynamic identification of a glass suspension footbridge via on-site vibration experiments and FE numerical modelling. Compos. Struct. 2019, 216, 366–378. [Google Scholar] [CrossRef]


| Work Zone | Worker Type | Number of Smartphones Provided Per Day | |||
|---|---|---|---|---|---|
| Day 1 | Day 2 | Day 3 | Day 4 | ||
| A | Formwork worker | 1 | 3 | 3 | 4 |
| Rebar worker | 3 | 3 | |||
| Concrete worker | 3 | ||||
| B | Formwork worker | 2 | |||
| Concrete worker | 2 | ||||
| Total number of smartphones | 6 | 6 | 6 | 6 | |
| Total number of structural workers | 27 | 38 | 43 | 27 | |
| Provision ratio | 22% | 16% | 14% | 22% | |
| Node | Measuring Time (min) | Number of Data (EA) | Sensor Node Performance Ratio (%) | Data Transfer Rate (%) | |||
|---|---|---|---|---|---|---|---|
| Planned Data Points | Measured Data Points | Transfer Time Delay Data Points | Transfer Failure Data Points | ||||
| node 1 | 4122 | 824 | 818 | 6 | 0 | 99.27% | 100.00% |
| node 2 | 4247 | 849 | 842 | 6 | 1 | 99.18% | 99.88% |
| node 3 | 4248 | 849 | 845 | 1 | 3 | 99.53% | 99.65% |
| node 4 | 4249 | 849 | 843 | 5 | 1 | 99.29% | 99.88% |
| node 5 | 4243 | 848 | 843 | 5 | 0 | 99.41% | 100.00% |
| node 6 | 4124 | 824 | 818 | 6 | 0 | 99.27% | 100.00% |
| node 7 | 4248 | 849 | 843 | 6 | 0 | 99.29% | 100.00% |
| node 8 | 4246 | 849 | 843 | 5 | 1 | 99.29% | 99.88% |
| node 9 | 4250 | 850 | 843 | 6 | 1 | 99.18% | 99.88% |
| Total | 37,977 | 7591 | 7538 | 46 | 7 | – | – |
| Average | 4219.67 | 843.44 | 837.56 | 5.11 | 0.78 | 99.30% | 99.91% |
| Node | Number of Data Points | |||||
|---|---|---|---|---|---|---|
| 0–5 m | 5–10 m | 10–15 m | 15–20 m | 20–25 m | 25–30 m | |
| node 1 | 20 | 28 | 19 | 49 | 7 | 2 |
| node 2 | 13 | 29 | 34 | 30 | 21 | 0 |
| node 3 | 25 | 47 | 11 | 33 | 13 | 4 |
| node 4 | 11 | 44 | 40 | 66 | 17 | 3 |
| node 5 | 11 | 101 | 23 | 20 | 27 | 4 |
| node 6 | 11 | 19 | 29 | 47 | 23 | 2 |
| node 7 | 18 | 31 | 19 | 41 | 15 | 8 |
| node 8 | 22 | 109 | 26 | 26 | 8 | 1 |
| node 9 | 7 | 58 | 70 | 29 | 19 | 4 |
| Total | 138 | 466 | 271 | 341 | 150 | 28 |
| Rate | 9.9% | 33.43% | 19.44% | 24.46% | 10.76% | 2.01% |
| Work Date (Month/Day) | Work Type | Number of Received Data Points | Number of Transmitted Data Points | Reception Ratio (%) |
|---|---|---|---|---|
| day 1 | Pouring concrete | 221 | 431 | 51.28% |
| day 2 | Installing wall rebar Dismantling wall form | 347 | 427 | 81.26% |
| day 3 | Installing wall rebar Dismantling and lifting wall form | 537 | 893 | 60.13% |
| day 4 | Installing wall form Dismantling slab form | 289 | 467 | 61.88% |
| Total | 1394 | 2218 | 62.85% | |
| Construction Area | Number of Received Data Points | Number of Temperature Data Points | Reception Rate (%) | |
|---|---|---|---|---|
| Location | Node | |||
| (A) | nodes 1, 6 | 256 | 484 | 52.89% |
| (B) | nodes 2, 7 | 259 | 482 | 53.73% |
| (C) | nodes 3, 8 | 325 | 499 | 65.13% |
| (D) | nodes 4, 9 | 368 | 507 | 72.58% |
| (E) | node 5 | 186 | 246 | 75.61% |
| Total | 1394 | 2218 | 62.85% | |
| Construction Area | Management Time Interval | |||
|---|---|---|---|---|
| 5 min | 10 min | 30 min | 60 min | |
| (A) | 52.89% | 79.73% | 91.67% | 100.00% |
| (B) | 53.73% | 81.82% | 96.00% | 100.00% |
| (C) | 65.13% | 80.65% | 90.00% | 100.00% |
| (D) | 72.58% | 80.28% | 91.30% | 100.00% |
| (E) | 75.61% | 78.85% | 87.50% | 100.00% |
| Average | 62.85% | 80.36% | 91.67% | 100.00% |
| Building A | Building B | Building C | |
|---|---|---|---|
| Slab area (m2) | 636 | 566 | 602 |
| Number of workers | 22 | 19 | 21 |
| Number of Delays | Additional Work Costs ($) | ||
|---|---|---|---|
| Building A | Building B | Building C | |
| 9 | 10,010 | 8645 | 9555 |
| 10 | 11,122 | 9605 | 10,616 |
| 11 | 12,234 | 10,566 | 11,678 |
| 12 | 13,346 | 11,526 | 12,740 |
| 13 | 14,459 | 12,487 | 13,801 |
| 14 | 15,571 | 13,447 | 14,863 |
| 15 | 16,683 | 14,408 | 15,925 |
| 16 | 17,795 | 15,369 | 16,986 |
| 17 | 18,907 | 16,329 | 18,048 |
© 2019 by the authors. Licensee MDPI, Basel, Switzerland. This article is an open access article distributed under the terms and conditions of the Creative Commons Attribution (CC BY) license (http://creativecommons.org/licenses/by/4.0/).
Share and Cite
Lim, H.; Kim, T. Smartphone-Based Data Collection System for Repetitive Concrete Temperature Monitoring in High-Rise Building Construction. Sustainability 2019, 11, 5211. https://doi.org/10.3390/su11195211
Lim H, Kim T. Smartphone-Based Data Collection System for Repetitive Concrete Temperature Monitoring in High-Rise Building Construction. Sustainability. 2019; 11(19):5211. https://doi.org/10.3390/su11195211
Chicago/Turabian StyleLim, Hyunsu, and Taehoon Kim. 2019. "Smartphone-Based Data Collection System for Repetitive Concrete Temperature Monitoring in High-Rise Building Construction" Sustainability 11, no. 19: 5211. https://doi.org/10.3390/su11195211