Article

Water Status and Yield Response to Deficit Irrigation and Fertilization of Three Olive Oil Cultivars under the Semi-Arid Conditions of Tunisia

by
Mouna Aïachi Mezghani
1,
Amel Mguidiche
1,
Faiza Allouche Khebour
2,
Imen Zouari
1,
Faouzi Attia
3 and
Giuseppe Provenzano
4,*
1
Olive Tree Institute Sousse, Ibn Khaldoun Street, B.P.: 14, Sousse 4061, Tunisia
2
Higher Institute of Agronomy of Chott Mariem, Sousse 4061, Tunisia
3
Agro-Nutrition, Toulouse, France, 3 Avenue de l’orchidée, Parc Activestre, 31390 Carbonne, France
4
Department Agricultural, Food and Forest Sciences, University of Palermo, Viale delle Scienze 12, Bld 4, 90128 Palermo, Italy
*
Author to whom correspondence should be addressed.
Sustainability 2019, 11(17), 4812; https://doi.org/10.3390/su11174812
Submission received: 9 August 2019 / Revised: 30 August 2019 / Accepted: 30 August 2019 / Published: 3 September 2019
(This article belongs to the Special Issue Sustainable Soil and Water Conservation)

Abstract

:
Sustainability of olive production is possible by adopting the modern techniques of irrigation and fertilization. In Tunisia, olive trees are usually cultivated in poor soils, under semi-arid conditions characterized by water scarcity. This study investigated the effects of different water supply and fertilization on leaf water status and crop yield of three different olive oil varieties cultivated in central Tunisia, during four experimental seasons (2014–2017). Three treatments were examined: trees conducted under rainfed conditions (TRF), which represented the control treatment, trees irrigated with 50% ETc (T50) and, finally, trees irrigated with 50% ETc and with additional fertilization (T50F). Leaf water content and potential, yield and water use efficiency have been monitored on three different varieties, Chetoui, Chemlali, and Koroneiki, which are quite typical in the considered region. For all the growing seasons, midday leaf water potentials were measured from April to September. Midday leaf water potentials (MLWP) were generally higher for the two irrigated treatments (T50 and T50F) than for non-irrigated trees (TRF). As the season proceeded, MLWPs tended to decrease during summer for all the treatments and varieties. The lowest values were observed for the non-irrigated trees, varying between −3.25 MPa to −4.75 MPa. Relative leaf water content followed the same trends of midday leaf water potentials. Chetoui showed the lowest yield, which did not exceed 1530 Kg/(ha year), even for irrigated and fertilized trees. On the other hand, the yields of Chemlali and Koroneiki, cumulated in the four years, reached the maximum value of about 20 tons/ha. For these two varieties, the cumulated yield obtained in the control treatment (TRF) resulted significantly lower than the corresponding of the other two treatments (T50 and T50F). The highest irrigation water use efficiency (WUE) was estimated for Chemlali (T50) and (TRF). WUE was equal to 1.22 Kg/m3 for Koroneiki under fertigated treatment (T50F). Application of the only water supply (50% ETc) or associated with fertilizer improved the tree water status and increased the productivity of Chemlali and Koroneiki varieties.

1. Introduction

Olive (Olea europaea L.) is the most extensive crop in the Mediterranean basin and, with an area of about 10 million ha, is an important source of both fruit and edible oil appreciated by the consumer [1]. About 98% of olive oil production is concentrated in the Mediterranean area characterized by scarce and quite variable rainfall events. Traditionally, olive orchards in Tunisia have been managed under rainfed conditions and without the application of fertilizers. Moreover, they are usually cultivated in poor soils and under semi-arid conditions characterized by water scarcity [2]. Olive orchards in the past have been characterized by alternating production, with fluctuation of the productions depending on the climate and on management factors [3,4]. On the other hand, modern olive orchards receive water and mineral nutrients throughout the growing season, with effects on plant growth, fruit production and oil quality [5,6,7,8,9].
Recent studies have shown the benefits of irrigation on yield and oil quality [3,6,10,11,12,13,14,15]. Most of the physiological parameters, such as leaf water potential and leaf stomatal resistance, are affected by the water supply. Fernandez et al. [16] and Moriana et al. [11] noticed that under high environmental transpirative demand, olive trees reduce water consumption by closing their stomata. Despite water being beneficial for olive cultivation, water scarcity is a global problem, especially in the Mediterranean region. For this reason, in Mediterranean agro-systems, researchers are increasingly searching for properly estimate actual crop evapotranspiration [17,18,19,20], as well as for efficient technological innovations and irrigation management approaches [21,22].
The adoption of efficient irrigation systems and the application of water-saving strategies, such as deficit irrigation (DI), based on the monitoring of the soil-plant-atmospheric system, may lead to improving crop sustainability [23,24]. Application of deficit irrigation strategies allows the reduction of water applied to the crop to reach levels well below those corresponding to the maximum crop evapotranspiration ETc [6,14,15,25,26,27]. It has been demonstrated, in fact, that it is possible to produce near-maximum yields even when olive crops are maintained under deficit conditions [6,12,14]. Therefore, the increasing shortage of water resources worldwide requires the optimization of irrigation management to improve water use efficiency (WUE). Experiments conducted in different countries showed that the application of an amount of water ranging between 20 and 50% ETc is suitable for several varieties to achieve regular productions [6,15,25,27,28].
Nutrition is the other main factor for fruit production and quality [8,29]. In Tunisia, olive trees are usually not fertilized or receive quite a low amount of fertilizers [30]. The correct fertilization tends to satisfy the nutritional needs of orchards; however, it is necessary to minimize the application of fertilizers to reduce the environmental impact of fertilization [31,32]. Mineral uptake of roots depends on the availability of minerals in the soil, as well as on the fluctuation of water storage capacity [7]. More than 55% of crop production depends on the application of chemical fertilizers, such as nitrogen, phosphorus, and potassium. Such macronutrients have a great influence on plant and fruit growth, as well as on fruit quality [8,29,31]. Regarding the other elements, it seems that even boron (B) affects the pollen germination and tube growth, blooming rate and, finally, crop yield.
This study aimed to evaluate the responses in terms of water status, crop productivity and water use efficiency of different water supply and fertilization applied on three main olive oil varieties cultivated in Tunisia, Chemlali, Chetoui, and Koroneiki. The study, carried out during four years (from 2014 to 2017), examined the effects of three different treatments, including rainfed conditions (TRF), application of seasonal irrigation corresponding to 50% ETc (ET50) and with the same irrigation volumes and additional application of fertilizers composed by macro and micro-nutrients (T50F).

2. Materials and Methods

2.1. Site Description

The experiment was conducted during four growing seasons, from 2014 to 2017, in an olive orchard planted in 2002 and located at the research station of Taoues (34°56′ N, 10°36′ E), about 40 km far from Sfax, Tunisia. The soil was silty (76% sand, 14% silt, and 10% clay), calcareous, with organic carbon of 0.32% and a pH of 8.7. Volumetric water contents at the field capacity and the wilting point are equal to 31% and 6.6%, respectively.
The region is characterized by a semi-arid climate, with an average annual rainfall of 250 mm and about 1400 mm of reference evapotranspiration (ET0); the period from May to October is generally dry and characterized by high temperatures. The annual highest temperature generally occurs in August and the lowest in January. Weather variables were recorded hourly by an automatic climatic station installed about 100 m far from the olive orchard. Daily averages of the standard meteorological variables, i.e., wind speed, air temperature, solar radiation, precipitation, and relative air humidity were then evaluated.
The experiment was conducted on three different olive oil varieties: two of them, i.e., Chetoui and Chemlali, are local for Tunisia whereas the third, Koroneiki, is relatively new for the country, having been recently imported from Greece. Chemlali accounts for 80% of the national olive oil production and it is grown in central and southern Tunisia in which very low rainfall occurs (<250 mm per year), whereas Chetoui is widespread in the north of the country, either in plains or in mountainous regions. All the varieties were planted at a density of 204 trees/ha. Trees were clean-cultivated and trained using the globe vase-form.

2.2. Experimental Design and Treatments

The experiment followed a randomized block design. The tagged trees were arranged in three plots (three varieties) with nine trees for each cultivar. Three treatments were considered: trees conducted under rainfed condition (TRF), trees irrigated with 50% ETc (T50), and finally trees that received 50% ETc and fertilized by diluting the fertilizer in the irrigation water (T50F). All experimental trees were surrounded by guard trees to minimize the interactions between irrigation and fertilization.
The irrigation requirement was determined using the FAO method [33]. Daily reference evapotranspiration (ET0) was estimated using the Penman–Monteith equation. Maximum crop evapotranspiration (ETc) was computed by multiplying ET0 for the crop-specific coefficient (Kc) and a reduction coefficient (Kr). The Kc values used in this research were those proposed by Fernandez and Moreno [34] for mature olive trees (0.60 in April, 0.55 in May, 0.50 in June, 0.45 in July and August and, finally, 0.60 in October). The Kr value was assumed to equal to 1 when the percentage of the soil coverage was higher than 50% [35]. The first watering, equal to 50% ETc was applied at the beginning of April. Olive trees were irrigated twice a week by a localized system, with four emitters per tree discharging 8 l/h at a pressure of 100 kPa. Then, irrigation continued during the whole dry season till early September, when the first autumn rains were recorded.
The fertilizer applied during the four years was composed of macronutrients (nitrogen 16%, phosphorus 8%, potassium 24%, and magnesium 2%) and micro-elements (boron 200 ppm, copper 400 ppm, iron 500 ppm, manganese 550 ppm, zinc 200 ppm, and molybdenum 30 ppm). The applied dose per week varied during the olive tree phenological stages. The applied concentration was equal to 3.0 Kg/ha per week in the period from bud break to fruit set (weeks 1–14), 3.6 Kg/ha per week from the fruit set to pit hardening, when seeds become hard (weeks 15–22) and, finally, 2.9 Kg/ha per week from pit hardening to harvesting (weeks 22–32).

2.3. Measurements of Plant Water Status

Leaf water potential were measured monthly with a pressure chamber (PMS600, PMS Instrument Co., Corvallis, OR, USA), by following the methodology proposed by Turner [36]. Midday leaf water potential (Ψ, MPa) was periodically measured on three leaves per each cultivar and treatment. In particular, each one-year-old expanded leaf was wrapped in plastic envelops for about half an hour, detached from mid-canopy, and rapidly inserted in the pressure chamber after abscission. These measurements were carried out once a month, from March to October. On May 15th, 2014, leaf water potential was monitored every two hours from 4:30 a.m. (predawn) to 8:00 p.m. on three exposed leaves for each cultivar and irrigation treatment, collected every 2 h.
Measurements of relative water content (RWC) were carried out at the same time of leaf potentials on a total of 10 leaves per cultivar and treatment, by following the same method of El-Sharkawi and Salama [37], who applied the methodology proposed by Weatherly [38], as later modified by Weatherly and Barrs [39]. A leaf disc was punched from the center of the leaf and then weighed with a precision of 10−2 g, to measure the Fresh Mass (FM); after floating for 4 h in distilled water, the leaves were weighed again to measure the turgid mass (TM). To determine the dry mass (DM), the discs were oven-dried at 80 °C till constant weight. The relative water content in %, was calculated as
RWC = FM DM TM DM × 100  

2.4. Yield and Water Use Efficiency

The olive production of each monitored tree was weighed individually; then the average yields and the corresponding standard deviations were evaluated for the three trees of each treatment and cultivar. Yield per hectare was determined by multiplying the average production by the tree density. The cumulative yields for the different cultivars were finally calculated by summing the corresponding yield obtained in the four investigated years.
Water use efficiency for each treatment and cultivar was evaluated as the ratio between the crop yield and the water consumption, equal to the sum of rainfall and the water amount applied per tree during the whole period of the experiments.

2.5. Statistical Analysis

Statistical analysis was performed using the SPSS statistical computer program (version 23.0 for window). Leaf water potentials and crop yields were subjected to multivariate analysis using the general linear model (GLM) procedure. The means comparisons were performed based on Duncan’s multiple range test at probability levels p < 0.05 and p < 0.001.

3. Results

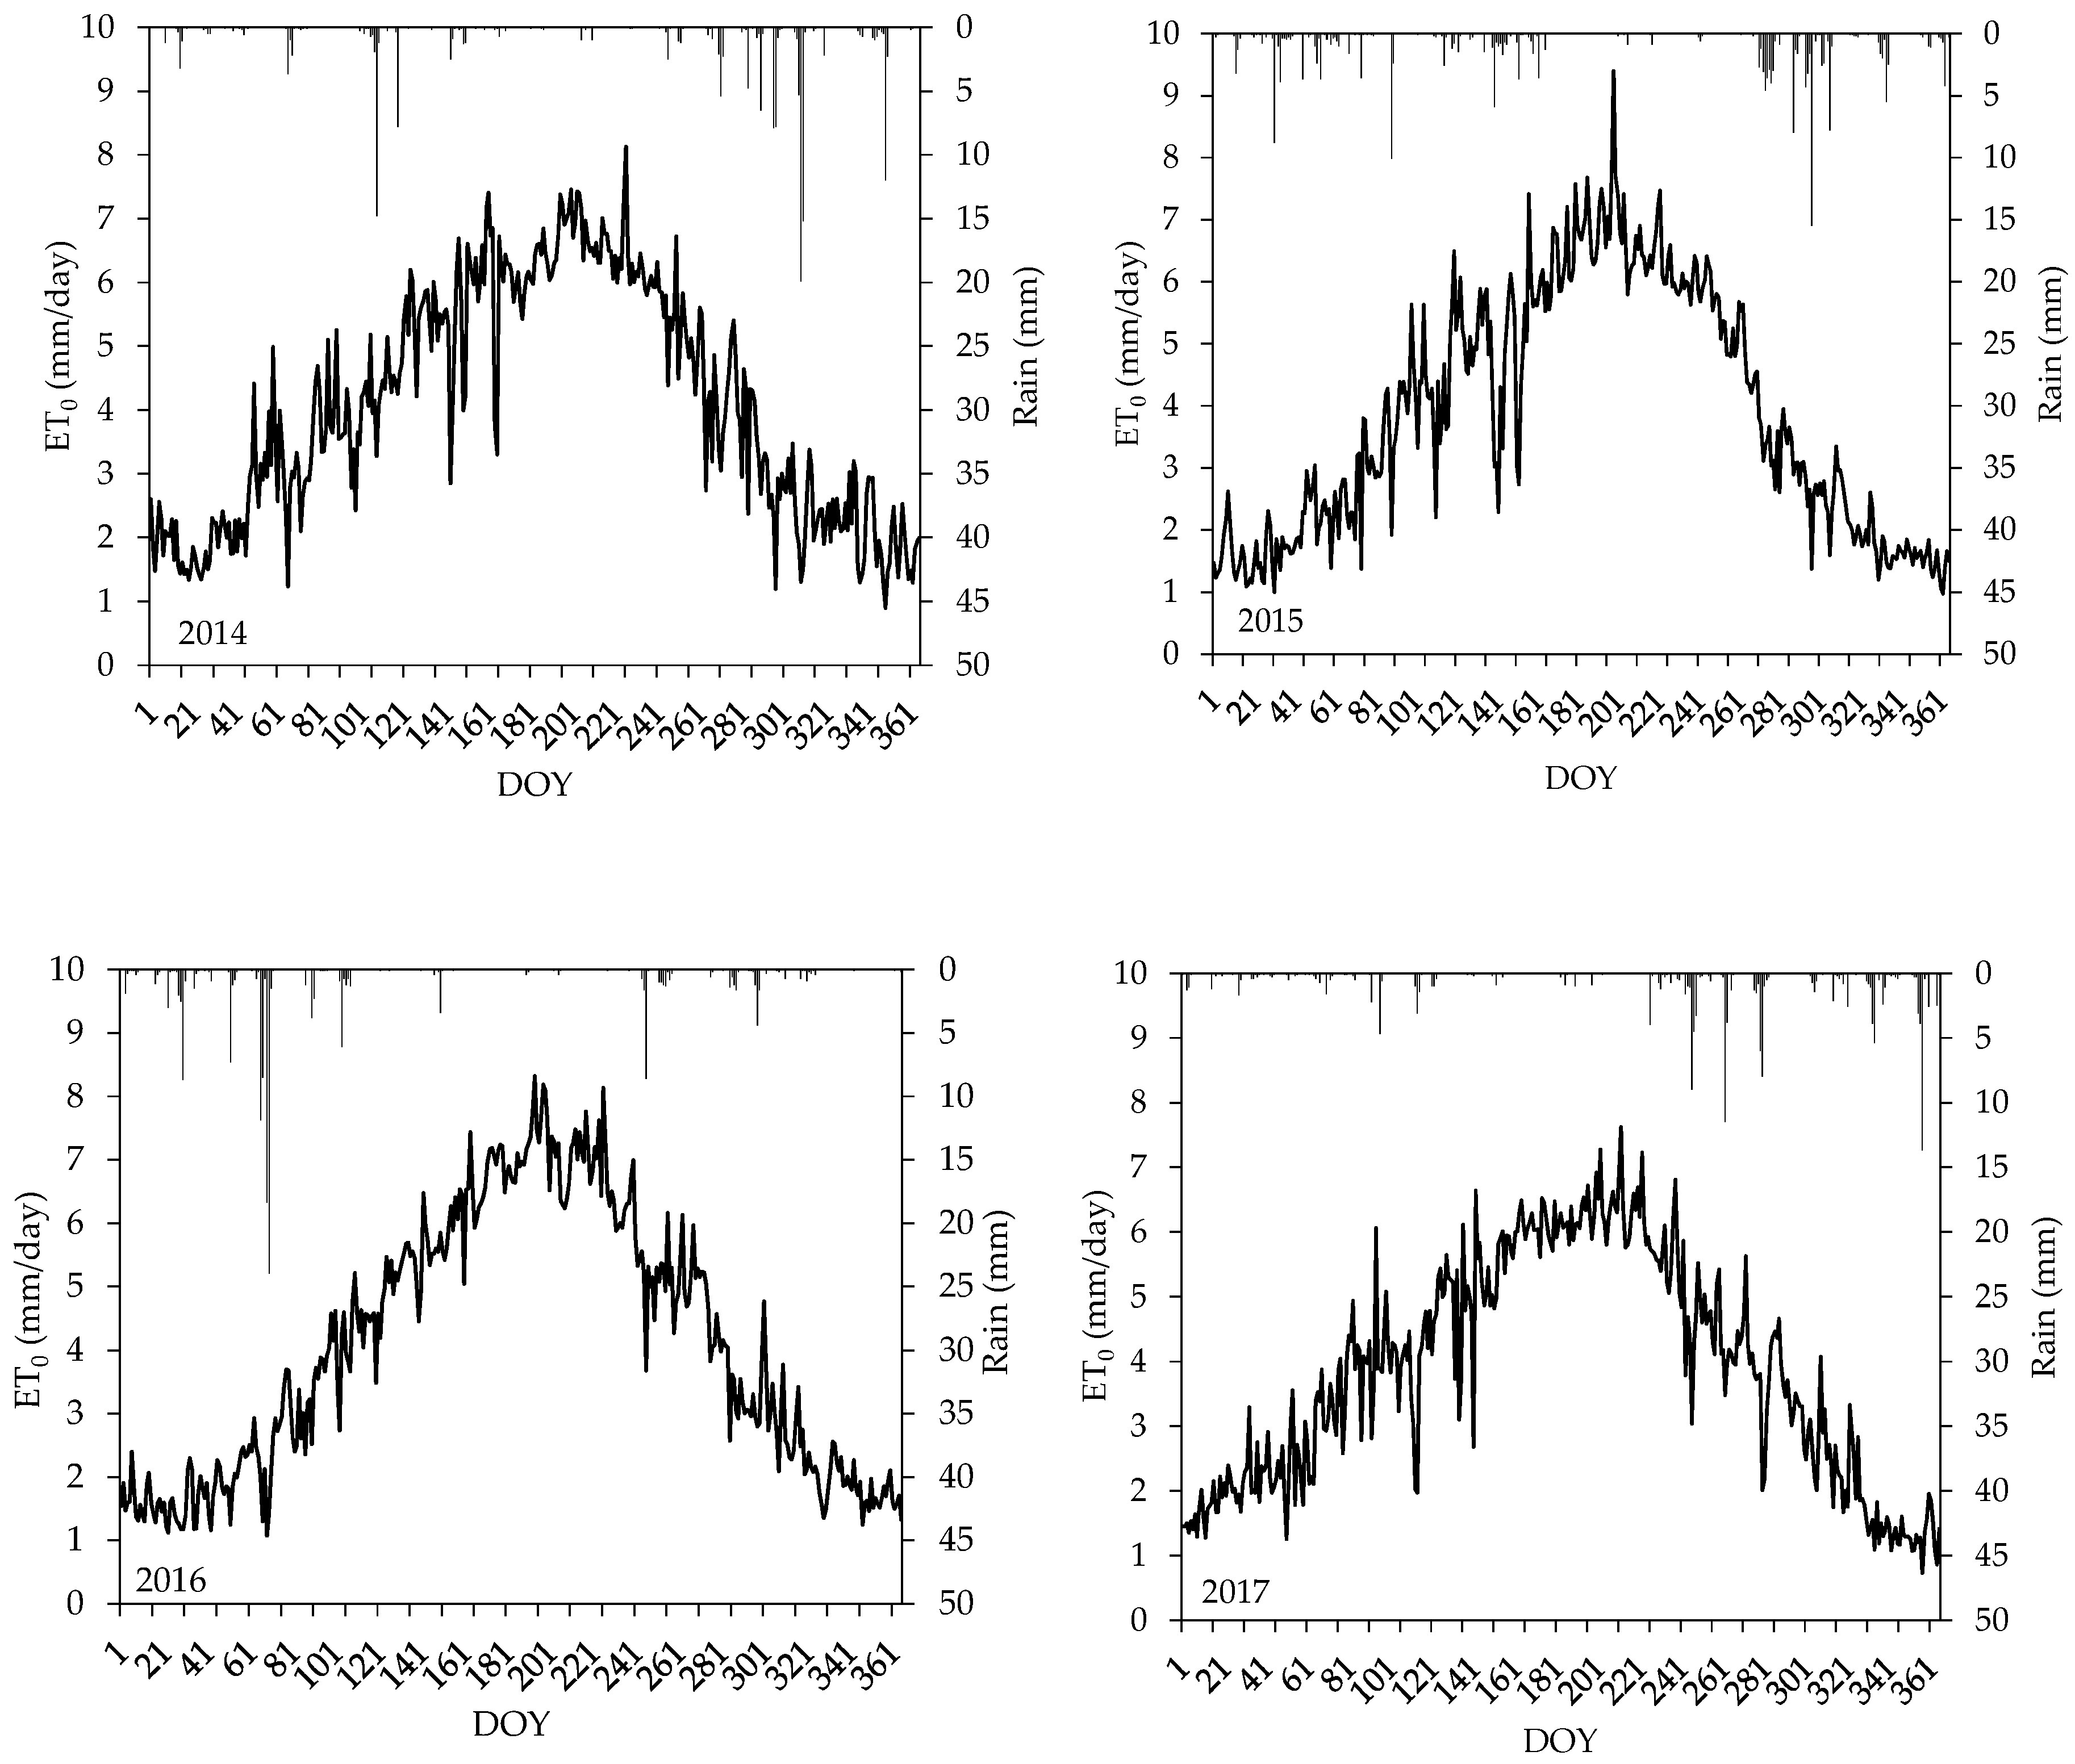
3.1. Environmental Conditions and Irrigation Water Requirements

Table 1 summarizes the values of maximum, minimum and mean air temperature (TMax, TMin, TMean), relative humidity (RH), reference evapotranspiration (ET0), crop evapotranspiration (ETc), rainfall and irrigation amount (IA) during the four investigated years. As can be observed, the daily mean temperature and relative humidity at the experimental site resulted in almost constant, with values ranging between 20.2 °C and 20.7 °C, and between 59.0% and 62.0%, respectively (Table 1).
Figure 1 shows the temporal patterns of reference evapotranspiration and precipitation. As expected, the values of ET0 resulted quite high in summer, with peaks higher than 7.0 mm/d, and low in winter, when ET0 varied between 1.0 and 2.0 mm/d. Annual ET0 in the four years ranged between 1408 and 1486 mm/year. The highest ET0 values were generally observed between May and August (from Day of Year, DOY 121 to DOY 244). The maximum daily evapotranspiration results were equal to 8.1, 9.4, 8.3 and 7.6 mm/d in 2014, 2015, 2016 and 2017, respectively (Figure 1). During the four investigated years, rainfall resulted equal to 168.3 mm, 195.7 mm, 160.7 mm and 155 mm, mainly concentrated between the late autumn and the early spring.
The maximum cumulative crop evapotranspiration (ETc) estimated during the four years resulted quite uniform, with values ranging between 745 and 788 mm/year. The slightly higher values of ETc registered in 2014 was a consequence of the slightly higher reference evapotranspiration. During the four years, the irrigation amount (IA) varied from a minimum of 274.0 in 2015 to a maximum of 310.0 mm in 2016.

3.2. Plant Water Status

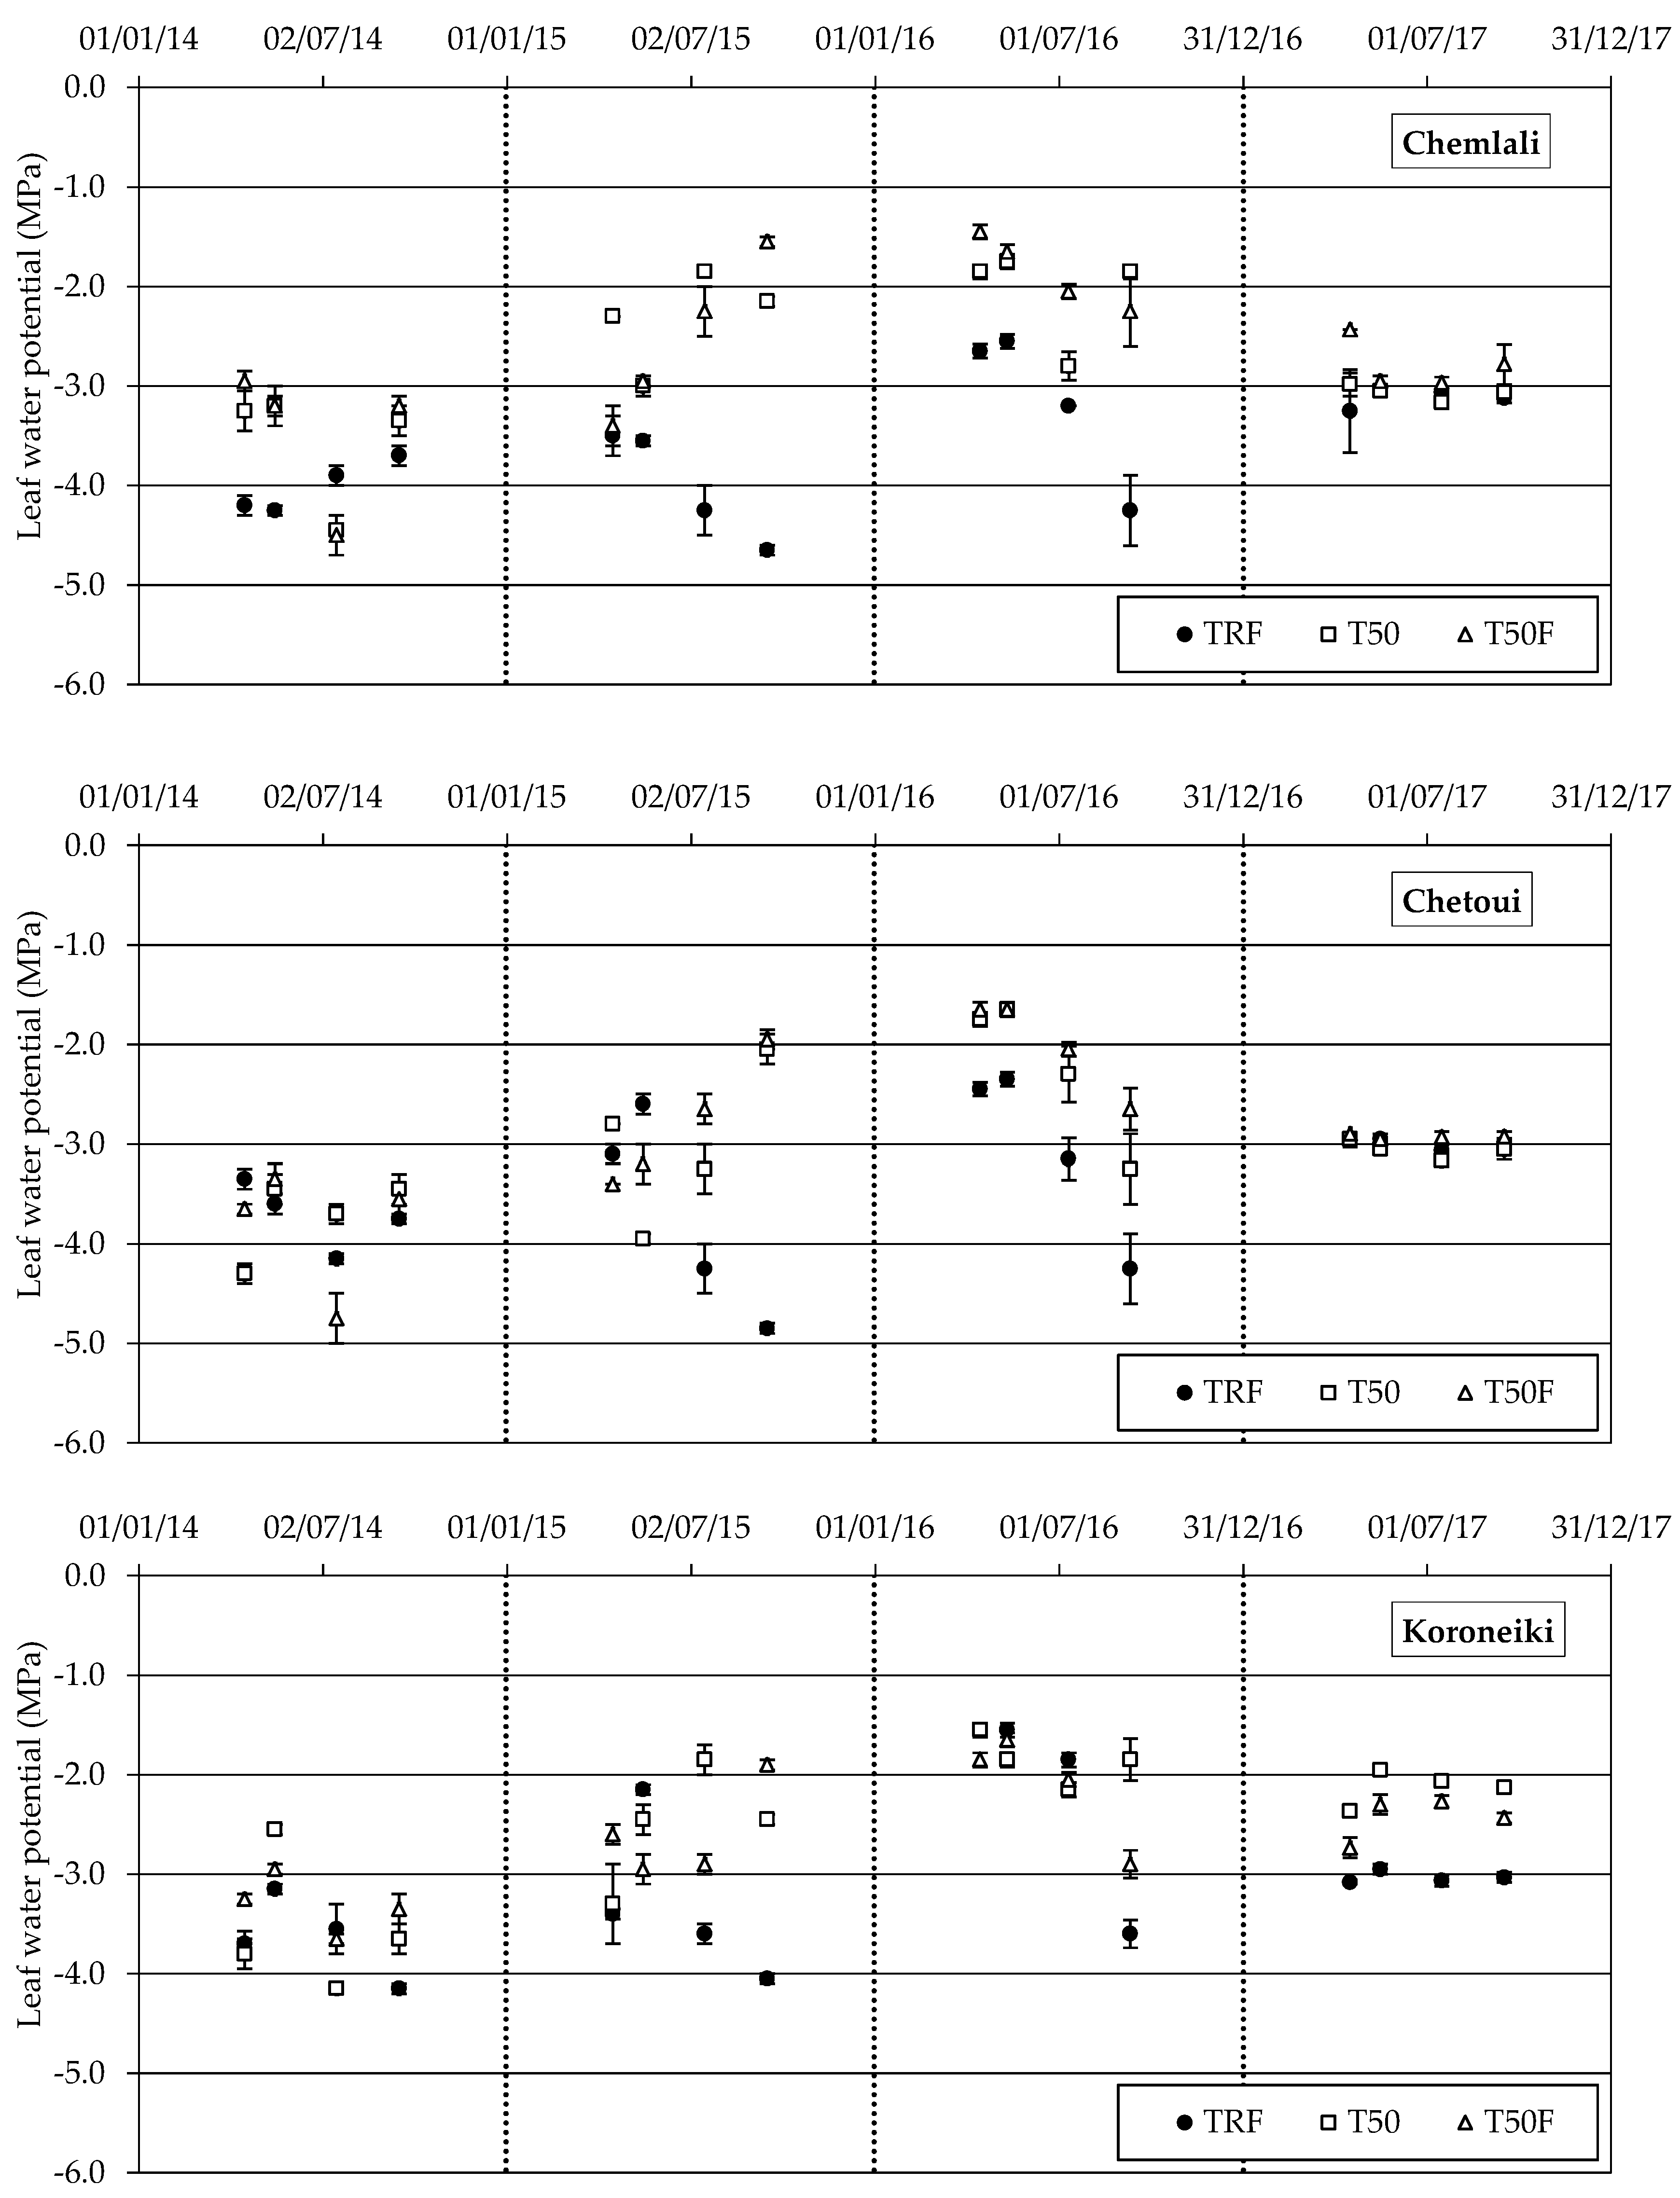
3.2.1. Temporal Dynamic of Leaf Water Potential during the Growing Seasons and for the Four Years

Figure 2 shows the temporal patterns of leaf water potential for the three studied cultivars, as measured in four dates, from mid of April to mid of September of the four growing seasons (2014–2017). Seasonal changes were observed during each year, with extreme values ranging between −1.45 MPa and −4.85 MPa. In particular, Ψleaf varied from −4.75 to −2.55 MPa, −4.25 to −1.85 MPa, −4.25 to −1.45 MPa and −3.25 to −1.95 MPa, in 2014, 2015, 2016 and 2017, respectively. Despite in a few cases the standard deviation associated to the measurements resulted quite large, all the data were used for the statistical comparison. In addition, during each year, the differences in leaf water potential measured on the same cultivars resulted in general significant (p < 0.001) depending on the treatment, with the lowest values commonly observed under rainfed conditions, TRF (Table 2).
The values of Ψleaf generally tended to decrease from mid of May to mid of September for all treatments and cultivars, especially for the non-irrigated trees. The arid climate and the almost dry soil resulted in a noticeable deficit during long periods, from May to September. Despite some exceptions, the lowest Ψleaf were observed in September, while the highest in April, as a consequence of the frequent fall and winter rainfall.
Under the examined conditions, as observed, the non-irrigated trees (TRF) showed the lowest values of leaf potentials, whereas the trees in T50 and T50F generally showed a better water status compared to TRF. In 2014, compared to the other years, the cultivars Chemlali and Chetoui were characterized by relatively high-stress levels, even when they were irrigated (T50) or irrigated and fertilized (T50F). The values of Ψleaf for Chemlali and Chetoui, in 2014, reached the minimum values of −4.55 and −4.75 MPa, respectively. This result may be due to the exceptionally hot weather conditions, the high air temperatures and the low rainfall characterizing the beginning of the growing season, which determined a quite high atmospheric water demand with a scarce soil water availability. It is important to mention that the comparison between treatments, as well as the interaction of two factors (year and treatment) on leaf water potential measured on different dates, were significant (Table 2).

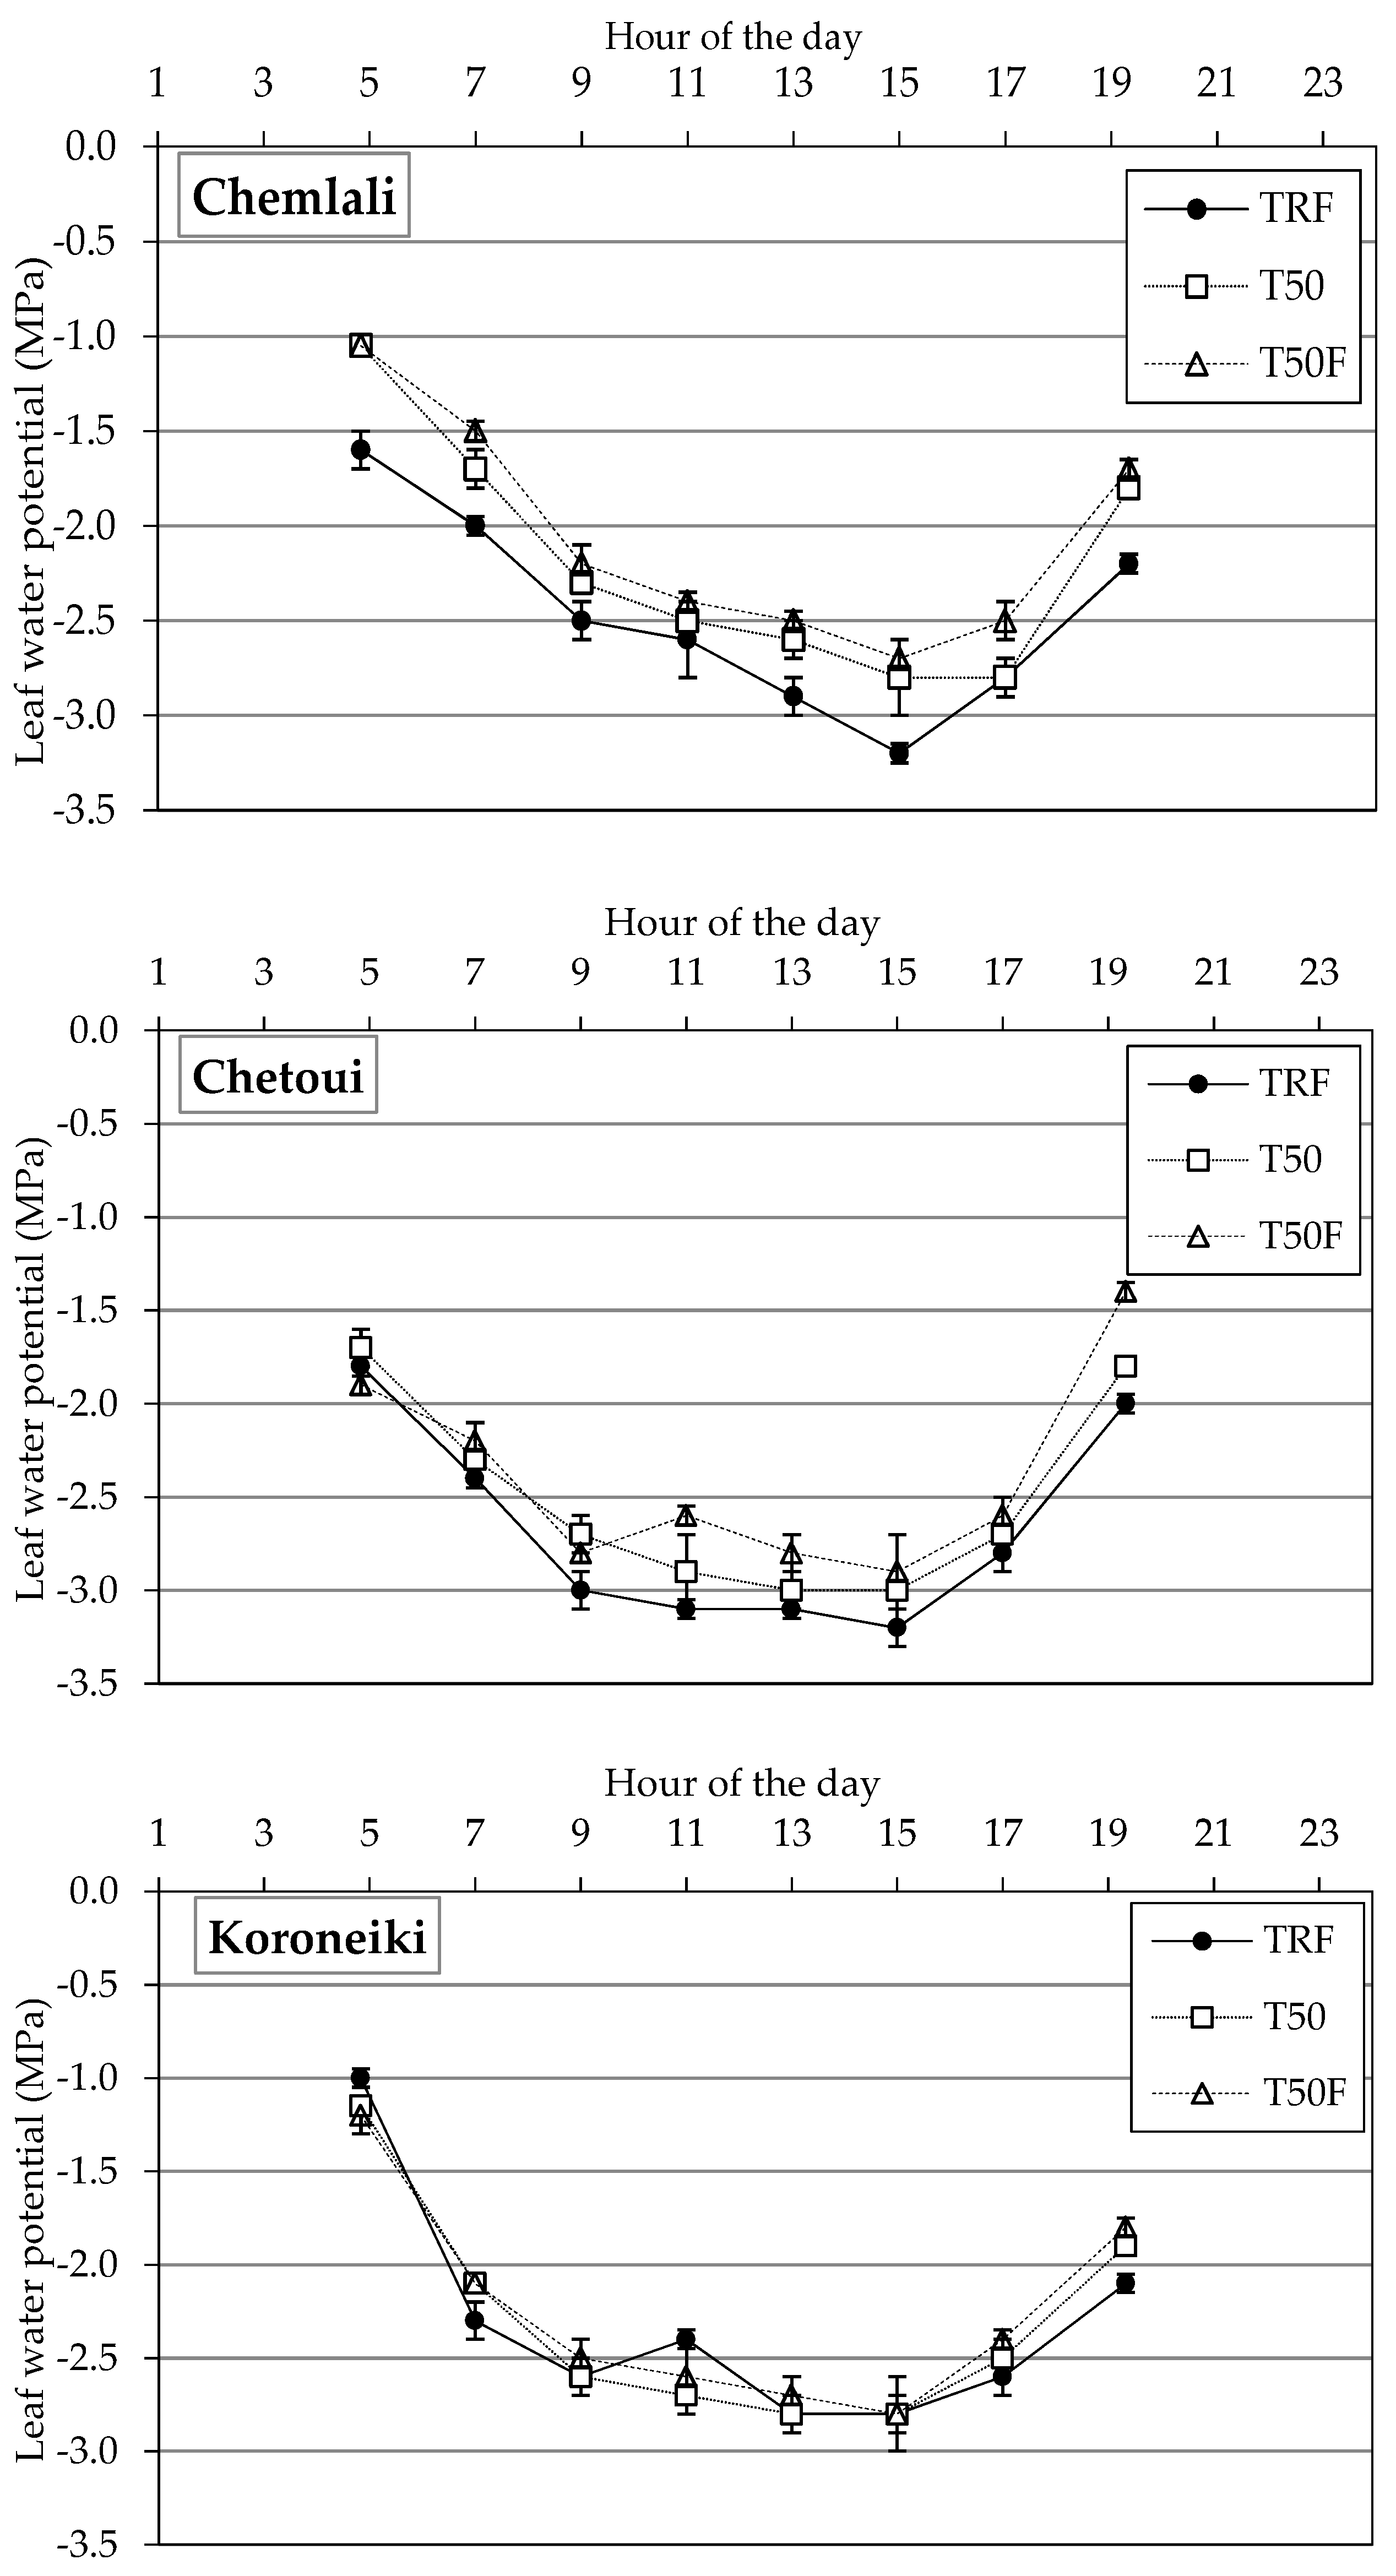
3.2.2. Diurnal Course of Leaf Water Potential

On May 15, 2014, which was a clear day with the blue sky, measurements of Ψleaf were carried out every two hours. At the beginning of the day, slight differences in predawn leaf potentials measured in the different treatments and cultivars were recorded (Figure 3).
At the sunrise (4:50 am), in the absence of plant transpiration, the values of Ψleaf varied between −1.0 and −1.8 MPa. For the three cultivars, the plants cultivated under the rainfed condition were generally characterized by the lowest predawn leaf potential. As expected, for all the treatments and cultivars, the values of Ψleaf tended to decrease as the hours progressed. The lowest values were recorded between 13:00 to 15:00 h GMT. Both the Chemlali and Chetoui cultivars, during the day, showed slightly higher potentials under T50 and T50F treatments, as a consequence of the better water status compared to the rainfed treatment (TRF). On the other hand, the values of Ψleaf for the Koroneiki cultivar resulted in almost similar in all the treatments, with values always lower than −3.0 MPa. The response of the trees at midday is, of course, different from that at predawn, due to the water fluxes occurring when uncovered leaves are actively transpiring. After midday, the values of Ψleaf tended to increase throughout the day, until the late afternoon, when the trees in T50 and T50F recuperated more rapidly than those in TRF. At the sunset (7:50 pm), the values of Ψleaf ranged from −1.4 to −1.8 MPa and from −2.0 to −2.2 MPa, respectively under irrigated (T50 and T50F) and rainfed conditions (TRF).

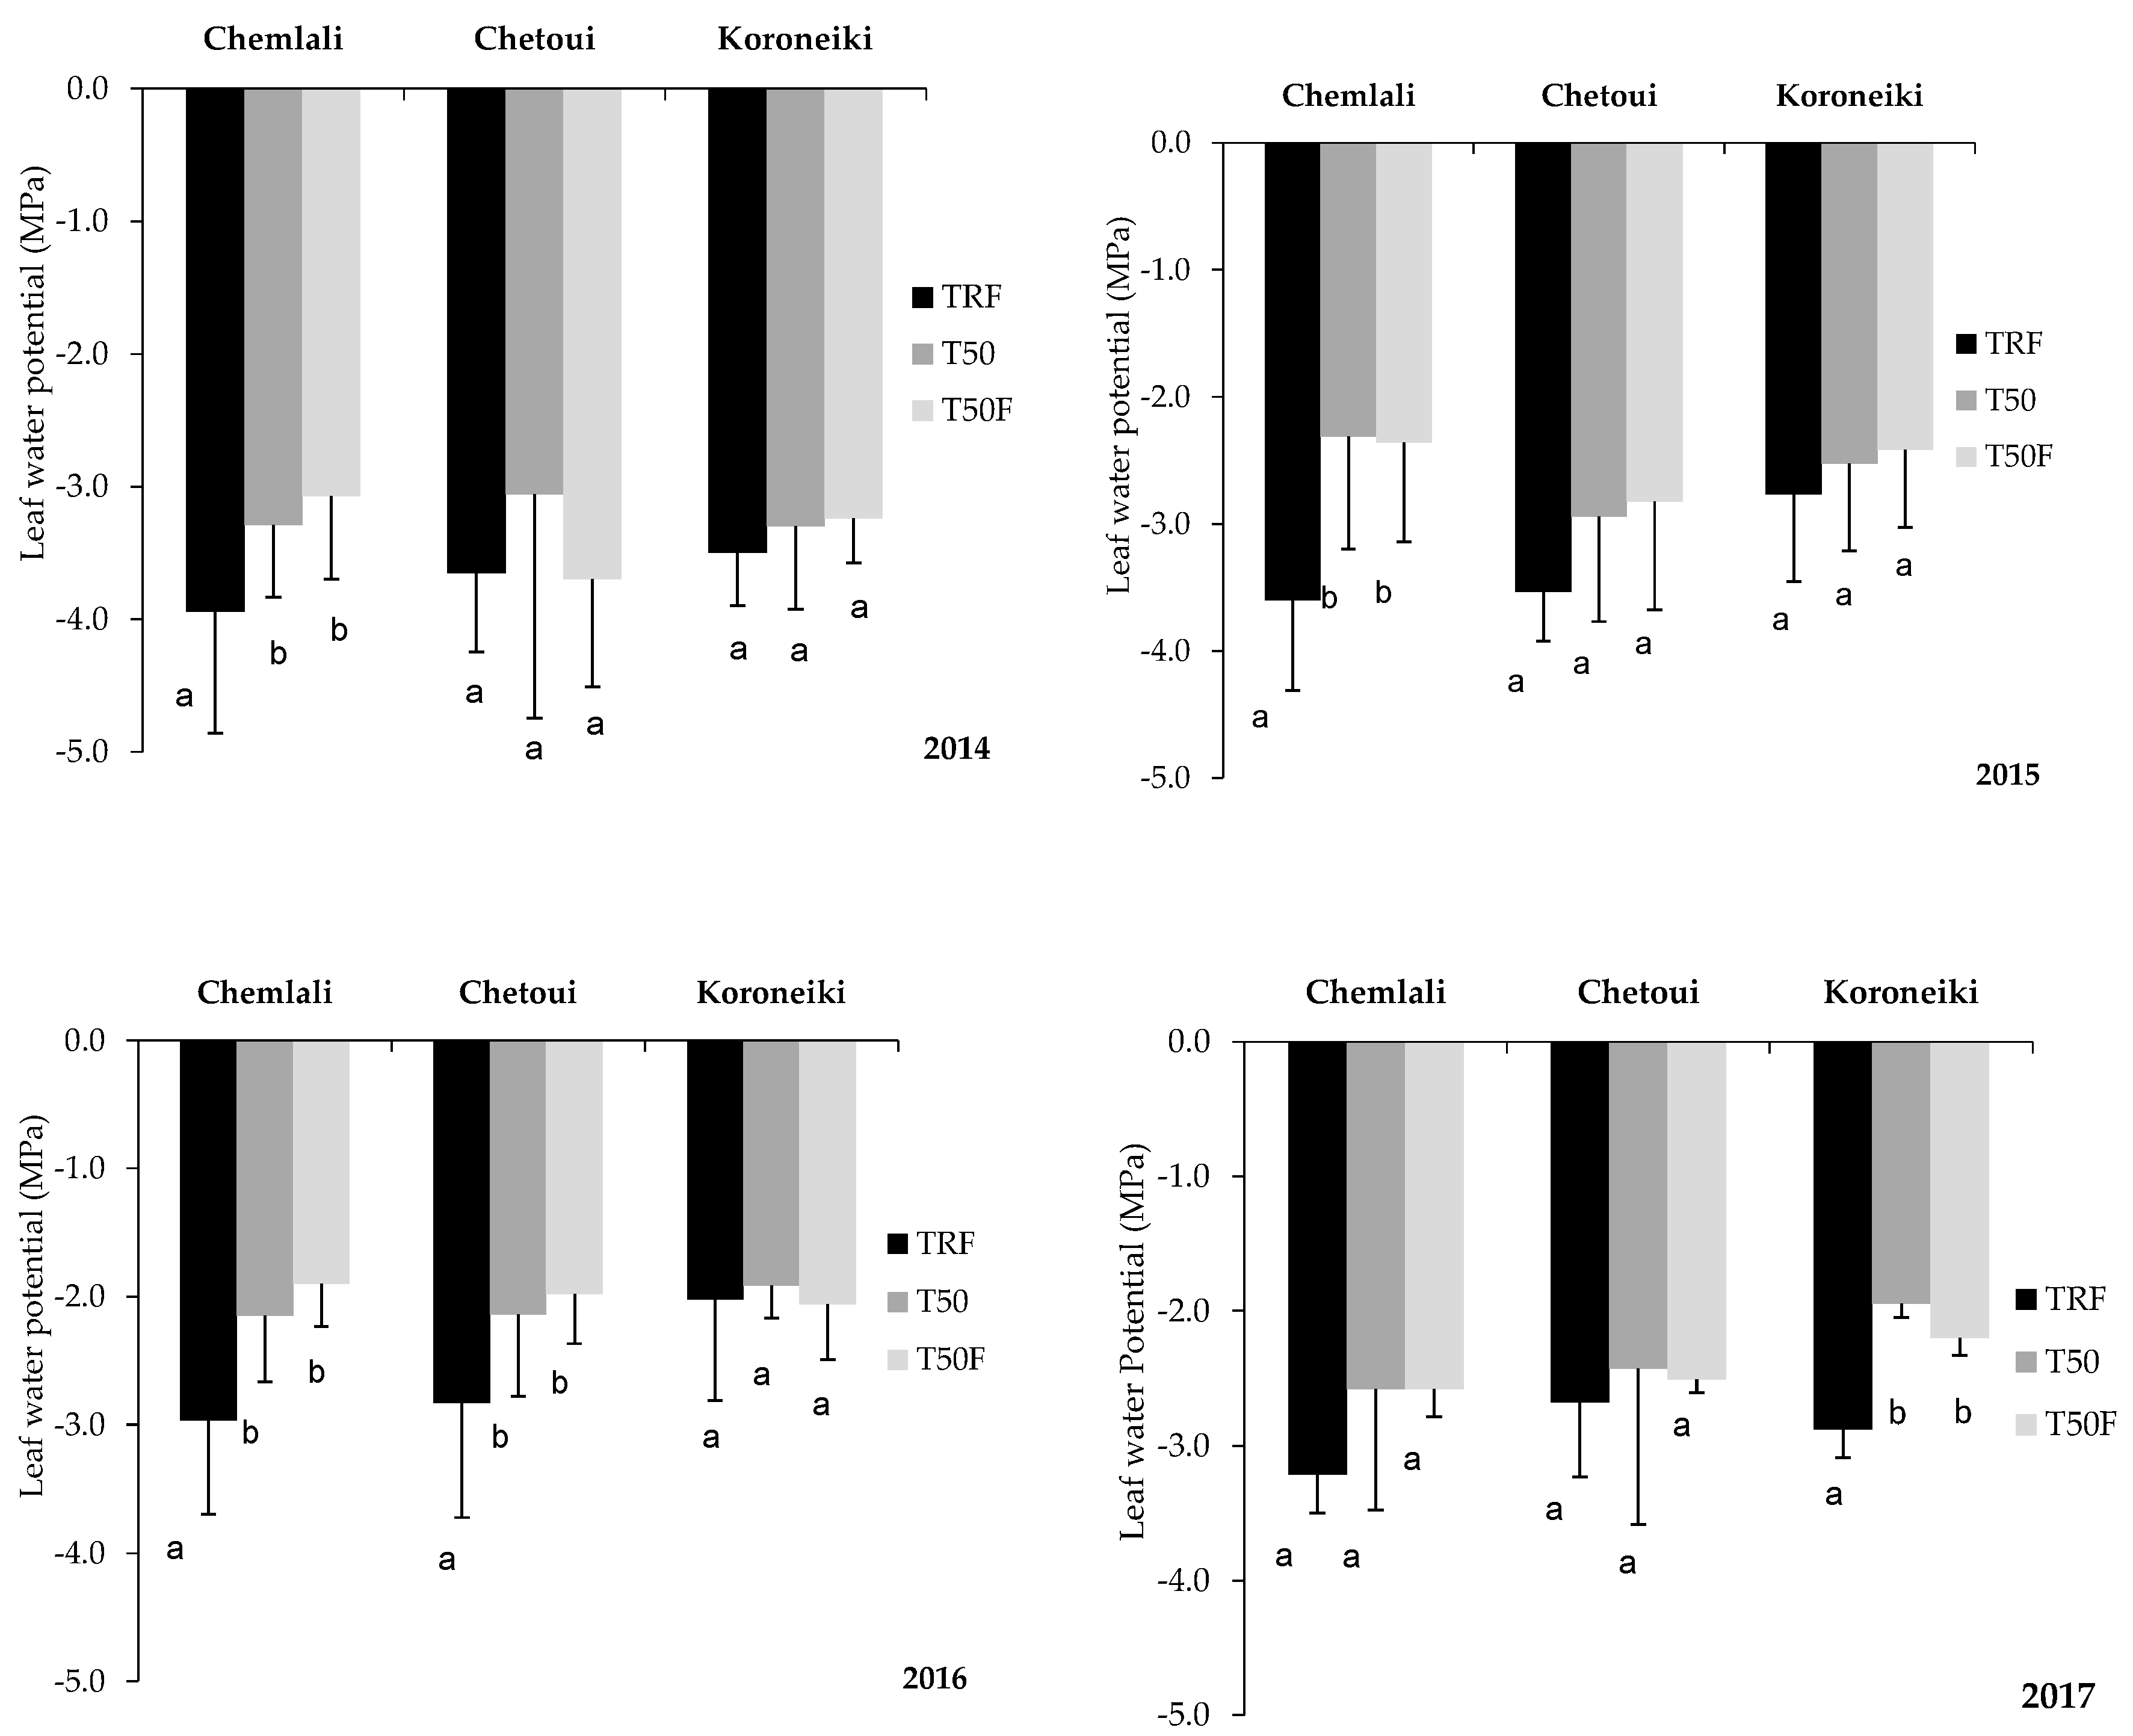
3.2.3. Seasonal Average Leaf Water Potentials

For the three cultivars maintained under TRF, T50 and T50F, Figure 4 shows the mean and the standard deviation of leaf water potential evaluated considering all the data collected during the growth period (from April to September) of the examined years. Despite the differences between treatments and cultivars that resulted in general statistically not significant, as expected, leaf water potentials for the two irrigated treatments (T50 and T50F) were mostly higher than those obtained in the non-irrigated treatment (TRF).
Comparing the four seasons, the lowest leaf water potential was observed in 2014 for the Chemlali cultivar in the absence of irrigation (TRF), with a value of Ψleaf equal to −3.95 MPa. Even for the other cultivars, the values of leaf water potential measured in 2014 resulted generally lower than those measured in the other years. These lower values were probably due to the high daily atmospheric evaporative demand occurring in the first semester of 2014 (from January 1, to June, 30), whose values, in about 60% of cases, resulted higher than the corresponding measured in the other years, with differences in the cumulative ET0, compared to 2014, equal to 8% (2015), 6% (2016) and 4% (2017). When considering all the cultivars and the absence of irrigation, in the four years Ψleaf ranged from −2.97 and −3.95 MPa, −2.68 and −3.65 MPa and −2.10 and −3.50 MPa for Chemlali, Chetoui, and Koroneiki, respectively.
On the other hand, in treatments T50 and T50F, the values of leaf water potential resulted higher and ranging, in the four years, from a minimum of −3.70 MPa (Chetoui in 2014) to a maximum of −1.90 MPa (Chemlali in 2016). The trees in both the irrigated treatments (T50 and T50F) generally showed lower levels of water stress, especially for the Chemlali, when compared to the other cultivars. Especially in 2016 and 2017, the application of water or water and fertilizers (T50 and T50F), limited the crop water stress; in both the growth seasons leaf water potentials ranged, in fact, between −1.90 and 2.20 MPa and between −2.00 and 2.60 MPa, respectively. The Koroneiki cultivar showed the best conditions, as indicated by the highest leaf water potentials in both the irrigated and fertilized treatments.

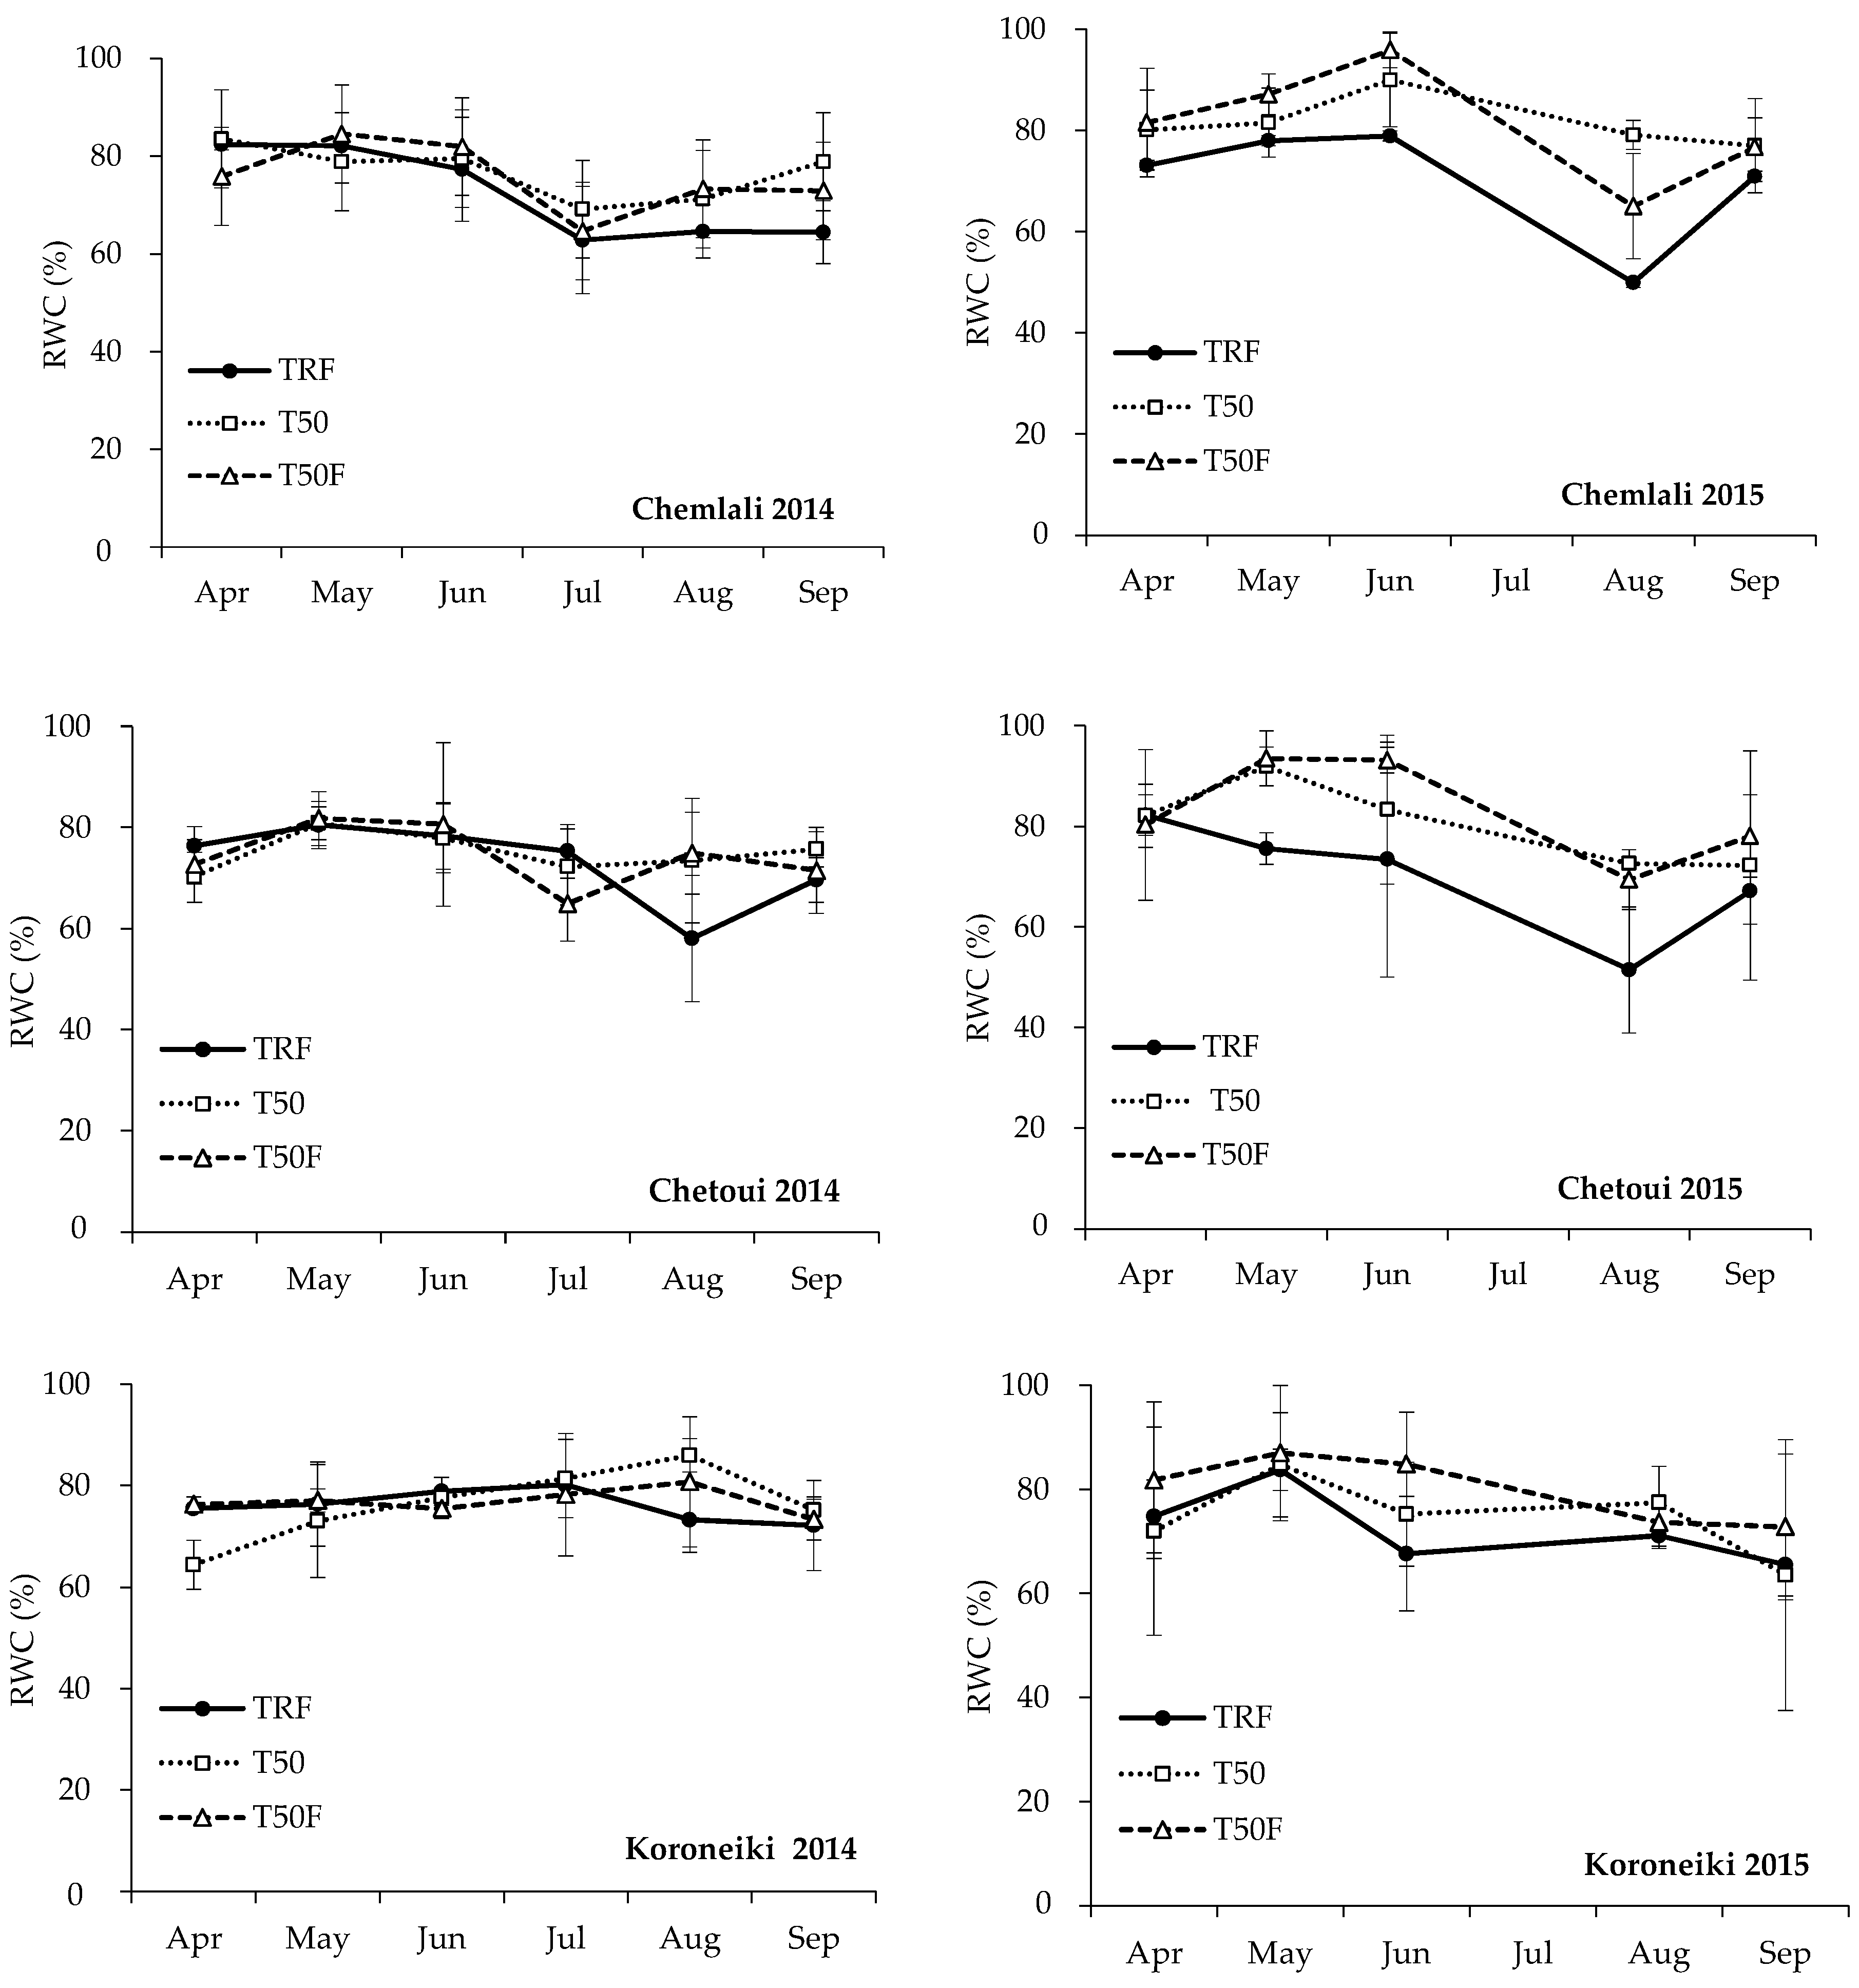
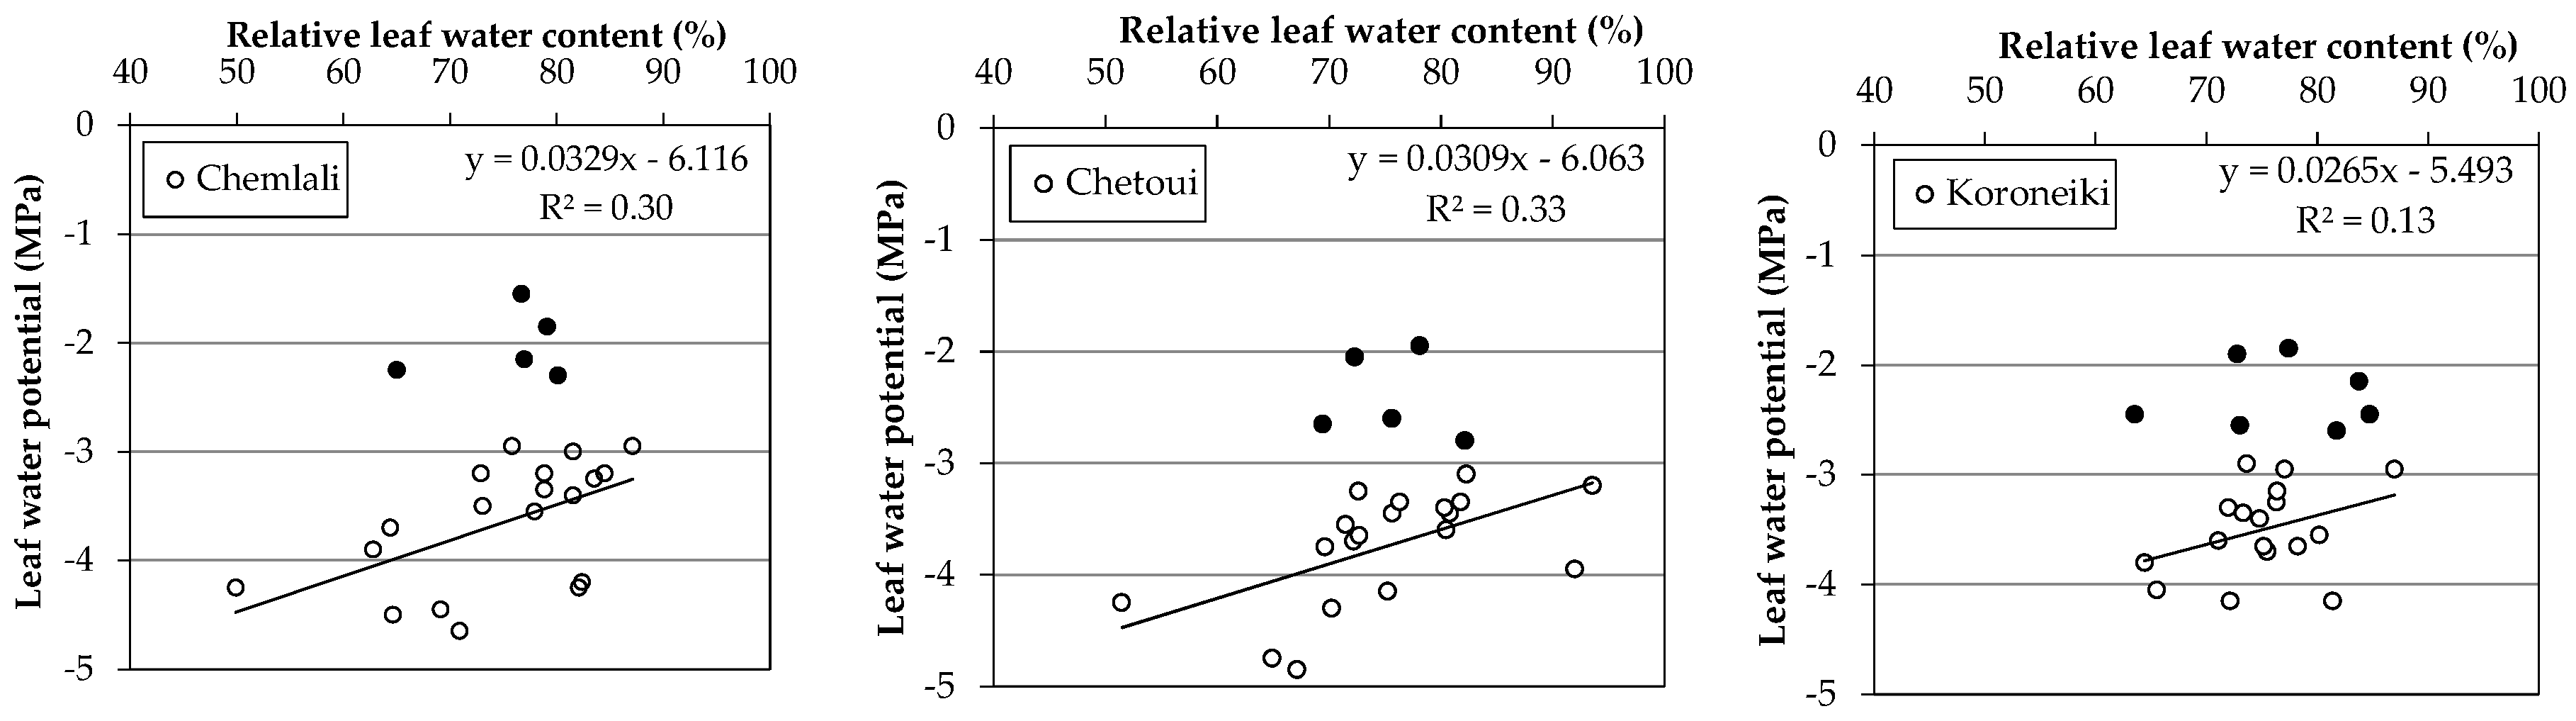
3.2.4. Relative Leaf Water Content

The average relative leaf water contents, RWC, measured at different growth stages, such as flowering (April), fruit set (May–June), pit hardening (from mid-July to mid-August) and maturity (September) during the two crop seasons (2014 and 2015) are presented in Figure 5.
Relative leaf water contents followed similar patterns than those observed for Ψleaf. The lowest RWC was detected in both the growing season, under the rainfed treatment. In the first growth season (2014), the relative water content ranged between 57% and 85%. For all the investigated cultivars, the minimum value was registered during the pit hardening stage (from mid-July to mid-August), when the atmospheric demand for water demand and crop evapotranspiration were high. When observing the cultivars’ behavior, the Chetoui cultivar was characterized by the largest variation of RWC in all the treatments, with a maximum in 2014 of 87% registered in T50F and a minimum of 57% in TRF treatment. Similar variations were observed in 2015 when the leaf water content ranged between 51% and 93%. However, the difference between treatments and for all the cultivars resulted statistically not significant for both the growing seasons (2014 and 2015), due to the large variability of the measurements.
Figure 6 shows the relationships between the leaf water potential and the relative leaf water content. As can be observed, for values of Ψleaf lower than about −2.90 MPa, the reduction of the RWC determine the decrease of Ψleaf. This behavior was more pronounced for the Chemlali and Chetoui cultivars, for which the slopes of the regression lines were equal to 0.0329 and 0.0309, respectively. On the other hand, the Koroneiki cultivar was characterized by a more limited variability of RWC, values of Ψleaf that never fell below −4.20 MPa, and a slope of the regression line equal to 0.0265.

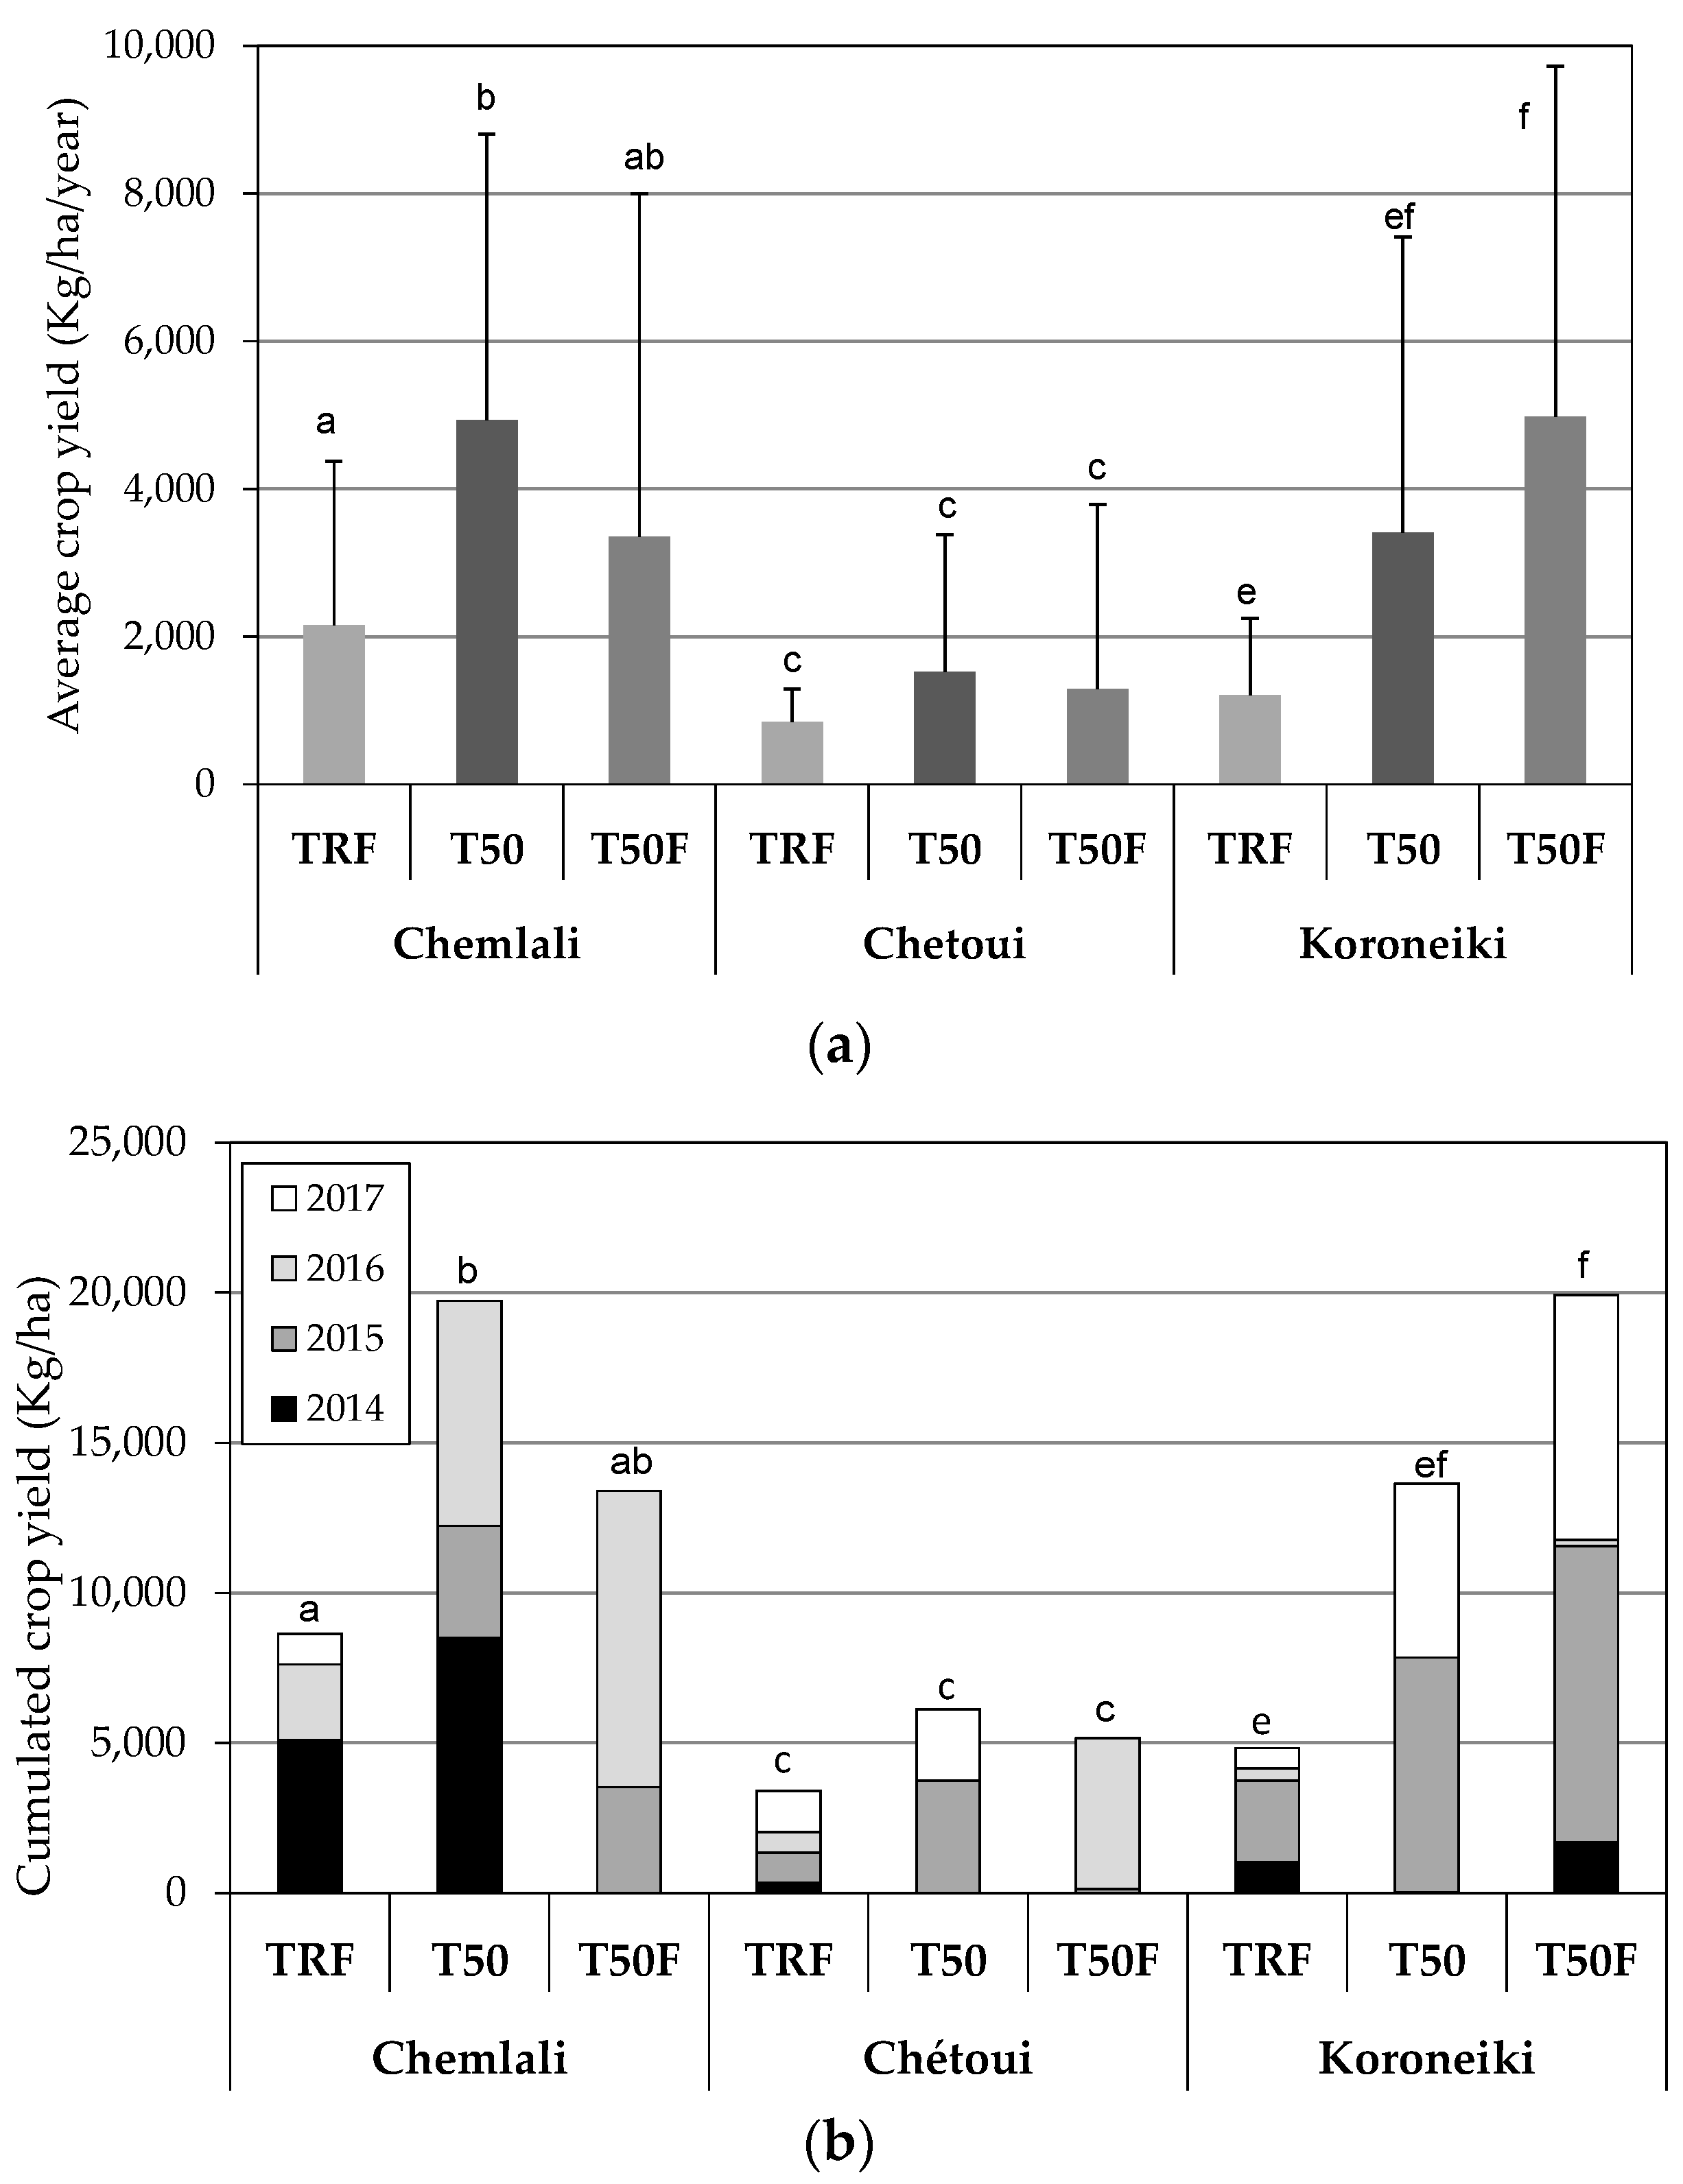
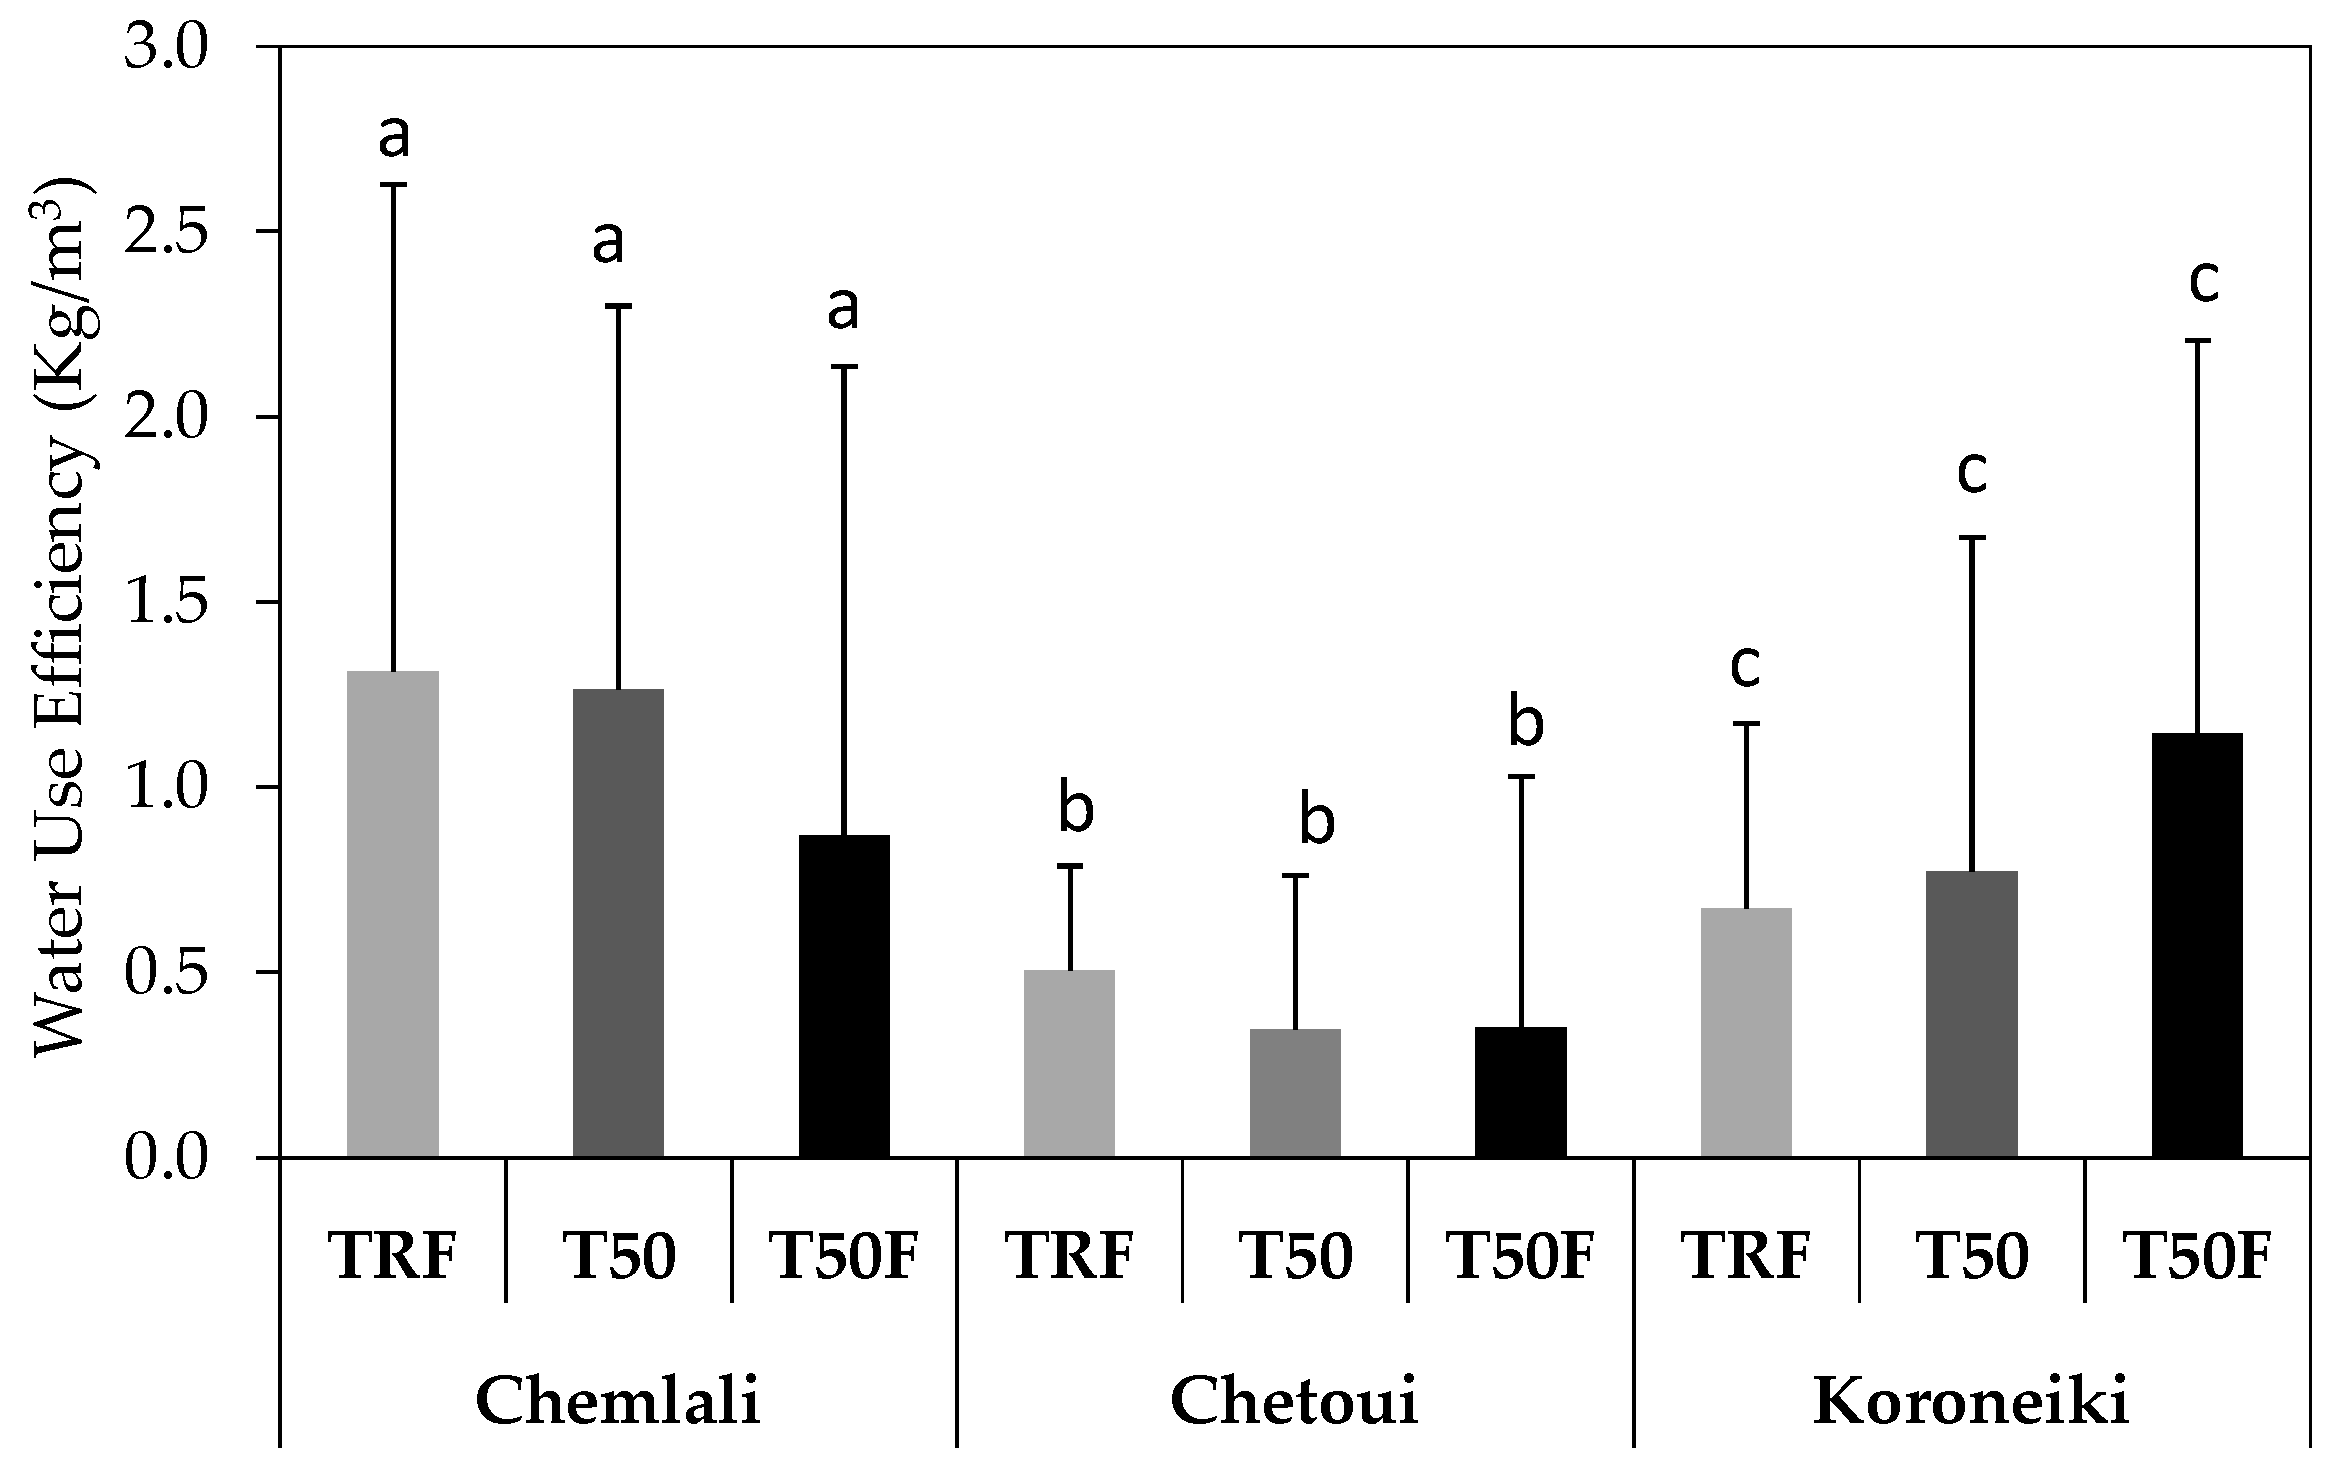
3.3. Crop Yield and Water Use Efficiency

Considering the three cultivars, the rainfed treatment (TRF) showed the lowest average yield, which was equal to 2159 Kg/ha/year, 850 Kg/ha/year, and 1207 Kg/ha/year for the Chemlali, Chetoui, and Koroneiki cultivars, respectively (Figure 7a). Significantly higher yields were obtained for Chemlali and Koroneiki in treatments T50 and T50F. The highest yield, equal to 4981 Kg/ha/year was achieved on the Koroneiki, receiving 50% ETc and fertilized (T50F). Independently from the management strategy, the Chetoui showed the lowest yield, which did not exceed 1530 Kg/ha/year, even for the irrigated treatments. Figure 7b shows the cumulated crop yields obtained for the three cultivars and in all the growth seasons (2014–2017). For the Chetoui cultivar, differences in cumulated crop yield achieved in the three treatments resulted statistically not significant. On the other hand, for the Chemlali and Koroneiki cultivars, the cumulative yield showed significant differences (p < 0.05) between rainfed treatment and irrigated or irrigated and fertilized ones. For the latter two cultivars, the maximum yield during the four years was slightly lower than 20 tons/ha (Figure 7b).
The average values of water use efficiency (WUE), evaluated as the ratio between the annual yield and the total water supply, for the different cultivars and treatments, with the related standard deviations are shown in Figure 8. Fairly low water use efficiency was found in the different treatments of the Chetoui cultivar, with values equal to 0.50, 0.34 and 0.35 Kg/m3, for TRF, T50, and T50F, respectively. For the Chemlali cultivar, the highest values of WUE were associated with treatments TRF and T50, with values equal to 1.31 and 1.26 Kg/m3, respectively. On the other hand, for the Koroneiki cultivar, the highest value of WUE, equal to 1.14 Kg/m3, was observed in the treatments T50F. However, per each cultivar, due to the high standard deviations associated with the treatments, the values of WUE were statistically not significant (p < 0.05) according to the Duncan test.

4. Discussion

Plant water status and yield response for the three principal oil cultivars cultivated in central Tunisia, Chemlali, Chetoui and Koroneiki, during a long period study (four experimental seasons), showed a strong plasticity according to the different management options examined: trees cultivated under rainfed condition (TRF), trees receiving a supply of water equal to 50% ETc (T50) and trees receiving 50% of ETc and fertilized (T50F). However, the differences between cultivars were identified regarding the experimental conditions.
Under rainfed conditions, a large reduction of the average leaf water potential (Ψleaf) was found. All cultivars showed similar behavior, but with variable intensity. During the four years of study, the most stressed cultivar was the Chemlali, followed by Chetoui and Koroneiki. In the four years, the average Ψleaf on the examined cultivars quite often resulted well below −2.0 MPa, indicating a certain level of water stress (Figure 4). In the irrigated (T50) and fertigated (T50F) treatments and for all the examined cultivars, the average leaf water potential increased. These results are in line with those obtained in previous studies in which it was stated that olive trees tend to decrease their leaf water potential to establish higher gradients between soil and leaves, to allow the root absorption [13,14,40]. Bongi and Paliotti [41] and Tognetti et al. [12] indicated that olive trees are characterized by a low hydraulic activity, which is responsible for a high degree of variation in leaf water potentials. Factors like cultivar adaptation, aridity of climate implying high thermal amplitudes, low frequency of rain and the high evaporative demand may also explain these results [15,40,42,43,44]. Fernandez et al. [16] and Moriana et al. [11] noticed that under conditions of high temperatures, olive plants can reduce the excessive water loss by closing their stomata. For this reason, the olive trees can reach lower leaf water potentials than other fruit species [45,46]. Under the Tunisian climate, Ben Rouina et al. [40] noted that Ψleaf reached values around −4.0 MPa in rainfed conditions and sandy soils. According to Moriana et al. [11], the lowest potential minimum value under rainfed conditions could reach −8.0 MPa. The achieved results corroborated those of Aïachi Mezghani et al. [47] who, investigating the behavior of local and foreign cultivars under two irrigation treatments (water supply of 10% ETc and fully irrigated with 100% ETc), showed that Koroneiki had strong plasticity according to its physiological responses.
According to the evolution of the growing season, the leaf water potential tended to decrease significantly during summer (July, August, and September), in all the different management options (rainfed, irrigated, and fertigated) and cultivars. This effect was more pronounced for non-irrigated trees, when the water availability was low and the evapotranspiration very high, due to the severe climatic conditions (high temperature, no rain, and depleted soil moisture) (Figure 2). Relative leaf water content measured at different growth stages during two successive crop seasons (2014–2015), followed the same patterns observed for Ψleaf. Moreover, it was observed that for values of Ψleaf lower than about −2.90 MPa, the lower the RWC the smaller the Ψleaf. The RWC decreased more markedly in the rainfed treatment than in the other management options (Figure 5). The Chemlali and Chetoui cultivars had the largest variations of the relative leaf water content, ranging in the two years between 50% and about 90% (Figure 6).
The achieved results are in line with those reported by Wahbi et al. [43], Tognetti et al. [12] and Martin-Vertedor et al. [3], which indicated that the midday leaf water potentials decrease throughout the summer and tend to recover in early fall. On the contrary, Tognetti et al. [12] noticed the lowest values of Ψleaf at midday, in rainfed orchards issued of Frantoio and Leccino, in early fall will not recover the spring values. According to Abd-El-Rahman et al. [46], the leaf water content in olive trees is lower than in the other fruit species; the olive tissues can rapidly become turgid even when water uptake is low so that the full turgidity can be achieved after limited amounts of rain. Ben Rouina et al. [40] found that RWC was about 40% when predawn leaf water potential was between −5.0 MPa and −7.0 MPa. The trees receiving a water supply even lower than the optimal need and associated with the fertilizers were characterized by a better water status. This result was more evident on Chemlali and Koroneiki, which recovered rapidly and seemed to be more adapted for the Tunisian climatic condition. The achieved results corroborated those of Guerfel et al. [48], who observed a higher resistance to the drought of Chemlali than of Chetoui cultivar, because of the ability of the cultivar to maintain the turgor, even when the trees are maintained under water deficit and/or anatomical alterations in their mesophyll tissues induced by water stress occur.
The minimum value of leaf water potential (Ψleaf) and leaf water content (RWC) were noticed during the pit hardening stage (July and August) for all the investigated varieties. The pit-hardening seems to be an important phenological stage, which coincides with the hottest temperature and the driest period. The results evidenced that, under the local climate, the maximum water stress occurred on pit hardening (Figure 1), so that irrigation scheduling should be recommended in such a period. However, Alegre and Girona [49] reported that the fruits affected by water stress during pit-hardening, rapidly recover after the occurrence of water supplies. For the experiment, the values of Ψleaf were higher at the beginning of the fall season (October) than at the end of the winter period, because the plant water status was restored by the frequent autumn rains.
Seasonal differences in crop water status were observed in the different growing seasons. In 2014, which had an exceptionally hot summer, the Chemlali and Chetoui varieties seemed to be more stressed even when they were irrigated (T50) and fertilized (T50F). The values of Ψleaf reached values of −4.75 to −4.45 MPa. Such declines of leaf water potentials were observed by several authors, even in irrigated olive orchards [3,9,12,14,50]. These authors observed that seasonal dynamics of plant water status respond to the variations in tree water status, the soil moisture conditions, and the atmospheric evaporative demand. Some uncertainties were evoked on the threshold of Ψleaf and the use of leaf potential to estimate the crop water status. Martin-Vertedor et al. [3] and Ahumada Orellana et al. [9] recommended the measure of stem potential at midday (Ψstem), which is more precise for irrigated mature olive orchards, less sensitive to the atmospheric changes, and gives more stable values so that it should be preferred to Ψleaf.
At the beginning of the day, slight differences in Ψleaf between treatments and varieties were recorded (Figure 3). Ameglio et al. [51], Fernandez et Moreno [34] and Tognetti et al. [5,12] indicated that the measurements of predawn leaf potential provide a good estimation of the soil water content, because it is measured in the absence of water fluxes, when the plant is in equilibrium with the soil. Tognetti et al. [12] found a high correlation between predawn potential measured and xylem water potential, which may facilitate the assessment of water status in the olive orchards. After that, all varieties and treatments showed a decrease in the Ψleaf as the day progresses. The lowest values were recorded around midday, between 13:00 and 15:00 GMT. After this period, the values of Ψleaf tended to increase throughout the day, until the late afternoon. Such a dynamic was also observed by Fernandez et al. [16] and Fernandez and Moreno [34] for the Manzanilla cultivar, which showed a rapid decrease of Ψleaf in the morning, reaching minimum values between 14:00 and 16:00 GMT. However, according to these researchers, the values of Ψleaf remained almost constant throughout the day until the late afternoon, when a sharp increase was observed.
The highest average yields, calculated with the data collected in the four years, were obtained for the Chemlali and Koroneiki varieties, under the T50 and T50F treatments, respectively. In particular, the highest yield for the Koroneiki cultivar resulted, on average, equal to 4981 Kg/ha/year. On the other hand, the Chetoui cultivar showed the lowest average yield, which has never exceeded 1530 Kg/ha/year. This result corroborated a previous work of Aïachi Mezghani et al. [6], who evidenced the poor adaptability of this cultivar (low production per tree) to the local environmental conditions, even when the trees are fully irrigated with the restitution of 100% ETc. The non-irrigated treatments showed the lowest average yields which were equal to 2159 Kg/ha/year, 850 Kg/ha/year, and 1207 Kg/ha/year, for the Chemlali, Chetoui, and Koroneiki varieties, respectively.
The maximum cumulated yield, in the four years, was equal to about 20 tons/ha for Chemlali (T50) and Koroneiki (T50F). Hussein [29] recommended irrigation associated with the application of fertilizers to improve the response of Manzanillo olive trees in Saudi Arabia (high vegetative growth, improved fruit and oil yield). According to Aïachi Mezghani et al. [6], the application of a limited amount of water, ranging from 20% to 50% ETc, can respond to the needs of the olive trees cultivated in central Tunisia. This irrigation volume can be adjusted according to the expected crop load. The smallest water amount (20% ETc) was recommended for the non-bearing years (“off” years), while the relatively higher irrigation amounts (50% ETc) could be advisable during years with high production (“on” years). Based on the acquired data, it seems that water supply is the main factor influcencing the increase of crop yield for Chemlali and Chetoui cultivars, resulting in the effect of fertilization being unclear. The lack of data related to the presence of macroelements in the soil and/or in the plants made it difficult to assess the reasons why for Chemlali and Chetoui cultivars the values of yearly and cumulated crop yields obtained in T50F resulted lower than the corresponding evaluated in T50. Further measurements are therefore needed to explore the effects of fertilization on these varieties, even to identify the macroelement which, more than others, limits the production. On the other hand, the Koroneiki cultivar was more sensible to the application of fertilizers, so that the maximum yield was obtained in T50F treatment.
A big variability on the crop yield was observed in the four experimental years, as evidenced by the high standard deviations characterizing the different treatments (Figure 7a). The observed variability is mainly due to the alternate bearing behavior, typical of the species which alters the productive patterns of the plant over the years, making less evident the effects of irrigation on the productive levels [4,6,12,15,47,52]. Serrano [53] supported the hypothesis that the yield, during the “off” years, can be reduced by as much as 90% of that achievable during the “on” years.
The highest values of WUE, calculated as the ratio between the crop yield and the total water applied, were registered in TRF and T50 treatments for the Chemlali and in T50F for the Koroneiki cultivar. This index has been used to evaluate the efficiency of different irrigation management strategies and it influenced not only by physiological but also by non-physiological factors, such as irrigation management and soil evaporation [12,14,22,43].

5. Conclusions

Under the arid climate of Tunisia, the water supply (50% ETc) used alone or associated with a complementary fertilizer compound based on the actual needs of the olive trees, improved the crop water status and increased the crop productivity. The comparison of different olive oil varieties, throughout a long period of observation, gave important information on their physiological performances and their reproductive behavior. The local cultivar Chemlali and the one recently introduced, Koroneiki, showed strong plasticity of the physiological responses and also a very interesting potential production. The Chetoui cultivar showed poor adaptability to the arid conditions of southern Tunisia even under the application of water and fertilizers. Further studies are in progress to assess the effects of remedial irrigation and fertigation on vegetative growth, flowering, fruit and oil parameters. The achieved results evidenced that for Chemlali and Chetoui cultivars, irrigation has to be considered the main factor influencing significantly crop yield, resulting unclear the effects of fertilization. On the other hand, the effect of fertilization was more pronounced for the Koroneiki cultivar, which was associated with the maximum yield when irrigated with 50% ETc and fertilized.

Author Contributions

Implementation of the experimental protocol and planning experimental, M.A.M. and F.A.; providing fertilizer by Agro-nutrition, F.A.; data acquisition and analysis, manuscript redaction and data interpretation, M.A.M., A.M., F.A.K. and I.Z.; review and editing, G.P.

Funding

This research was funded by the Tunisian Ministry of Higher Education and Scientific Research, under the project LR16IO02 and with the contribution of the Olive Institute of Tunisia.

Acknowledgments

Authors would express their gratitude to Foued Labidi, Latifa Attia and Zouheir Guergueb. for their valuable help to the field experiments, as well as to Agro-nutrition which purchased the fertilizer, and the Olive Institute which provided the financial support.

Conflicts of Interest

The authors declare no conflict of interest. The funders had no role in the design of the study; in the collection, analyses, or interpretation of data; in the writing of the manuscript, or in the decision to publish the results.

References

  1. Food and Agricultural Organization of the United Nations, FAO. Tunisie, Analyse de la Filière Oléicole; Food and Agriculture Organization of the United Nations: Rome, Italy, 2015; p. 186. Available online: http://www.fao.org/3/a-i4104f.pdf (accessed on 10 July 2019).
  2. Aïachi Mezghani, M.; Ayadi, F.; Attia, I.; Zouari, I.; Labidi, F.; Attia, L. Effects of irrigation and fertigation applied during a long–period on tree growth, yield and oil quality responses of olive varieties. Acta Hortic. 2018, 1199, 255–260. [Google Scholar] [CrossRef]
  3. Martin Vertedor, A.I.; Perez Rodriguez, J.M.; Prieto Losada, M.H.; Fereres Castiel, E. Interactive responses to water deficits and crop load in olive (Olea Europaea, L.; cv. Morisca). I—Growth and water relations. Agric. Water Manag 2011, 98, 941–949. [Google Scholar] [CrossRef]
  4. Martin Vertedor, A.I.; Perez Rodriguez, J.M.; Prieto Losada, M.H.; Fereres Castiel, E. Interactive responses to water deficits and crop load in olive (Olea Europaea, L.; cv. Morisca). II-Water use, fruit and oil yield. Agric. Water Manag. 2011, 98, 950–958. [Google Scholar] [CrossRef]
  5. Tognetti, R.; D’Andria, R.; Morelli, G.; Alvino, A. The effect of deficit irrigation on seasonal variations of plant water use in Olea Europaea, L. Plant Soil 2005, 273, 139–155. [Google Scholar] [CrossRef]
  6. Aïachi Mezghani, M.; Masmoudi Charfi, C.; Gouiaa, M.; Labidi, F. Vegetative and reproductive behavior of some olive tree cultivars (Olea europaea L.) under deficit irrigation regimes in semi-arid conditions of Central Tunisia. Sci. Hortic. 2012, 146, 143–152. [Google Scholar] [CrossRef]
  7. Bustan, A.; Avni, A.; Yermiyahu, U.; Ben-Gal, A.; Riov, J.; Erel, R. Interactions between fruit load and macroelement concentrations in fertigated olive (Olea europaea L.) trees under arid saline conditions. Sci. Hortic. 2013, 152, 44–55. [Google Scholar] [CrossRef]
  8. Rufat, J.; Villar, J.M.; Pascual, M.; Falguera, V.; Arbones, A. Productive and vegetative response to different irrigation and fertilization strategies of an Arbequina olive orchard grown under super-intensive conditions. Agric. Water Manag. 2014, 144, 33–41. [Google Scholar] [CrossRef]
  9. Ahumada Orellana, L.; Ortega-Farias, S.; Searles, P.; Retamales, J. Yield and water productivity responses to irrigation cut-off strategies after fruit set using stem water potential thresholds in a super-high density olive orchard. Front. Plant Sci. 2017, 8, 1280. [Google Scholar] [CrossRef]
  10. Patumi, M.; D’Andria, R.; Marsilio, V.; Fontanazza, G.; Morelli, G.; Lanza, B. Olive and olive oil quality after intensive monocone olive growing (Olea europaea L.; cv. Kalamata) in different irrigation regimes. Food Chem. 2002, 77, 27–34. [Google Scholar] [CrossRef]
  11. Moriana, A.; Orgaz, F.; Pastor, M.; Fereres, E. Yield responses of a mature olive orchard to water deficits. J. Am. Soc. Hortic. Sci. 2003, 128, 425–431. [Google Scholar] [CrossRef]
  12. Tognetti, R.; D’Andria, R.; Lavini, A.; Morelli, G. The effect of deficit irrigation on crop yield and vegetative development of Olea europaea L. (cvs. Frantoio and Leccino). Eur. J. Agron. 2006, 25, 356–364. [Google Scholar] [CrossRef]
  13. Ben Ahmed, C.; Ben Rouina, B.; Boukhris, M. Effects of water deficit on olive trees cv.; Chemlali under field conditions in arid region in Tunisia. Sci. Hortic. 2007, 113, 267–277. [Google Scholar] [CrossRef]
  14. Iniesta, F.; Testi, L.; Orgaz, F.; Villalobos, F.J. The effects of regulated and continuous deficit irrigation on the water use, growth and yield of olive trees. Eur. J. Agron. 2009, 25, 258–265. [Google Scholar] [CrossRef]
  15. Palese, A.M.; Nuzzo, V.; Favati, F.; Pietrafesa, A.; Celano, G.; Xiloyannis, C. Effects of water deficit on the vegetative response, yield and oil quality of olive trees (Olea europaea L.;cv Coratina) grown under intensive cultivation. Sci. Hortic. 2010, 125, 222–229. [Google Scholar] [CrossRef]
  16. Fernandez, J.E.; Moreno, F.; Giron, I.F.; Blazquez, O.M. Stomatal control of water use in olive tree leaves. Plant Soil 1997, 190, 179–192. [Google Scholar] [CrossRef] [Green Version]
  17. Rallo, G.; Minacapilli, M.; Ciraolo, G.; Provenzano, G. Detecting crop water status in mature olive groves using vegetation spectral measurements. Biosyst. Eng. 2014, 128, 52–68. [Google Scholar] [CrossRef]
  18. Autovino, D.; Minacapilli, M.; Provenzano, G. Modelling bulk surface resistance by MODIS data and assessment of MOD16A2 evapotranspiration product in an irrigation district of Southern Italy. Agric. Water Manag. 2016, 117, 86–94. [Google Scholar] [CrossRef]
  19. Negm, A.; Capodici, F.; Ciraolo, G.; Maltese, A.; Provenzano, G.; Rallo, G. Assessing the performance of thermal inertia and hydrus models to estimate surface soil water content. Appl. Sci. 2017, 7, 975. [Google Scholar] [CrossRef]
  20. Awada, H.; Ciraolo, G.; Maltese, M.; Provenzano, G.; Moreno Hidalgo, M.A.; Còrcoles, J.I. Assessing the performance of a large-scale irrigation system by estimations of actual evapotranspiration obtained by Landsat satellite images resampled with cubic convolution. Int. J. Appl. Earth Obs. Geoinf. 2019, 75, 96–105. [Google Scholar] [CrossRef]
  21. Rallo, G.; Baiamonte, G.; Manzano Juàrez, J.; Provenzano, G. Improvement of FAO-56 model to estimate transpiration fluxes of drought tolerant crops under soil water deficit: Application for olive groves. J. Irrig. Drain. Eng. 2014, 140, 1–8. [Google Scholar] [CrossRef]
  22. Abuhashim, M.S.D.; Shaban, K.A. Deficit irrigation management as strategy to adapt water scarcity—Potential application on Mediterranean saline soils. Egypt. J. Soil Sci. 2017, 5, 261–271. [Google Scholar]
  23. Provenzano, G.; Rodriguez Sinobas, L.; Roldàn Canas, J. Irrigated agriculture: Water resources management for a sustainable environment. Biosyst. Eng. 2014, 128, 1–3. [Google Scholar] [CrossRef] [Green Version]
  24. Martìnez Gimeno, M.A.; Bonet, L.; Provenzano, G.; Badal, E.; Intrigliolo, D.S.; Ballester, C. Assessment of yield and water productivity of clementine trees under surface and subsurface drip irrigation. Agric. Water Manag. 2018, 206, 209–216. [Google Scholar] [CrossRef]
  25. Fernández, J.E. Irrigation management in olive. In Proceedings of the 2nd International Seminar Olivebioteq, Marsala-Mazara del Vallo, Italy, 5–10 November 2006; pp. 295–305. [Google Scholar]
  26. Rallo, G.; Gonzàlez Altozano, P.; Manzano Juàrez, J.; Provenzano, G. Using field measurements and FAO-56 model to assess the eco-physiological response of citrus orchards under regulated deficit irrigation. Agric. Water Manag. 2017, 180, 136–147. [Google Scholar] [CrossRef]
  27. Ghazouani, H.; Rallo, G.; Mguidiche, A.; Latrech, B.; Douh, B.; Boujelben, A.; Provenzano, G. Assessing hydrus-2D model to investigate the effects of different on-farm irrigation strategies on potato crop under subsurface drip irrigation. Water MDPI 2019, 11, 540. [Google Scholar] [CrossRef]
  28. Sallam, A.; Shaban, K.A.; Abuhashim, M. Influence of water deficit on seed yield and seed quality of Faba bean under saline soil conditions at North Sinai, Egypt. Egypt. J. Soil Sci. 2014, 54, 265–278. [Google Scholar]
  29. Hussein, A.H.A. Response of Manzanillo olive (Olea europaea L.) cultivar to irrigation regime and potassium fertigation under Tabouk conditions. J. Agron. 2008, 7, 285–296. [Google Scholar] [CrossRef]
  30. Therios, I. Olives. In Crop Production Science in Horticulture; Cabi Publishing: Wallingford, UK, 2009; Volume 18, p. 425. [Google Scholar]
  31. Fernández Escobar, R. Fertilization. In Production Techniques in Olive Growing; International Olive Council: Madrid, Spain, 2007; pp. 145–168. [Google Scholar]
  32. Tekaya, M.; El Gharbi, S.; Mechri, B.; Cheheb, H.; Bchir, H.; Chraief, I.; Ayachi Mezghani, M.; Boujneh, D.; Attia, F.; Hammami, M. Improving performance of olive trees by the enhancement of key physiological parameters of olive leaves in response to foliar fertilization. Acta Physiol. 2016, 38, 101. [Google Scholar] [CrossRef]
  33. Allen, R.; Pereira, L.S.; Raes, D.; Smith, M. Crop evapotranspiration. Guidelines for computing crop water requirements. FAO Irrig. Drain. 1998, 300, DO5190. [Google Scholar]
  34. Fernandez, J.E.; Moreno, F. Water use by olive tree. J. Crop. Prod. 1999, 2, 101–162. [Google Scholar] [CrossRef]
  35. Masmoudi Charfi, C.; Masmoudi, M.M.; Ben Mechlia, N. Irrigation de l’olivier: Cas des jeunes plantations intensives. Rev. Ezzaitouna 2004, 10, 37–49. [Google Scholar]
  36. Turner, N.C. Techniques and experimental approaches for the measurement of plant water status. Plant Soil 1981, 58, 339–366. [Google Scholar] [CrossRef]
  37. El-Sharkawi, H.M.; Salama, F.M. Drought resistance in some wheat and barley cultivars. I. Analysis of transpiration curves, II. Adjustment in internal water balance. In Proceedings of the 7th Arabian Science Conference, Cairo, Egypt, 23–26 September 1973. [Google Scholar]
  38. Weatherly, P.E. Studies on the water relations of the cotton plants. I. The field measurement of water deficits in leaves. N. Phytol. 1950, 49, 81–97. [Google Scholar] [CrossRef]
  39. Weatherly, P.E.; Barrs, C. Are-examination of relative turgidity technique for estimating water deficits in leaves. Aust. J. Biol. Sci. 1962, 15, 413–428. [Google Scholar]
  40. Ben Rouina, B.; Trigui, A.; D’andria, R.; Boukhris, M.; Chaieb, M. Effects of water stress and soil type on photosynthesis, leaf water potential and yield of olive trees (Olea europaea L.; cv.; Chemlali Sfax). Aust. J. Exp. Agric. 2007, 47, 1484–1490. [Google Scholar] [CrossRef]
  41. Bongi, G.; Palliotti, A. Olive. In Handbook of Environmental Physiology of Fruit Crop; Schaffer, B., Anderson, P.C., Eds.; CRC Press Inc.: Boca Raton, FL, USA, 1994; pp. 165–182. [Google Scholar]
  42. Dichio, B.; Xiloyannis, C.; Angelopoulos, K.; Nuzzo, V.; Bufo, S.A.; Celano, G. Drought-induced variations of water relations parameters in Olea europaea L. Plant Soil 2003, 257, 381–389. [Google Scholar] [CrossRef]
  43. Wahbi, S.; Wakrim, R.; Aganchich, B.; Tahi, H.; Serraj, R. Effects of partial root-zone drying (PRD) on adult olive tree (Olea europaea L.) in field conditions under arid climate. I. Physiological and agronomic responses. Agric. Ecosyst. Environ. 2005, 106, 289–301. [Google Scholar] [CrossRef]
  44. Naor, A. Irrigation scheduling and evaluation of tree water status in deciduous orchards. Hortic. Rev. 2006, 32, 111–165. [Google Scholar]
  45. Larsen, F.F.; Higgins, S.S.; Wir, A.A. Diurnal water relations of apple, apricot, grape, olive and peach in an arid environment (Jordan). Sci. Hortic. 1989, 39, 211–222. [Google Scholar] [CrossRef]
  46. Abd-El-Rahman, A.A.; Shalaby, A.F.; Balegh, M.S.N. Water economy of olive under desert conditions. Flora. Abt. B 1966, 156, 202–212. [Google Scholar]
  47. Aïachi Mezghani, M.; Sahli, A.; Grati, N.; Gaaliche, B.; Laaribi, I. Effects of two irrigations regimes on olive trees cultivated in arid region of Tunisia: Growth, yield responses and water relations. Eur. Sci. J. 2014, 10, 468–489. [Google Scholar]
  48. Guerfel, M.; Baccouri, O.; Boujnah, D.; Chaibi, W.; Zarrouk, M. Seasonal changes in water relations and gas exchange in leaves of two Tunisian olice (Olea europaea L.) cultivars under water deficit. J. Hortic. Sci. Biotech. 2007, 82, 721–726. [Google Scholar] [CrossRef]
  49. Alegre, S.; Girona, J. Riego deficitario controlado en olivo. Fruticult. Prof. 1997, 88, 70–78. [Google Scholar]
  50. Charfi Masmoudi, C.; Aïachi Mezghani, M.; Gouia, M.; Laabidi, F.; Ben Raguaya, S.; Ouled Amor, A.; Bousnina, M. Water relations of olive trees cultivated under deficit irrigation regimes. Sci. Hortic. 2010, 125, 573–578. [Google Scholar] [CrossRef]
  51. Ameglio, T.; Archer, P.; Cohen, P.; Valancogne, M.; Daudet, F.; Duyau, S.; Cruziat, P. Significance and limits in the use of predawn leaf water potential for tree irrigation. Plant Soil 1999, 207, 155–167. [Google Scholar] [CrossRef]
  52. Correa-Tedesco, G.; Rousseaux, M.C.; Searles, P.S. Plant growth and yield responses in olive (Olea europaea L.) to different irrigation levels in an arid region of Argentina. Agric. Water Manag. 2010, 97, 1829–1837. [Google Scholar] [CrossRef]
  53. Serrano, F.J.F. Yield and physiology response of ‘Azeiteira’ table olive variety to drip irrigation at different water use level. Olivae 1998, 74, 50–53. [Google Scholar]
Figure 1. Temporal patterns of reference evapotranspiration ET0 (mm/day) and rainfall (mm) during the four investigated years.
Sustainability 11 04812 g001
Figure 2. Temporal patterns of leaf water potential for the three cultivars, as measured on 16 April, 16 May, 16 July, and 16 September, of the four growing seasons (2014–2017). Mean values ± standard deviations are shown.
Sustainability 11 04812 g002
Figure 3. Diurnal time course of leaf water potential measured on 15 May 2014 on the three cultivars under the different treatments (TRF, T50, and T50F). Each value was obtained as the average of three observations. Verticals bars represent the standard deviations.
Sustainability 11 04812 g003
Figure 4. Mean and standard deviation of midday leaf water potentials (MPa) measured during the four growing seasons in the three cultivars, under non-irrigated treatment (TRF), trees irrigated with 50% ETc (T50), and additional fertilization (T50F). Values with different letters indicate that the differences are statistically significant (p < 0.05) according to the Duncan test.
Sustainability 11 04812 g004
Figure 5. Relative leaf water content (RWC) for Chemlali, Chetoui and Koroneiki cultivars measured during the two crop seasons 2014 and 2015. Verticals bars represent the standard deviations.
Sustainability 11 04812 g005
Figure 6. Relationships between the leaf water potential (Ψleaf) vs. the relative water content (RWC) obtained with the data collected in 2014 and 2015. The equations of the best fitting curves are also indicated. Filled dots (Ψleaf > −2.90 MPa) were not used for the regressions.
Sustainability 11 04812 g006
Figure 7. Average (a) and cumulated crop yield (b) obtained in the three treatments and in the four years. For a given cultivar, values with different letters (a, b, ab, etc.) indicate that differences are statistically significant (p < 0.05, Duncan test) for the treatments. Verticals bars represent the standard deviations.
Sustainability 11 04812 g007
Figure 8. Water use efficiency (WUE) calculated for each cultivar and treatment. The values corresponding to the treatment are the average of the values obtained in the four growing seasons. Verticals bars represent the standard deviations. For a given cultivar, values with the same letters (a, b, c) indicate that the differences are statistically not significant (p < 0.05, Duncan test) for the treatments.
Sustainability 11 04812 g008
Table 1. Yearly values of air temperature (T), relative humidity (RH), reference evapotranspiration (ET0), maximum crop evapotranspiration (ETc), rainfall and irrigation amount (IA) during the four investigated years.
YearClimatic ConditionsIrrigations Parameters
T (°C)RH (%)ET0 (mm)ETc (mm)Rainfall (mm)IA (mm)
TMaxTMinTMean
201440.05.020.759.01486.0788.0168.3309.0
201540.85.920.262.01411.0745.0195.7274.0
201641.42.820.761.01482.0782.0160.7310.0
201738.24.520.659.71408.0748.0155.0296.0
Table 2. Results of multivariate analysis (MANOVA) to assess the effect on leaf water potential of year, treatment and cultivar and their interaction on leaf water content for the four dates of observations. The table reports the F-values evaluated to interpreter the respective effects.
FactorDate 1Date 2Date 3Date 4
Year209.91 **1001.71 **629.27 **518.14 **
Treatment34.07 **28.09 **196.83 **1094.75 **
Cultivar20.46 *78.51 **135.82 **1.279NS
Year × Treatment2.71 *26.81 **77.51 **117.70 **
Year × Cultivar6.96 **40.52 **15.61 **35.51 **
Treatment × Cultivar11.34 **50.81 **5.42 **24.959 **
Year x Treatment × Cultivar10.74 **33.04 **35.55 **18.19 **
NS: non-significant, * significant at p < 0.05, ** significant at p < 0.001.

