Article

Improving Phosphorus Use Efficiency and Optimizing Phosphorus Application Rates for Maize in the Northeast Plain of China for Sustainable Agriculture

1
College of Life Science, Yan’an University, Yan’an 716000, Shaanxi, China
2
College of Land and Environmental, Shenyang Agriculture University, Shenyang 110866, China
*
Authors to whom correspondence should be addressed.
Sustainability 2019, 11(17), 4799; https://doi.org/10.3390/su11174799
Submission received: 7 August 2019 / Revised: 22 August 2019 / Accepted: 29 August 2019 / Published: 3 September 2019
(This article belongs to the Special Issue Sustainable Cropping Practices to Counteract Environmental Stresses)

Abstract

:
Optimizing the phosphorus (P) application rate can increase grain yield while reducing both cost and environmental impact. However, optimal P rates vary substantially when different targets such as maximum yield or maximum economic benefit are considered. The present study used field experiment conducted at 36 experiments sites for maize to determine the impact of P application levels on grain yield, plant P uptake, and P agronomy efficiency (AEP), P-derived yield benefits and private profitability, and to evaluated the agronomically (AOPR), privately (POPR), and economically (EOPR) optimal P rate at a regional scale. Four treatments were compared: No P fertilizer (P0); P rate of 45–60 kg ha−1 (LP); P rate of 90–120 kg ha−1 (MP); P rate of 135–180 kg ha−1 (HP). P application more effectively increased grain yield, reaching a peak at MP treatment. The plant P uptake in HP treatment was 37.4% higher than that in P0. The relationship between P uptake by plants (y) and P application rate (x) can be described by the equation y = −0.0003x2 + 0.1266x + 31.1 (R2 = 0.309, p < 0.01). Furthermore, grain yield (y) and plant P uptake (x) across all treatments also showed a significant polynomial function (R2 = 0.787–0.846). The MP treatment led to highest improvements in P agronomic efficiency (AEP), P-derived yield benefits (BY) and private profitability (BP) compared with those in other treatments. In addition, the average agronomically (AOPR), privately (POPR), and economically optimal P rate (EOPR) in 36 experimental sites were suggested as 127.9 kg ha−1, 110.8 kg ha−1, and 114.4 kg ha−1, which ranged from 80.6 to 211.3 kg ha−1, 78.2 to 181.8 kg ha−1, and 82.6 to 151.6 kg ha−1, respectively. Economically optimal P application (EOPR) can be recommended, because EOPR significantly reduced P application compared with AOPR, and average economically optimal yield was slightly higher compared with the average yield in the MP treatment. This study was conducive in providing a more productive, use-effective, profitable, environment-friendly P fertilizer management strategy for supporting maximized production potential and environment sustainable development.

1. Introduction

Phosphorus (P) is the most important essential nutrient for cereal production and animals [1]. The utilization of P fertilizer for crop yield has made prominent contributions to meeting food demand with rapid global population growth. To achieve high grain yields, adequate soil P concentrations were required in the root zone [2,3]. However, phosphorus (P) deficiency decreases crop productivity on more than two billion hectares worldwide [4]. This deficiency will further increase since global P resources are limited and prices for P fertilizer are increasing [5]. Therefore, massive amounts of fertilizer P have been applied to ensure an adequate P nutrient supply in soil with low P fertility during the last century. Nowadays, the consumption of Phosphorus (P) fertilizer reached up to 47.9 Mt P in agriculture land of world. Over-application of mineral P fertilizer by farmers occurs in most cities of China, and the application rates of P fertilizer have tripled over the past three decades [6]. In China, only 15–20% of the P applied was taken up by plants in the growing season [7], and the rest was accumulated in the soil P pools. More than 50% of mineral-fertilizer cannot be recycled into the soil in China, and the discarded portions would lead to long-term production stagnation, severe soil and environmental degradation, and eutrophication of surface waters [8,9,10]. Therefore, it is urgent to identify appropriate suitable P fertilizer recommendation, which can not only meet crop nutrient requirements for high yield, but also benefit the environment. However, how to identify optimal P fertilizer recommendation in terms of increasing yield and ensuring both food security and environment friendly is a great challenge.
To overcome the challenge, optimized fertilizer management was developed on the basis of soil testing method. He et al. [11] did multiple point field experiments based on soil testing in North Central China and showed that soil-test based fertilizer recommendation could increase wheat and maize yield and improve fertilizer use efficiency. These methods were effective for fertilizer recommendation, but they generally need some limitations associated with soil testing, including taking comprehensive field sampling, being labor-intensive, and needing annual setting field experiments due to the differences among soil types and climates in China. Thus, soil testing is viewed as a very expensive tool, and the more time required to get results are often not rapid to instruct scientific fertilization in season.
Fertilizer management strategies that yield responses to quantify crop nutrient requirements can be effective, because fertilizer nutrients applied to soils will be eventually absorbed by plants and can be reflected by crop yield increase [12]. Yield response models have been widely used to estimate economically optimal nutrient rates, such as quadratic and Line-plateau models [13,14], the recommendation from relationships between yield response and soil nutrient supply [15], and the Mitscherlich-Bray model [16]. In addition, the optimal fertilizer application rate could also be ascertained based on the relationship curves between fertilizer application rate and different indicators (such as yield, nutrient use efficiency, plant nutrient uptake, economic performance, etc.) Although numerous fertilizer recommendation methods have been proposed to improve P use efficiency, technologies and innovative management practices are still lacking, as are economic benefits, and human welfare-improvement policies [17].
Study of the agronomic optimum P rate (AOPR), optimum P rate for private profitability (POPR), and the economically optimal P rate (EOPR) is crucial to avoid resources waste, ensure agronomic effective and protect the ecological environment. Besides, fertilization recommendations for large areas based on limited data cannot meet the demands of intensive agricultural production. As a result, it is urgent to research on the regional scale on the basis of multiple experiments. In the study, the database of 36 experimental sites for maize in Liaoning province of Northeast China were as follows: (1) To analyze the current maize yield, plant P uptake, agronomic efficiency, P-derived yield benefits and private profitability; (2) to determine the inter-relationships curves among P application rate, grain yield, plant P uptake, yield response to P application and agronomic efficiency; (3) to identify AOPR, POPR, and EOPR at the regional scale.

2. Materials and Methods

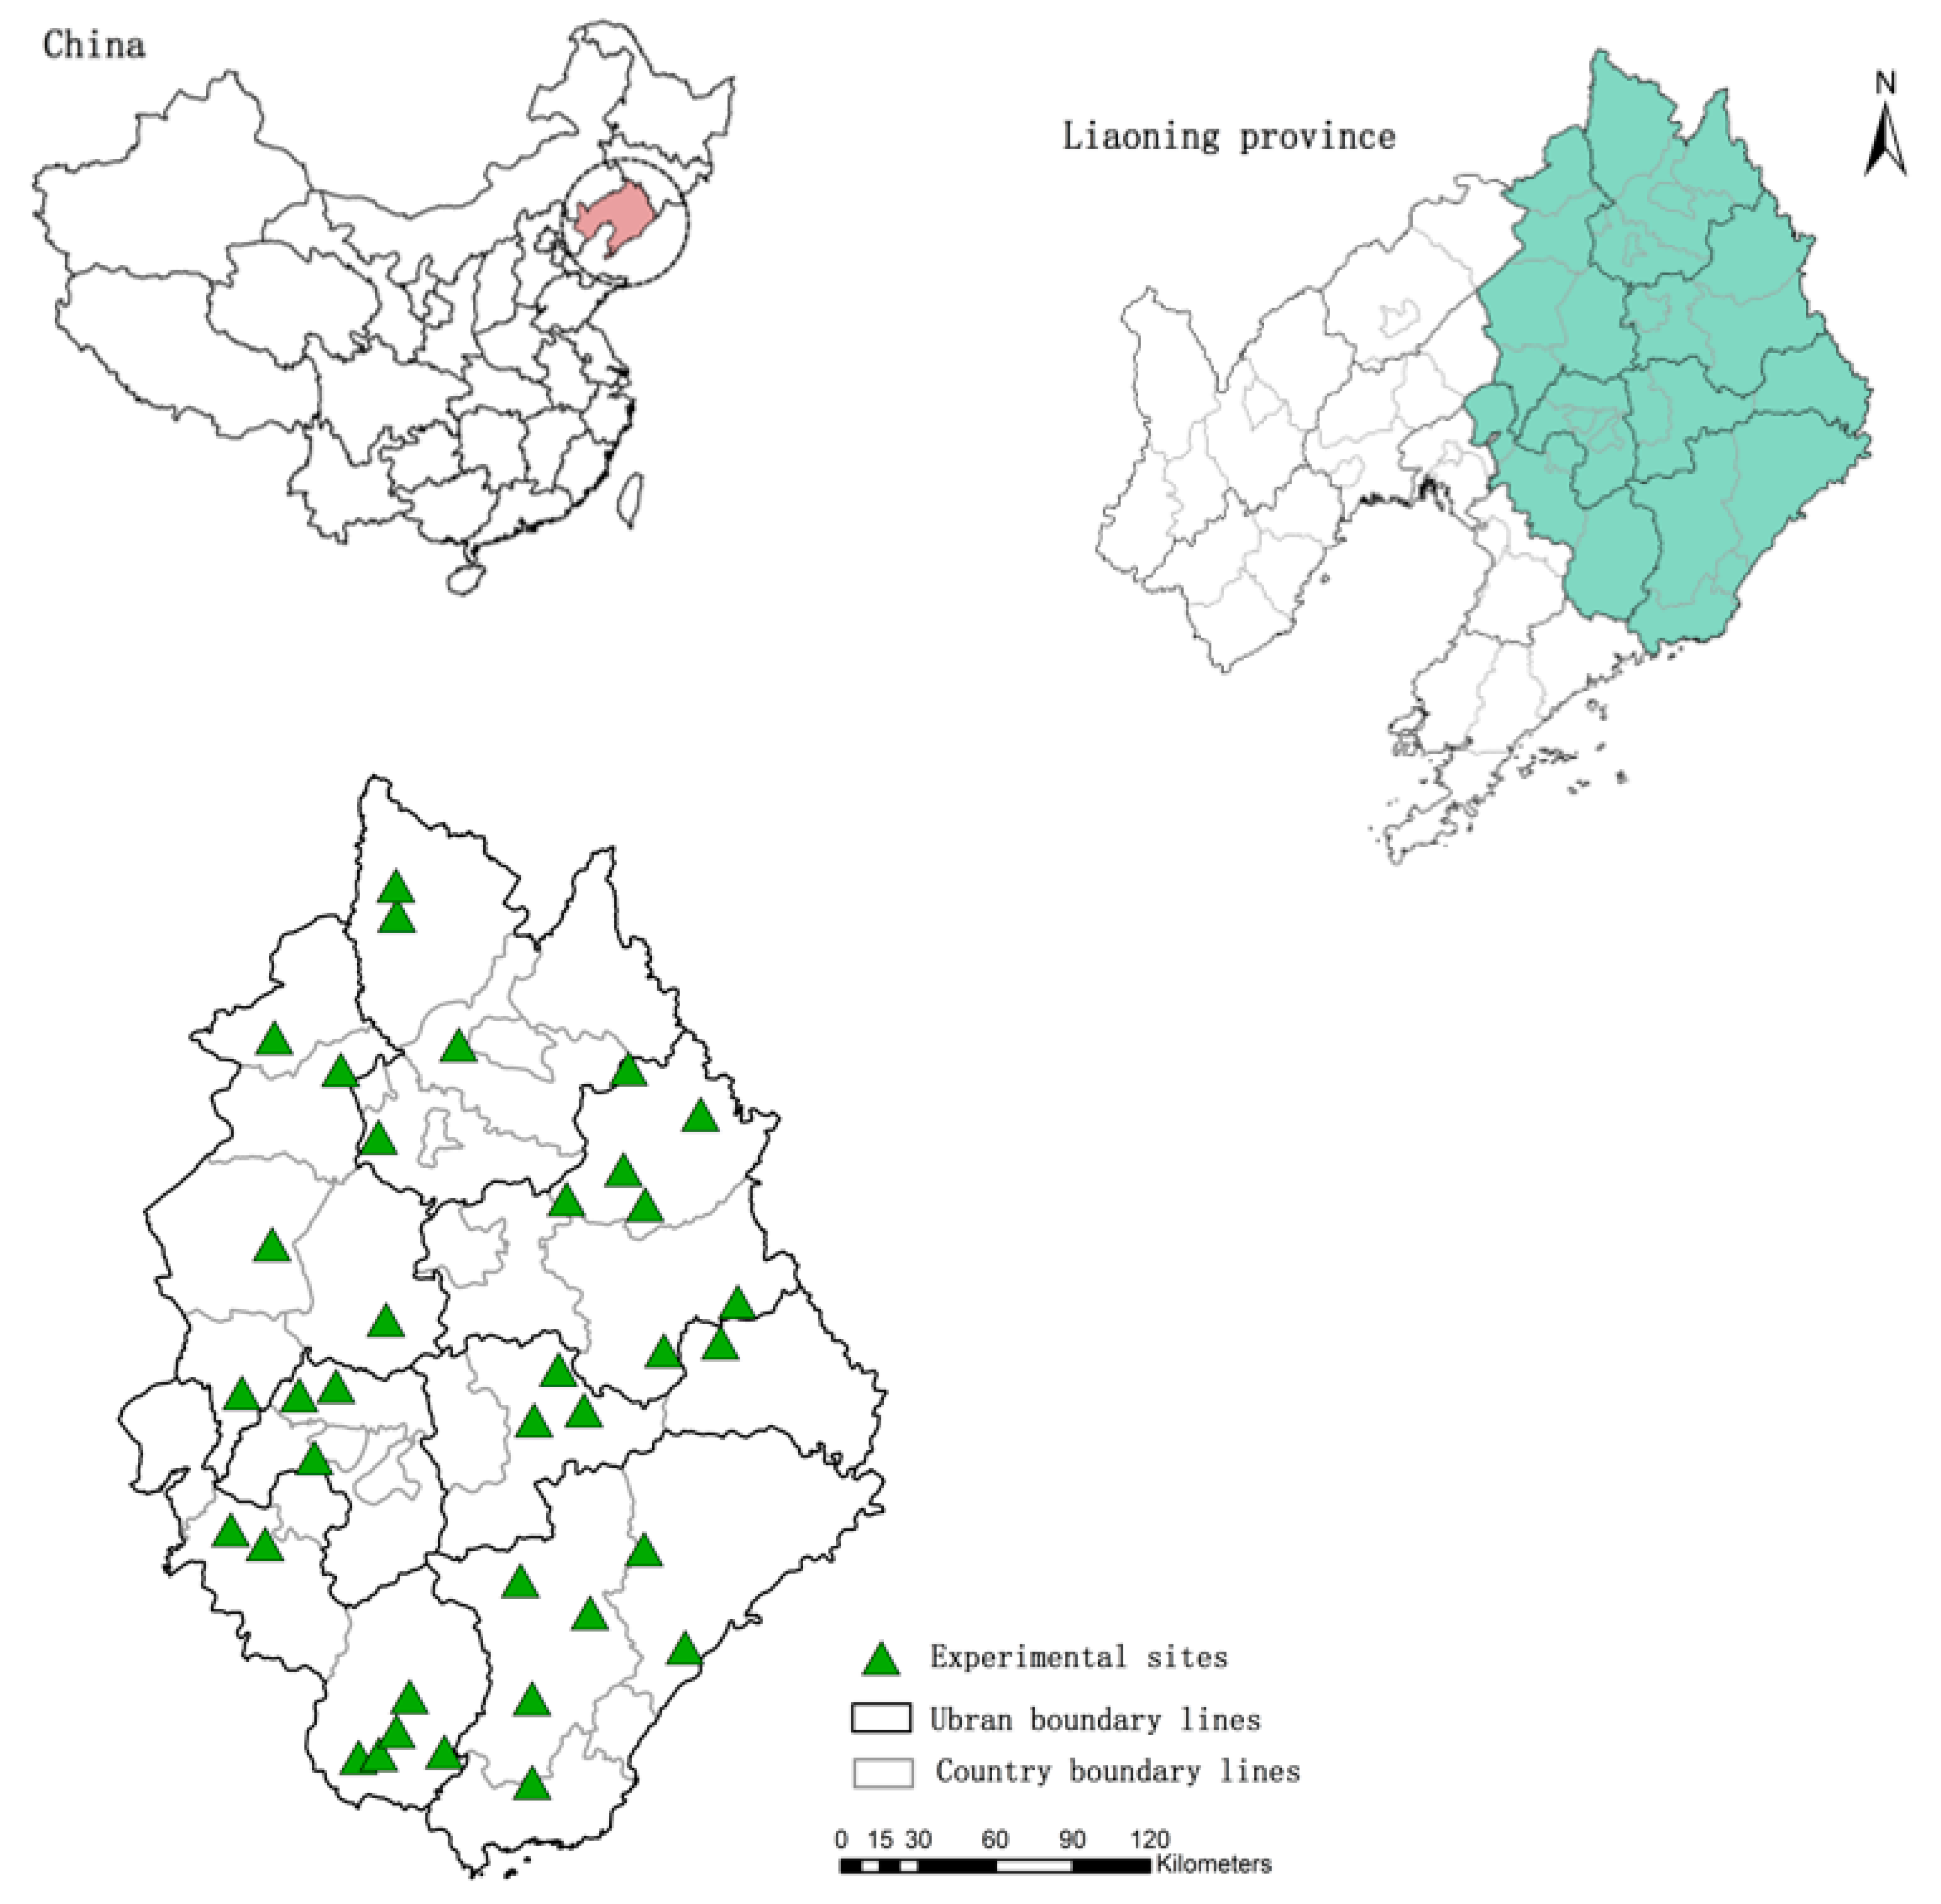
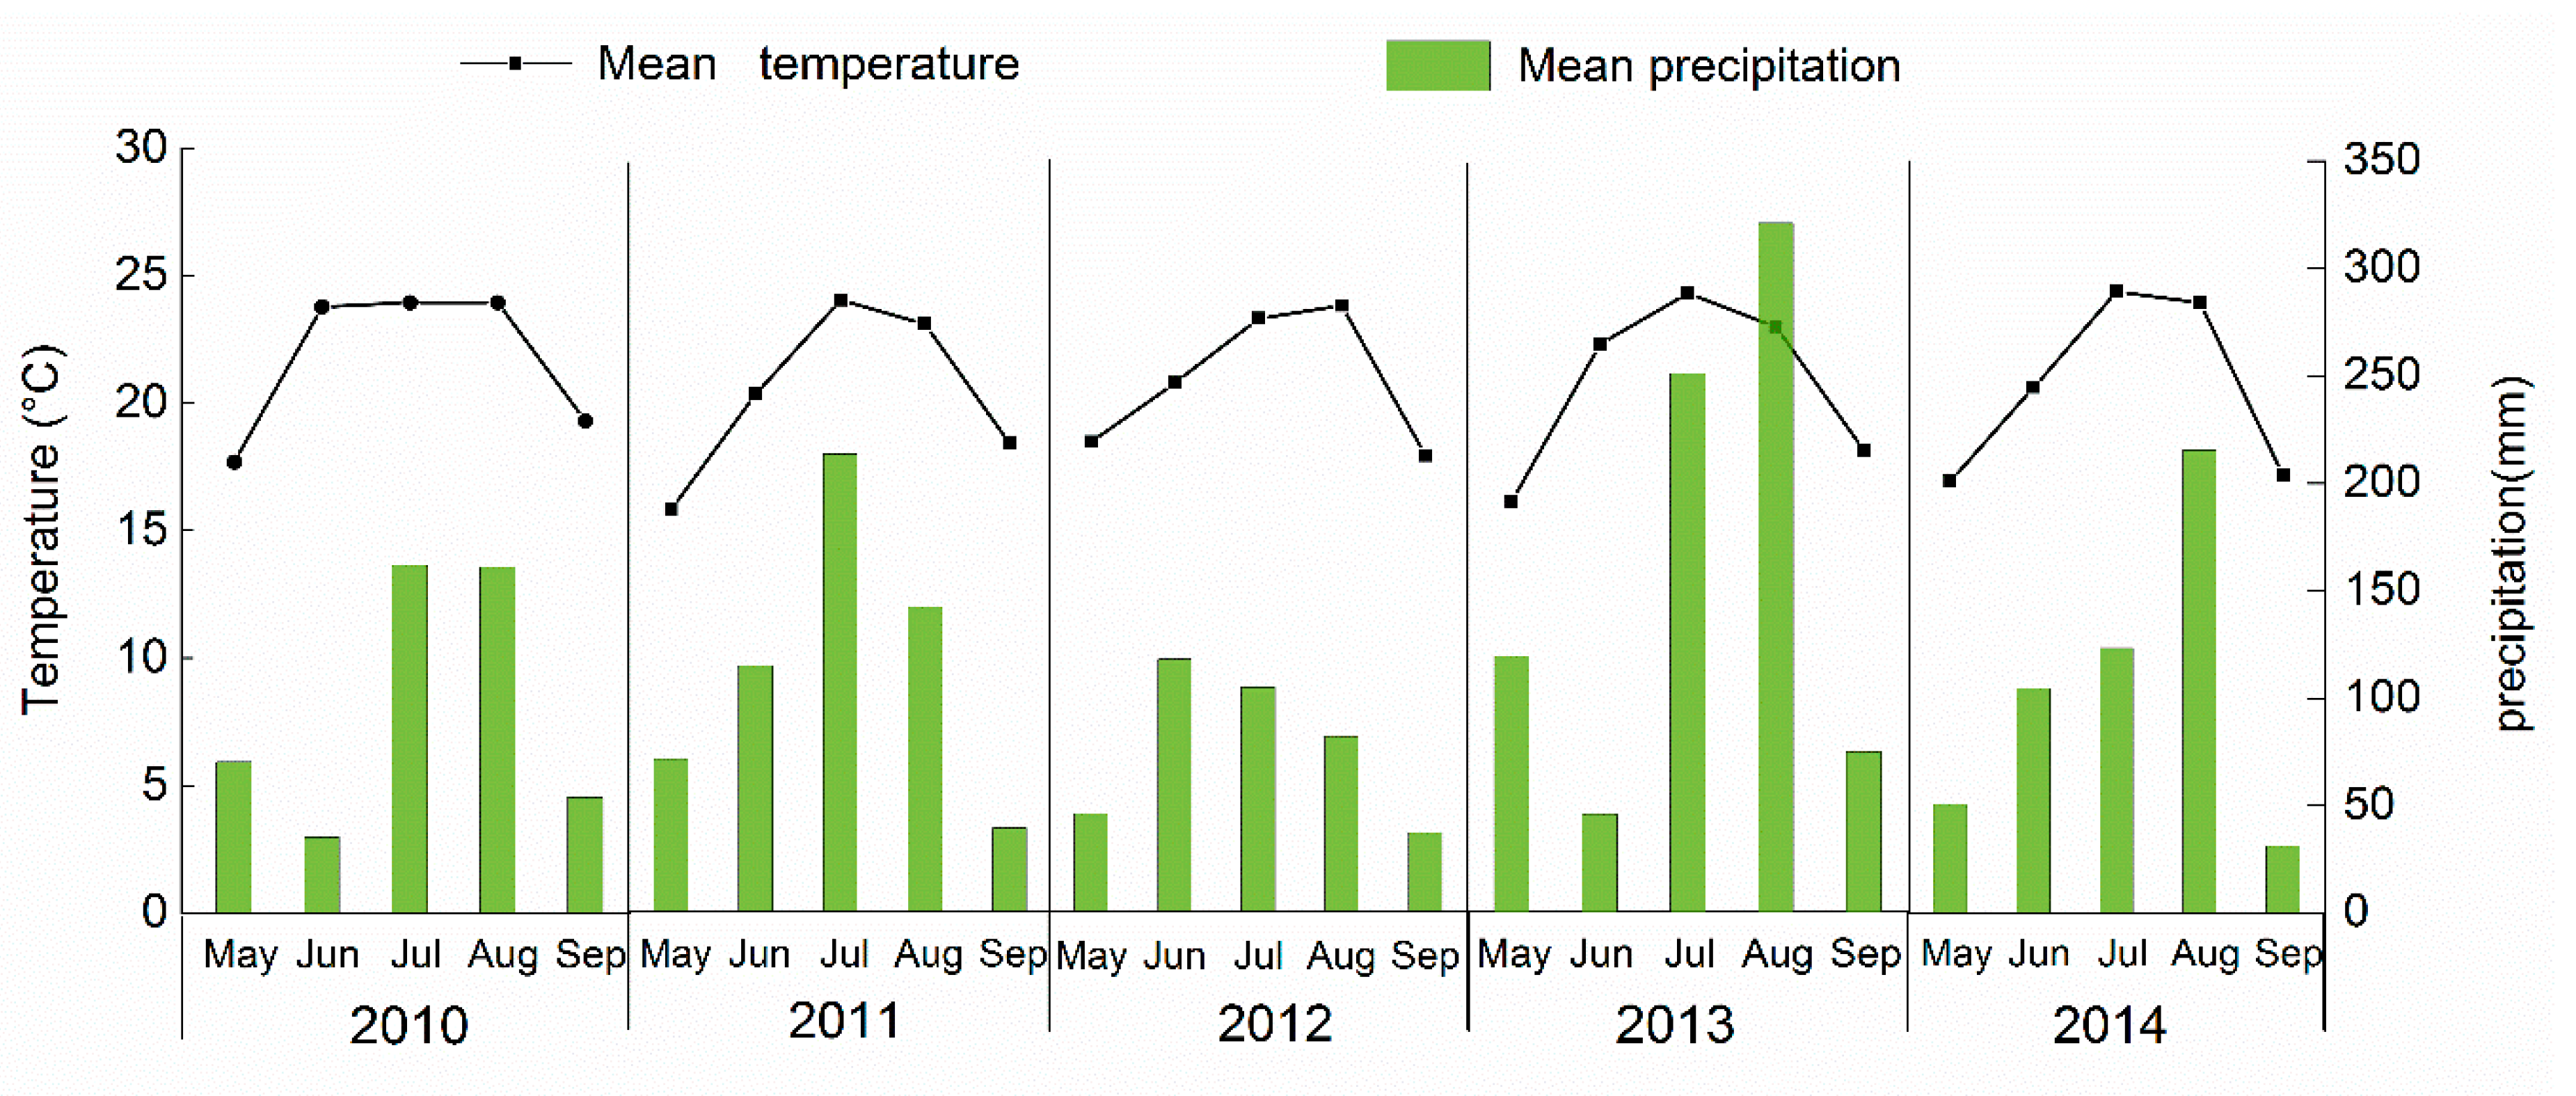
2.1. Site Description

Maize in China covers an area 24.9 million ha, of which 6.47% distributed in Liaoning Province. The study was conducted at 36 experimental sites located in main maize-growing regions of Liaoning Province, China (Figure 1). This research region covers the parts of seven city-level administrative districts, including Tieling, Fushun, Benxi, Dandong, Anshan, Shenyang, and Liaoyang cities. The climate is described as temperate, sub-humid continental monsoon with abundant sunshine, cold winters, and warm summers, where pattern varies widely in terms of monthly temperature and rainfall. About 80% of the annual precipitation concentrates mostly in summer from May to September, but monthly precipitation is unevenly distributed and the precirimental months (early May to late September) from 2010 to 2014 are shown inpitatiope Figure 2. Monthly mean air temperature and precipitation during the maize planting periods ranged from 19.11 to 24.66 °C and 77.9–123.6 mm, respectively (Figure 2). The scale of annual potential evaporation was 800–1200 mm.
The typical soil type in this region is blown soil, which could be classified as Haplic-Udic Luvisols (according to the USDA system). Across all 36 experimental sites, the basic soil physicochemical characteristics before the experiment beginning for five years are shown in Table 1.

2.2. Data Source and Experimental Treatments

Data were collected from 36 experimental sites in Liaoning province during 2010–2014, which were conducted by the field experiment with fourteen fertilization treatments. Here, four P fertilization treatments chosen in this study. All experiments were arranged in a randomized complete block design and treatments as follows: (1) Without P fertilization (P0); (2) low P application rate (LP, ranged from 45 to 60 kg ha−1); (3) medium P rate (MP, ranged from 90 to 120 kg ha−1); (4) high P application rate (HP, ranged from 135 to 180 kg ha−1). Nitrogen, phosphorus, and K fertilizer was applied in the form of urea, calcium superphosphate, and potassium chloride. Two thirds of the N, and both of P and K fertilizer were evenly incorporated as basal fertilizer, and then applied into the surface layer 20 cm soil of all the plots before planting each year, the remaining N fertilizer were s applied at the heading stage. Local maize cultivar widely used, with a sowing depth of 5 cm.

2.3. Sampling and Measurements

Sample preparation and analysis of plants were performed following the same methods across the different experimental sites. Maize plant in each plot was harvested every year to determine the grain yield, and the yield was calculated and expressed on a dry matter basis. Detailed measurement on plant growth and yield components including above-ground plant dry matter, concentration of P in grain and straw, P accumulation in grain, straw and total above-ground dry matter were conducted at all sites. Plant separated into grain and straw, and the weight of which was measured before and after oven-drying at 80 °C for 30 min and then at 65 °C for 48 h to record on dry weight. The oven-dried samples were finely grinded using high speed grinders and stored individually in transparent sealed bags for concentration P determination. The samples of maize grain and straw were digested with H2SO4–H2O2, and the P content in the digesting solution was determined using the vanadate molybdate yellow colorimetric method. Total P uptake was calculated by multiplying the P concentration and dry weight of each plant part.

2.4. Calculation

Yield response to P (kg ha−1) and P agronomic efficiency (AEP, kg kg−1) were calculated for each plot using the following equations:
Yield response to P (kg ha−1) = Yp − Y0
A E P = Y P Y 0 F
where Yp is the grain yield in P fertilization treatments (kg ha−1), Y0 is the grain yield in without P fertilization (kg ha−1), F is the total amount of applied P (kg ha−1).

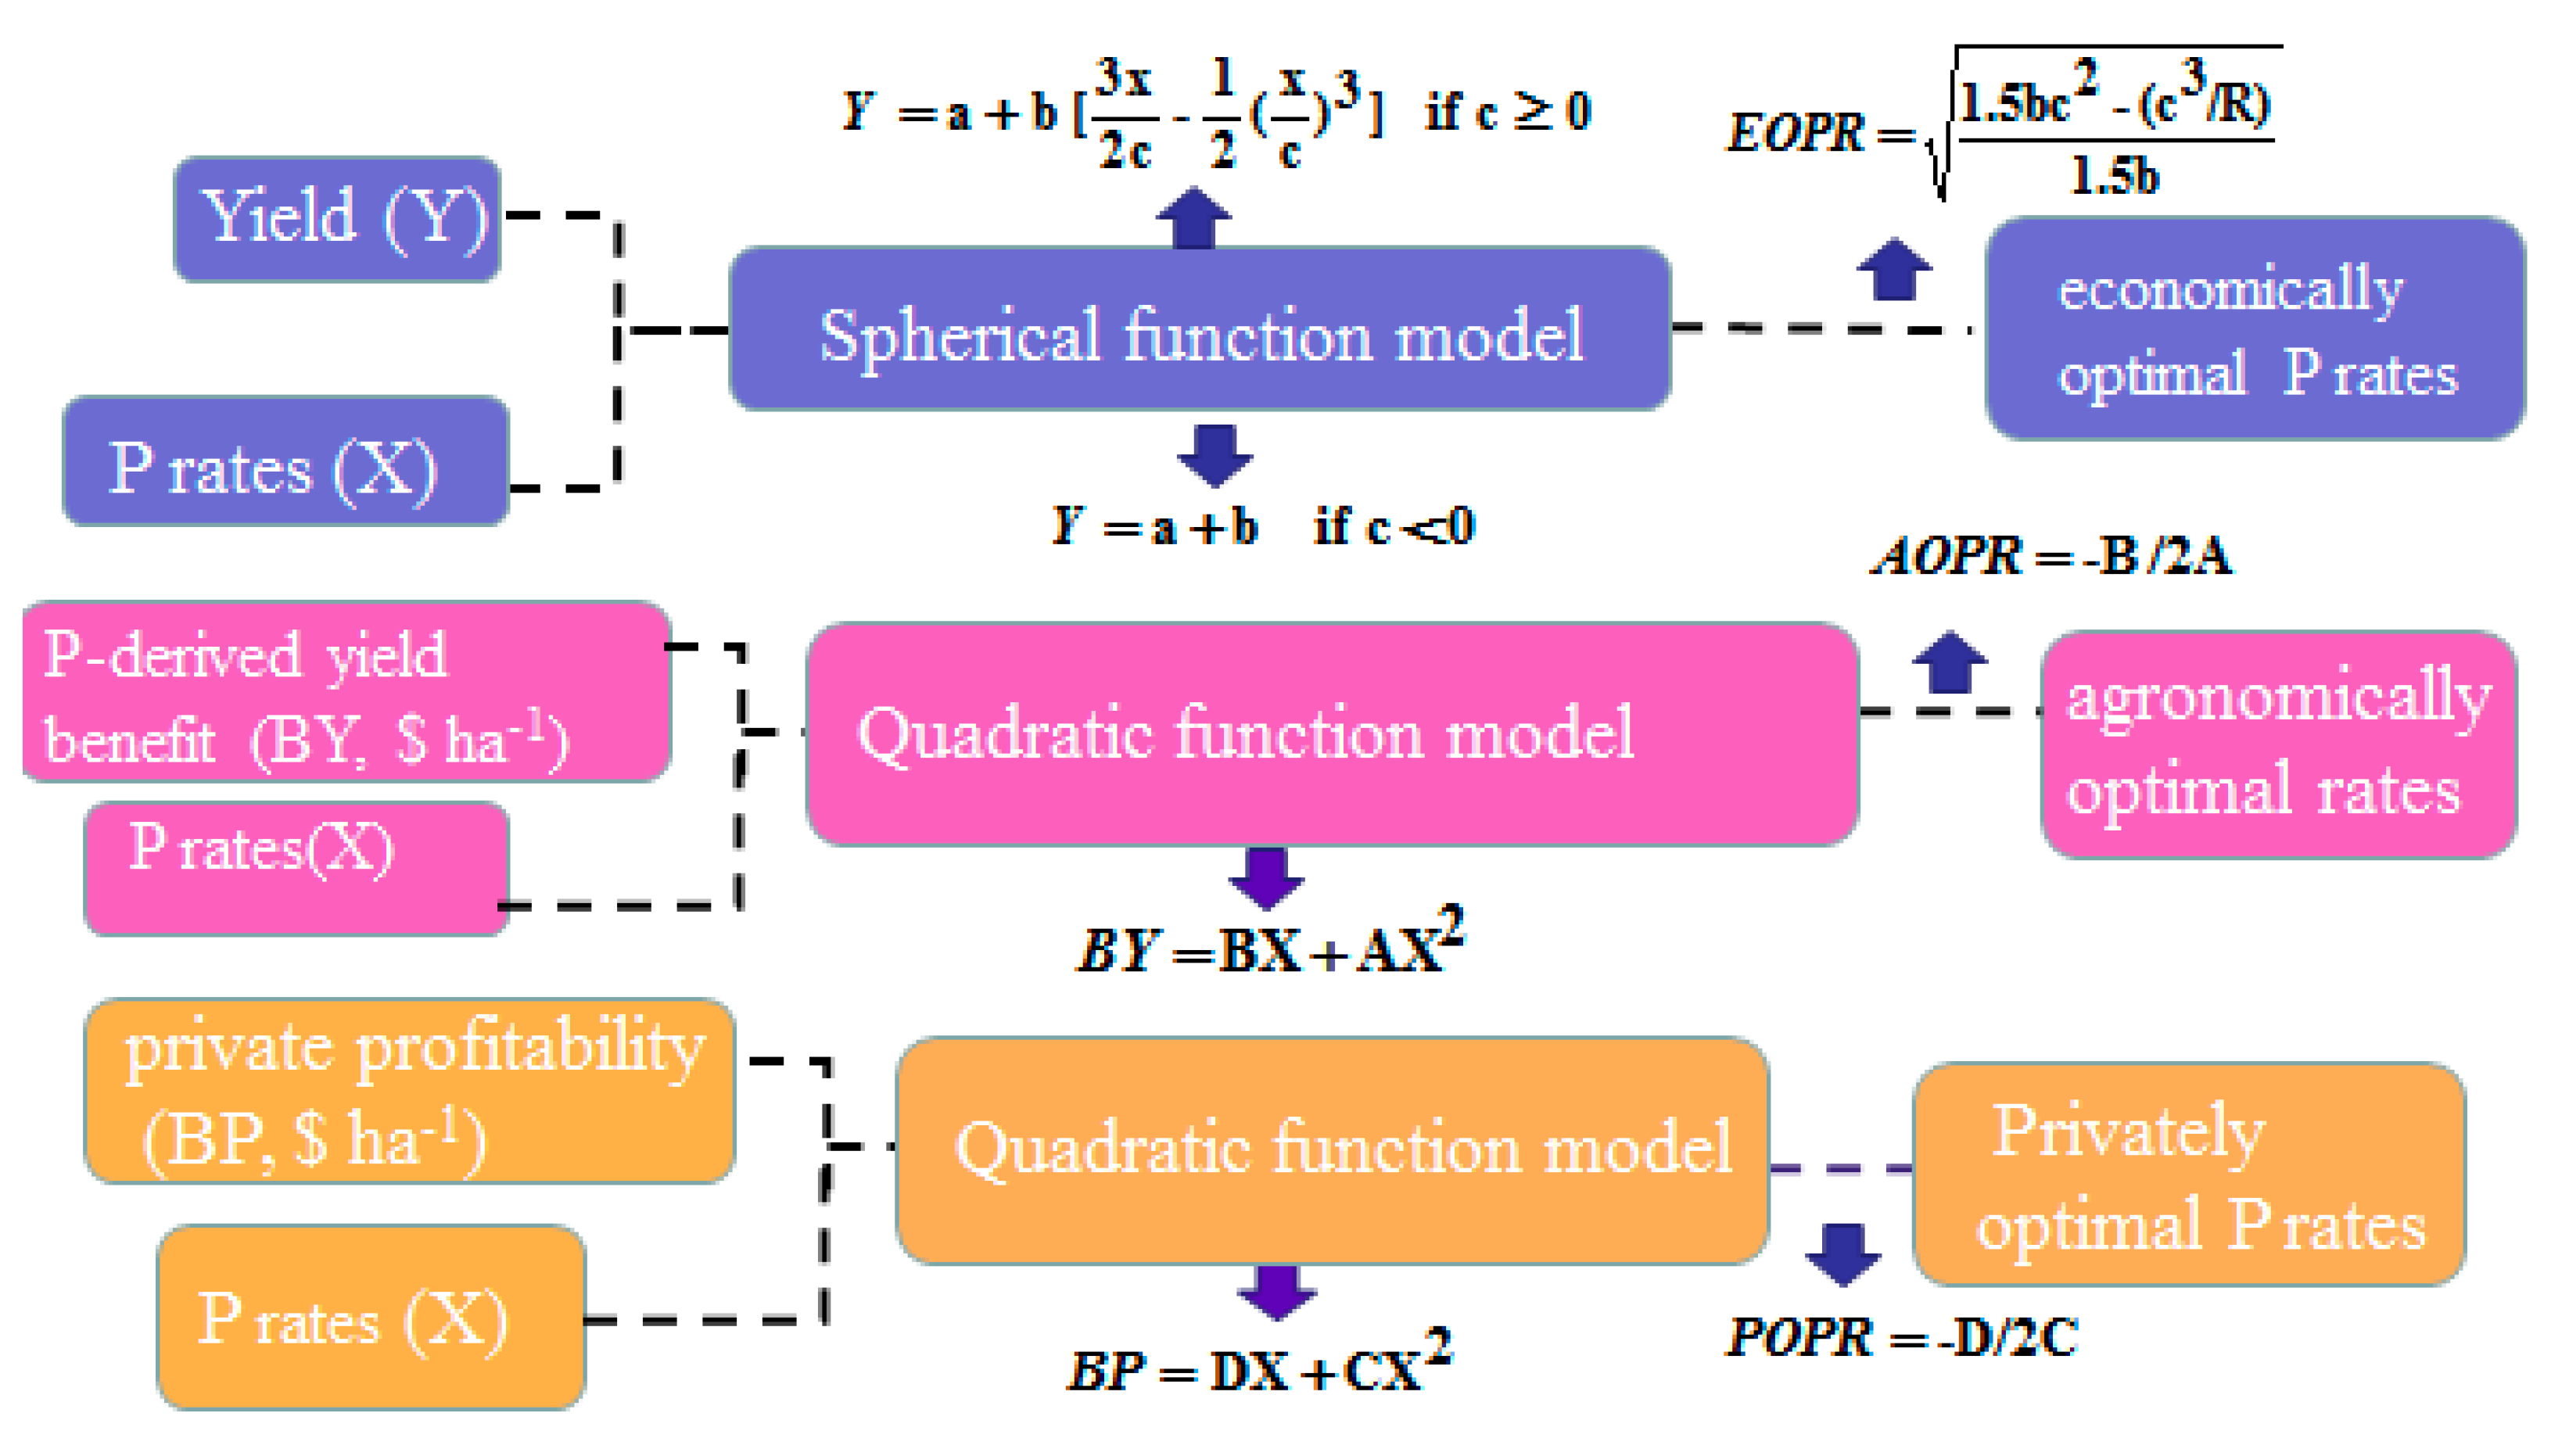
2.5. Model Description

The selected three models were used for optimizing P application rates, including the economically, agronomically, and privately optimal P fertilizer (Figure 3).

2.5.1. Evaluated the Economically Optimal P Rates (EOPR)

The spherical function model was used to calculate the economically optimum P fertilizer rates (EOPR) based on the data of K application rates (x) and grain yield (y) from each site. A spherical function is widely used to estimate the economically optimum N fertilizer rates (EONR) used by Dobermann et al. [18] and Setiyono et al. [19]. The detailed equation is provided below:
Y = a + b [ 3 x 2 c 1 2 ( x c ) 3 ]    if   c 0 Y = a + b       if   c < 0
where Y is the estimated grain yield for maize (t ha−1), x is the P rate (kg ha−1), a and b are grain yield without P applied (kg ha−1) and the maximum yield increase with the application of K fertilizer (t ha−1), respectively, c is the P rate at which maximum yield approached (kg ha−1).
The economically optimal P rate (EOPR) is calculated by using the spherical model equation (Dobermann et al. [18]) as:
EOPR = 1.5 b c 2 ( c 3 / R ) 1.5 b
where R is the ratio of maize grain price (US$ t−1) / fertilizer P price (US$ kg−1). Here, we provide the average prices of P fertilizer (0.709 $ kg−1) and maize grain (0.33 $ kg−1) in Northeast China.

2.5.2. Evaluated the Agronomically Optimal P Rates (AOPR)

The calculation approaches of agronomically (AOPR) and privately optimal P rates (POPR) were widely used for wheat [20]. Thus, the calculation approaches majorly adhere to Hao et al. [20]. A description of formula as follows. To calculate the agronomically optimal K rate (AOPR) for maize, the quadratic functions model were used to fit the relationship between the P-derived grain yield (BY) and the P application rates (x).
The estimated P-derived yield benefit ($ ha−1) and agronomically optimal K rate (AOPR) associated with P inputs were calculated as Equations (3)–(6) followed by [20]:
YP = Y − Y0
B Y = Y P × M Price
BY = Bx + Ax2
XAOPR = −B/2A
where YP is the increased grain yield (kg ha−1), based on grain yield (Y, kg ha−1) and yield with no-N treatment (Y0, kg ha−1). BY is the P-derived yield benefit ($ ha−1), and Mprice is the price of maize ($ ha−1). XAOPR is an agronomically optimal K rate (AOPR), and B and A are the regression coefficients of quadratic functions model.

2.5.3. Evaluated the Privately Optimal P Rates (POPR)

Correspondingly, the privately optimal P rates (POPR) was determined by fit the relationship between the private profitability (BP) and the P application rates (x) in all sites. The estimated the private profitability (BP, $ ha−1) and privately optimal P rates (POPR) associated with P inputs were calculated as Equations (7)–(10) followed by [20]:
P cos t = P rate × M Price
BP = BY − Pcost
BP = Dx + Cx2
XAOPR = −D/2C
where Pcost are the cost of P fertilizer rates, which were calculated by multiplying the unit price of the P fertilizer by the P application rate (with an average of 0.709$ per kg P fertilizer). BP is the private profitability ($ ha−1), XPOPR is privately optimal P rate (AOPR), and C and D are the regression coefficients of quadratic functions model.

2.6. Statistical Analysis

Descriptive statistical analysis showed an increasing yield and P use efficiency was carried out using SPSS 19.0. The averages for different treatments were compared with the least significant difference (LSD) test at the 5% probability level (p ≤ 0.05). Curve correlation was performed to assess the relationship among grain yield, plant P uptake and P application rates across sites. Figures were made using Origin pro 2016 software packages.

3. Results and Discussion

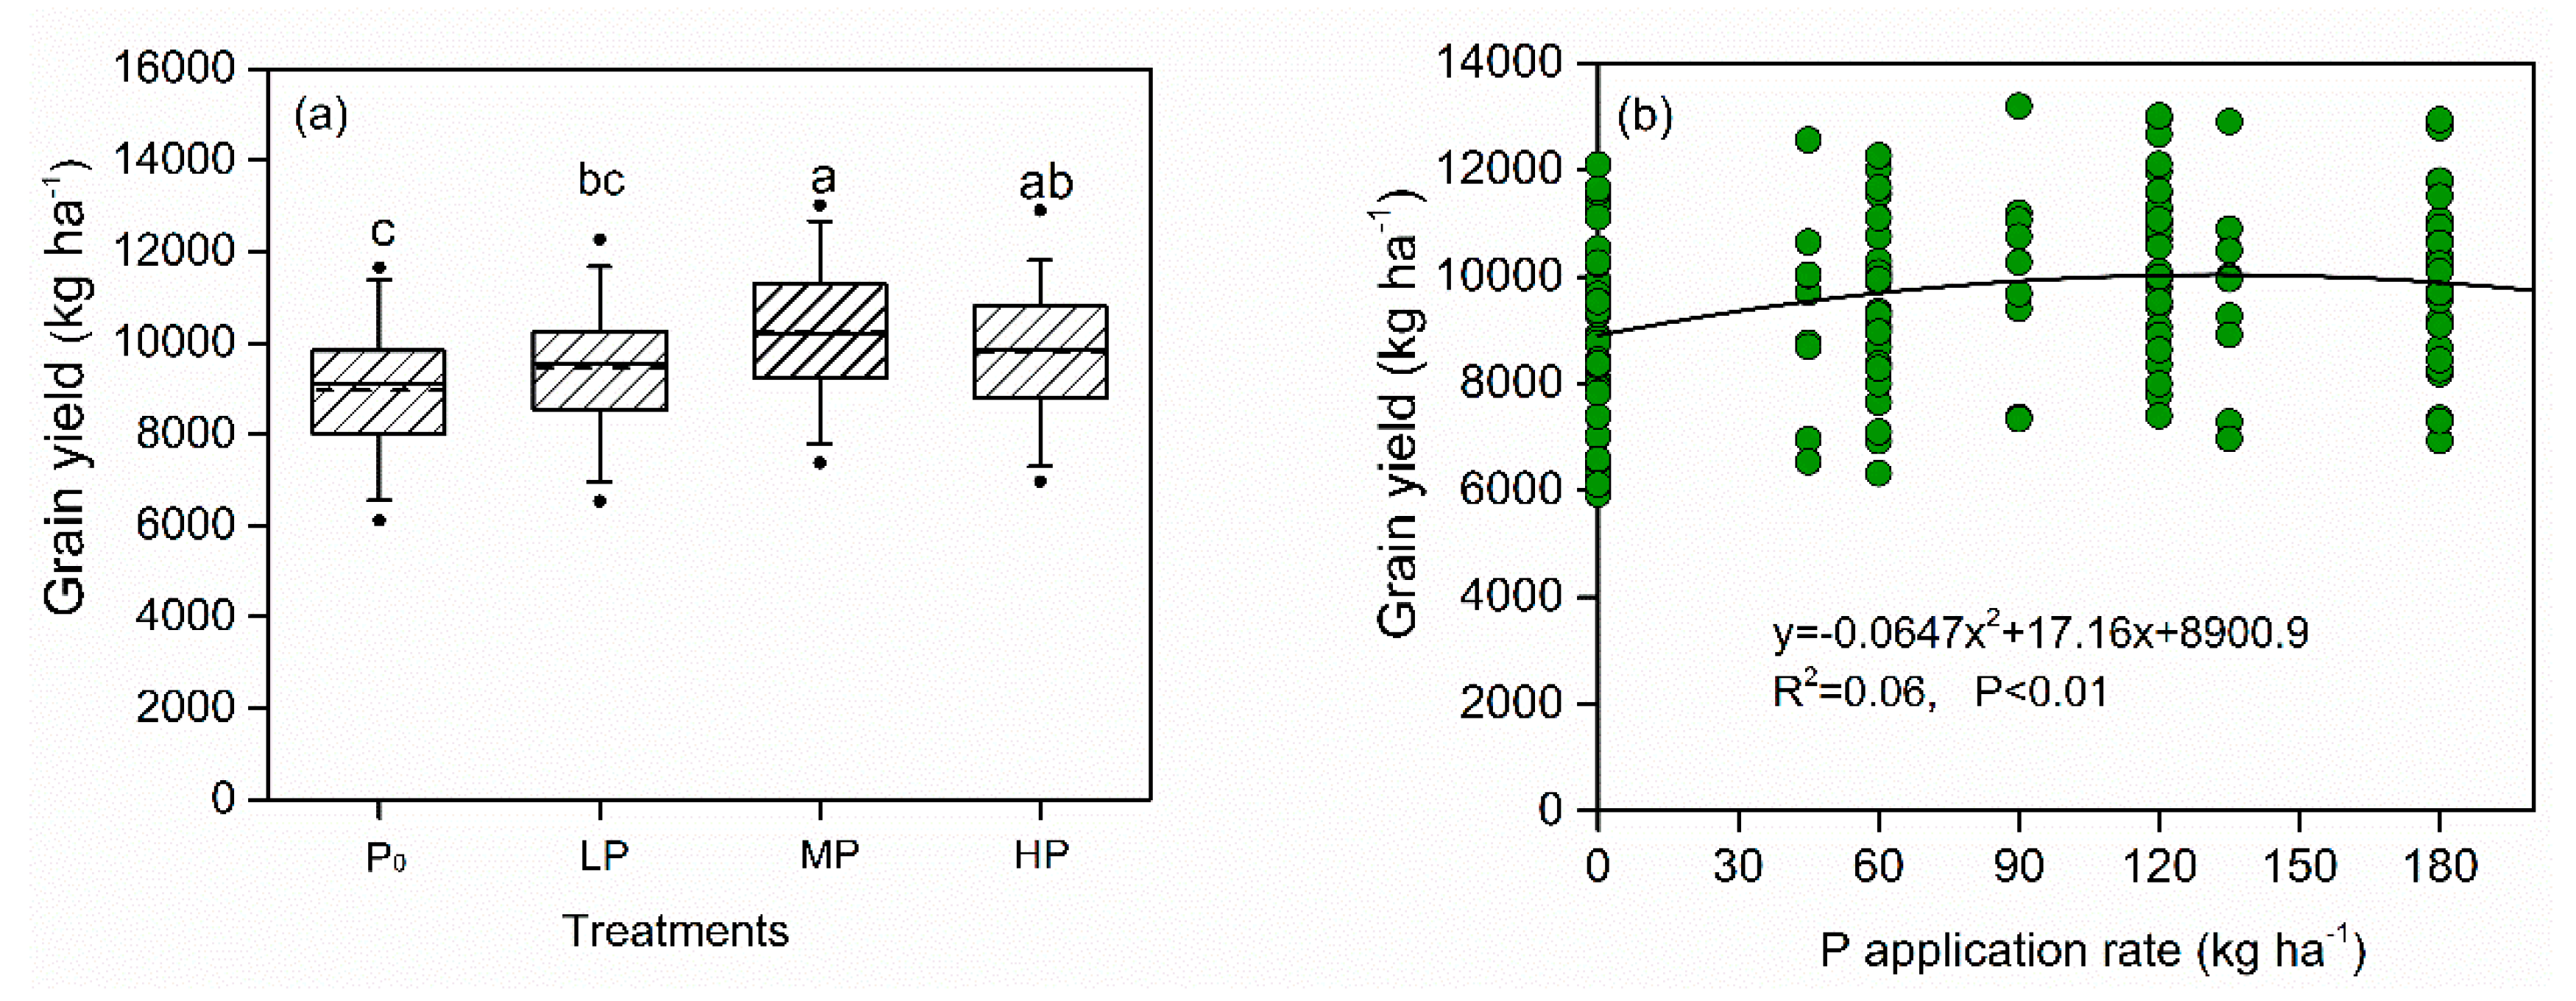
3.1. Grain Yield to P Application Rate
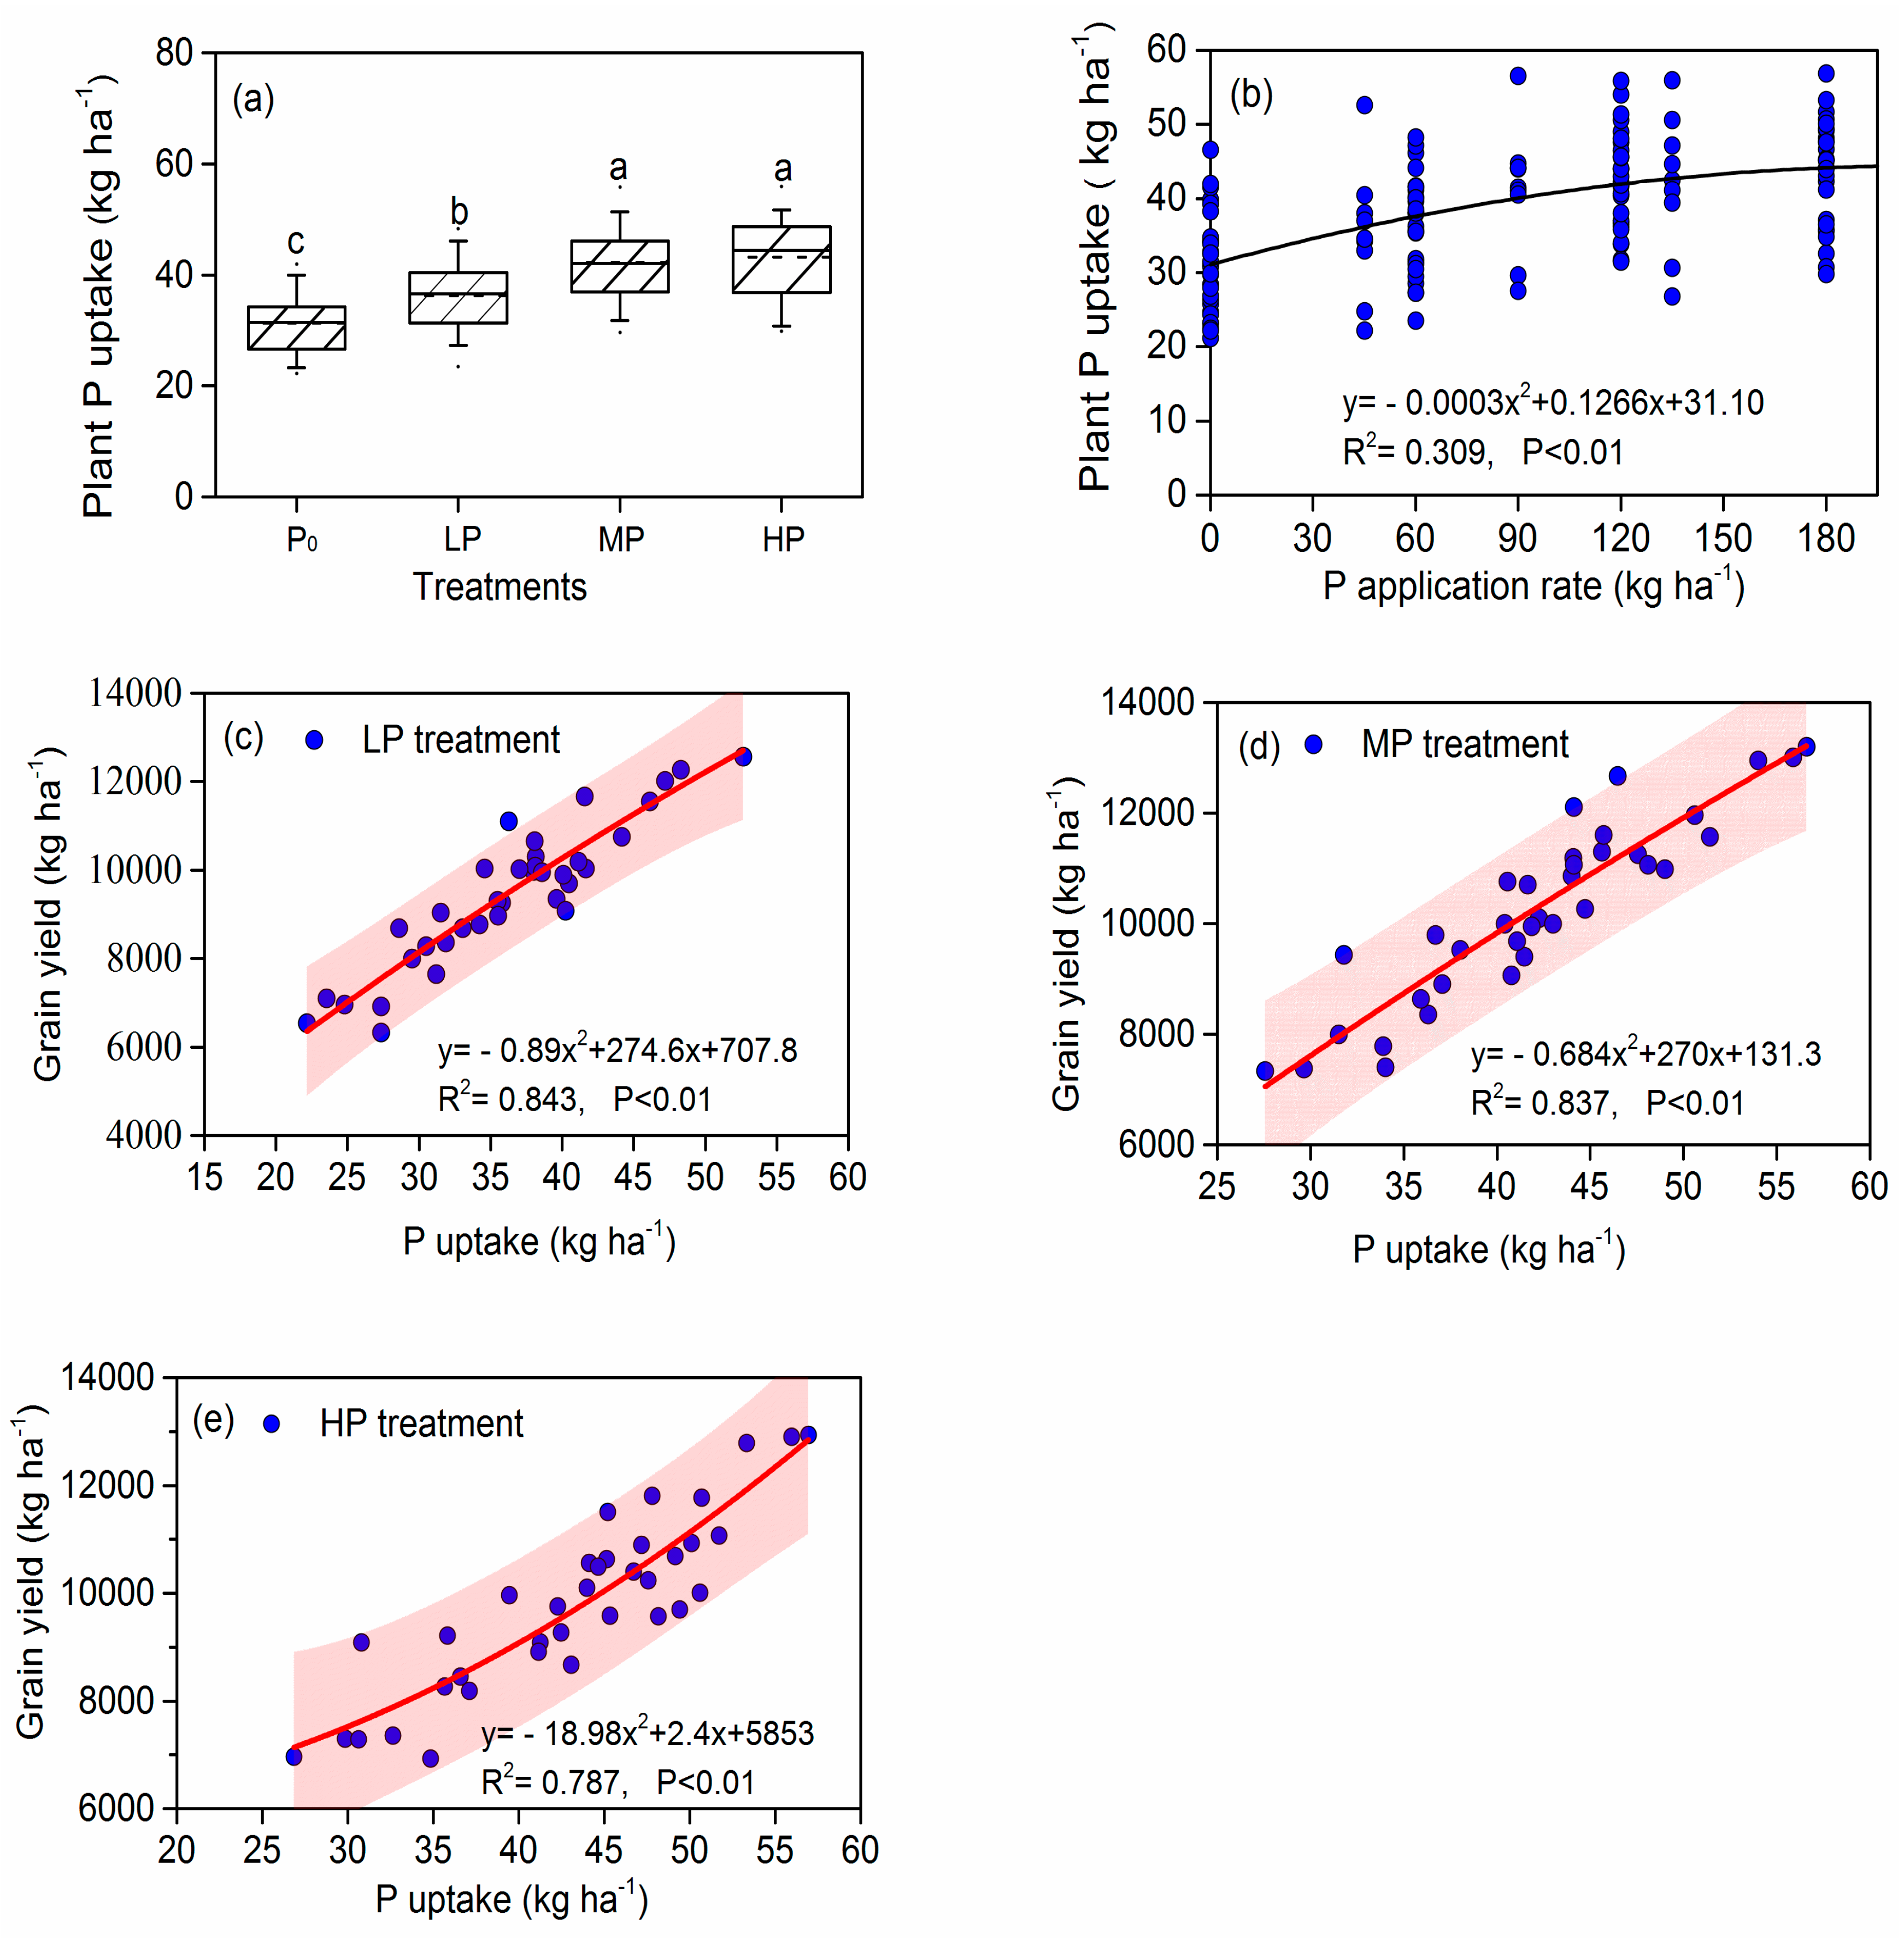
Based on a large database of experimental data from 2010 to 2014 covering a wide range of P application rate levels (45–60 kg ha−1, LP treatment), (60–120 kg ha−1, MP treatment), and (135–180 kg ha−1, HP treatment) was used to determine the relationship between P rate and grain yield in Liaoning province, respectively. For all P fertilization treatments, P fertilization significantly (p < 0.05) increased grain yield, especially in MP treatment (Figure 4a). The average maize yield in LP and MP treatment were 9450 kg ha−1 (range, 6325–12,567 kg ha−1) and 10,262 kg ha−1 (range, 7340–13,199), which increased by 5.19% and 12.69% compared to P0 treatment. Specifically, the average yield in HP treatment was 9.55% higher than P0 treatment, but which was 4.3% lower than that in MP treatment (Figure 4a). Although the P input in HP treatment was higher than that of the other treatment, the corresponding increase in grain yield was not relatively high, and indicates that P fertilizer application in HP treatment would probably be an excessive supply. Overall, the grain yields in these treatments that received different P application rates were in the order: MP > HP > LP > P0 (Figure 4a). Xin et al. [21] also reported similarly results, which conducted a case study on maize in northwest Mexico from 1968 to 1990 and found that 48% of the total yield gain was attributed to increased use of P fertilizer. In addition, our current studies also demonstrated that there is no continuous increasing in yield when P application rates beyond MP treatment. Similarly, Yan et al. [22] also found that grain yield increased with increasing P fertilizer and then more slowly to a plateau. Thus, P fertilizer could benefit maize yield, and excessive P fertilizer input does not lead to an increasing yield, or may bring a potential fertilizer residue. Similar results were also detected in N and K fertilizer in winter oilseed [6,14], barley and rape [23], soybean [24].
A close relationship between P application rate and grain yield for each site was observed (Figure 4b). The quadratic model has been commonly used to describe the relationship between grain yield and fertilization [25,26]. As for maize, yield increased initially and then decreased gradually with increases in P application (Figure 4b). The relationship between grain yield and P application rate can be represented by the equation y = −0.0647x2 + 17.16x + 8900.9 (R2 = 0.06, p < 0.01) (Figure 4b).

3.2. Plant P Uptake

In all the maize experimental regions, significant differences among the three P application levels in plant P uptake were found, with an average value of 36.2 kg ha−1, 42.1 kg ha−1, and 43.2 kg ha−1 in LP, MP, and HP treatments, respectively (Figure 5a). Furthermore, the plant P uptake was in an approximate range of 22.2–52.7 kg ha−1 in LP, 27.2–57.6 kg ha−1 in MP, and 26.8−56.9 kg ha−1 in HP (Figure 5a). The average plant P uptake in LP, MP, and HP treatments were significantly higher by 15.2%, 34.1%, and 37.5% relative to P0. P application led to a significant increase in plant P uptake of maize in the following order: HP > MP > LP > P0 (Figure 5a).
The relationship between P uptake by maize plants (y) and P application rate (x) can be described by the equation y = −0.0003x2 + 0.1266x + 31.1 (R2 = 0.309, p < 0.01) (Figure 5b). These results also clearly revealed that plant P uptake gradually increased with P fertilizer input. P fertilizer significantly increase P uptake because it can bring more available P to the soil directly and enhanced the soil available P content. Furthermore, although the plant P uptake in HP treatment was highest, the HP treatment did not create the highest grain yield, indicating the plant P uptake in HP treatment showed both excessive and luxury.
Additionally, the relationship between grain yield (y) and plant P uptake (x) in different treatments showed a significant polynomial function (p < 0.01) (Figure 5c–e). About 84.3%, 83.7%, and 78.7% of the variation in plant P uptake were explained by grain yield for the LP, MP, and HP treatments (Figure 5c–e). This result observed that grain yield was largely affected by plant P uptake (Pearson’s R: 0.787–0.843, p < 0.01).

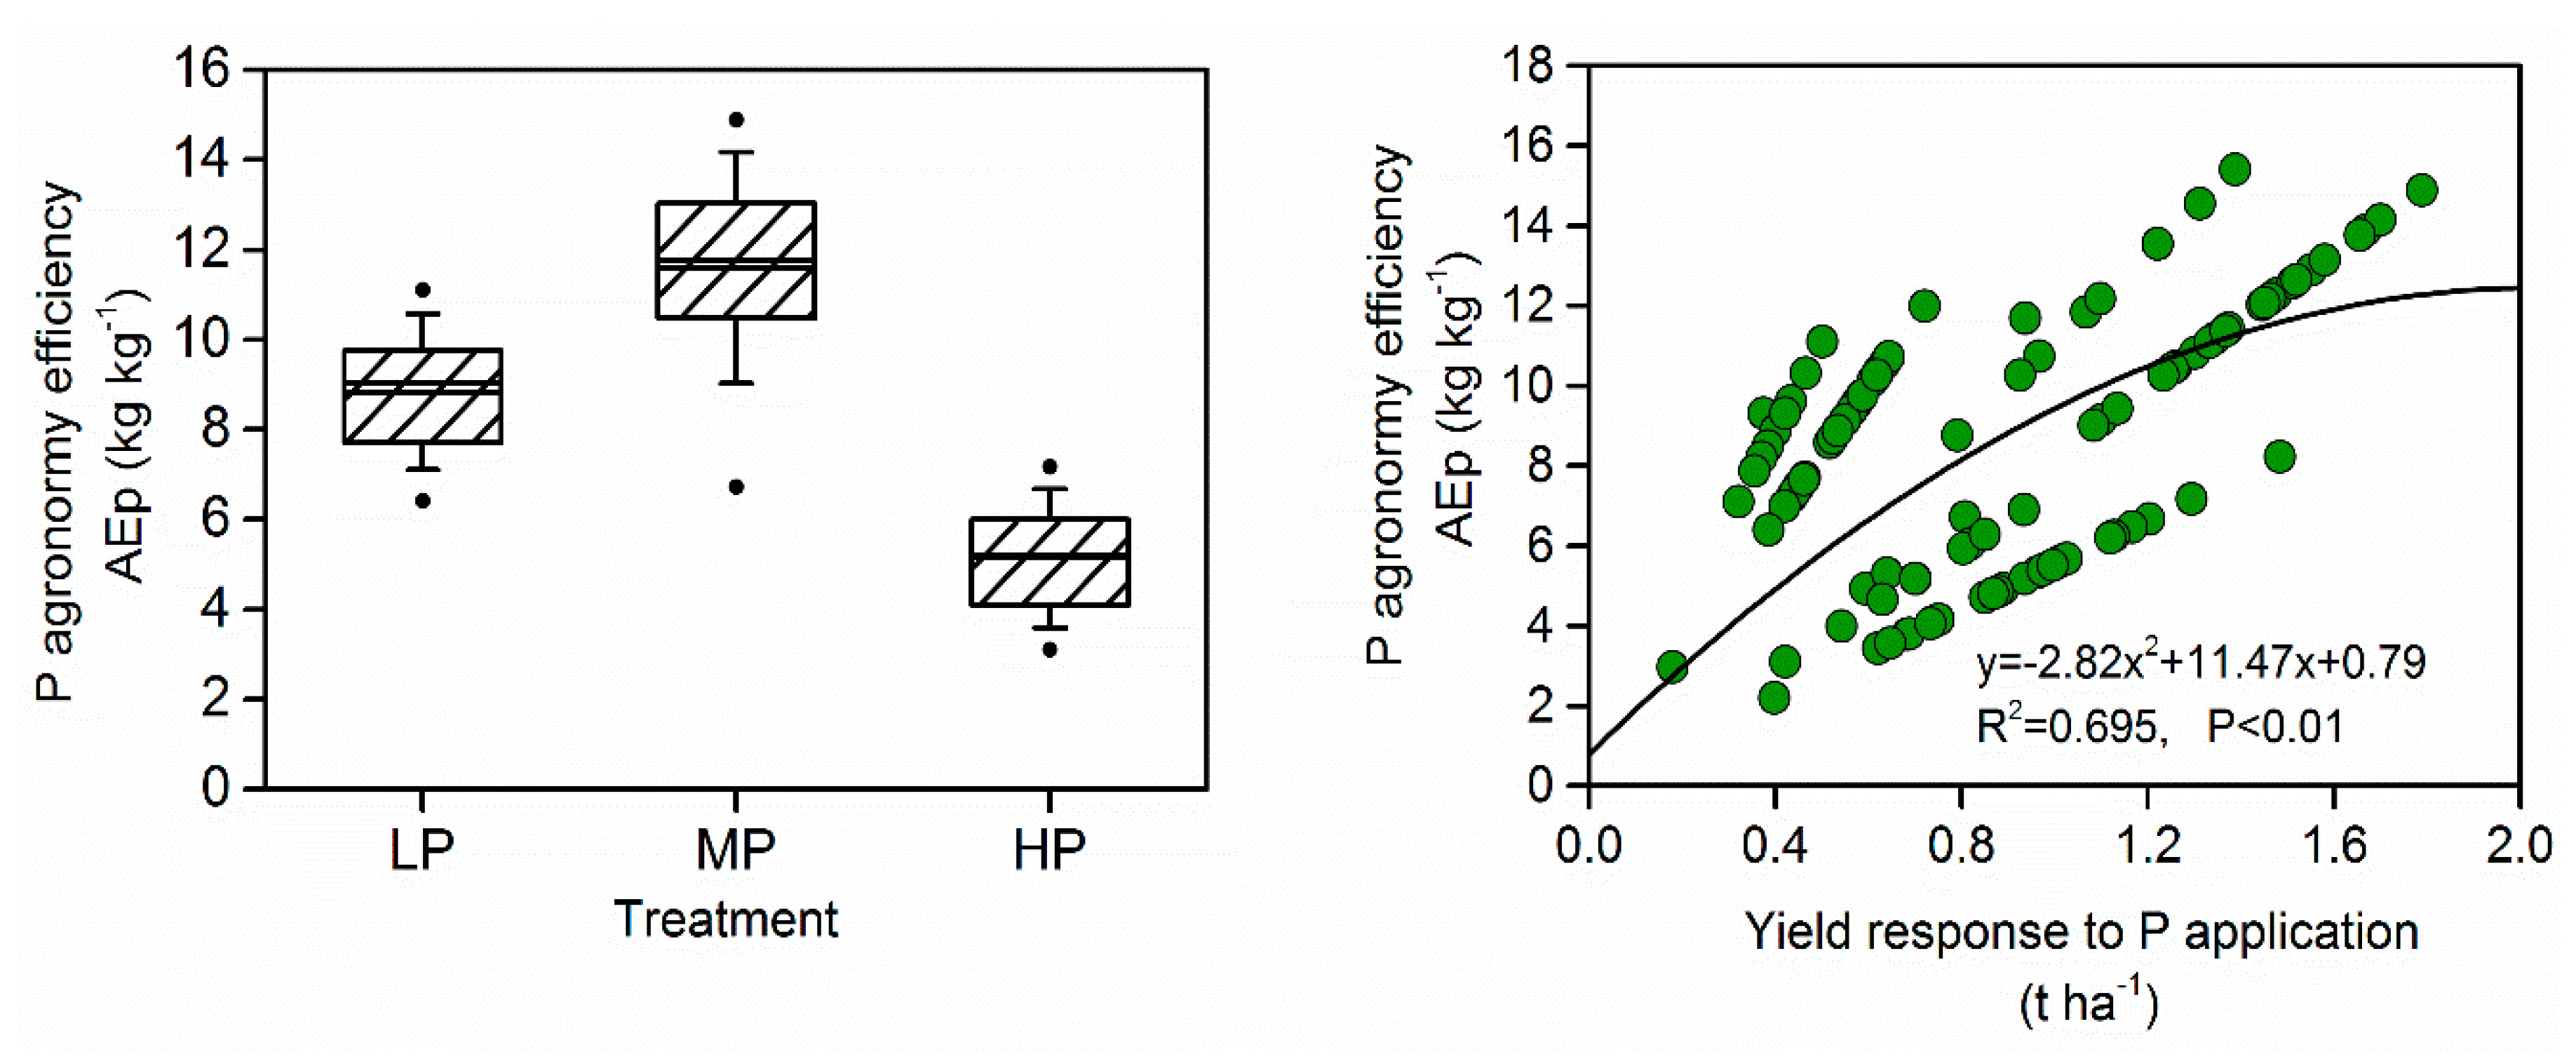
3.3. P Agronomy Efficiency (AEP)

Agronomic efficiency (AEP) could be used to characterize the nutrient effects. Among these treatments, there were significant differences (p < 0.05) in P agronomy efficiency in experimental years (2010–2014) (Figure 6). The average AEp in LP, MP and HP treatments were 8.81, 11.59, and 5.13 kg kg−1, and ranged from 2.98−12.00, 4.94−15.41, and 2.12−8.24 kg kg−1, respectively (Figure 6). The average AEP in LP and HP was significantly decreased (by 23.9% and 55.7%) than that for MP treatment (Figure 6). Thus, soil pH exhibited the following orders: MP > LP > HP. The MP treatment had highest AEP, because of the lower P application rate and highest increase of grain yield. As Chuan et al. [27] indicated that the higher AE values were usually from the optimum nutrient management practice. In contrast, the most important reason for the HP treatment had the lowest AEP was the overuse of P fertilizer. Xu et al. [28] and Chuan et al. [27] reported that the mean AEP for P were 15.7 kg kg−1 for maize and 10.2 kg kg−1 for wheat respectively in China [26,27]. Dobermann et al. [18] suggested that the AEP in modern cereal production systems with no severe P fixation should range between 30 and 50 kg kg−1. Compared with reported by Dobermann et al. [18], the nutrient use efficiency in China was still only at the baseline [18]. Moreover, phosphorous is reducing availability worldwide, which is perhaps the main reason why increased P efficiency are needed [29]. Generally, agronomic efficiency (y, kg kg−1) was positively correlated with yield response to P application (x, t ha−1) (p < 0.01), which can be described by y = 2.82x2 + 11.47x + 0.79 (R2 = 0.695) (Figure 6). Overall, great efforts still need to be taken on best management practices to further improve nutrient use efficiency in China.

3.4. The Benefits of Different P Application Treatments

The benefits to P-derived grain yield (By, $ ha−1) was influenced by the different P fertilization treatments (Table 2). The average P-derived yield benefit (BY) in LP, MP, and HP treatment was 162 $ ha−1, 424 $ ha−1, and 282 $ ha−1, ranged from 59 to 238 $ ha−1, 196 to 590 $ ha−1, and 131 to 489 $ ha−1 (Table 2). The average P-derived yield benefit (BY) in LP and HP treatment were significantly lower (by 61.8% and 33.4%) than MP treatment, showing that the MP treatment result in a higher in P-derived yield benefits (By, $ ha−1).
Similar to the effects on P-derived yield benefit, different fertilization treatments also had different effects on private profitability (BP, $ ha−1) (Table 2). The mean private profitability in MP treatment were also 223 $ ha−1 higher than that in LP treatment (Table 2). Furthermore, the mean private profitability only increased by 42 $ ha−1 in the HP compared with LP.

3.5. Estimated Optimal P Rate for Agronomy (AOPR), Privately (POPR) and Economically (EOPR) for Maize

We would be able to establish the model to calculate the agronomically optimal P rate (AOPR), private Profitability optimal K rate (PPOR), and economically optimal P rate (EOPR) for each site, respectively (Table 3). For agronomically optimal P rate (AOPR), which was calculated by the quadratic model of the P-derived grain yield benefit (BY) to the P application rates (x). The average regression coefficients in the quadratic model of A and B were −0.023 and 5.26 (Table 3). On average, the Quadratic model of P-derived grain yield benefit (BY) to applied P was y= −0.023x2 + 5.26x. Thus, the calculated average AOPR was 127.9 kg ha−1, ranged from 80.6 to 211.3 kg ha−1 (Table 3).
Correspondingly, privately optimal P rate (POPR) was calculated by the quadratic model of the private profitability (BP) to the P application rates (x). The average regression coefficients in the quadratic model of C and D were −0.023 and 4.94 (Table 3). Therefore, the average quadratic model of P private profitability (BP) to applied P was y = −0.023x2 + 4.94x. The calculated average POPR was 110.8 kg/ha, ranged from 78.2 to 181.8 kg/ha (Table 3).
In addition, the spherical model provides a good fit the relationship between K rate (x) and grain yield (y) at each experimental site, and the average regression coefficients in the spherical model of a, b and c were 8.88 kg ha−1, 1.24 t ha−1, and 124.3 kg ha−1 (Table 3). Therefore, the calculated average economically optimal P rate (EOPR) was 114.4 kg ha−1, which ranged from 82.6 to 151.6 kg ha−1. Additionally, the average economically optimal yield (EOY) was 10.11 kg ha−1 (Table 3).
Furthermore, it is worthy to note that the ranking of the P rate was POPR < EOPR < AOPR. If private profitability were considered, the POPR were further reduced by 3.4–10.2% compared to AOPR and EOPR. However, the privately optimal P rate (POPR), may result in nutrient supply was deficient, and an extra input was needed to meet the plant demand and maintain nutrient balance in the long term. Furthermore, in a more remarkable way, the EOPR was lower by 10.5% compared with the AOPR, whereas average economically optimal yield (EOY) was slightly higher compared with the average yield (10262 kg ha−1) in the MP treatment. Therefore, this demonstrates that the EOPR tended to use lower P fertilizers to produce more grain. This analysis suggests that economically optimal P application (EOPR) is recommended. Overall, our study used field experiments in multiple experimental sites to offer a more precise way to recommend optimal P fertilizer rate of maize, especially in planting in large-scale regions.

4. Conclusions

P fertilizer application more effectively increased grain yield. The highest grain yields from receiving MP treatment were significantly increased by 12.69% compared with P0 treatment. Plant P uptake gradually increased with P fertilizer input. The average plant P uptake in HP treatments were significantly higher than other treatments. Furthermore, MP treatment produced greater improvements in P agronomic efficiency (AEP) and P-derived yield benefits (BY) and private profitability. The average agronomically (AOPR), privately (POPR), and economically optimal P rate (EOPR) in 36 experimental sites were suggested 127.9 kg ha−1, 110.8 kg ha−1, and 114.4 kg ha−1, which ranged from 80.6 to 211.3 kg ha−1, 78.2 to 181.8 kg ha−1, and 82.6 to 151.6 kg ha−1, respectively. The EOPR had significantly reduced P application compared with AOPR, and the average economically optimal yield was slightly higher compared with that of the average yield in the MP treatment. It can be concluded from these results that economically optimal P application (EOPR) is recommended for field management. The findings of the current study can be used to optimize P fertilizer application has potential to raise yields and lower environmental risks while reducing excessive P use and losses in regions.

Author Contributions

Conceptualization, W.J. and X.L.; methodology, X.L.; software, W.J. and X.W.; investigation, L.Y. and Y.Y.; data curation, W.J. and L.Y.; project administration, X.L.; writing—original draft preparation, W.J.; writing—review and editing, W.J. and X.W.

Funding

This research was supported by the Specialized Research Fund for the Doctoral Program of Yan’an University (YDBK2018-51) and the National Key Research and Development Program of China (Grant number 2016YFD0200105).

Conflicts of Interest

The authors declare no conflicts of interest.

References

  1. Wang, X.C.; Deng, X.Y.; Pu, T.; Song, C.; Yong, T.W.; Yang, F.; Sun, X.; Liu, W.G.; Liu, Y.H. Contribution of interspecific interactions and phosphorus application to increasing soil phosphorus availability in relay intercropping systems. Field Crop. Res. 2017, 204, 12–22. [Google Scholar] [CrossRef]
  2. Bai, Z.H.; Li, H.G.; Yang, X.Y.; Zhou, B.K.; Shi, X.J.; Wang, B.; Li, D.C.; Shen, J.B.; Chen, Q.; Qin, W.; et al. The critical soil P levels for crop yield, soil fertility and environmental safety in different soil types. Plant Soil 2013, 372, 27–37. [Google Scholar] [CrossRef]
  3. Wu, L.Q.; Cui, Z.L.; Chen, X.P.; Yue, S.C.; Sun, Y.X.; Zhao, R.F.; Deng, Y.; Zhang, W.; Chen, K. Change in phosphorus requirement with increasing grain yield for Chinese maize production. Field Crop. Res. 2015, 180, 216–220. [Google Scholar] [CrossRef]
  4. Oberson, A.; Friesen, D.K.; Rao, I.M.; Bühler, S.; Frossard, E. Phosphorus Transformations in an Oxisol under contrasting land-use systems: The role of the soil microbial biomass. Plant Soil 2001, 237, 197–210. [Google Scholar] [CrossRef]
  5. Krey, T.; Vassilev, N.; Baum, C.; Eichler-Löbermann, B. Effects of long-term phosphorus application and plant-growth promoting rhizobacteria on maize phosphorus nutrition under field conditions. Eur. J. Soil Biol. 2013, 55, 124–130. [Google Scholar] [CrossRef]
  6. Li, H.; Huang, G.; Meng, Q.; Ma, L.; Yuan, L.; Wang, F.; Zhang, W.; Cui, Z.; Shen, J.Y.; Chen, X.G.; et al. Integrated soil and plant phosphorus management for crop and environment in China. A review. Plant Soil 2011, 349, 157–167. [Google Scholar] [CrossRef]
  7. Zhang, W.F.; Ma, W.Q.; Ji, Y.X.; Fan, M.S.; Oenema, O.; Zhang, F.S. Efficiency, economics, and environmental implications of phosphorus resource use and the fertilizer industry in China. Nutr. Cycl. Agroecosyst. 2008, 80, 131–144. [Google Scholar] [CrossRef]
  8. Diaz, R.J.; Rosenberg, R. Spreading dead zones and consequences for marine ecosystems. Science 2008, 321, 926–929. [Google Scholar] [CrossRef]
  9. Conley, D.J.; Paerl, H.W.; Howarth, R.W.; Boesch, D.F.; Seitzinger, S.P.; Havens, K.E.; Lancelot, C.; Likens, G.E. Controlling eutrophication: Nitrogen and phosphorus. Science 2009, 323, 1014–1015. [Google Scholar] [CrossRef]
  10. Li, H.G.; Liu, J.; Li, G.H.; Shen, J.B.; Bergström, L.; Zhang, F.S. Past, present, and future use of phosphorus in Chinese agriculture and its influence on phosphorus losses. Ambio 2015, 44, 274–285. [Google Scholar] [CrossRef] [Green Version]
  11. He, P.; Li, S.T.; Jin, J.Y.; Wang, H.T.; Li, C.J.; Wang, Y.L.; Cui, R.Z. Performance of an optimized nutrient management system for double-cropped wheat-maize rotations in North-Central China. Agron. J. 2009, 101, 1489–1496. [Google Scholar] [CrossRef]
  12. Xu, X.P.; He, P.; Pampolino, M.F.; Johnston, A.M.; Qiu, S.J.; Zhao, S.C.; Chuan, L.M.; Zhou, W. Fertilizer recommendation for maize in China based on yield response and agronomic efficiency. Field Crop. Res. 2014, 157, 27–34. [Google Scholar] [CrossRef]
  13. Li, H.; Cong, R.H.; Ren, T.; Li, X.K.; Ma, C.B.; Zheng, L.; Zhang, Z.; Lu, J.W. Yield response to N fertilizer and optimum N rate of winter oilseed rape under different soil indigenous N supplies. Field Crop. Res. 2015, 181, 52–59. [Google Scholar] [CrossRef]
  14. Cong, R.H.; Li, H.; Zhang, Z.; Ren, T.; Li, X.K.; Lu, J.W. Evaluate regional potassium fertilization strategy of winter oilseed rape under intensive cropping systems: Large-scale field experiment analysis. Field Crop. Res. 2016, 193, 34–42. [Google Scholar] [CrossRef]
  15. Bélanger, G.; Walsh, J.R.; Richards, J.E.; Milburn, P.H.; Ziadi, N. Comparison of three statistical models describing potato yield response to nitrogen fertilizer. Agron. J. 2000, 92, 902–908. [Google Scholar] [CrossRef]
  16. Srivastava, S.; Rao, A.S.; Alivelu, K.; Singh, K.N.; Raju, N.S.; Rathore, A. Evaluation of Crop Responses to Applied Fertilizer Phosphorus and Derivation of Optimum Recommendations using the Mitscherlich–Bray Equation. Commun. Soil. Sci. Plant Anal. 2006, 37, 847–858. [Google Scholar] [CrossRef]
  17. Tilman, D.; Cassman, K.G.; Matson, P.A.; Naylor, R.; Polasky, S. Agricultural sustainability and intensive production practices. Nature 2002, 418, 671–677. [Google Scholar] [CrossRef] [PubMed]
  18. Dobermann, A. Nutrient use efficiency: Measurement and management. In Fertilizer Best Management Practice: General Principles, Strategy for their Adoption and Voluntary Initiatives vs. Regulations, Proceedings of the IFA International Workshop on Fertilizer Best Management Practices, Brussels, Belgium, 7–9 March 2007; Krauss, A., Isherwood, K., Heffer, P., Eds.; International Fertilizer Industry Association: Paris, France, 2007; pp. 1–28. [Google Scholar]
  19. Setiyono, T.D.; Yang, H.; Walters, D.T.; Dobermann, A.; Ferguson, R.B.; Roberts, D.F.; Loyn, D.J.; Clay, D.E.; Cassman, K. Maize-N: A Decision Tool for Nitrogen Management in Maize. Agron. J. 2011, 103, 1276–1283. [Google Scholar] [CrossRef]
  20. Hao, Y.; Ye, Y.; Cui, Z.L.; Chen, X.P. Managing nitrogen for sustainable wheat production. J. Clean. Prod. 2017, 162, 1308–1316. [Google Scholar]
  21. Xin, X.; Qin, S.; Zhang, J.; Zhu, A.; Yang, W.; Zhang, X. Yield, phosphorus use efficiency and balance response to substituting long-term chemical fertilizer use with organic manure in a wheat-maize system. Field Crop. Res. 2017, 208, 27–33. [Google Scholar] [CrossRef]
  22. Deng, Y.; Chen, K.; Teng, W.; Zhan, A.; Tong, Y.P.; Feng, G.; Cui, Z.L.; Zhang, F.S.; Chen, X.P. Is the inherent potential of maize roots efficient for soil phosphorus acquisition? PLoS ONE 2014, 9, e90287. [Google Scholar] [CrossRef] [PubMed]
  23. Seggewiss, B.; Jungk, A. Influence of potassium dynamics at the soil-root interface on magnesium uptake of plants. Z. Pflanzenernahr. Bodenkd. 1988, 151, 91–96. [Google Scholar] [CrossRef]
  24. Heenan, D.P.; Campbell, L.C. Influence of potassium and manganese on growth and uptake of magnesium by soybeans (Glycine max (L.) Merr. cv. Bragg). Plant Soil 1981, 61, 447–456. [Google Scholar] [CrossRef]
  25. Hartmann, T.E.; Yue, S.C.; Schulz, R.; He, X.K.; Chen, X.P.; Zhang, F.S.; Muller, T. Yield and N use efficiency of a maize–wheat cropping system as affected by different fertilizer management strategies in a farmer’s field of the North China Plain. Field Crop. Res. 2015, 174, 30–39. [Google Scholar] [CrossRef]
  26. Liu, H.; Wang, Z.; Yu, R.; Li, F.; Li, K.; Cao, H.; Yang, N.; Li, M.H.; Dai, J.; Zan, Y.L.; et al. Optimal nitrogen input for higher efficiency and lower environmental impacts of winter wheat production in China. Agric. Ecosyst. Environ. 2016, 224, 1–11. [Google Scholar] [CrossRef]
  27. Chuan, L.; Ping, H.; Pampolino, M.F.; Johnston, A.M.; Jin, J.; Xu, X.; Zhao, S.C.; Qiu, S.J.; Zhou, W. Establishing a scientific basis for fertilizer recommendations for wheat in China: Yield response and agronomic efficiency. Field Crop. Res. 2013, 140, 1–8. [Google Scholar] [CrossRef]
  28. Xu, X.; He, P.; Zhan, J.; Pampolino, M.F.; Johnston, A.M.; Zhou, W. Spatial variation of attainable yield and fertilizer requirements for maize at the regional scale in China. Field Crop. Res 2017, 203, 8–15. [Google Scholar] [CrossRef]
  29. Daneshgar, S.; Callegari, A.; Capodaglio, A.G.; Vaccari, D. The Potential Phosphorus Crisis: Resource Conservation and Possible Escape Technologies: A Review. Resources 2018, 7, 37. [Google Scholar] [CrossRef]
Figure 1. Map of the seven main maize-growing regions in Liaoning Province of China. Solid triangle shows locations of experimental sites. Thick lines show urban boundaries while fine lines show county boundaries.
Sustainability 11 04799 g001
Figure 2. Average monthly precipitation (green bars) and temperature (lines) measured during the planting periods at seven regions in Liaoning province, China (2010–2014).
Sustainability 11 04799 g002
Figure 3. Three models method used for optimizing P rates.
Sustainability 11 04799 g003
Figure 4. (a) Grain yield under different P application treatments across 36 experiment sites. Note: Solid and dotted lines within the box represent median and mean of all the data, respectively; Box boundaries indicate the upper and lower quartiles; whisker caps indicate 90th and 10th percentiles; dots denote the 95 and 5 percentiles. Different letters indicate a significant difference (p < 0.01) among different treatments. (b) Relationship between P application rate and grain yield (p < 0.01) using the data in 36 experimental sites of Liaoning province, Northeast China, during 2010–2014.
Sustainability 11 04799 g004
Figure 5. Plant P uptake under different P application treatments across 36 experiment sites (a,b) the relationship between P application rate and plant P uptake (p < 0.01) using the data in 36 experimental sites of Liaoning province. Polynomial fitting and correlation coefficients between grain yield and plant P uptake across LP, MP and HP treatment (ce). The Red line is the polynomial linear fitting and the red zone delineate the 95% confidence interval of the regressions.
Sustainability 11 04799 g005
Figure 6. P agronomy efficiency across LP, MP, and HP treatment (a,b) the relationship between P agronomy efficiency (AEP, kg kg−1) and yield response to P application (t ha−1) (p < 0.01).
Sustainability 11 04799 g006
Table 1. Basic soil physicochemical characteristics of the 36 experimental sites of Northeast China measured before the experiment.
Years20102011201220132014
Parameter
PH5.85.65.96.26.1
Organic C (g kg−1)9.48.89.910.69.2
Total N (g kg−1)0.850.970.920.810.79
NH4-N (mg kg−1)3.24.53.83.94.6
Olsen-P (mg kg−1)16.620.219.719.218.2
Exchangeable K (g kg−1)103.2114.3120.2106.799.8
Soil bulk density (g cm−3)1.21.31.21.41.1
Sand contents (%)19.622.320.619.218.7
Table 2. P-derived yield benefit (By) and private profitability (Bp) for maize in LP, MP, and HP treatments.
TreatmentP-Derived Yield Benefit (By, $ ha−1)Private Profitability (BP, $ ha−1)
LPMPHPLPMPHP
Mean161.7424.2282.4122.2345.2164.0
SD a36.390.477.734.086.372.8
Min58.9195.6131.016.4110.53.4
25th Q b138.5362.3227.8100.3288.4114.4
Median159.2436.1280.5124.5356.6164.1
75th Q b189.6486.1329.7147.1401.1205.9
Max237.6590.1489.4195.0505.0361.8
a = standard deviation; b = quartile.
Table 3. Evaluated the agronomically, privately and economically optimal P rate based on the quadratic functions model of P-derived yield benefit, private profitability, and the spherical model.
StatisticCoefficients for the Quadratic Functions Model of P-Derived Yield Benefit and P Rate BY
($ ha−1) = Ax2 + Bx
Agronomically Optimal P Rate AOPR (kg ha−1)Coefficients for the Quadratic Functions Model of Private Profitability
BP ($ ha−1) = Cx2 + Dx
Privately Optimal P Rates POPR (kg ha−1)Coefficients for
Spherical Model of P
Y ( t   ha 1 ) = a + b [ 3 x 2 c 1 2 ( x c ) 3 ]
Economically Optimal P Rates EOPR (kg ha−1)Economically Optimal Yield EOY (t ha−1)
ABCDa (t ha−1)b (t ha−1)c (kg ha−1)
Average−0.0235.62127.9−0.0234.94110.88.881.24124.3114.410.11
Min−0.0492.1780.6−0.0491.4678.25.810.5687.682.67.18
25% Q a−0.0285.03113.6−0.0284.3394.67.901.08111.1100.39.03
75% Q a−0.0186.51139.2−0.0185.80122.09.821.41136.9125.911.13
Max−0.0087.90211.3−0.0087.90181.812.052.01163.2151.613.10
a = quartile.

