Article

Social Cost Benefit Analysis of Operating Compressed Biomethane (CBM) Transit Buses in Cities of Developing Nations: A Case Study

by
Kavitha Shanmugam
1,
Anju Baroth
2,
Sachin Nande
3,
Dalia M. M. Yacout
1,
Mats Tysklind
1 and
Venkata K. K. Upadhyayula
1,*
1
Department of Chemistry, Umea University, SE 90187 Umea, Sweden
2
Department of Habitat Ecology, Wild Life Institute of India, Uttarakhand 248002, India
3
Engineering Research Center, TATA Motors, Pune 411016, India
*
Author to whom correspondence should be addressed.
Sustainability 2019, 11(15), 4190; https://doi.org/10.3390/su11154190
Submission received: 21 June 2019 / Revised: 26 July 2019 / Accepted: 30 July 2019 / Published: 2 August 2019
(This article belongs to the Special Issue Sustainability Issues in Public Transport)

Abstract

:
Cities in developing nations have to deal with two significant sustainability challenges amidst rampant urbanization. First, consumer-generated food waste is increasing monumentally since open dumping is still followed as a predominant practice, the negative environmental externalities associated with food waste disposal are growing beyond manageable proportions. Second, the dependency on conventional fuels like diesel to operate transit buses, which is one of the major causes for deteriorating urban air quality. A nexus established between food waste management and operation of transit buses can improve the sustainable performance of cities in developing nations. In this study, a Life Cycle Assessment (LCA) supported Social Cost-Benefit Analysis (SCBA) is performed by considering a hypothetical scenario of establishing a large food waste treating biomethanation plant in Mumbai, India. The food waste from the city is transported to a biomethanation plant where it is subjected to an anaerobic digestion (AD) process. The biogas produced as a byproduct is upgraded to compressed biomethane (CBM) and used as a vehicle fuel to operate transit buses within the city. The LCA results suggest that CBM buses can reduce greenhouse gas and particulate matter emissions by 60% compared to diesel or compressed natural gas (CNG) buses. Fossil depletion potential of CBM buses is 98% lower than diesel, suggesting CBM’s importance in decoupling developing nations dependency on imported crude oil. The SCBA considers: (a) costs to stakeholders, i.e., fees for open dumping of food waste and cost of fuel for operating transit buses; and (b) social costs incurred by negative environmental externalities (obtained by monetizing LCA results) resulting from both, open dumping as well as fuel combustion. SCBA results indicate that the food waste-based CBM model can save 6.86 billion Indian rupees (USD 99.4 million) annually for Mumbai. The savings are made due to a reduction in stakeholder’s costs (fuel) coupled with societal, i.e., environmental externality costs if entire transit bus fleet operates on CBM fuel instead of conventional fuel mix (33:67 diesel to CNG) currently used. Although the study is performed for Mumbai, the results will be replicable to any city of developing nations facing similar issues.

1. Introduction

Urbanization builds stronger economies and an urban lifestyle, but also arguably empowers the people to find their socio-economic liberty. As a global phenomenon, urbanization is occurring at a massive scale and a rapid rate. An impending challenge looming before many countries is to achieve development without facing any dire sustainability consequences. Around 9.8 billion people are estimated to inhabit planet earth by 2050 [1] and two thirds of this population will reside in urban localities. Urbanization is expected to occur at a faster pace in developing than in developed nations. Therefore, the countries in the developing world will have to face multiple sustainability challenges in the coming decades. The United Nations (UN) Sustainable Development Goal (SDG)-11 aims at building sustainable cities [2]. The two critical targets established by the UN under SDG-11 for developing nations include: (a) provision of cheaper and sustainable public transportation for people living in cities; and (b) development of an efficient municipal solid waste (MSW) management system (similar to developed countries) that minimizes the environmental externalities to a manageable level [2].
MSW management is an uphill task for cities in the developing world for two reasons. First, some developing nations like China and India are witnessing a monumental increase in the quantities of MSW generated in recent years. South (mainly India) and East Asian countries are the highest generators of waste in the world and produced 334 and 468 million tons of MSW, respectively in 2016 [3]. This amount is expected to be doubled by 2050 [3]. The second major issue concerning managing MSW in many developing countries is the lack of proper infrastructure in place for collection, transport, and treatment of waste. More importantly, the problem lies with the disposal of organic waste (i.e., mainly food wasted by the consumer), which accounts for 53–56% of MSW in developing countries [3]. Unlike in many developed nations, food waste is not segregated at the source in these countries and becomes a stream of MSW. While a lack of proper infrastructure for segregation of food waste at the source is an inefficiency by itself, the situation gets worse with landfilling and open dumping adopted as a predominant disposal mechanism.
Food waste from cities can be better managed with treatment techniques like vermicomposting, incineration, and anaerobic digestion. Vermicomposting is a biologically driven process where organic waste is converted to nutrient-rich soil using worms. This vermicompost product can be used as biofertilizer, which acts as a substitute for chemically produced inorganic fertilizers [4,5]. However, vermicomposting is a time-consuming and maintenance-intensive process with a low resistance to microbial contamination [4,5]. On the other hand, from a waste collection perspective, incineration is an attractive choice because there is no need for segregation of food waste at the source. However, food waste (any organic waste) is characterized by high moisture content, which renders incineration an inefficient technique from an energy harvesting perspective. Studies suggest that the disposal of food waste through incineration is the least preferred technology, only next to landfilling because of its worst environmental performance [6]. Anaerobic digestion (AD) process is considered as the best option for treating food waste if segregated adequately at the source [6]. Food waste digested in AD plants yields valuable byproducts such as biogas and sludge digestate. The biogas produced is either combusted in a Combined Heat and Power (CHP) plant to generate electricity and heat or upgraded to pure methane and subsequently used as a transportation fuel. The sludge digestate, with its rich nutrient value, is used as organic biofertilizer [7].
Although AD is touted as the most environment-friendly technique for treating food waste, it is not widely adopted by the cities in the lower middle or even in upper-middle-income countries [3]. The reason being that high expenditure is required to construct (capital) and operate a large-scale AD plant. The unit cost of treating food waste in an AD plant varies from USD 20–80 and USD 50–100 per ton in the lower middle and upper-middle-income countries, respectively [3,8]. Establishing AD plants is a huge financial burden for municipal corporations of cities in upper or lower-middle-income nations. Therefore, they opt for cheaper alternatives such as open dumping (USD 3–10/ton in lower-middle-income countries) and landfilling (USD 15–40/ton in lower-middle and USD 25–65/ton in upper-middle-income countries) [3,8]. However, low-cost treatment options, especially open dumping, are associated with significant negative environmental externalities and thereby impose massive social costs on societies.
Another problem faced by major cities in developing nations is the overstrained public transportation system. Rampant urbanization imposed tremendous pressure on all types of public transport systems, especially on transit bus services. Transit or public buses are the primary commuting source for millions of people residing in cities of low, lower-middle, and to some extent, upper-middle-income countries. To meet the commuting needs of the large urban population, operation of transit bus vehicular fleet is increasing consistently. For example, the transit buses in China and India was 41,300 and 18,900 in 2015, which is expected to increase to 57,700 and 36,400, respectively by 2022 [9]. Increase in the vehicular fleet of transit buses implies an increase in fuel demand, and this is a significant cause of concern from an environmental standpoint. Although the introduction of electric or biofuel based transit bus fleet is under active perusal, diesel still remains as the primary source of transport fuel in cities of low and lower middle-income countries. The diesel-driven buses are not only responsible for the increase in greenhouse gas (GHG) emissions but also a principal cause for deteriorating urban air quality. Compressed Natural Gas (CNG) is another preferred fuel to operate transit buses in cities, for instance, Delhi and Mumbai in India. While conventional alternative like CNG is better than diesel from a perspective of reducing particulate matter emissions due to lower tailpipe emissions, their performance is equivalently poor than diesel-driven buses from a climate change perspective, as confirmed by actual emission studies [10]. At this juncture, operating transit buses on compressed biomethane (CBM) obtained from AD plants treating consumer-generated food waste can address multiple sustainability challenges faced by cities in developing nations.
In the past, several research studies reported the environmental and economic benefits of using CBM as transport fuel [11,12,13,14]. Importantly, CBM as transportation fuel reduces environmental externality costs [12] and economically incentivize operation of public transportation [15]. However, the potential sustainability benefits of establishing a food waste-based AD plant and upgradation of produced biogas to CBM to use it as a fuel for transit buses subsequently is not comprehensively understood for a city in developing nation. This study aims to fill that gap and proposes to analyze the sustainable performance of a CBM driven public bus transportation system by selecting a metropolitan city, Mumbai from India, as a case study. The city tops the list of Indian cities for the amount of waste generation [16]. It also has one of the busiest bus transportation systems in the world with an operational fleet of 3775 buses used by 5 million passengers annually for their daily commuting [17]. From this perspective, Mumbai makes a good case for evaluating the sustainability benefits of CBM operated buses.
In this study, an LCA is performed, and the environmental performance of food waste to fuel is evaluated. The study assumes that an AD plant established in Mumbai treats its food waste to generate biogas. The biogas generated by the plant is upgraded to CBM, which will be used as a fuel to operate city buses. The results of this LCA will be compared with the environmental performance of diesel and CNG fueled buses based on functional unit equivalency. The LCA results are used as an input for social cost-benefit analysis (SCBA) study (private costs and social costs due to environmental externalities), performed to determine potential benefits and implications of introducing CBM fueled buses in the bus fleet of Mumbai city. Finally, the private and sustainable rate of returns of CBM as transport fuel considering the economic living class of people as an essential dimension is determined. Although the study is performed for Mumbai city, the results are mostly applicable to other urban areas in the developing world with similar living conditions.

2. Life Cycle Assessment Methodology

2.1. Goal and Scope of LCA Study

The environmental performance of establishing a compressed biomethane (CBM) based bus transportation system within Mumbai city will be evaluated using this LCA study. This is a “Well to Wheel” type LCA study where environmental impacts of buses driven on CBM obtained from food waste based biomethanation plant are quantified.
Functional Unit: Total distance driven in bus-kilometers (bus-km) in a year by buses operating on CBM fuel produced from a biomethanation plant treating food waste generated by residents of Mumbai city. The results are compared with an equivalent distance driven by diesel and compressed natural gas (CNG) buses.

2.2. System Boundary

The system boundary considered for this well to wheel LCA is shown in Figure 1.
The life cycle of CBM operated bus consists of nine stages as shown in Figure 1. First, the food waste (assumed to be segregated at the source) is received in trucks at the entrance of the plant. The treatment begins with a waste preprocessing unit where food waste passes through a sand trap to separate any undesirable waste constituents with low digestibility and/or particles that may otherwise disrupt the smooth functioning of AD process. These rejects (e.g., biowaste such as dried leaves etc.) are sent to landfill. After passing through the initial screening stage, food waste is mixed with warm water to form a thick slurry and churned well (using grinding operation) to facilitate better digestibility. In AD unit, biodigestion takes place and raw biogas with a methane content of 63% methane (typical methane composition of food waste [18]) is produced. The raw biogas is sent to scrubbing unit to strip off CO2 and obtain biomethane in its pure form. The pure biomethane is compressed (CBM) and will be sent to an onsite fueling station where it is loaded into fuel tank of a bus. After filling, the bus goes out for its regular operation for transporting passengers. The digested sludge from anaerobic digester is sent to a sludge drying facility where polymer is added to thicken the sludge. The thickened sludge after drying can be utilized as a biofertilizer. The energy demand for CBM production plant is met internally via biogas combined heat and power (CHP) plant installed on site. The raw biogas from AD is combusted in biogas CHP unit which produces electricity and heat requite to operate the CBM plant. The residual biogas (after meeting energy needs of the plant) is upgraded to CBM and used as a transport fuel for operation of transit buses.

2.3. Life Cycle Inventory (LCI) phase

Major assumptions made with respect to modeling of LCI data associated with this ‘well-to-wheel’ life cycle of food waste to CBM driven buses are discussed below.

2.3.1. Quantity of Food Waste Treated Per Year

The LCI modeling considers that the waste treatment capacity of biomethanation plant in Mumbai is identical to the plant in Skelleftea, a city located in Northern Sweden. The Skelleftea municipality has a large-scale AD facility for treatment of organic wastes (food waste generated by city residents and other waste streams from slaughterhouses etc.) and biogas produced from the plant is upgraded to CBM and used as fuel to operate buses [19,20]. The hypothetical biomethanation plant modeled by this LCA for Mumbai city is assumed to have same organic waste digestion capacity of the plant operational in Skelleftea.
The Skelleftea plant operates on high solids, i.e., 26–30% of total solids (TS) and is capable of co-digesting multiple organic waste streams. It is estimated to receive 22 tons food waste and 15 tons of slaughterhouse waste (mainly blood, manure, animal fat) per day respectively [20]. However, for Mumbai case, only the food waste is considered for digestion (mono digestion). Organic waste from slaughterhouses is not included in LCI modeling because of the complexity associated with data generation. In Mumbai, the legal slaughterhouses are regulated to treat their own waste and are not dependent on city municipality. Furthermore, the number of illegal slaughterhouses in the country including Mumbai are tenfold higher than the legal ones [21,22]. This adds complexity to gather data and estimate the amount of waste produced by slaughterhouses. Therefore, the biomethanation plant in Mumbai is assumed to treat only food waste on daily waste intake basis as mentioned above. Thus, going with same daily waste intake values as that of Skelleftea (37 tons per day), Mumbai biomethanation plant receives 13,505 tons of consumer food waste per. One important caveat to our LCI model is that only waste intake capacity is assumed to be identical to that of Skelleftea plant. The remaining LCI data is constructed based on literature values specifically relevant to Indian context wherever possible.

2.3.2. Biogas Generation Potential

The rate of biogas production from AD units reportedly ranges from 160–200 Nm3/ton of food waste [18,23,24]. For our study, the biogas generation rate of 180 Nm3/ton of food waste is considered.

2.3.3. Energy Consumption of Biomethanation Plant

The specific electricity consumption of biomethanation plant lies between 150–190 KWh/ton of waste treated, which is equivalent to 0.73–0.93 KWh/Nm3 of raw biogas produced. The specific energy consumption values specified in literature (0.208 KWh/Nm3 of biogas) for pretreatment (churning and water addition) and AD stages [25]; 0.3–0.6 KWh/Nm3 for upgrading with regenerative water scrubbing [26,27,28]; and 0.208 KWh/Nm3 for an onsite CBM service station [29] range from 0.71–1.01 KWh/Nm3 of biogas produced. For our study, the specific energy consumption of the plant is assumed as 0.85 KWh/Nm3 biogas. The energy consumption of entire biomethanation plant is assumed to be met by combusting biogas in CHP unit installed onsite, i.e., the plant requires no external heat and electricity for its operation. The energy content of biogas is 6 KWh and yields 2 and 2.5 KWh of electrical and thermal energy respectively when combusted [18,30]. Thus, a portion of biogas produced by biodigester is diverted to CHP unit and the remaining amount is upgraded to CBM.

2.3.4. Water Consumption of the Plant

Water is required at two stages: (a) dilution of food waste to form a thick slurry; and (b) for water scrubbing during raw biogas upgrading. The plant operates with Total Solid (TS) content of 26–30% and correspondingly, the mass of wet sludge is 3.3 kg per kg TS [31]. Water consumption for dilution is calculated after discounting moisture content (70%) of food waste [32]. Regenerative scrubbing is assumed for biogas upgrading and water is used in close loop. Thus, only a makeup water of 5% (losses) is considered.

2.3.5. Methane Slip Emissions

Methane slip emissions in CBM plants are mainly from AD and upgradation units. Although a large variation is reported in literature, methane losses of an optimally operated food waste digestion plants ranges between 1–4% of produced methane [33,34]. For our LCA, we considered 2% considered as methane losses.

2.3.6. Sludge Digestate as Biofertilizer

Digested sludge is dewatered, and dried to be used as biofertilizer. A sludge thickening polymer addition is in the range of 3–8 kg per ton of dried sludge [35]. For our LCA, polymer addition (Polyacrylamide) of 5 kg per ton of dried sludge is considered. The water removed is recirculated in close loop and dried sludge is sold as a biofertilizer. In Skelleftea plant 15% of incoming waste becomes dry digestate. The percentage of waste transformed to digestate ranges from 10–20% [7]. For our study, 15% of incoming food waste is assumed to get converted into solid digestate and used as a biofertilizer. Correspondingly, an avoidance credit is taken for application of compost (with NPK value of 0.7% nitrogen; 0.4% phosphorus as P2O5; and potassium as K2O) on agricultural lands [29].

2.3.7. Waste Rejects from the Plant

The plant receives 13,505 tons of food waste per year. Of this quantity 7% (945 tons) does not pass pretreatment stage and is considered as a reject stream [7]. Further, 85% of this reject stream (803.25 tons) is biowaste i.e., green (e.g., vegetable leaves) and brown waste (e.g., dried leaves) and 15% (141.75 tons) is non-biodegradable (plastic covers, sand and stones etc.) [7]. The biowaste portion of reject stream is composted. Although this compost can be used as biofertilizer, estimating its nutrient value is difficult because of large uncertainty associated with its composition. For this reason, biowaste is treated as empty stream, i.e., neither the processing burdens of composting are accounted, nor is a credit taken for its value as a fertilizer. The non-biodegradable portion of reject stream is open dumped similar to majority of MSW in India, especially in Mumbai city ends up in open dumps [36].

2.3.8. CBM Fueling and Operation of CBM Buses

The buses will be fueled through onsite fueling station once a day. The fuel economy of CBM buses is 0.57 Nm3/km [37,38]. The tailpipe emissions of CBM buses is obtained from literature [39,40].
The LCI data used in this “Waste to Wheel” LCA of CBM buses is shown in Table 1.
As mentioned in Table 1, CBM fuel produced by biomethanation plant is sufficient to drive 1,408,062 bus-km per year. The environmental impacts of driving this distance by CBM fueled buses is compared with an equivalent distance of transit buses driven on CNG and diesel fuel. The tailpipe emissions of CNG and diesel buses is obtained from literature [10,41]. The study is modeled with SimaPro-PhD version 8.2 [42], LCA software package. The upstream LCI data is obtained from Ecoinvent database [29], whereas the data for open dumping of MSW (food waste is part of MSW in India) is obtained from literature [43,44].

2.4. Life Cycle Impact Assessment Methodology

ReCiPe (World-H), a midpoint impact assessment method is used to quantify ten relevant environmental impacts [45]. The ten impact categories reported in the study include: (a) Global Warming Potential (GWP) in kg CO2 eq.; (b) Ozone Depletion Potential (ODP) in kg CFC-11 eq.; (c) Acidification Potential (AP) in kg SO2 eq.; (d) Freshwater Eutrophication Potential (FEP) in kg P. eq.; (e) Human Toxicity Potential (HTP) in kg 1–4 DB eq.; (f) Photochemical Oxidation Formation Potential (POFP) in kg NMVOC eq.; (g) Particulate Matter Formation Potential (PMFP) in kg PM10 eq.; (h) Terrestrial Ecotoxicity Potential (TEP) in kg 1–4 DB eq.; (i) Freshwater Ecotoxicity Potential (FETP) in kg 1–4 DB eq.; and (j) Fossil Depletion Potential (FDP) in kg oil eq.

2.5. Uncertainty Analysis

The outcome of LCA may be affected when key parameters and assumptions used for construction of LCI model are changed. Variation in parameters such as methane slip emissions associated with biomethanation plant, fuel economy of CBM driven buses, and tailpipe emissions for all three energy carriers can have a profound effect on the results. Uncertainty analysis is performed to understand how the environmental performance of CBM driven buses is impacted when key modeling parameters are varied over a range. Incorporating the ranges of key parameters, uncertainty analysis was performed using Monte Carlo simulations in SimaPro with 5000 steps and 95% confidence interval. The key LCI modeling parameters varied are shown in Table 2.

2.6. Scenario Analysis-External Energy Supply

The scenario analysis examines the influence of using external energy supply on overall environmental performance of CBM driven buses. Given the fact that external energy supply, if obtained from coal intensive Indian electrical grid mix, can lead to tradeoffs and may potentially dilute the environmental benefits derived from making a fuel shift from CNG and/or diesel to CBM fuel. Therefore, it is important to evaluate environmental performance of CBM buses in comparison with CNG and diesel buses when electricity needs of biomethanation plant are met from external source, i.e., Indian electrical grid. Thus, it is assumed that the 1922 MWh of electricity (power consumption of the plant-Table 1) is supplied from Indian national grid, and entire biogas is upgraded to CBM and subsequently used as fuel for operation of transit buses. This amounts to 1,395,818 Nm3 CBM for year (after discounting 2% methane losses) which will be able to support 2,448,803 bus-km per year. Environmental performance is compared with equivalent amount of bus-km operated on diesel and CNG.

2.7. Societal Cost Benefit Analysis (SCBA) of CBM Public Transportation System

From a societal cost perspective, a food waste biomethanation plant has twofold benefits. First, the cost of disposal of food waste in landfills/open dumps and associated environmental externality costs are avoided. Second, the plant produces CBM which is a cleaner substitute of diesel/CNG used for city buses. Correspondingly, the fuel and environmental externality costs of diesel or CNG driven city buses are avoided. To understand potential social benefits and cost implications of establishing a biomethanation plant in Mumbai, an SCBA is performed. SCBA is calculated as the difference between business as usual (BAU) and CBM scenarios. The annual social cost of BAU, i.e., open dumping of food waste and using a combination of CNG and diesel as transport fuels for operating city buses is given in Equation (1). The ratio of CNG and diesel fuel mix used to operate transit buses in Mumbai city is 66:34 [17]. The same is considered for calculating fuel and environmental costs of BAU scenario. Correspondingly, the annual fuel and environmental costs associated with biomethanation plant and using CBM fuel for city buses is given in Equation (2).
S C B A U = [ ( U C L F D ) × ( Q L F ) + ( E C L F D ) + ( U C F u e l ) × ( Q F u e l ) + ( E C   C N G   &   D i e s e l ) ]
S C C B M = [ ( U C C B M × Q C B M ) + ( U C L F D × Q N D L F ) + ( E C C B M   S y s t e m ) ( U C B F × Q B F )   ]
where
S C C B M     and S C B a s e l i n e   are Social cost of baseline and CBM systems
U C L F D = Unit cost of landfilling/open dumping food waste (INR/ton)
Q L F = Amount of food waste landfilled/open dumped by the plant per year (tons)
E C L F D = Environmental cost of disposal of food waste in landfills/open dumps (INR/year)
U C F u e l = Unit Cost of Diesel (INR/liter) and Unit cost of CNG (INR/Nm3)
Q F u e l = Amount of diesel (in liters/year) and CNG in (Nm3/year) per year (in 66:34 ratio)
E C C N G & D i e s e l = Environmental costs associated with CNG and diesel buses (INR/year)
U C C B M = Unit Cost of CBM Fuel (INR/Nm3)
Q C B M = Amount of CBM produced by a plant per year (Nm3/year)
Q N D L F = Amount of non-digestible waste from CBM plant sent to landfills (INR/ton)
U C B F = Cost of biofertilizer per ton
Q B F = Amount of biofertilizer generated per year.
E C C B M = Environmental costs associated entire life cycle, i.e., from food waste to wheel life cycle of CBM buses (INR/Year)
Net societal benefit of having a CBM Plant (INR per year) = S C B A U S C C B M .
The input from LCA results is used to calculate environmental costs. The calculations of SCBA are shown in detail in supporting information.

2.8. Sustainable Value of Alternative Perspectives of Utilizing CBM as Transport Fuel

From an urban metabolism standpoint, biomethanation plants are crucial for development of sustainable cities because they transform waste flows generated by a city into renewable energy source. The cause for establishment of these plants in large cities (like Mumbai) of developing nations is justifiable as it is primarily aimed to reduce landfill and fuel externalities. Concurrently, social dimension of considering CBM as a transport fuel, i.e., the class of people who will be benefitted the most from its use must be understood. This is especially important for a country like India, which is deeply divided based on economic class (rich, upper middle, middle, lower middle and poor). This economic status of the society dictates mode of transportation and the expenses incurred for transport. CBM as transport fuel is environmentally advantageous than its fossil counterparts, but the sustainable value it creates to a society depends greatly on class of people benefiting from its use.
The benefits of CBM utilization are evaluated considering three different societal classes: (a) An upper-middle class person who owns a car and uses CBM as a fuel for its operation; (b) a taxi driver making a livelihood on CBM driven car; and (c) a provider of city bus transportation (e.g., BEST Mumbai) which is a major mode of commuting by poor workers.
In India, the affordability of a private owned passenger car lies with an income group earning 1.2–2.4 Million INR (USD 17k–34k) per annum [47]. A cab driver on an average earns 180,000 INR per annum (USD 2.6k) (~15,000 INR a month based on survey of 808 salaries) with an upper limit close to 0.45 million INR (5 lakhs) [48]. For current living standards, this is classified as low-lower middle-class income earning group [47]. Finally, a large population falling under lower income group (60,000–100,000 INR per annum or USD 864-1.44k per annum) in society rely on city buses as their major means of transport. A shift from conventional fuels (petrol, diesel or CNG) to CBM means a different sustainable value for people categorized under different income classes. From the context of this study, we believe two types of ratios are important to understand social perspective of utilization of CBM as transport fuel. These ratios are determined using Equations (3) and (4).
P R R = ( F C B A U   F C C B M   A n n u a l   I n c o m e P e r s o n )
S R R =   [ ( F C B A U F C C B M ) + ( S C B A U S C C B M ) G D P   ( P P P )   P e r C a p i t a C i t y ]
where,
P R R = Private returns ratio
F C B A U   and F C C B M   are fuel costs for transportation on car or bus.
BAU is business as usual scenario. For the private car owner’s scenario both petrol and diesel cars are considered as BAU; for cab driver scenario CNG and diesel are considered as BAU; and for transport provider, BAU is the status quo of Mumbai city, i.e., 66% bus km attributed to CNG and 34% to diesel buses.
S R R = Sustainable returns ratio.
S C B A U and S C C B M are social costs attributed to negative environmental externalities associated with respective transport fuels.
G D P ( P P P )   P e r C a p i t a C i t y is Gross Domestic Product per Capita (Purchase Power Parity)
The ratio P R R is an indication of economic value (i.e., what is the value of fuel savings to a person with respect to total earnings) that a cleaner transport fuel such as CBM can bring to individuals which can be perceived differently by different income groups. On the other hand, S R R broadly indicates sustainable efficiency of utilizing CBM as a transport fuel with respect to current fuels for different social scenarios. Determination of S R R is drawn from return to cost ratio concept [49] that is normally used by the corporate firms to quantify their resources utilization potential compared to benchmark.

3. Results and Discussion

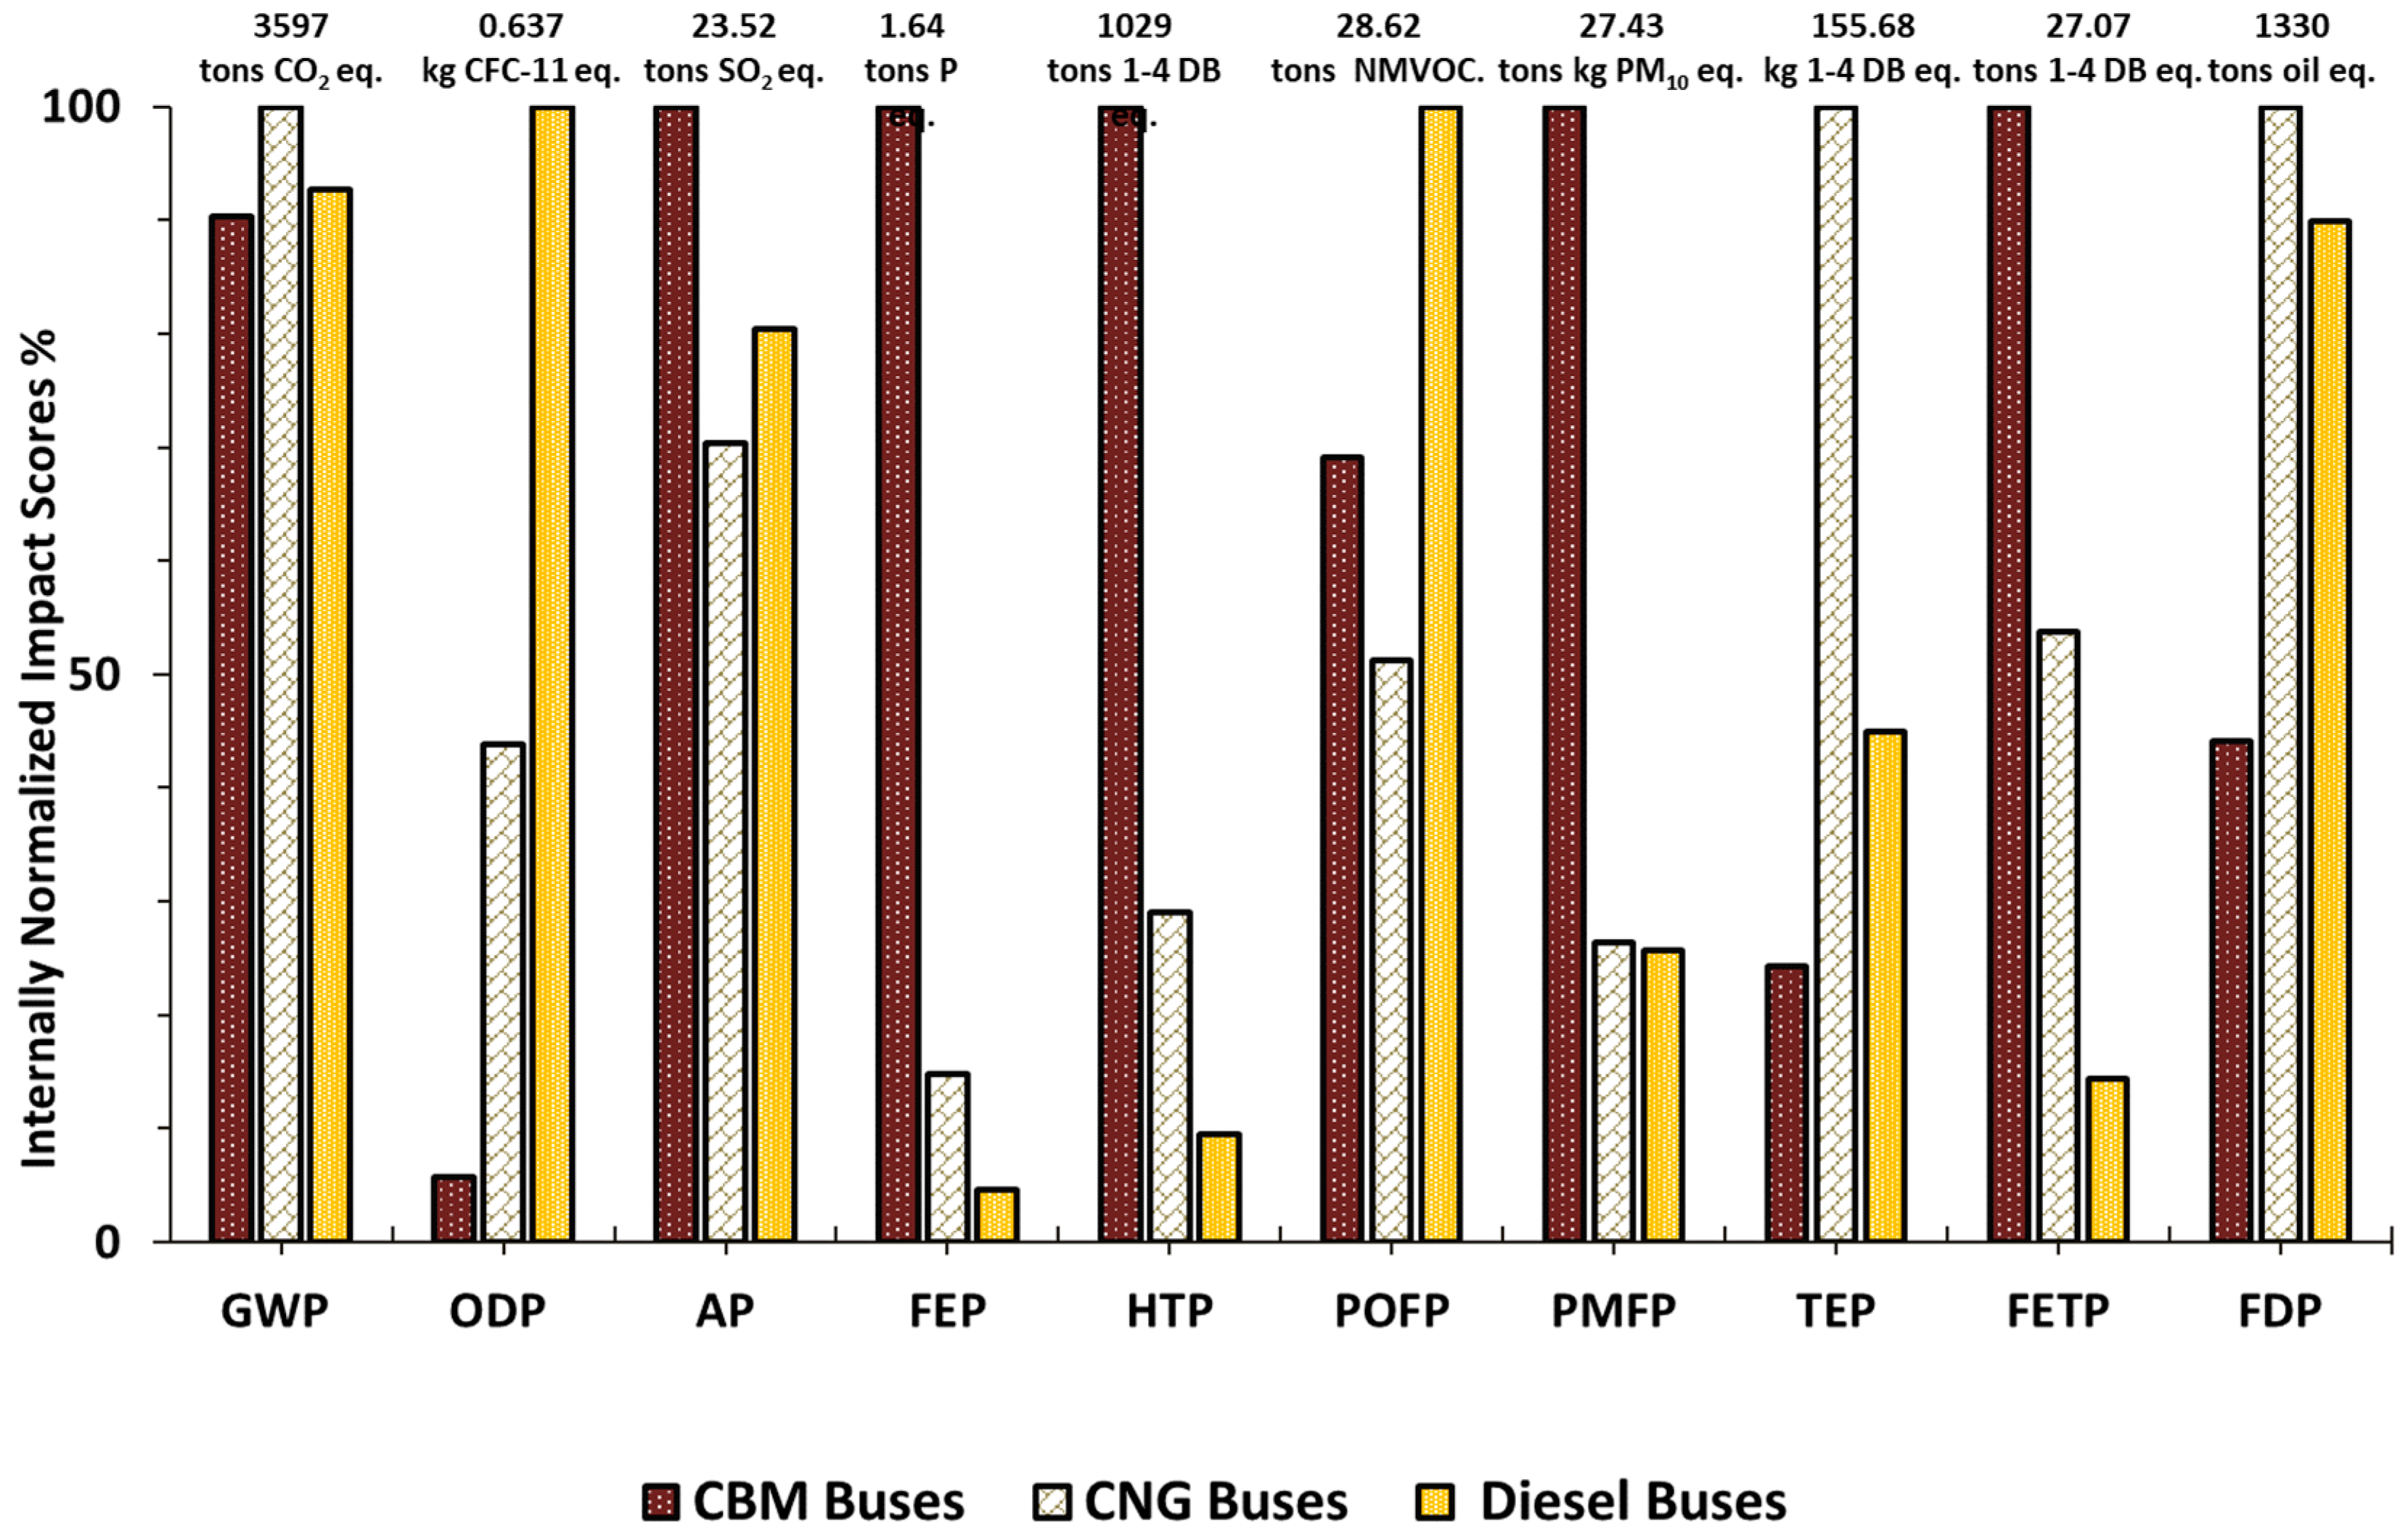
3.1. Baseline Scenario- CBM Versus Diesel and CNG Fuels for City Buses

The environmental performance of distance (in bus-km) driven by CBM fueled city buses in comparison with an equivalent distance driven by diesel and CNG buses per year is shown in Figure 2.
Transit buses operating on CBM exhibit superior environmental performance in all ten impact categories than buses driven on CNG and diesel. CBM fueled buses have 41–98% lower environmental burden in eight impact categories and marginally lower (8%) in POFP when compared to CNG buses. On the other hand, comparison with diesel buses shows that, using CBM as a fuel for operating buses reduces environmental impacts by 49–98% in seven out of ten impact categories except for FEP, FETP and HTP, which shows only 10–19% lower impacts than diesel buses. For TEP impact category, CBM bus system does not impose any burden because of the recycling credit associated with the use of digestate as biofertilizer that avoids production and consumption of inorganic fertilizers.
Importantly, CBM as a transport fuel for buses performs exceptionally well with respect to reducing impacts of trio group (GWP, PMFP and FDP) that is of high relevance to public transportation and its influence on development of sustainable cities. The GWP and PMFP impact of CBM buses is 63–70% and 59–62% lower than their CNG and diesel counterparts. Also, since CBM is produced from a biogenic source the FDP of CBM buses is 88–98% lower than other two fuel options. Interestingly CNG, which is touted as relatively better alternative to diesel for public transportation, has high impact than diesel driven buses in FEP, HTP, TEP and FETP categories. This is due to combination of two things: (a) impact associated with upstream stages, i.e., emissions (mainly bromine) from natural gas processing plants (particularly increases terrestrial ecotoxicity) [50] and use of coal intensive Indian electrical grid mix (mainly contributing to FEP) to meet electricity requirements of gas fueling stations.

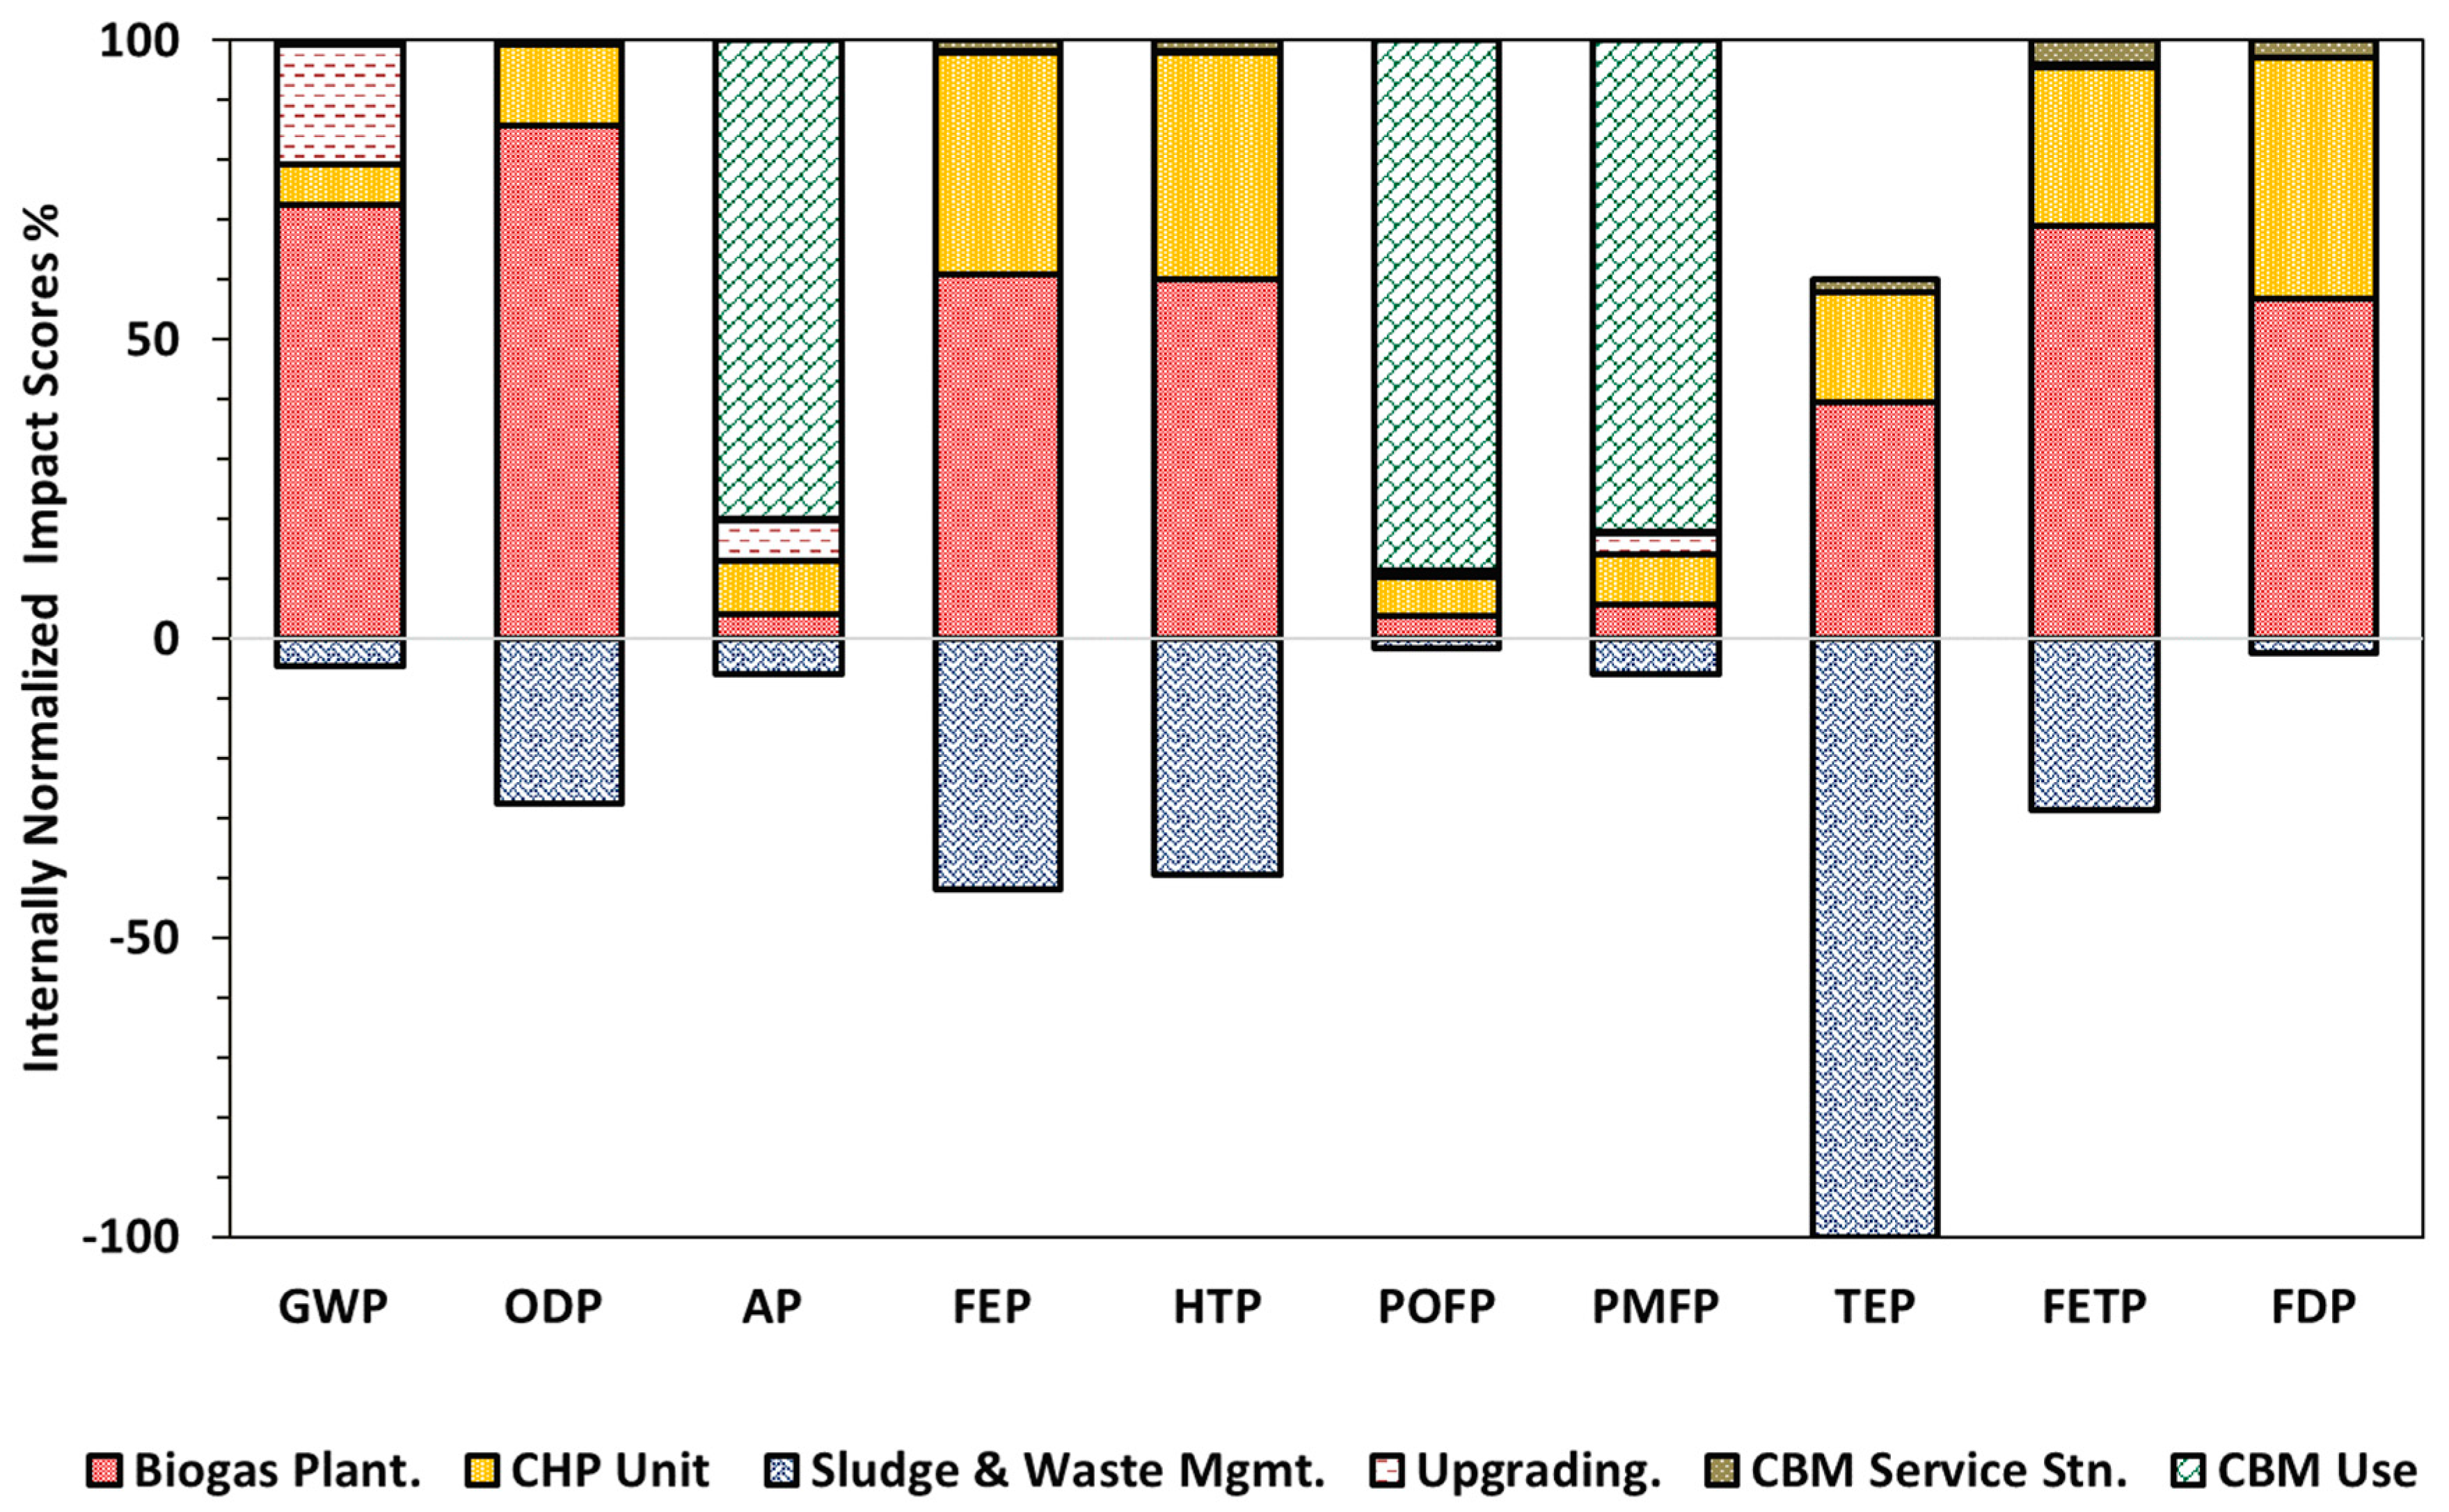
3.2. Contribution Analysis

The contribution analysis showing the environmental impacts of individual stages associated with waste to wheel LCA of CBM buses is shown in Figure 3.
Biogas plant (includes pretreatment of food waste and production of raw biogas by AD) contributes 57–86% of the total impact in GWP, ODP, FEP, HTP, TEP and FETP categories. GWP is mainly driven by methane slip emissions from AD plant whereas the other five impacts are caused by addition of FeCl3 in the digester to inhibit high concentrations of gases such as H2S and NH3. The use stage contributes to high AP, POFP and PMFP impacts (80–89% of total impact). Release of NOx emissions due to combustion of CBM fuel is responsible for AP and POFP impacts whereas particulate matter emissions cause PMFP. However, the absolute scores of these impact categories for CBM buses is much lower than CNG or diesel operating buses.
The sludge and waste management stage (i.e., sludge thickening and drying + disposal of non-biodegradable waste in open dumps) contributes to reduction of ODP, HTP, FEP and FETP impacts by 28–42% and completes negates (100%) the TEP burden imposed by other stages of the life cycle. This is attributed to environmental credits associated with application of digested sludge as biofertilizer. However, open dumping of non-biodegradable waste dilutes the benefits particularly in GWP and FEP impact categories.

3.3. Uncertainty Analysis

The uncertainty analysis results for CBM, CNG and diesel buses is shown in Figure 4.
In spite of varying the key modeling parameters (Table 2) in LCA of three bus systems, one can say with high degree of conformity that GWP, ODP, AP, PMFP, TEP and FDP impacts of CBM buses will always be lower than CNG and diesel buses. In addition, the FEP, HTP and FETP impacts of CBM driven buses are certainly lower than CNG buses and only one impact category POFP lower than diesel buses. However, overlapping is seen between impact scores of CBM and diesel buses for FEP, HTP, and FETP impacts which indicates the sensitiveness of these impacts towards methane losses and/or fuel economy changes. Operation of Biogas plant (consumption of FeCl3) and CHP units (impacts related to infrastructure of CHP) are mainly responsible for FEP, HTP and FETP impacts. Methane losses affects the biogas available for biomethane production and fuel economy of buses influences the yearly distance driven by them. Therefore, changing these model parameters introduces large variation in these three impacts. For CNG and CBM buses overlapping is observed only with respect to POFP impact. The impact is mainly driven by use stage (combustion of CBM or CNG) which is expected to be similar for both systems.

3.4. Scenario Analysis

The results comparing environmental impacts of bus distance driven on CBM obtained from coal intensive Indian electricity grid mix (i.e., a plant meeting its energy needs reliance on Indian electrical grid) is compared with equal distance driven on CNG and diesel buses. The results are shown in Figure 5.
Significant tradeoffs can be expected when electricity to biomethane plant is supplied from an external source, i.e., Indian electrical grid mix and entire biogas produced is upgraded and used as a fuel for buses. CBM buses still performs better than CNG and diesel buses in, ODP, TEP and FDP impact categories and marginally better with respect to reduction of GWP. Also, they have 30% lower POFP than diesel buses. However, on the flip side, increase in AP, FEP, HTP, PMFP and FETP impacts of CBM buses is a tradeoff of using externally sourced power from Indian grid that is anticipated to draw power from a coal intensive electrical grid (60%) [51]. From environmental perspective, coal is known as the worst source of fuel for electricity production since it increases environmental problems like acidification eutrophication, human and freshwater ecotoxicities [52]. Combustion of coal to produce electricity also increases particulate matter emissions. However, since the emission comes from stationery (power plants) sources the environmental externality costs attributed to damage caused to a society are lower than tailpipe emissions resulting from diesel combustion in vehicles [53,54]. Interestingly in spite of methane losses and use of electricity from high carbon intensity electrical grid, CBM buses reduce GHG emissions marginally by 8–10% but can decrease FDP by 46–56% compared to diesel and CNG buses. This can significantly reduce crude oil imports for India. The scenario analysis results suggest that monetary valuation of environmental externalities caused by trio group impacts (GWP, PMFP and FDP) can still be lower than status quo, considering the fact that traffic related particulate matter emissions have high damage costs than power plant emissions [53]. Further, upgrading entire biogas to CBM may be reasonable from a perspective of reducing capital expenditure of an energy self-reliant biomethanation plant i.e., installation of a CHP unit and biogas upgradation plant can be highly capital intensive.

3.5. Social Cost Benefit Analysis (SCBA) Results

SCBA results computed per functional unit for CBM, and BAU scenarios along with detailed supporting calculations are shown in supporting information Section S2. The CBM scenario accounts for its production from energy self-reliant biomethanation plant treating food waste (12,560 tons per year) and its utilization as vehicle fuel to drive transit buses in Mumbai (1408062 bus-km) per year. Correspondingly, BAU scenario represents open dumping of same amount of food waste and driving equal distance with 66% of bus-km attributed to CNG and 34% to diesel.
Private and social costs of CBM scenario (shown in Table S1) are sevenfold higher than BAU. The savings with respect to fuel shift from CNG and diesel to CBM results in a saving of 10.45 million INR (USD 150.46k) per year, out of which 4.27 million INR (USD 61.68k) is saved through avoiding landfilling/open dumping. Above that biomethanation plant receives a revenue from sale of solid digestate as biofertilizer thus making a net savings of 33.56 million INR per year. As anticipated, the social costs of both fuel and open dumping of food waste are high. One important caveat with respect to social costs incurred due to environmental externalities is that the unit prices (damage costs per unit of impact) reflect European conditions and some impacts (e.g., PM10) for Indian society may be even undervalued owing to high population density compared to EU countries.

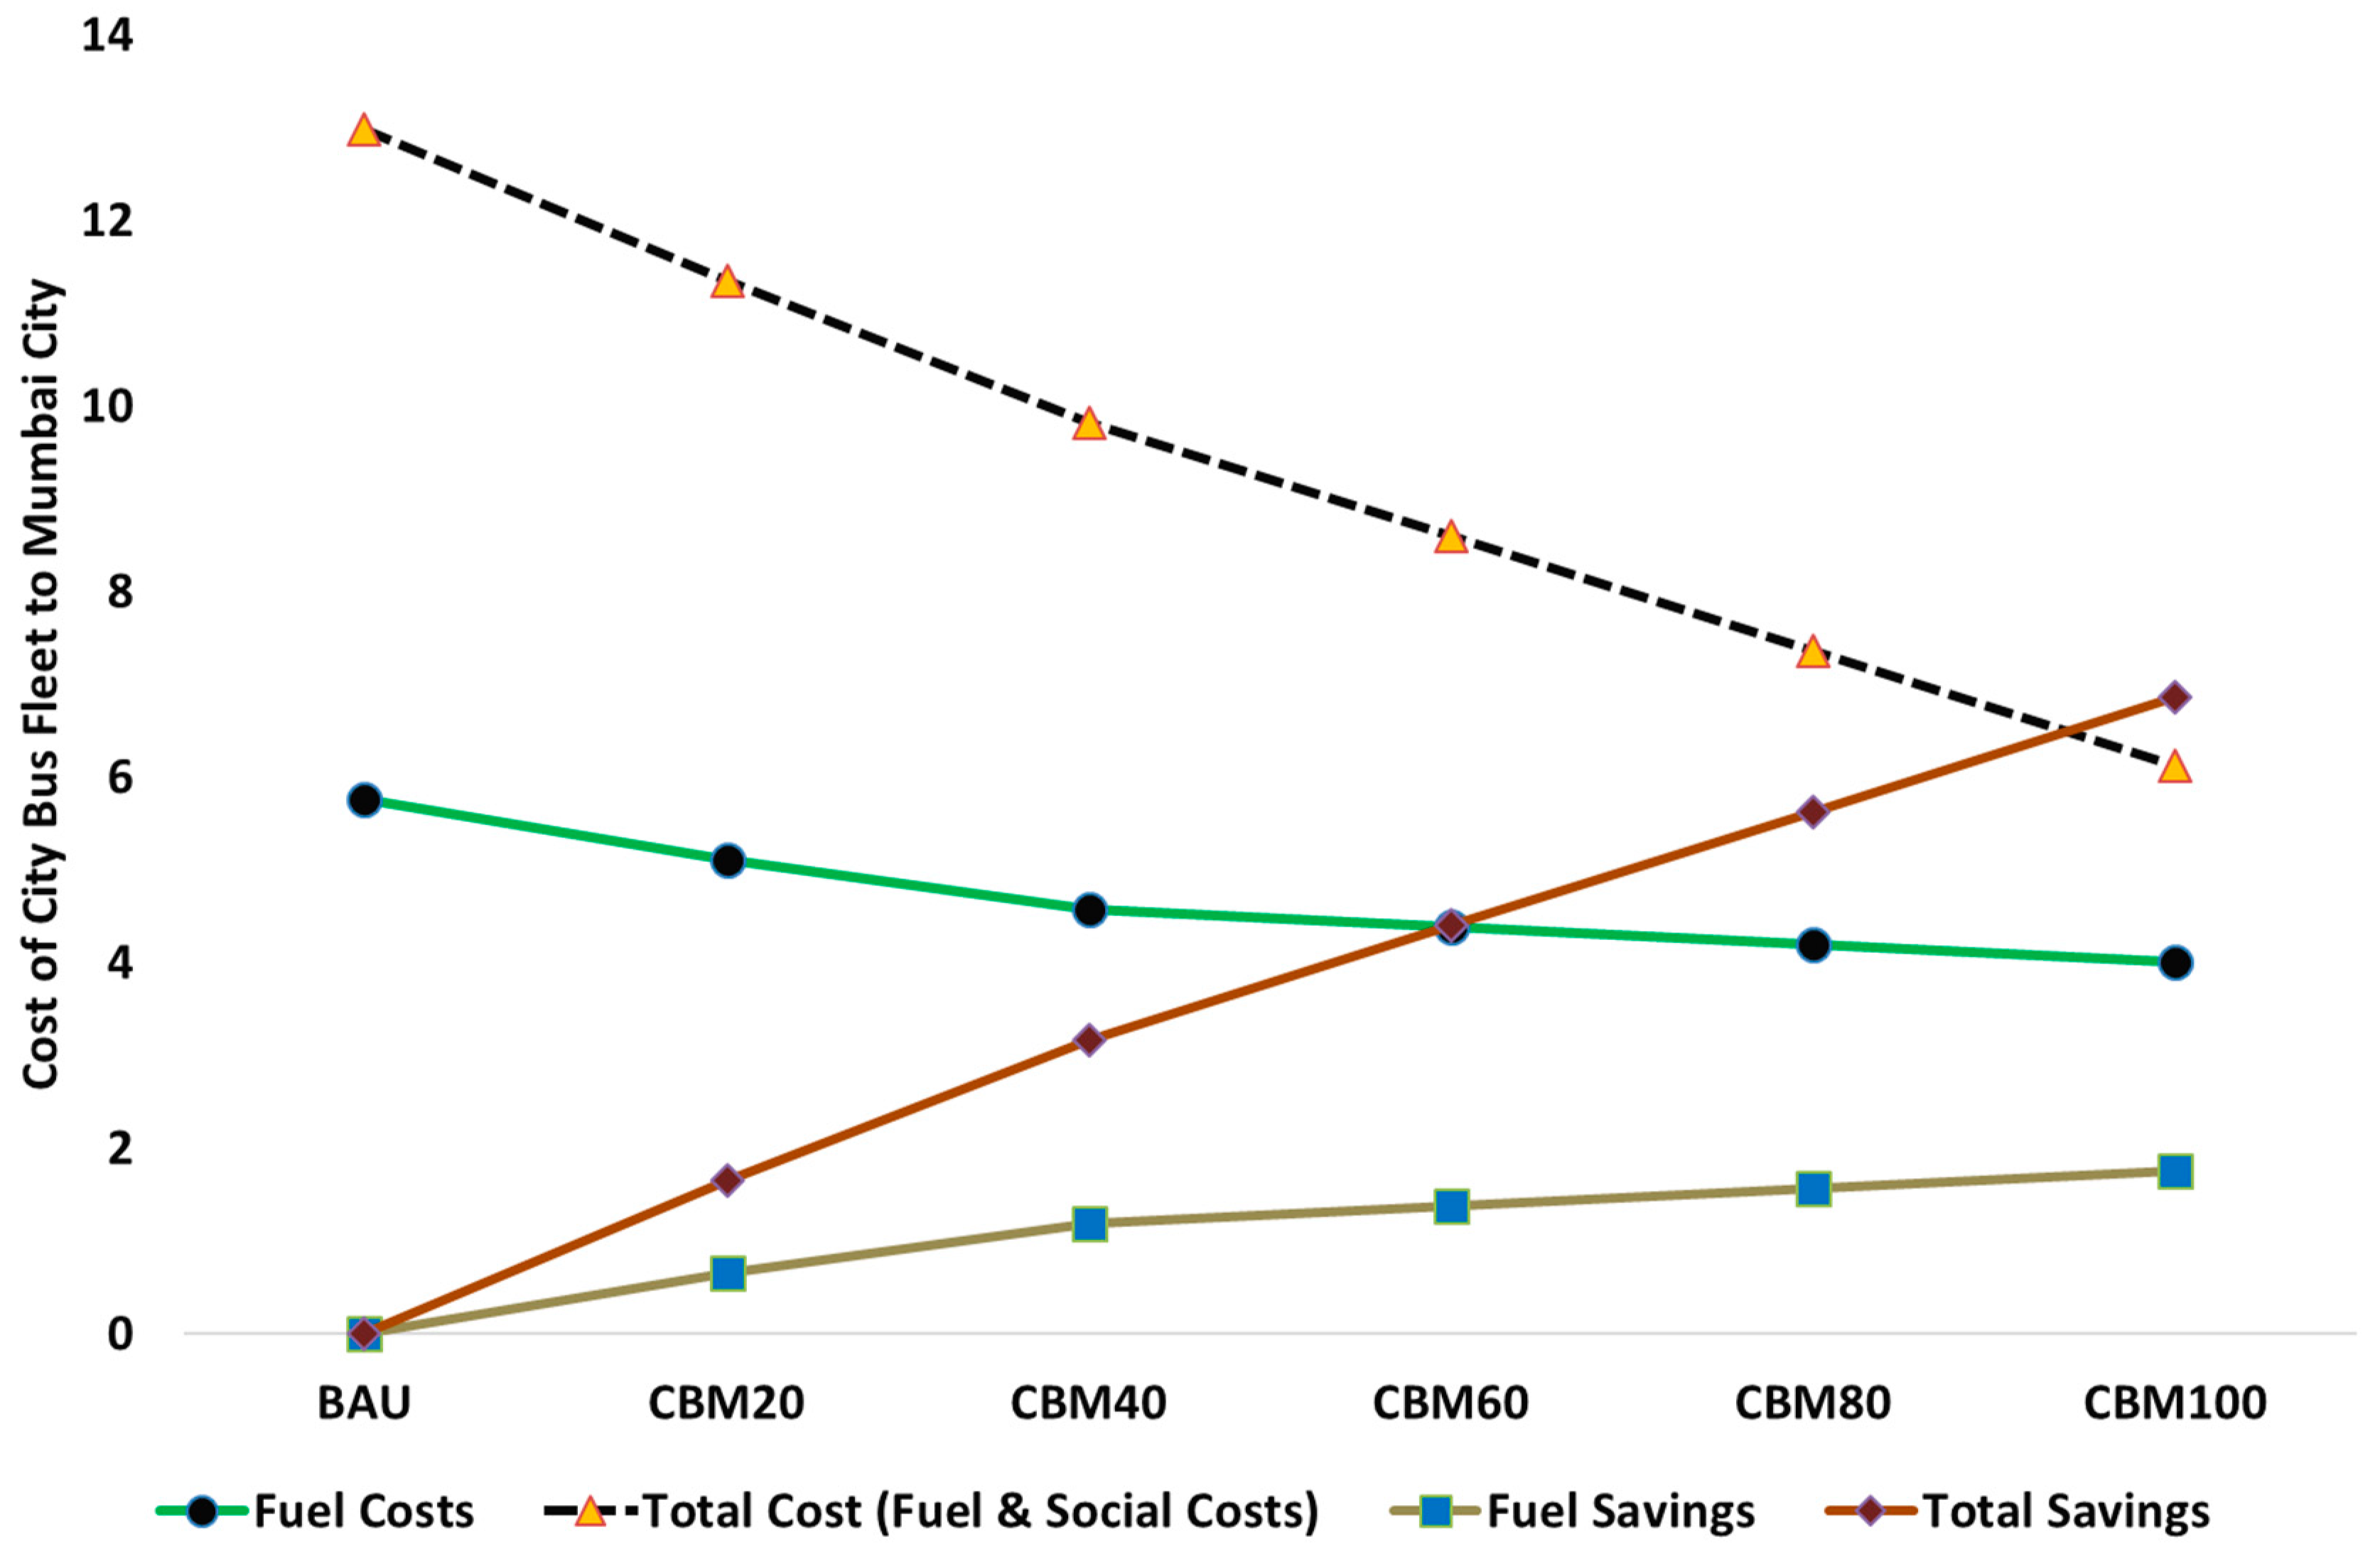
3.6. Marginal Private and Social Costs of Establishing CBM Bus Transportation in Mumbai

Brihanmumbai Electric Supply and Transport (BEST), a public transportation authority of Mumbai, has a fleet of 3775 buses that comprises of 66% CNG and 34% diesel buses [17]. On average, city buses in Mumbai run 170 kilometer per vehicle per day (kpvd) [55]. This amounts to 154,628,600 bus-km driven by 2492 buses on CNG and 79,610,150 bus-km by 1283 buses on diesel per year. The marginal private and social costs of 20%, 40%, 60%, 80 and 100% penetration of CBM operated buses into current city bus fleet of Mumbai is shown in Figure 6.
Addition of CBM buses to Mumbai city bus fleet will significantly reduce, both private (fuel) costs to transport provider as well as social costs incurred by the city due to environmental externalities. For CBM penetration rates of 20–100%, the savings on fuel alone for transport provider range from 0.66–1.76 billion INR (66 to 176 crores) and total savings potential is between 1.64–6.86 billion INR (164–686 crores INR). The biodigestion plant in Skelleftea in Sweden (whose production capaity is used for modeling this LCA study) incurred a capital expenditure close to 1 billion (100 crores) INR [19]. For a perspective, the total savings from 20% CBM penetration rate will suffice to build at least two skelleftea sized plants. The ratio of social costs to private (fuel) costs i.e., cost to society for operating a bus transportation system by the transport provider is 1.25 for BAU and reduces to 0.53 for 100% CBM penetration. Furthermore the savings can be substantial considering avoidance of private and environmental externality costs of open dumping of food waste and revenue generated through sale of biofertilizer.

3.7. Sustainable Value and Social Perspective of CBM as Transport Fuel—Results

The calculations pertaining utilization of CBM as transport fuel with respect to three income group scenarios considered is shown in Table 3. Detailed calculations are shown in supporting information, Section S3.
The PRR and SRR increases in the order of car owner > cab driver > transport provider scenarios. Cleaner transportation fuels such as CBM can maximize both private and sustainable returns when it meets the driving and commuting needs of lower middle class and poor class people in India. For private car owners, the annual savings with respect to earnings (through income) are only 0.9–1.7% as a result of fuel shift made from petrol or diesel to CBM fuel. These savings are relatively insignificant to the upper middle-class population and given their lifestyle, the tendency to spend fuel savings on other priced items may be higher [65]. Also, by taking rebound effects (i.e., social costs saved on one product can increase social costs of another) into consideration, an ambiguity exists on whether reduction in environmental externality costs due to fuel shift is truly realized by a society. On the other hand, cab drivers who earn their living or driving the private returns from diesel to CBM is 20.9%, which is a decent saving with respect to their annual earnings. For CNG to CBM scenario, based on the assumption made (40 INR/kg for CBM and 49.62 INR/kg for CNG), the PRR is 2.9%. However, we believe the incentive for shifting to CBM may not be higher for cab drivers as fuel costs of CBM and CNG may get overlapped in the long run. However, high SRRs, especially from diesel to CBM for cab driver scenario are encouraging, because negative environmental externality costs can be reduced with certainty if CBM based transportation system is institutionalized. This means, a municipality operating biomethanation plant can also generate employment where fuel savings can be incentivized to cab drivers with reduction of social costs as an added benefit.
For a bus transport provider scenario (specific to Mumbai), the PRR derived from making a shift to CBM is 16.8% on single bus [63]. With use of CBM, operating costs can be lowered, and the savings can be applied to further subsidize bus ridership costs. Also, more importantly the SRR is 157% implying that operation of transit buses on diesel and CNG fuel is sustainably inefficient and can be improved significantly with introduction of CBM operated transit buses.

4. Conclusions

In conclusion, large metropolitan cities such as Mumbai in India heavily rely on conventional fuels like CNG and diesel for the operation of transit buses. This reliance not only results in substantial fuel expenses to transport provider but also imposes a substantial financial burden to the entire society due to negative environmental externalities. Replacement of CNG and diesel with cleaner fuels such as CBM for the operation of city buses can reduce both fuel and fuel-related environmental externality costs. The environmental performance of CBM buses, especially in trio group of impacts (GWP, FDP, and PMFP) is 59–98% lower than CNG and diesel buses, which suggests its enormous potential to make Indian cities sustainable. The benefits of food waste treating biomethanation plant are clearly evident from the SCBA study. The marginal private costs of treating 12,560 tons per year of food waste are reduced by 14.722 million INR (USD 213.3k); whereas marginal social savings for avoiding open dumping food waste and reduced externalities attributed to consumption of CNG and diesel for bus operation are close to INR 100 million (USD 14.49 million). Further, a revenue of INR 18.84 million (USD 273k) is obtained from the sale of solid digestate as biofertilizer. However, an important caveat is that the CBM plant has to be energy self-reliant, i.e., it should not rely on coal intensive Indian electrical grid, which otherwise dilutes environmental benefits of replacing diesel or CNG with CBM as a transport fuel for the operation of transit buses. The study also highlights the importance of social utilization perspective of CBM in India, where the choice of public transportation is affected by the economic status of the people. This is because having an environmentally friendly fuel such as CBM does not necessarily contribute to the betterment of a society unless its utilization is targeted to the right class of people.
In recent times, electric transit buses are under active consideration by some cities in India (including Mumbai) and elsewhere in other developing nations as a cleaner alternative to diesel buses [66,67,68]. The move is quite encouraging from the standpoint of improving air quality in urban areas, and the introduction of an electric vehicle fleet does addresses sustainability concerns of public transportation to some extent. However, it does not provide a solution to ever-increasing food waste management crisis faced by cities. With an increase in food waste getting dumped openly or landfilled, the city loses a cheaper source of clean fuel, which can improve the sustainable performance of a city if put to appropriate use. We validated this viewpoint by calculating private and social cost of open dumping of food waste (relevant to all lower-middle-income countries like India) + transit buses driven on different fuels, and anaerobic digestion of food waste + CBM operated buses for the functional unit considered in this study and as shown in Figure 7.
From Figure 7, it is evident that the cost of treating food waste in an AD plant and utilizing CBM to operate transit buses is only 7.5% of open dumping of food waste + electric buses scenario and 12.5–13.6% of open dumping of and diesel and CNG fueled bus scenarios. Electric buses have high environmental externality costs as predicted, which is primarily attributed to a coal intensive Indian electrical grid.
Finally, the key learning from this study is that cities in developing countries need to pursue food waste management and clean public transportation via transit buses, collectively as a single problem. These appear as two separate issues, but they complement each other especially when food waste from the city is subjected to anaerobic digestion and its byproduct, biomethane is used as a transport fuel to improve the sustainable performance of transit bus transportation system. Encouragingly, the government of India has recently announced to install 5000 compressed biogas/biomethane plants by 2023, which will digest a variety of organic substrates, including food waste [69]. These plants are targeted to produce 15 million tons biogas per annum, which is primarily intended to be used as a transport fuel [69]. Thus, the results presented and conclusions drawn by this study are timely and highly valuable to policymakers of India and also in other developing countries where sustainability challenges concerning food waste management and use of conventional fuels for transit buses persist.

Supplementary Materials

The following are available online at https://www.mdpi.com/2071-1050/11/15/4190/s1. “Supporting Information for Social Cost Benefit analysis of Operating Compressed Biomethane (CBM) Transit Buses in Cities of Developing Nations: A Case Study”. The file contains three sections (S1 to S3) and 24 Tables.

Author Contributions

Conceptualization, V.K.K.U.; data curation, A.B.; formal analysis, S.N., D.M.M.Y. and M.T.; funding acquisition, M.T.; investigation, K.S., S.N. and V.K.K.U.; methodology, K.S. and V.K.K.U.; software, K.S. and V.K.K.U.; supervision, V.K.K.U.; validation, A.B., S.N. and V.K.K.U.; writing—original draft, A.B. and V.K.K.U.

Funding

This research was funded by Green Technologies and Environmental Economics (Green TEE) Research Platform at Umea University, Umea, Sweden. The Green TEE platform is a collaborative partnership with Umea University and Umea Municipality to conduct and promote research on sustainable cities.

Acknowledgments

The present work was performed as part of Green Technology and Environmental Economics Research Platform (GreenTEE) at Umeå University. Green TEE is the collaborative interface between municipal companies and academic researchers with a focus to develop technologies and promote policy making studies directed towards improving the sustainable performance of cities. The authors acknowledge support from Green TEE platform for funding this project. Authors also would like to acknowledge support from Khalid Aljubori, Process Engineer at the Biodgestion Facility in Skelleftea city, Sweden for organizing study visits and providing the key data required to perform this study.

Conflicts of Interest

The authors declare no conflict of interest. The funders had no role in the design of the study; in the collection, analyses, or interpretation of data; in the writing of the manuscript, or in the decision to publish the results.

References

  1. United Nations. World Population Projected to Reach 9.8 Billion in 2050 and 11.2 Billion in 2100. 2017. Available online: https://www.un.org/development/desa/en/news/population/world-population-prospects-2017.html (accessed on 25 March 2019).
  2. UNDP. Goal 11: Sustainable Cities and Communities. 2015. Available online: https://www.undp.org/content/undp/en/home/sustainable-development-goals/goal-11-sustainable-cities-and-communities.html (accessed on 18 February 2019).
  3. Kaza, S.; Yao, L.; Bhada-Tata, P.; Van Woerden, F. What a Waste 2.0: A Global Snapshot of Solid Waste Management to 2050; World Bank: Washington, DC, USA, 2108; pp. 1–295. [Google Scholar]
  4. Hanc, A.; Pliva, P. Vermicomposting technology as a tool for nutrient recovery from kitchen bio-waste. J. Mater. Cycles Waste Manag. 2013, 15, 431–439. [Google Scholar] [CrossRef]
  5. Komakech, A.; Zurbrügg, C.; Miito, G.; Wanyama, J.; Vinnerås, B. Environmental impact from vermicomposting of organic waste in Kampala, Uganda. J. Environ. Manag. 2016, 181, 395–402. [Google Scholar] [CrossRef] [PubMed]
  6. Gao, A.; Tian, Z.; Wang, Z.; Wennersten, R.; Sun, Q. Comparison between the Technologies for Food Waste Treatment. Energy Procedia 2017, 105, 3915–3921. [Google Scholar] [CrossRef]
  7. Chiew, Y.L.; Spångberg, J.; Baky, A.; Hansson, P.A.; Jönsson, H. Environmental impact of recycling digested food waste as a fertilizer in agriculture—A case study. Resour. Conserv. Recycl. 2015, 95, 1–14. [Google Scholar] [CrossRef]
  8. Hoornweg, D.; Bhada-Tata, P. What a Waste: A Global Review of Solid Waste Management; World Bank: Washington, DC, USA, 2012; pp. 1–116. [Google Scholar]
  9. Statista. Forecast for Global Number of Transit Buses. 2016. Available online: https://www.statista.com/statistics/577547/forecast-for-global-number-of-transit-buses/ (accessed on 23 July 2019).
  10. Merkisz, J.; Fuć, P.; Lijewski, P.; Pielecha, J. Actual emissions from urban buses powred with diesel and gas engines. Transp. Res. Procedia 2016, 14, 3070–3078.
  11. Ardolino, F.; Parrillo, F.; Arena, U. Biowaste to biomethane or biowaste or energy? An LCA study on anaerobic digestion of organic waste. J. Clean. Prod. 2018, 174, 462–476. [Google Scholar] [CrossRef]
  12. OUAssets, R.P.M.; Tonissoo, T. Feasibility Study on the Introduction and Use of Biogas Buses in the Tartu City; Tartu City Government: Tartu, Estonia, 2102; pp. 1–82.
  13. Madara, K. Potential of Biogas in Urban Buses. In Environmental Engineering; Satakunta University of Applied Sciences: Pori, Finland, 2017; pp. 1–30. [Google Scholar]
  14. Barisa, A.; Dzene, I.; Rosa, M.; Dobraja, K. Waste-to-biomethane Concept Application: A Case Study of Valmiera City in Latvia. Environ. Clim. Technol. 2015, 15, 48–58. [Google Scholar] [CrossRef] [Green Version]
  15. Cucchiella, F.; D’Adamo, I.; Gastaldi, M. Biomethane: A Renewable Resource as Vehicle Fuel. Resources 2017, 6, 58. [Google Scholar] [CrossRef]
  16. CPCB. Trends of Solid Waste Generation in 46 Cities. 2017. Available online: http://cpcb.nic.in/trend-of-solid-waste-generation-in-46-cities/ (accessed on 18 February 2019).
  17. MCGM. Brihanmumbai: Environmental Status Report; Municipal Corporation of Greater Mumbai: Mumbai, India, 2017; pp. 1–100.
  18. SGC. Basic Data on Biogas; Swedish Gas Technology Cenrte Ltd.: Malmo, Sweden, 2012; pp. 1–29. [Google Scholar]
  19. Burstrom, O. The Skelleftea Biogas Plant; Skelleftea Municipality: Skelleftea, Sweden, 2014; pp. 1–19. [Google Scholar]
  20. Skelleftea, K. Producer of the Cleanest Propellant in the World; Skelleftea Kummuni: Skellftea, Sweden, 2014; pp. 1–4. [Google Scholar]
  21. DownToEarth. In Depth, the Meat You Eat. 2019. Available online: https://www.downtoearth.org.in/indepth/the-meat-you-eat-13283 (accessed on 19 February 2019).
  22. PTI. Ensure Action Against Illegal Slaughterhouses, Bombay High Court to Maharashtra Government. 2018. Available online: https://www.freepressjournal.in/mumbai/ensure-action-against-illegal-slaughterhouses-bombay-high-court-to-maharashtra-government/1371649 (accessed on 19 February 2019).
  23. Bakhiet, O.; Mustafa, R. Biogas production in Abu Dhabi—An evaluation based on energy and economy (Comparison of two plant designs). In Civil Engineering and Urban Management; KTH: Stockhold, Sweden, 2016; pp. 1–48. [Google Scholar]
  24. Kuo, J.; Dow, J. Biogas production from anaerobic digestion of food waste and relevant air quality implications. J. Air Waste Manag. Assoc. 2017, 67, 1000–1011. [Google Scholar] [CrossRef] [PubMed]
  25. Whiting, A.; Azapagic, A. Life cycle environmental impacts of generating electricity and heat from biogas produced by anaerobic digestion. Energy 2014, 70, 181–193. [Google Scholar] [CrossRef]
  26. DTI. Overview of Biogas Tehnologies for Production of Liquid Transport Fuels; Danish Technological Institute: Aarhus, Denmark, 2102; pp. 1–25. [Google Scholar]
  27. Ji, X.; Xie, Y.; Ma, C. Techno-Economic Analysis of Biomethane Production with Novel Upgrading Technology; The Swedish Knowledge Centre for Renewable Transportation Fuels: Stockholm, Sweden, 2016; pp. 1–34. [Google Scholar]
  28. Lems, R.; Langerak, J.; Dirkse, E.H.M. Next Generation Biogas Upgrading Using Highly Selective Gas Separation Membranes; DMT Environmental Technology: Joure, The Netherlands, 2012; pp. 1–9. [Google Scholar]
  29. Ecoinvent. Ecoinvent Database V3.2. 2015. Available online: http://www.ecoinvent.org/database/ecoinvent-32/ecoinvent-32.html (accessed on 20 July 2019).
  30. AnaerobicDigestion. Biogas. 2019. Available online: http://www.biogas-info.co.uk/about/biogas/ (accessed on 19 February 2019).
  31. CE523. Module 8 Sludge Processing and Disposal; Iowa State University: Ames, IA, USA, 2011. [Google Scholar]
  32. Cheng, J.Y.K.; Chiu, S.L.H.; Lo, I.M.C. Effects of moisture content of food waste on residue separation, larval growth and larval survival in blak soldier fly bioconversion. Waste Manag. 2017, 67, 315–323. [Google Scholar] [CrossRef] [PubMed]
  33. Holmgren, M.A.; Hansen, M.N.; Reinelt, T.; Westerkamp, T.; Jørgensen, L.; Scheutz, C.; Delre, A. Measurements of the Methane Emissions from Biogas Production: 2015–158; Energiforsk: Stockholm, Sweden, 2015; pp. 1–192. [Google Scholar]
  34. Michael, A.; Charlotte, S. Total methane loss from biogas plants, determined by tracer dispersion measurements. In Proceedings Sardinia; Margherita di Pula: Cagliari, Italy, 2017. [Google Scholar]
  35. SNFFloerger. Sludge Dewatering; SNF Floerger: Cedex, France, 2003. [Google Scholar]
  36. Joelsson, Y.; Lord, R. Urban Solid Waste Management in Mumbai: Current Challenges and Future Solutions for Urban Development in Energy and Environment; JTH: Stockholm, Sweden, 2016; pp. 1–43. [Google Scholar]
  37. Goldmann, M. Biogas Buses: A Cost Estimate; Danninco: Uppsala, Sweden, 2013; pp. 1–20. [Google Scholar]
  38. Nurhadi, L.; Borén, S.; Ny, H. Advancing from Efficiency to Sustainability in Swedish Medium-sized Cities: An Approach for Recommending Powertrains and Energy Carriers for Public Bus Transport Systems. Procedia Soc. Behav. Sci. 2014, 111, 586–595. [Google Scholar] [CrossRef] [Green Version]
  39. Civitas. Smart Choices for Cities: Clean Buses for Your City; Civitas: Brussels, Belgium, 2013; pp. 1–60. [Google Scholar]
  40. Kollamthodi, S.; Norris, J.; Dun, C.; Brannigan, C.; Twisse, F.; Beidka, M.; Bates, J. The Role of Natural Gas and Biomethane in the Transport Sector: ED 61479; Ricardo Energy and Environment: Didcot, UK, 2016; pp. 1–85. [Google Scholar]
  41. Cooper, E.; Arioli, M.; Carrigan, A.; Jain, U. Exhaust Emissions of Transit Buses. In Sustainable Urban Transportation Fuels and Vehicles; EMBARQ: Washington, DC, USA, 2012; pp. 1–27. [Google Scholar]
  42. Pre. SimaPro PhD. 2017. Available online: https://simapro.com/licences/phd/ (accessed on 6 February 2019).
  43. Mehta, Y.D.; Shastri, Y.; Joseph, B. Economic analysis and life cycle impact assessment of municipal solid waste (MSW) disposal: A case study of Mumbai, India. Waste Manag. Res. 2018, 36, 1177–1189. [Google Scholar] [CrossRef] [PubMed]
  44. Saheri, S.; Mir, M.A.; Basri, N.E.A.; Mahmood, N.Z.; Begum, R.A. Life cycle assessment for solid waste disposaloptions in Malaysia. Pol. J. Environ. Stud. 2012, 21, 1377–1382. [Google Scholar]
  45. Recipe. 2011. Available online: http://www.rivm.nl/en/Topics/L/Life_Cycle_Assessment_LCA/ReCiPe (accessed on 21 October 2017).
  46. Yang, L.; Zhang, S.; Wu, Y.; Chen, Q.; Niu, T.; Huang, X.; Zhang, S.; Zhang, L.; Zhou, Y.; Hao, J. Evaluating real world CO2 and NOx emissions for public transit buses using a remote wireless on board diagnostic (OBD) approach. Environ. Pollut. 2016, 218, 453–462. [Google Scholar] [CrossRef] [PubMed]
  47. MyIndiaMake. What Income Defines Upper, Middle and Rich Classes in India. 2017. Available online: https://myindiamake.com/2017/07/26/what-incomes-define-upper-middle-and-rich-classes-in-india/ (accessed on 19 February 2017).
  48. Indeed. How Much Does a Taxi Driver Make in India. 2019. Available online: https://www.indeed.co.in/salaries/Taxi-Driver-Salaries (accessed on 27 February 2017).
  49. Figge, F.; Barkemeyer, R.; Hahn, T.; Liesen, A. The Advance Guide to Sustainable Value Calculations: A Practitioner Handbook on the Applications of the Sustainable Value Approach: ENV/UK/000815; ADVNACE: Forres, UK, 2006; pp. 1–30. [Google Scholar]
  50. Dai, W. Life cycle assessment of natiral gas powered mobility options. Energy Fuels 2014, 28, 5988–5997. [Google Scholar] [CrossRef]
  51. IEA. Indian Energy Outlook; International Energy Agency: Paris, France, 2015; pp. 1–191. [Google Scholar]
  52. Atilgan, B.; Azapagic, A. Assessing the environmental sustainability of electricity generation in Turkey on a life cycle basis. Energies 2016, 9, 1–24. [Google Scholar] [CrossRef]
  53. Bruyn, S. Environmental Prices Handbook 2017: Methods and Numbers for Valuation of Environmental Impacst; CE Delft: Delft, The Netherlands, 2018; pp. 1–177. [Google Scholar]
  54. Guevara, M. Emissions of primary particulate matter. In Airborne Particulate Matter: Sources, Atmospheric Processes and Health; Royal Society of Chemistry: London, UK, 2016; pp. 1–34. [Google Scholar]
  55. HindustanTimes. Mumbai’s BEST’s Ticket Revenue Down by 117 Crore in 2017–2018. 2018. Available online: https://www.hindustantimes.com/mumbai-news/mumbai-best-s-ticket-revenue-down-by-117-crore-in-2017-18/story-TyiB6mPrjsMjrNybX0urBN.html (accessed on 5 March 2019).
  56. Roy, N.S. IIT Delhi Biogas Passenger Carwith Fuel Mileage of 24.11 km(kg). 2014. Available online: https://www.rushlane.com/iit-delhi-biogas-passenger-car-with-fuel-mileage-of-24-11-kmkg-12108921.html (accessed on 5 March 2019).
  57. Thakur, S. List of CNG Cars Sold in India. 2018. Available online: https://www.msn.com/en-in/autos/news/list-of-cng-cars-sold-in-india/ar-BBP8Ice (accessed on 5 March 2019).
  58. Harsha, D.N. Planning and design for ommercialization of biogas bottling plant for production of green and low cost fuel with utilization of biomass resources. Int. J. Sci. Eng. Res. 2015, 6, 1297–1300. [Google Scholar]
  59. DailyHunt. Petrol-Diesel Gets Cheaper on Friday, Know What is the Price in Metro Cities Today. 2019. Available online: https://m.dailyhunt.in/news/india/english/news+crab-epaper-newcrb/petrol+diesel+gets+cheaper+on+friday+know+what+is+the+price+in+metro+cities+today-newsid-105481475 (accessed on 5 March 2019).
  60. Goel, R.; Mohan, D.; Guttikunda, S.K.; Tiwari, G. Assessment of motor vehicle use characteristics in three indian cities. Transp. Res. Part D Transp. Environ. 2015, 44, 254–265. [Google Scholar] [CrossRef]
  61. Statista. Average Annual Mileage of Passenger Cars in India as of December 2014 (in Kilometers). 2014. Available online: https://www.statista.com/statistics/611800/passenger-passenger-car-annual-mileage/ (accessed on 5 March 2019).
  62. Singh, K. Ola and Uber Drivers are Paying the Price for India’s Rising Fuel Cost. 2018. Available online: https://qz.com/india/1385653/uber-ola-drivers-pay-the-price-for-indias-fuel-price-rise/ (accessed on 5 March 2019).
  63. Sen, S. BEST Daily Earnings Up by Rs 25 Lakh, Passengers by 2 Lakh. 2017. Available online: https://timesofindia.indiatimes.com/city/mumbai/best-daily-earnings-up-by-rs25l-passengers-by-2l/articleshow/61921897.cms (accessed on 5 March 2019).
  64. FinancialExpress. Five Reasons Why Delhi Overtook Mumbai to Become India’s Economic Capital. 2016. Available online: https://www.financialexpress.com/economy/five-reasons-why-delhi-overtook-mumbai-to-become-indias-economic-capital/457977/ (accessed on 5 March 2019).
  65. BWFA. Savings on Gas Not Benefiting Retail Sales. 2015. Available online: https://www.bwfa.com/articles/savings-on-gas-not-benefiting-retail-sales/ (accessed on 5 March 2019).
  66. UNEP. Electric Buses: Tackling Urban Air Quality Improvement with Zero Emission Buses. 2018. Available online: http://www.unenvironment.org/explore-tpoics/transport/what-we-do/electric-mobility/electric-buses (accessed on 23 July 2019).
  67. News18. All the Cities in India with Electric Bus Service-Lucknow, Hyderabad, Sabarimala and More. 2019. Available online: https://www.news18.com/news/auto/hyderabad-telangana-andhra-lucknow-sabarimala-delhi-all-the-cities-in-india-to-get-electric-bus-service-2033459.html (accessed on 23 July 2019).
  68. Aklekar, R.B. Mumbai: BEST to Start 80 New Electric Buses. 2019. Available online: https://www.mid-day.com/articles/mumbai-best-to-start-80-new-electric-buses/20754156 (accessed on 23 July 2019).
  69. BusinessToday. 5000 Compressed Biogas Plants Will Be Set Up by 2023, Says Dharmendra Pradhan. 2019. Available online: https://www.businesstoday.in/top-story/5000-compressed-bio-gas-plants-will-be-set-up-by-2023-says-dharmendra-pradhan/story/301346.html (accessed on 18 February 2019).
Figure 1. System boundary showing key life cycle stages of a compressed biomethane (CBM) fueled bus, where CBM is obtained from an energy self-sustained biomethanation plant.
Sustainability 11 04190 g001
Figure 2. Environmental performance comparison of driving transit buses on CBM, CNG and Diesel fuels in Mumbai City (1408062 bus-km/year = functional unit).
Sustainability 11 04190 g002
Figure 3. Contribution analysis of various life cycle stages of food waste to CBM buses.
Sustainability 11 04190 g003
Figure 4. Uncertainty analysis results of CBM, CNG, and diesel bus systems.
Sustainability 11 04190 g004
Figure 5. Environmental performance of driving transit buses on CBM (with CBM plant operating on external power) in comparison with CNG and diesel fuels in Mumbai city.
Sustainability 11 04190 g005
Figure 6. Fuel cost and savings to transport provider, total costs and savings (fuel and social costs due to environmental externalities) per year to society for different penetration rates of CBM buses in Mumbai bus fleet.
Sustainability 11 04190 g006
Figure 7. Private and social costs per functional unit for four scenarios (a) open dumping of food waste (13,505 tons/year)(OD) + transit buses driven on diesel; (b) OD + CNG; (c) OD + Electric buses; and (d) food waste treated in an AD plant + CBM driven buses (details of calculations shown in supporting information).
Sustainability 11 04190 g007
Table 1. Key LCI data of well-to-wheel LCA of CBM buses.
ParameterAmountNotes
Annual biogas production2,260,800 Nm3/year12,560 tons (13,505 tons–7% waste rejects) of digestible food waste/year producing at 180 Nm3 per ton
Plant’s Electricity consumption1922 MWh(Biogas capacity Nm3/year) × 0.85 KWh/Nm3
Biogas Combusted in CHP to meet plant’s electricity needs960,840 Nm3At 2 KWh/Nm3 biogas combusted
Biogas Available for CBM Production1,299,960 Nm3
Methane Content of biogas63%
CBM from Residual biogas818,975 Nm3/year
Biomethane lost due to slip emissions16,380 Nm3/year2% of total CBM production.
Biomethane available for fueling buses802,596 Nm3/yearAfter discounting methane losses
Fuel economy of CBM bus0.57 Nm3/kmLiterature specified value
Distance in bus-km from CBM produced by plant1,408,062 bus-km/year
Dried Sludge (Compost) from AD Unit1884 tons per year15% of waste received
Biowaste from reject stream composted803.25 tons per yearNo processing burdens accounted, and no fertilizer value credit taken
Non-Biodegradable waste of reject stream open dumped141.75 tons per year
Table 2. Variation of key modeling parameters for uncertainty analysis.
ParameterRange VariedNotes
Methane slip emissions2–4% of CBM producedBased on minimum and maximum slip emissions for AD and upgrading units [26,33,34]. This results in variation in bus-km from 1,213,297 to 1,257,997 bus-km (Same range considered for CNG and diesel buses).
Fuel economy0.48–0.6 Nm3/kmBaseline considered 0.57 Nm3/km of CBM and CNG buses
Tailpipe emissionsCO- 0.36–3.00 g/km (Diesel); 0.4–1.5 g/km (CNG); CO2- 700–1200 g/km (Diesel and CNG buses); NOx: 6–11 g/km (Diesel); 0.5–6.5 g/km (CNG and CBM); PM 0.1–0.5 g/km (Diesel); 0–0.03 g/km (CBM and CNG)Based on driving cycle and actual emission studies [10,39,41,46].
Table 3. Social utilization perspective of CBM utilization as transportation fuel.
ParameterCar Owner
(Per Car)
Cab Driver
(Per Car)
Transport Provider
(Per Bus)
CBMPetrolDieselCBMCNGDieselCBMBAU
Fuel Economy
(kg/km) (a)
0.0410.0490.0410.0410.0380.0410.420.4104
Unit Fuel Cost
(INR/kg) (b)
4010082.54049.682.514060.79
Distance (c)8000 km36,000 km62,050 bus km
Fuel Cons (kg)32839232814761368147626,06125,465
Fuel Cost (INR)13,12039,44027,06059,04067,853121,7851,042,4401,548,017
Social Cost (INR) (d)273021,83326,07312,28567,435117,326563,3801,913,987
Total Costs (INR)15,85061,27353,13371,325135,288362,7111,605,8203,462,024
Earnings (e)1.50.33
GDP (PPP) per Capita (f)1.1811.1811.181
PRR0.017 (Petrol to CBM)
0.009 (Diesel to CBM)
0.029 (CNG to CBM)
0.209 (Diesel to CBM)
0.168
SRR0.038 (Petrol to CBM)
0.031 (Diesel to CBM)
0.054 (CNG to CBM)
0.246 (Diesel to CBM)
1.570
(a) Fuel consumption of cars: CBM = 0.0414 kg/km (24.11/km) [56]; Petrol = 0.0495 kg/km (at 0.066 l/km (15 km/l) and 0.75 kg/l density); Diesel = 0.0416 kg/km (at 0.05 l/km (20 km/l) and 0.832 kg/l density); and CNG = 0.038 kg/km (26 km/kg based on average fuel economy of CNG cars) [57]. Fuel consumption of buses: CBM = 0.427 kg/km (0.57 Nm3/km) [37,38]; BAU = 0.4104 kg/km (=0.427 kg/km of CNG buses × 0.66 + 0.3748 kg/km diesel buses × 0.34). (b) Fuel Cost: CBM = 40 INR/kg [58]; CNG = 49.62 INR/kg; Petrol = 75 INR/l (100 INR/kg) and Diesel = 68.65 INR/l (82.51 INR/kg) [59]. (c) Annual Distance: Car owner = 8000 km [60,61]; Cab driver = 36,500 km (average distance driven by cab driver in a year) [62]; buses = 62,050 bus km (170 kpvd [55] × 365 days). (d) Social costs (environmental externality costs) are calculated by obtaining process from environmental prices handbook [53]. (e) Earnings: Car owner scenario- Average earnings of upper middle class with affordability to own a private car ranges from 1.2–2.4 million INR per year and for our calculations 1.5 million INR is considered; Cab drivers income ranges from 0.18–4.5 million INR per annum [47] Our study considered 0.3 million INR; Transport Provider- Daily earnings on of transport provider in Mumbai (BEST) = 30 million INR [63]. With total of 3775 buses in operation this amounts to 2.9 million per bus per year. (f) GDP (PPP) per capita of Mumbai = 16,881 USD (1,181,670 INR at 70 rupees per USD) [64].

