1. Introduction
The environment is considered a basic public good or service [
1]. With the continuous development of the economy and the improvement of living conditions, people’s requirements for the quality of the ecological environment have also been increasing. However, China’s environmental quality still faces challenges at present. According to the 2018 Environmental Performance Index report (the 2018 Environmental Performance Index (EPI) ranks 180 countries for 24 performance indicators across 10 issue categories covering environmental health and ecosystem vitality. Please see
https://epi.envirocenter.yale.edu/node/36476 for more information), China ranked 120th with a total EPI score of 50.74 (the maximum score is 100; for more details, please see
https://epi.envirocenter.yale.edu/sites/default/files/2018-chn.pdf). The success of environmental governance policies is based on broad public support [
2], because environmental governance requires close cooperation between the government and the public. If the public is not satisfied with the government’s environmental public service policy, the implementation of the policies will be affected. Thus, understanding the public’s environmental public service satisfaction could support the development of environmental policies that respond to public needs and gain public support.
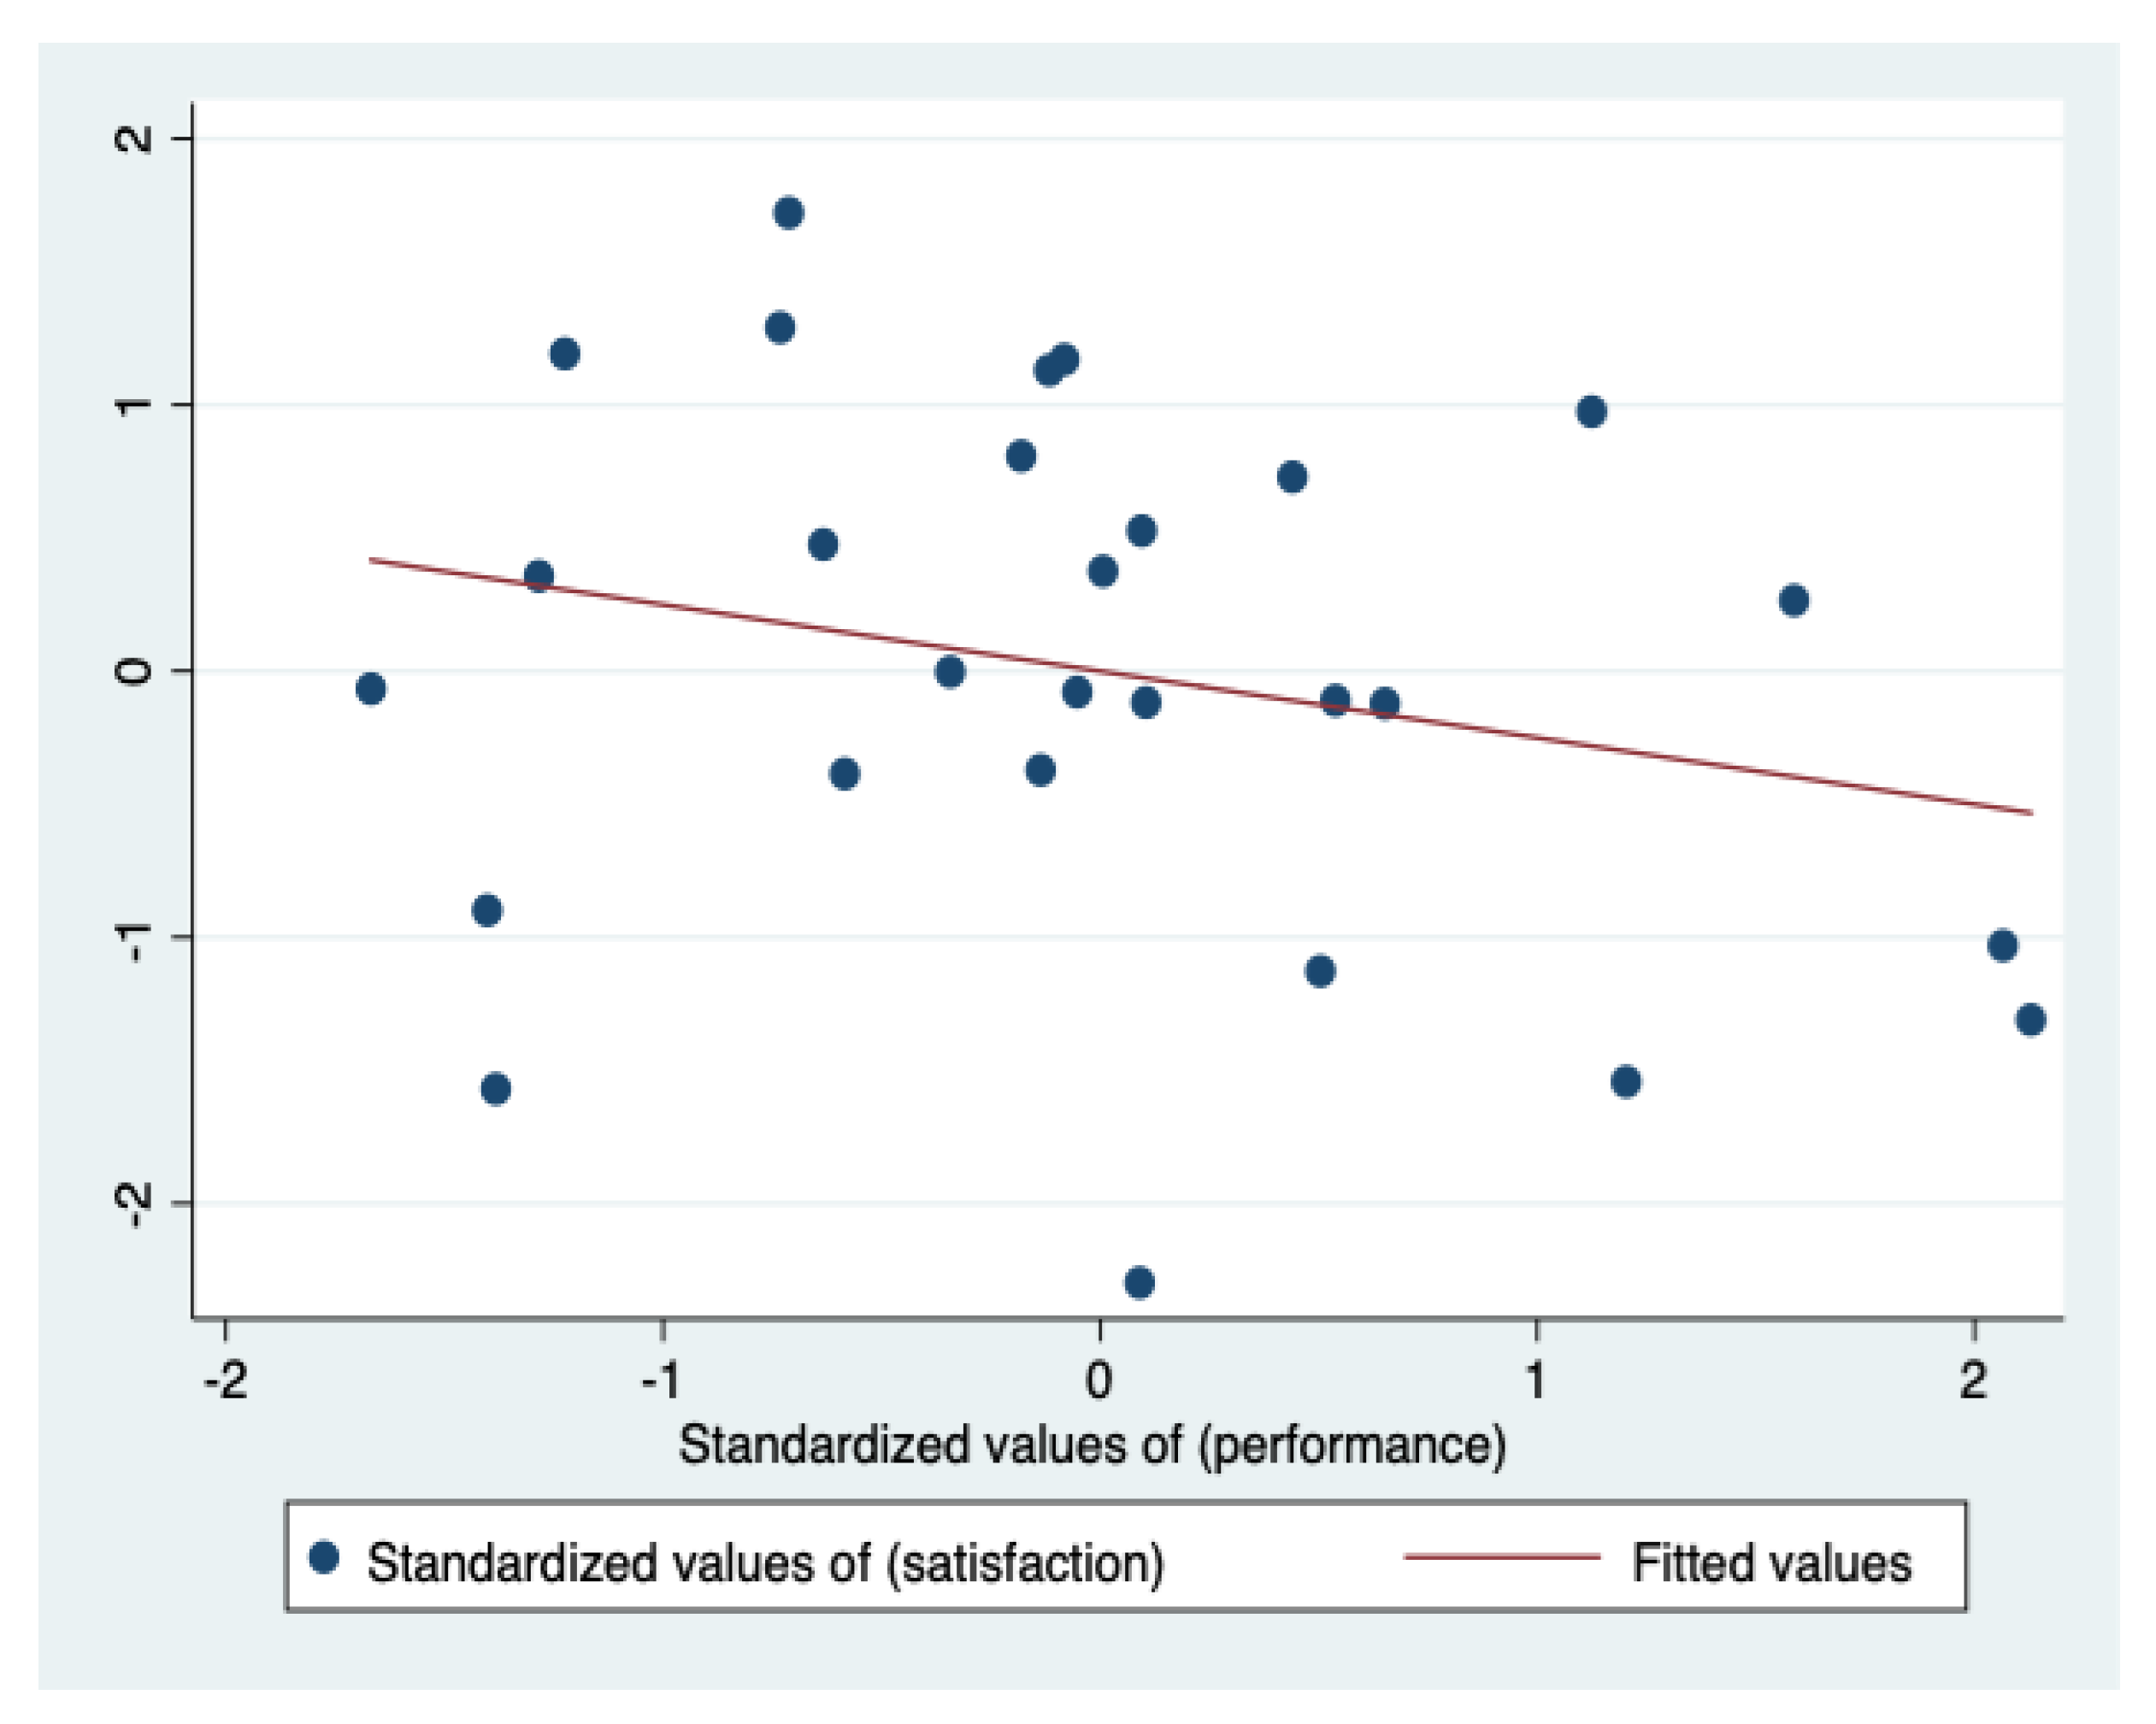
Generally, the government’s improvement of environmental public service performance is thought to naturally improve public satisfaction, but data analysis shows that this is not the case. The 2016 Annual Evaluation Results of Ecological Civilization Construction in China (the data can be accessed at
http://www.stats.gov.cn/tjsj/zxfb/201712/t20171226_1566827.html) assessed the performance of ecological civilization construction in various provinces across the country using the resource utilization index, the environmental governance index, the environmental quality index, the ecological protection index, the growth quality index, and the green living index and comprehensively evaluated the green development index of each province based on these six indicators. However, these data are inconsistent with the average public environmental service satisfaction measured according to the CGSS2015 data. Higher environmental governance performance does not lead to higher public satisfaction but produces the opposite result (see
Figure 1). Why was this the case? Although part of this finding may be due to differences in the information received by the public in different regions, the gap between the actual environmental performance and public satisfaction makes us wonder what is actually affecting the public’s satisfaction with the government’s environmental public services.
This paper argues that media use plays a significant role in citizens’ evaluation of government environmental public services. We believe that the media are shaping the public’s perception of government’s environmental services. This paper focuses on the impacts of the uses of two different media, traditional media and new media, on public satisfaction with the government’s environment services. Traditional media forms include newspapers, magazines, radio and television, while new media forms include the Internet and mobile phone subscription messages, and such classifications have been widely used [
3,
4]. We pay attention to the difference between the traditional media and the new media in influencing the public’s evaluation of the government’s environmental public services because, in the context of China, the discourse structures of these two types of media are quite different when they report on issues related to the government’s environmental public services. How the two types of media encapsulate information—i.e., the choice of environmental issues, the expression of the discourse and the kind of narration—would affect the public’s perception of government environmental services, which we will continue to elaborate upon below. In addition, this study further explores the mechanism between media use and environmental public service satisfaction through a mediation effect test. The paper is structured as follows:
Section 2 contains a brief review of the literature on media use and environmental public service satisfaction, and on this basis, the research hypotheses are proposed.
Section 3 introduces the data source and variable design regarding the impact of media use on environmental public service satisfaction.
Section 4 presents the empirical analysis results, and the final section concludes the paper.
2. Research Theory and Hypotheses
The functions of the media in influencing public attitudes have been studied from the three theoretical perspectives of gatekeeping, agenda setting and framing. Media gatekeeping theory has now gained broad acceptance across the field of mass communication study and has contributed to the development of many key mass communication theories, such as agenda setting theory and media framing theory [
5]. Moreover, it continues to improve these two theories in the Internet era [
6].
Media gatekeeping theory refers to the control of news and information as it passes through a gate with a gatekeeper, who decide what news and information can be let through or kept out [
7,
8]. It emphasizes that media information differs from the real world through the content selection mechanism employed by the media [
9], and the media’s information selection affects the audience’s information reception accordingly [
9]. Although the media’s gatekeeping function has been widely recognized and considered to be of great relevance to public attitudes in the previous literature, there is a view arguing that different types of media might differ in the application of their gatekeeping function: while traditional media, especially print and broadcast media, tend to publish content deemed appropriate through content selection, new Internet media platforms filter information to a lesser extent [
10]. According to this view, Internet users may have access to a wider range of information than traditional media users.
Agenda setting theory is another theory mainly focusing on media function. The theory indicates that media can help decide the saliency of news and information based on what the media choose to emphasize or neglect. In 1972, McCombs and Shaw put forward the agenda setting theory of mass media [
11], which could be traced back to Lippmann’s proposal that “people’s cognition of the world is largely derived from the issue of media setting” [
12]. In the 21st century, with the wide application of the Internet, the agenda setting process is also affected. McCombs argues that the Internet still plays an important role in what and how people think, and that agenda setting is an important research question for the future [
13]. Some believe that the Internet endows netizens with more choices, which will exert an impact on the effect of agenda setting [
14,
15].
Media framing theory believes that mass media has the function of setting the frame of reference with which recipients interpret and understand information and thus further affects public attitudes [
16]. Media framing is defined as the construction of perceived reality by the media and is considered to be relevant to concepts of gatekeeping and agenda setting as they all deal with content selection and salience [
16,
17,
18]. Although there is controversy about the specific process of media content selection, the three theories of gatekeeping, agenda setting and framing all emphasize the key importance of content selection, which is believed to influence individuals’ political cognition and behaviour. For example, Newton confirmed that media content has a stronger influence on individuals’ political attitudes than media form [
19]. According to the above theories, different types of media differ in their content selection and thus have different effects on the perception of the public. Aarts & Semetko, based on empirical studies in the Netherlands, confirmed the dual-effect hypothesis that regular viewing of public channel television news has a positive impact on individual political cognition, while frequent viewing of commercial television news has a negative impact on individual political cognition [
20]. The previous literature has devoted considerable attention to how media use affects public attitudes, which is helpful for us to understand the relationship between media use and environmental public opinion.
On the basis of these theories, previous studies have discussed the relationship between media use and citizens’ awareness of environmental issues. Different types of media might differ in the extent and manner in which they play the role of gatekeeping, agenda setting and framing. Some researchers argue that more media coverage of environmental issues would increase public attention to environmental issues [
21,
22,
23]. Studies have also focused on the impact of media use on the satisfaction with environmental government public services. For example, based on a content analysis of 40 national environmental organization blogs, studies found that media provide information to understand and evaluate the performance of the government’s environmental public services [
24,
25]. However, the previous literature has not directly answered the following questions: What effects do traditional media use and new media use have on environmental public service satisfaction? Is the impact positive or negative? What is the mechanism by which the impact is achieved? This article’s goal is to answer these questions concretely.
This paper argues that traditional media and new media will have different influences on environmental public service satisfaction. Studies have shown that the media narrative can significantly influence public opinion [
26]. In the Chinese context, the content selection of these two types of media are quite different when they report on issues related to the government’s environmental public services. The former primarily focuses on such regular environmental issues as ecological protection and supervision, environmental publicity and education, while the latter tends to expose various types of unexpected environmental accidents. The former tends to highlight which achievements the government has made in environmental governance, while the latter would point out the problems which still exist in environmental protection work [
27]. In China, traditional media have been an important path for the government to conduct political mobilization and shape public opinion. These forms of media are important channels for political parties and the government to convey their ideas and policies to society. The content of new media, although also subject to government regulation and review to a certain extent, is much more flexible than that of traditional media, which also contains some content that is inconsistent with government guidance and can be spread faster. These inconsistent views may influence the direction of public opinion, such as affecting the public’s perception of and commentary on the integrity of the government [
28] or challenging mainstream ideology and government authority [
29,
30]. Therefore, the traditional media reports on the government’s work and performance in public environmental services are generally positive, while the new media reports are not. Based on the previous research literature and China’s reality, this paper proposes the following research hypotheses:
Hypothesis 1a (H1a). Traditional media use is positively associated with environmental public service satisfaction.
Hypothesis 1b (H1b). New media use is negatively associated with environmental public service satisfaction.
Hypothesis 1c (H1c). Individuals whose main source of information is new media have lower satisfaction with environmental public services than individuals whose main source of information is traditional media.
In terms of impact mechanisms, media use may affect people’s authoritative value orientation and trust in the government, thus affecting their satisfaction with environmental public services. To verify this mechanism, we analyse whether two mediating variables, authoritative value propensity and government trust, play mediating roles between media use frequency and environmental public service satisfaction and between the main source of information and environmental public service satisfaction.
4. Research Findings
4.1. Descriptive Statistics
The descriptive statistics of each variable are presented in
Table 1. The average value regarding the usage frequency of newspapers, magazines, radio and mobile customized messages was less than 2, indicating that the use frequency was not high. For the Internet, the average value was 2.378. The media with the highest use frequency value was television, with an average value greater than 3.
All media can be integrated into two categories. Newspapers, magazines, radio and television are classified as traditional media, while the Internet and mobile customized messages are classified as new media. Using propensity value matching (which is suitable for dichotomous variables), we calculated the average usage frequencies of traditional and new media and converted them into dichotomous variables. Low usage frequency (average frequency score less than or equal to 3) was assigned a value of 0, while high usage frequency (average frequency score greater than 3) was assigned a value of 1. We assigned a value of 0 for respondents who used traditional media as their primary information source and a value of 1 for those who used new media as their primary information source. The average value was 0.286, which indicated that approximately 71.4% of respondents used traditional media as their primary information source.
The average value for the degree of satisfaction with environmental public services was 3.306, which indicated that the public’s evaluation of environmental public services was relatively high. In the control variable data, the average value for social trust was 3.485, which means that the majority of the respondents were trusting, while the average value for authoritative value propositions was 3.179, which indicated that respondents were likely to obey authority (with a higher score indicating greater obedience to authority).
4.2. Regression Model
An Ologit (Ordered Logit) regression model was used to analyse the relationships between the variables, and the OLS regression was used to perform the robustness test. The results are shown in
Table 2. The odds ratio is reported for the ordered logit regression, while the coefficient is reported for the OLS regression.
Models 1 and 2 show the relationships between the frequency of media use, environmental public service satisfaction and the control variables. The results show that among the four traditional media sources, there is a statistically significant positive correlation between the frequency of television use and environmental public service satisfaction, but there is no statistically significant relationship between the frequency of the other three kinds of media use and the dependent variables. In the new media, there is a significant negative correlation between Internet usage frequency and environmental public service evaluation, while there is a significant positive correlation between mobile customized message usage frequency and environmental public service evaluation.
In models 3 and 4, the independent variables are the frequency of traditional media use and the frequency of new media use. The six types of media use are divided into two categories to calculate the overall use frequency. The ordered logit regression results show that compared with those who use traditional media less, individuals who use traditional media frequently are more satisfied with environmental public services. Individuals who receive information relatively frequently through new media are less satisfied with environmental public services than those who use new media less frequently.
In models 5 and 6, the primary information sources are the independent variables, and the reference group is individuals using traditional media as their primary information source. The results show that individuals using new media as their primary information source are less satisfied with environmental public services than those using traditional media as their primary source. In conclusion, we find that the use of traditional media to a certain extent improves the public’s evaluation of environmental public services, while the use of new media worsens this evaluation. As a new medium, mobile customized information plays an opposite role to the Internet. We believe that this is related to its weak initiative. Traditional media is audience-dominated, whereas new media is audience-oriented. For example, TV programmes are relatively limited, and the audience can only passively accept the content. In contrast, the Internet gives users many choices. Users of mobile customized information can actively choose what they subscribe to, but after the selection, the content is determined by the media itself, and mobile subscription does not allow communication among users. Thus, the initiative is far less than that of the Internet and more similar to that of television.
Throughout all the models, in the sequence of the control variables, compared with women, men’s assessment of public environmental services is slightly higher. With respect to education, the higher an individual’s education level or annual income is, the lower their satisfaction with environmental public services. Residents of urban households have lower satisfaction with environmental public services than residents of rural households. Generally, social trust is positively correlated with the dependent variables; the higher the degree of social trust is, the higher the satisfaction with environmental public services. As noted above, a higher score on the authoritative value proposition indicates a greater tendency to obey authority, which leads to higher satisfaction with environmental public service. There is no statistically significant relationship between the other control variables and dependent variables. The above models all passed the collinearity test. Overall, there is almost no difference between the results of the ordered logit regression and the OLS regression. Therefore, we believe that the statistical results are robust.
4.3. Robustness Test
To test for and solve endogenous problems, instrumental variables are introduced in this section. The regression analysis above showed that the use of traditional media, mainly television media, will exert a significant positive impact on dependent variables, while the use of new media, mainly Internet sources, will have a significant negative impact on dependent variables. In addition, individuals using new media as their primary information source are less satisfied with environmental public services than those using traditional media as their primary source. We use the number of televisions owned by the respondents as an instrumental variable for “the frequency of television use” and the number of computers owned by the respondents as an instrumental variable for the “frequency of internet use” and “primary information sources” (the number of televisions and computers in the families of respondents was determined in the questionnaire). The instrumental variables all passed the weak instrumental variable test, which means the instrumental variables chosen are all valid. The Hausman test (see
Table 3) showed there was no endogeneity problem for the two independent variables “frequency of television use” and “frequency of Internet use”, while the variable “primary information sources” proved to be endogenous. However, the result of the IV regression model was similar to the result of the regression model, and the variable “primary information sources” was still significantly correlated with the dependent variable (coef = −0.959,
p = 0.002). The above results proved that the causal relationship between independent variables and dependent variables is robust.
4.4. Propensity Score Matching
To more accurately measure the relationship between the use frequency of the two major media types and satisfaction with environmental public services, as well as the relationship between the primary sources of information and environmental public service satisfaction, we further conducted propensity score matching. When allocating matching scores, different methods can be used, including K-nearest neighbour matching, radius matching and kernel matching. The method selection was determined by a balance analysis of matching variables; that is, a matching balance test of the standard deviation of each matching variable in the treatment group and the control group was used to judge the matching effect. According to Rosenbaum and Rubin’s research, it is generally believed that as long as the absolute value of standard deviation is less than 20, matching failure will not occur [
31]. The results showed that radius matching and kernel matching worked better in the balance test, and almost all variables met the standard deviation requirements. Therefore, we finally adopted these two matching schemes.
4.4.1. Average Treatment Effect Estimation
Table 4 reports the average treatment effect on the treated (ATT). The results show that after propensity matching, respondents who use traditional media more frequently (treatment group) are approximately 8% more satisfied than those with a low frequency of traditional media use (control group). Individuals with a high frequency of new media use (treatment group) are less satisfied with environmental public services than those with a low frequency of new media use (control group). The difference is approximately 6–7%. Respondents who use new media as their primary information source (treatment group) are less satisfied with environmental public services than those who use traditional media as their primary information source (control group); the difference is approximately 18–20%. The radius matching results and nuclear matching results are similar in the above tests, and they are all statistically significant. In conclusion, the choice of media greatly affects people’s satisfaction with environmental public services, and the frequency of use of different media also plays a role to a certain extent. The propensity score matching results are basically consistent with those of the ordinary logit and OLS estimation, which confirms the validity of the results.
4.4.2. Balance T-Test
The effectiveness of propensity score matching is based on the balance of each confounding variable. If there is no systematic difference between the treatment group and the control group in the confounding variables after matching, the balance test is considered to be passed [
32].
Table 5 reports the standard bias (SB) and t value before and after matching with the corresponding significance value. The results show that before matching the propensity value, the SB between the treatment group and the control group is larger, while after matching the propensity value, the SB of all variables is less than 10%. After matching, except for a few variables, the t-test of each confounding variable between the treatment group and the control group is no longer significant; that is, it passed the balance test.
4.5. Mediation Effect
Why does traditional media use enhance environmental public service satisfaction, while new media use has the opposite effect? This paper holds that the use of media may affect people’s authoritative value propositions and trust in the government’s ability to address environmental issues, thus further affecting their satisfaction with the government’s environmental public services. Specifically, traditional media sources, which are mostly sponsored by the government, tend to publicize mainstream values; thus, they may increase the public’s approval of compliance with the government. In contrast, in the new media environment, especially in the age of self-media, the degree of media control has been greatly reduced. Views that are inconsistent with mainstream government values can also be disseminated, including views criticizing the government’s failure to address environmental issues, which may reduce the public’s approval of compliance with the government. We used the variable “authoritative value propositions” to test the mediating effect.
Because the media coverage of the government’s environmental work is mostly associated with some environmental accidents, we suppose that the critical evaluation of the new media will affect citizens’ confidence in the government’s ability to effectively deal with environmental accidents and in turn affect their satisfaction. Through the mediation effect test, the mechanism of media use affecting environmental public service satisfaction can be more clearly demonstrated. We measured another mediating variable, that is, citizens’ trust in the government’s effective handling of environmental problems (referred to as “government trust”), through the following question in the questionnaire: “Imagine there is an enterprise near your home that violates the regulations to discharge waste gas or sewage, and it will seriously damage the health of residents. What will the government do if the matter is reported to the relevant authorities?”. The answers to this question included “the government will not investigate or deal with it”, “the government will investigate and deal with it but it will delay for a long time”, “the government will investigate and deal with it, but not very soon”, “the government will investigate and deal with it soon”, and “the government will investigate and deal with it immediately”. These answers were assigned values from 1 to 5. The higher the value was, the stronger the citizens’ trust in the government’s effective handling of environmental problems. Based on the above assumptions, the Sobel–Goodman mediation test was performed to test the mediation effect [
33]. The results are reported in
Table 6.
The results show that authoritative value propositions and government trust both have significant mediating effects between the frequency of traditional media use and environmental public service satisfaction. The higher the frequency of traditional media use is, the stronger the inclination to obey authority (indicated by a higher score on the authoritative value propositions) and, conversely, the higher the satisfaction with environmental public services. Similarly, the more frequently traditional media are used, the stronger the public’s trust in the government’s effective handling of environmental problems and the higher the satisfaction with environmental public services. However, when the frequency of new media use is set as the independent variable, neither of the two variables has a significant mediating effect. Another finding is that, compared with people using traditional media as the main source of information, those using new media have less trust in the government’s effective handling of environmental problems; in turn, their environmental public service satisfaction is lower. However, authoritative value propositions do not show a significant mediating effect.
5. Discussion and Conclusions
Based on sample survey data of CGSS2015 in China, this paper analyses the relationship between media use and environmental public service satisfaction. It finds that an increase in the frequency of traditional media use increases public satisfaction with environmental public services, while an increase in the frequency of new media reduces this satisfaction. Individuals using new media as their primary source of information have lower satisfaction with environmental public services than individuals primarily using traditional media. Television, as the representative source of traditional media, has the highest utilization rate and has the most significantly positive effect on satisfaction with environmental public services, while the Internet, as the representative source of new media, has the most significantly negative effect on this satisfaction. These findings further support the theories of gatekeeping, agenda setting and framing, confirming that the media’s content selection would affect citizens’ satisfaction with environmental public services and that different types of media differ in their effects. Previous research indicates that the role of the media in public perception may be affected by other factors [
16]. To clarify how media use affects public satisfaction with environmental public services, this study further examines the causal mechanism behind this. The results show that the frequency of traditional media use affects the public’s authoritative value propositions and trust in the government’s effective handling of environmental problems and in turn affects the public’s satisfaction with environmental public services. However, when the frequency of new media use is the independent variable, these two mediating variables do not show a significant mediating effect. In addition, government trust presents a significant mediating effect between the primary information sources and environmental public service satisfaction, while authoritative value propositions do not. The results of our research are consistent with the findings by Tobin Im, et al. [
34], Alfred Tat-Kei Ho and Wonhyuk Cho [
35]. The former found that the diffusion of the Internet had resulted in lower levels of citizen trust in government and compliance, compared with the use of traditional media in South Korea, While the latter confirmed that public communication as well as information is positively associated with citizen satisfaction.
To ensure that common methods bias was not a significant problem in our data (we thank the anonymous reviewer for articulating this problem more clearly; we acknowledge that common-method bias might be an issue, and the use of a single-shot cross-sectional survey has its limitations), we conducted Harman’s one-factor (or single-factor) test [
36]. If only one factor emerges or one general factor accounts for the majority of the covariance among the measures (proportion is higher than 40%), it can be determined that there is a substantial common method bias problem [
37,
38]. Our factor analysis result shows that the retained number of factors is 4 and the proportion of factor 1 is 0.2601, which is lower than 40%, proving that common method bias was not a problem in our analysis. The research still has some limitations that require further improvements in the future. As this paper has not obtained cross-time data or usable data from other sources, it may be necessary to supplement the results for a more powerful demonstration in future research.
This result implies that the use of traditional media and the use of new media have opposite effects on environmental public service satisfaction. Previous studies have rarely distinguished the effects of different media, but it is significant to discuss the different impacts of the traditional media and new media. That is, when examining the impact of media on government satisfaction, we should not only focus on the media itself but also examine the media environment of different societies. As mentioned above, the discourse structures of these two types of media in China are quite different when they report on issues related to the government’s environmental public services. The traditional media reports on the government’s work and performance in public environmental services are generally positive, while the new media reports are not. As the traditional media in China are strictly regulated and censored, they have to transmit voices that conform to mainstream values. In contrast, new media diversify information. In particular, the popularity of micro-blogs and WeChat has brought China into the era of self-media; thus, everyone can become creators and disseminators of information. Because of the anonymity of networks, unfavourable remarks about the government, whether accurate or not, can also be sent and disseminated. Therefore, citizens who use different media have different views about the government’s environmental public services. Researchers have confirmed that those in power tend to limit information that is not conducive to them or society based on the needs of political domination or social management. The difference between the content of the traditional media and new media does not only exis tin China. Compared with the traditional media, new media is less constrained and more inclined to spread different voices [
39], so the views of this article have more general value.
The research findings have important practical implications. On the one hand, the environmental problems and the government’s ineffective handling of them as exposed in the new media influence the public’s evaluation of the government negatively; on the other hand, media exposure of environmental governance problems could help the government understand the shortcomings in its own work and accept public opinion supervision, thus further improving its environmental public service performance. At the same time, the government should also pay attention to the timely clarification of those rumours circulated on the Internet to obtain and maintain the public’s trust, and perhaps the government could actively use new media to communicate with the public. We believe that if the government receives criticism modestly, responds to it positively and improves its service conscientiously, it will win the respect and support of the people in the long run.


