Article

Location-Routing Problem for Relief Distribution in the Early Post-Earthquake Stage from the Perspective of Fairness

1
School of Management, Hunan University of Commerce, Changsha 410205, China
2
Mobile E-business Collaborative Innovation Center of Hunan Province, Hunan University of Commerce, Changsha 410205, China
3
School of Business Administration, Southwestern University of Finance and Economics, Chengdu 611130, China
4
School of Management and Economics, University of Electronic Science and Technology of China, No.2006, Xiyuan Ave, West Hi-Tech Zone, Chengdu 611731, China
5
Department of information Technology, Faculty of Computing and IT, King Abdulaziz University, Jeddah 21589, Saudi Arabia
*
Author to whom correspondence should be addressed.
Sustainability 2019, 11(12), 3420; https://doi.org/10.3390/su11123420
Submission received: 20 May 2019 / Revised: 12 June 2019 / Accepted: 12 June 2019 / Published: 21 June 2019

Abstract

:
To address the shortage of relief in disaster areas during the early stages after an earthquake, a location-routing problem (LRP) was studied from the perspective of fairness. A multi-objective model for the fair LRP was developed by lexicographic order object optimal method in consideration of the urgent window constraints, partial road damage, multimodal relief delivery, disaster severity, and vulnerability of each demand node when its demand is not satisfied. The goals of this model are to minimize (1) the maximum loss of demand node, (2) the total loss of demand node, and (3) the maximum time required for the demand node to receive relief. A hybrid heuristic algorithm was proposed to solve the model. Finally, the utility and fairness of the model and algorithm were demonstrated by a case study during the first day after the great Wenchuan earthquake in China.

1. Introduction

In recent years, earthquake disasters have caused large numbers of human casualties and property losses. To effectively reduce earthquake damage, relief must be sent to the demand nodes in the shortest possible time after the earthquake. Scholars generally believe that the emergency facility location allocation problem (LAP) and emergency vehicle routing problem (VRP) in the available transportation network are two of the most challenging issues in emergency logistics systems after earthquakes. LAP and VRP are dependent on each other and influence each other. Thus, the overall design and optimization of LAP and VRP must be carefully performed. In addition, available research on the location-routing problem (LRP) in emergency logistics systems after earthquakes should be considered (Caunhye et al. [1], Bozorgi-Amiri et al. [2], Du [3], and Peng et al. [4]).
LRP in emergency logistics systems has become a hot spot in current disaster research. Yi and Odamar (2007) formulated an integrated LRP model for the supply of relief and evacuation of wounded people during disaster response [5]. Sheu (2007) built a multi-objective dynamic programming model using hybrid fuzzy clustering optimization approach, the two objectives of the model were to minimize distribution cost and maximize demand fill rate [6]. Mete and Zabinsky (2010) proposed a stochastic optimization approach for the storage and distribution problem of medical supplies. They balanced the preparedness and risk despite the uncertainties of disaster events [7]. Vitoriano et al. (2011) reported a multi-criteria optimization model dealing with cost, time, and priority for humanitarian aid distribution, and presented an illustrative case study based on the 2010 catastrophic earthquake in Haiti [8]. Dai et al. (2012) considered a joint decision problem of locating distribution centers and scheduling routes for delivery vehicles and formulated a chance-constrained programming model for the fuzzy dynamic LRP. The goal of the model was to minimize the total time required to deliver relief materials to all affected areas. They proposed a two-phase heuristic algorithm to solve the model [9]. Li et al. (2013) investigated a joint decision problem involving emergency facility location allocation and multimodal transportation scheduling, developed a multi-objective location-multimodal transportation model to minimize the total delivery time and total losses due to insufficient relief, and proposed a non-dominated sort genetic algorithm based on a bi-dimensional encoding method to solve the model [10]. Wang et al. (2014) constructed an integer nonlinear open LRP model for relief distribution by considering vehicle travel time, total cost, and road reliability with split delivery. They designed a non-dominated sorting genetic algorithm and a non-dominated sorting differential evolution algorithm to solve the proposed model [11]. Ruan et al. (2014) developed a clustering-based approach for the intermodal transportation of medical supplies in disasters; their approach involved two stages: (1) determine the network of helicopters-vehicles intermodal transportation and (2) build a clustering-based route-optimization model to plan the routes of vehicle travel [12]. Ma et al. (2014) considered a fuzzy multi-objective open LRP for relief delivery and developed a chance-constrained programming open LRP model with the objectives of minimizing the total delivery time and total system cost. They designed a hybrid genetic algorithm to solve the proposed problem [13]. Rath and Gutjahr (2014) suggested that a supply system with intermediate warehouses should be established to provide relief to people affected by a natural disaster. They formulated an optimization model with three objective functions (medium-term economic, short-term economic, and humanitarian) and proposed an exact solution method along with a math-heuristic technique to solve the proposed problem [14]. Rennemo et al. (2014) proposed a three-stage mixed-integer stochastic programming model for relief distribution in the response phase. The three stages were: (1) determine which distribution centers are to be opened; (2) determine vehicle routing decisions; and (3) deal with the uncertainty in network infrastructure [15]. Ahmadi et al. (2015) studied a humanitarian logistics model for disaster relief, proposed a multi-depot LRP model to determine the locations of local depots and routing for last-mile relief distribution after an earthquake, and designed a variable neighborhood search algorithm to solve the deterministic model [16]. Liu et al. (2016) considered a new LRP for the post-earthquake delivery of relief from the viewpoint of integrated optimization. By considering (1) the stochastic vehicle time determined by the location and topography of relief points, (2) the urgent window constraints, (3) the fuzzy demands of relief materials, and (4) the urgency of post-earthquake rescue time, they developed a chance-constrained programming model for the fuzzy LRP with the goal of minimizing the total time required to deliver relief and the total cost. The authors proposed a hybrid immune genetic algorithm to solve the model [17]. Moreno et al. (2016) considered a multi-period location-transportation problem involving the reuse of vehicles in emergency logistics, and developed two stochastic mixed-integer programming models to integrate and coordinate facility location, transportation, and fleet-sizing decisions under uncertainty [18]. Sharma et al. (2017) considered the problem of locating the temporary blood banks during and post-disaster conditions. Blood banks must be located in such a way that it is able to serve the demand of hospitals with minimum response time. Tabu search heuristic was employed to calculate the optimal number of temporary blood centers, and Bayesian belief network was employed to prioritize the factors for locating the temporary blood facilities [19]. Kim et al. (2018) focused on the problem of logistics service provider selection for disaster preparation based on a socio-technical systems perspective, and developed a hybrid multi-criteria decision-making model for logistics service provider selection in the disaster preparedness stage [20]. Zhang et al. (2018) presented an exploration of the sustainable multi-depot emergency LRP with uncertain information, constructed an uncertain multi-objective LRP model for emergency response by considering vehicle travel time, emergency relief costs and carbon dioxide emissions. They designed a hybrid intelligent algorithm that integrates uncertain simulation and a genetic algorithm to solve the proposed problem [21]. By considering the uncertain demand for relief supplies, inaccurate information regarding victims, aftershocks, and extensively damaged road networks, and aerial transport vehicles, Alinaghian et al. (2019) formulated a new mathematical model for location of temporary relief centers and dynamic routing of aerial rescue vehicles distributing basic supplies in relief operations, and designed an improved hybrid metaheuristic algorithm based on scatter search combined with variable neighborhood search to solve the proposed LRP [22].
One of the main problems influencing the relief delivery is the state of the road network in the affected areas. The road network may be destroyed to a certain extent (Maya Duque et al. [23], Celik [24], Li et al. [25], Kou et al. [26]). To restore the connectivity of post-disaster networks, Akbari and Akbari (2017) studied a multi-vehicle synchronized arc routing problem. They developed an exact mixed integer programming formulation (MIP) for relief delivery, and proposed a heuristic based on an MIP-relaxation and a local search algorithm to solve this problem [27]. To delivery vital relief to affected areas, Vahdani et al. (2018) developed an integer nonlinear multi-objective, multi-period, and multi-commodity model by considering emergency roadway repair. The non-dominated sorting genetic algorithm-II (NSGA-II) and multi-objective particle swarm optimization (MOPSO) were employed to solve the proposed problem [28]. To solve the post-disaster road network repair work scheduling and relief logistics problem, Li and Teo (2019) incorporated road network repair work schedules and relief logistics within the same framework, developed a multi-period bi-level programming model, and presented a maximum relative satisfaction degree-based steady-state parallel genetic algorithm to solve the proposed problem [29].
Emergency logistics of relief delivery requires a more formal treatment of equity. Equity cannot be ignored in the research on last-mile logistics for humanitarian interventions (Starr et al. [30], Chao et al. [31], Zhang et al. [32]). Emergency logistics must bring relief to all demand nodes in an equitable manner after disaster, even if this is far from being efficient. Emergency logistics cannot refuse to serve remote demand nodes because the costs are too high. Therefore, it is difficult for decision makers to make ethical choices when relief is insufficient to satisfy all demands. This efficiency–equity tension is a characteristic distinction between emergency logistics problems and regular commercial operations, that is, the objective function is different and sometimes hard to determine (Altay et al. [33], Alhassany et al. [34], Selvamuthu et al. [35]). Last-mile distribution of emergency logistics is the most challenging of the relief supply network elements, and typically requires the decision makers to overcome the impact of a degraded communications and physical infrastructure (bridges and roads, for example) (Tatham et al. [36], Nayak et al. [37], Challa et al. [38]). Humanitarian organizations usually work diligently to save lives using scarce emergency resources, competing for donor money, and operating in complex environments during and post-disaster periods (Gupta et al. [39]). For example, in the early stage after the Ya’an earthquake, the distribution of relief was unfair. The times to bring relief to some demand nodes relatively near the distribution center were relatively long, and some demand nodes were even ignored (Xue and Feng [40], Song et al. [41], Ahmed et al. [42]).
Although the existing studies have made significant advances related to LRP in emergency logistics systems, several research gaps still exist, including the following: (1) most of the existing literature assumes that the quantity of relief is sufficient to satisfy all demands, and the shortage of relief after earthquakes has been given little consideration; (2) although the timeliness and economical efficiency of relief distribution after earthquakes have been extensively studied, the fairness of relief distribution has received little attention; and (3) most of the existing literature assumes that the importance of emergency supplies reaching each demand node is the same; the disaster severity at each demand node and the degree to which demand goes unsatisfied at each demand node are less well-studied. In the early stages after an earthquake, it is difficult to distribute emergency supplies from outside the disaster area to demand nodes in a short period of time. At the same time, prepositioned relief in the disaster areas cannot usually meet the needs of all affected areas (Du [3], Chen and Zhao [43], An [44], Wang et al. [45], and Ge et al. [46]). People affected by disasters are both physically and mentally vulnerable; thus, if the distribution of relief is inequitable, it may arouse victims’ anger and even result in mass incidents, leading to serious consequences (Yu et al. [47], Cao et al. [48]). Therefore, emergency relief work should put people first, and emergency supplies should be distributed fairly in the case of relief shortage in a disaster area in early post-earthquake stages. To consider relief shortage in the early period after an earthquake, Du [3] and Wang et al. [45] constructed an LRP model with the goal of minimizing the total time required to distribute relief distribution along with the total loss of demand nodes. To study the fair distribution of relief in disaster areas, Chen and Zhao [43] constructed a bi-object optimization model incorporating fairness. The objectives of this model were (1) to maximize the delivery of supplies and (2) minimize the maximum transport time among the affected areas. To ensure the fair distribution of relief, Zhen et al. (2013) established a bi-level optimization model to maximize the relief satisfaction ratio of demand nodes [49]. An (2010) studied the fairness and efficiency of the first batch of distributed relief after a disaster by grouping the demand nodes according to the priority and establishing a fair distribution model. The goals of the model were fairness among all groups and fairness within each group [44]. Pang et al. (2012) presented a transportation and distribution model of relief aimed at minimizing the system losses by considering the constraints of emergency response time and fairness [50]. Zhang et al. (2015) constructed a fair distribution model of relief based on fairness theory [51]. Wang et al. (2013) applied the value function in prospect theory to measure people’s perceived satisfaction with regard to emergency responsiveness [45]. They presented a multi-objective nonlinear integer model for planning relief allocation in the initial period of unconventional emergencies; this model quantifies people’s satisfaction with the timeliness, demand, and economic utility of relief. However, the existing studies did not simultaneously account for the fair allocation and distribution of relief in the case of relief shortages in disaster areas in early post-earthquake stages.
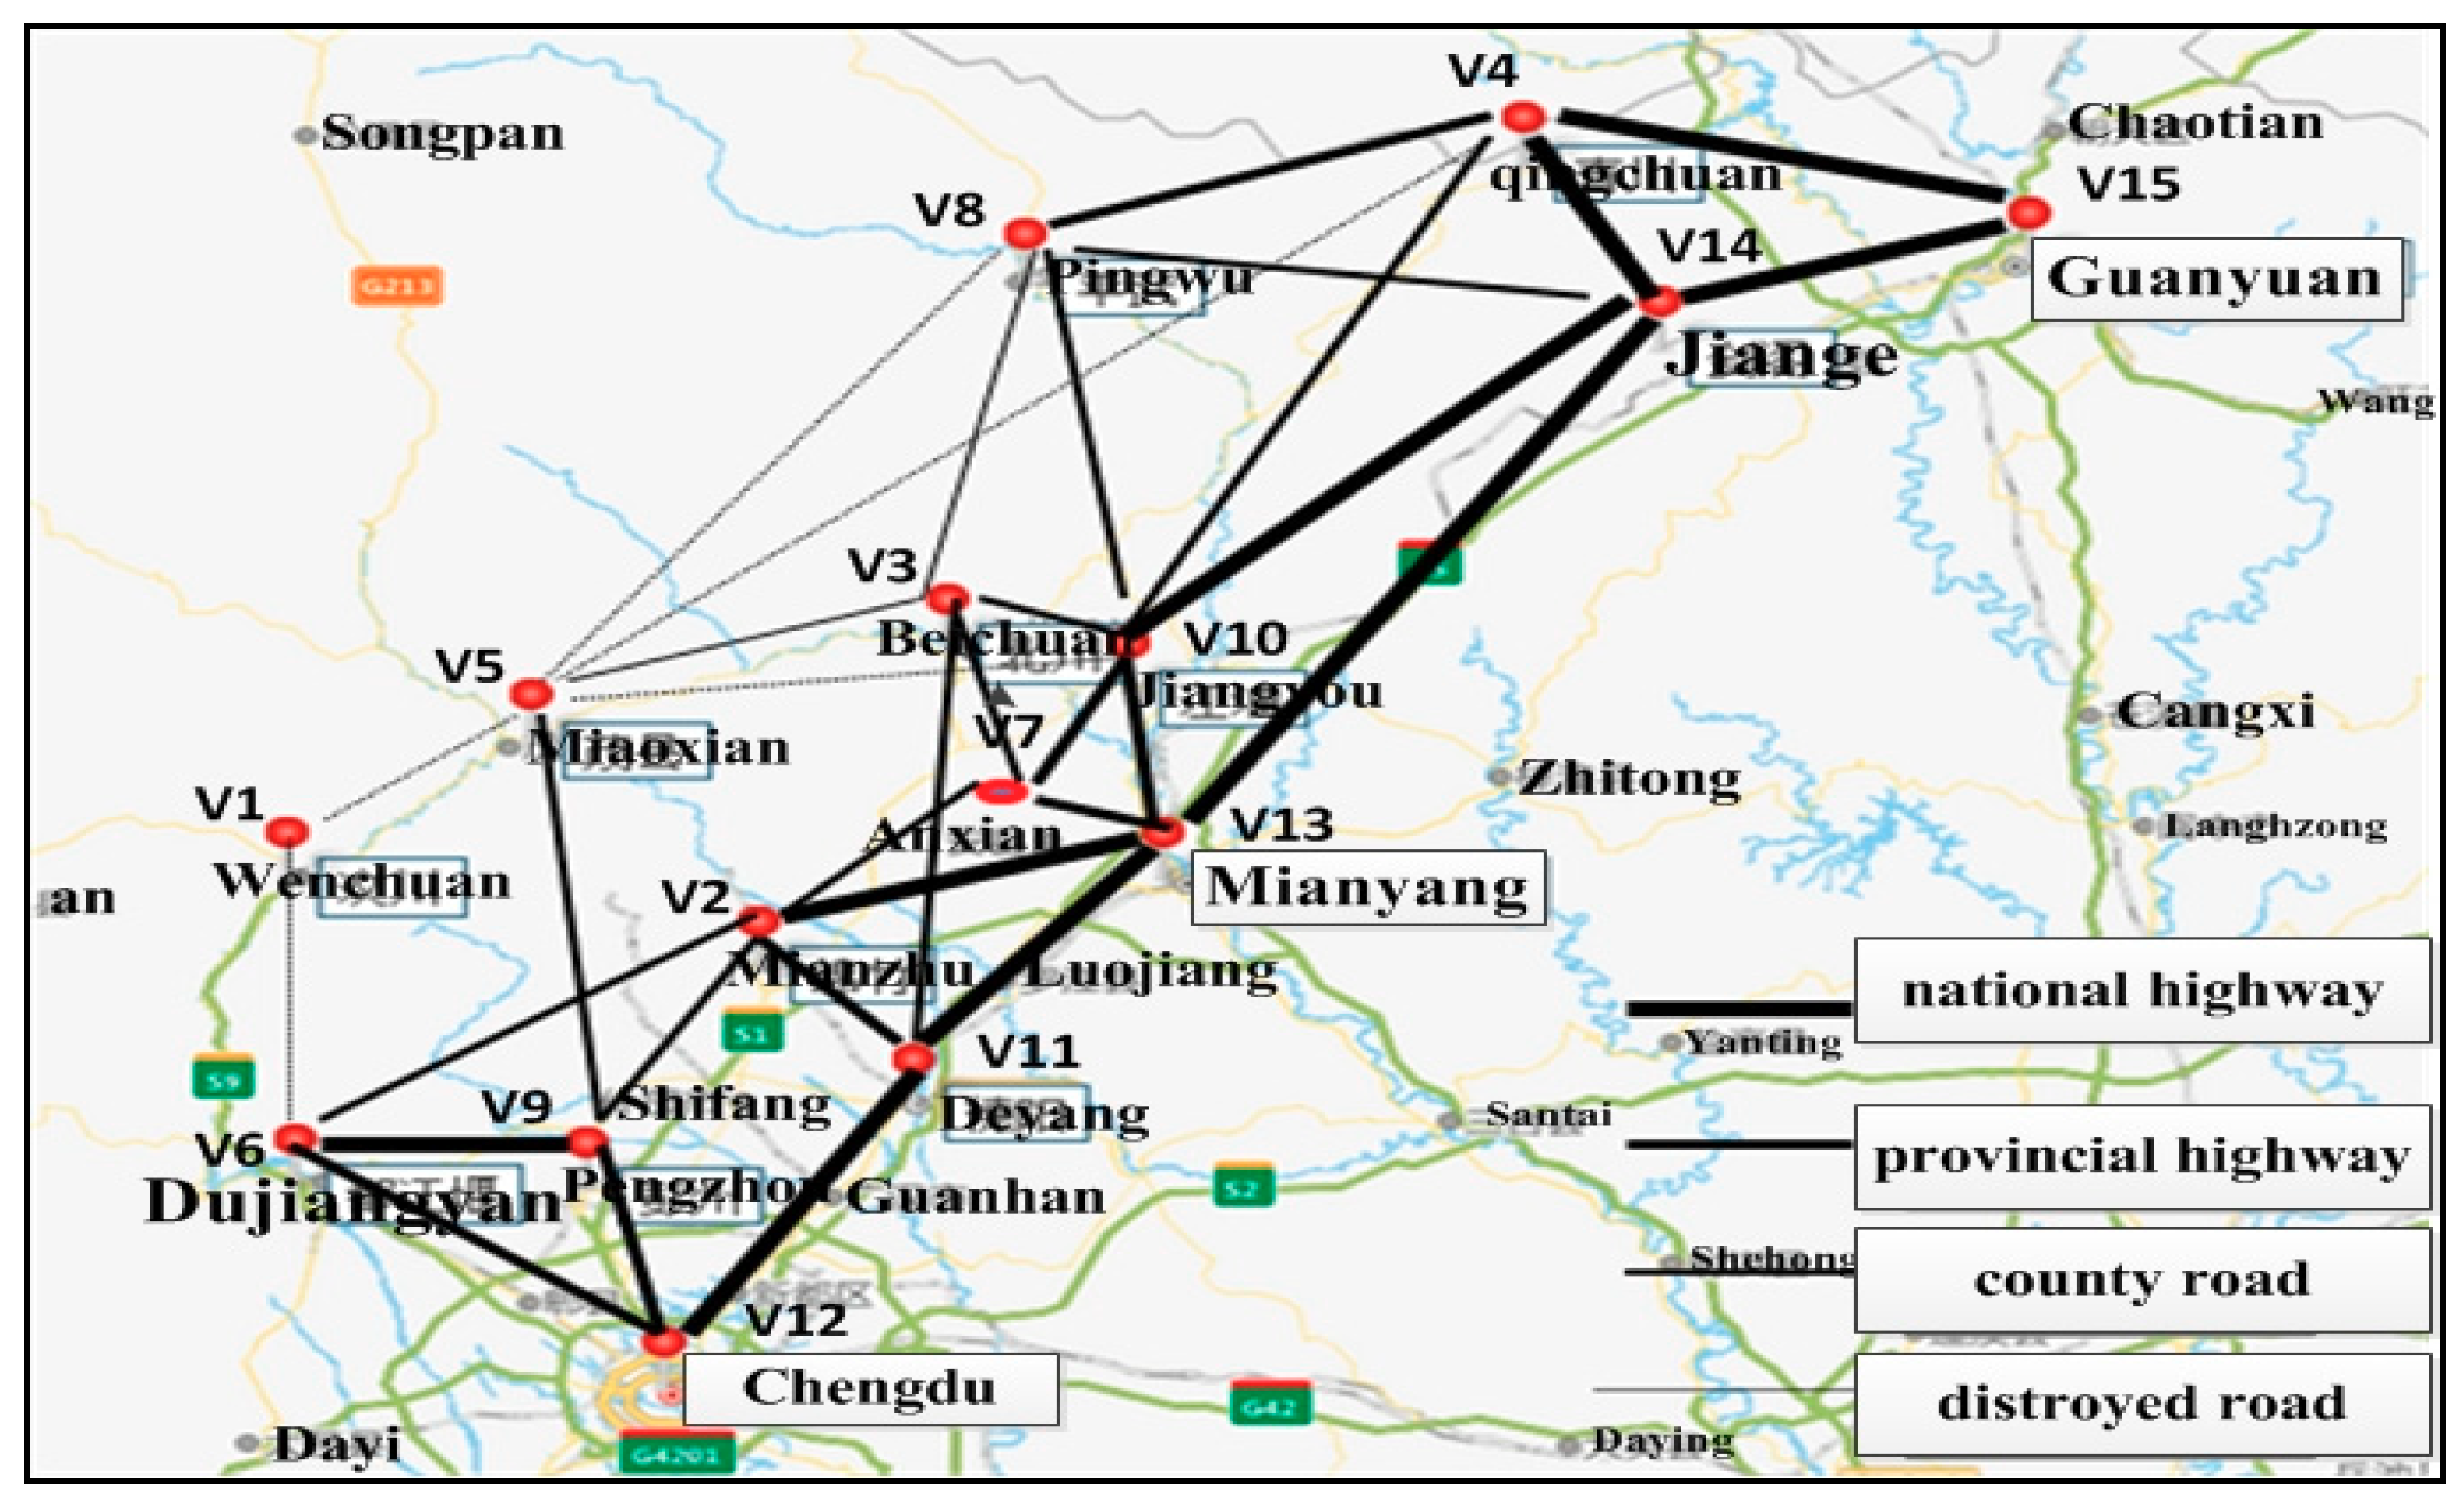
This paper investigates LRP for the case of relief shortage during the early stage after an earthquake from the perspective of fairness and presents an overall plan for the fair allocation and distribution of relief. A loss function for demand node is formulated by considering the severity of the disaster along with the vulnerability of each demand node. A multi-objective model for the fair LRP is developed by lexicographic order object optimal method by considering urgent window constraints, partial road damage, multimodal relief delivery, disaster severity, and vulnerability of each demand node when its demand is unsatisfied. The goals of the LRP model were to (1) minimize the maximum loss of demand nodes, which is the index of fair allocation of relief, (2) minimize the total loss of all nodes, which is the index of relief utility, and (3) minimize the maximum time required for demand nodes to receive relief, which is the index of efficiency of relief distribution. A hybrid heuristic algorithm (HHA) was proposed to solve the LRP model. Finally, the feasibility and validity of the model and the HHA were demonstrated by camp distribution in the first day after the Wenchuan earthquake in China. The experimental results show that the proposed approaches not only quickly solve the relief distribution program in the prescribed period after the earthquake, but also take fairness and utility into consideration.

2. LRP Model for Fair Distribution of Relief

2.1. Problem Description

Several appropriate distribution centers must be built in a disaster area after an earthquake to quickly deliver relief to each demand node. To clarify the scope of this article, the following hypotheses are put forward: (1) there is a shortage of relief in the early post-earthquake stage; (2) if the demand node is a connected island, the relief is delivered by helicopter; otherwise, the relief is delivered by vehicle; (3) for large demand nodes, the “demand segmentation” strategy is used simultaneously for both direct delivery and common delivery; (4) demand nodes can be served several times; and (5) the amount of relief distribution equipment is limited; the equipment starts at the distribution center and returns to the same distribution center afterwards. The decision problem deals with how to fairly allocate and distribute relief.

2.2. Sets and Parameters

B { b | b = 1 , 2 , ... , | B | } = set of candidate distribution centers;
B Q b = amount of relief that distribution centers b can provide;
V { r | r = 1 , 2 , ... , | V | } = set of vehicles;
V Q r = load capacity of vehicle r , where V Q min is the smallest load capacity of vehicle;
V S r = speed of vehicle r ;
H { k | k = 1 , 2 , ... , | H | } = set of helicopters;
H Q k = load capacity of helicopter k , where H Q min is the smallest load capacity of helicopter;
H S k = speed of helicopter k ;
s i = amount of relief needed by demand node i ;
d i = actual amount of relief allocated to node i based on the standards of fairness, d i s i ;
B C { f | f = 1 , 2 , ... , | B C | } = set of large demand nodes in which the actual amount of allocated relief exceeds V Q min or HQmin;
S C { m | m = 1 , 2 , ... , | S C | } = set of small demand nodes in which the actual amount of allocated relief is less than V Q min or H Q min and the virtual demand nodes generated from large demand nodes by the segmentation strategy;
C { c | c = 1 , 2 , ... , | B C | + | S C | } = set of all demand nodes, C = B C S C ;
N = B C = set of all nodes in the emergency logistics network, i , j N ;
η i j { 0 , 1 } = 1 if the road between node i and node j is connected and 0 otherwise;
q i j = distance between node i and node j
ϑ i j = maximum allowable speed of the vehicle between node i and node j ;
V T i r = time that vehicle r arrives at node i ; if i B , V T i r = 0 ;
V T i j r = time that vehicle r arrives at node j from node i , V T i j r = q i j / min ( ϑ i j , V S r ) ;
H T i k = time that helicopter k arrives at node i ; if i B , H T i k = 0 ;
H T i j k = time that helicopter k arrives at node j from node i , H T i j k = q i j / H S k ;
T = time limit of relief distribution.
Decision variables:
y b = 1 if the candidate distribution center b ( b B ) is opened and 0 otherwise;
β b i = 1 if the node i ( i C ) is allocated to b ( b B ) and 0 otherwise;
e i j k b = 1 if helicopter k of distribution center b flies to node j ( j C ) from node i ( i C ) and 0 otherwise;
φ i j r b = 1, if vehicle r of distribution center b travels to node j ( j C ) from node i ( i C ) and 0 otherwise.

2.3. Fair Allocation of Relief

Du [3], Sheng [52], Balinski [53], Medernach and Sanlaville [54], and Ge et al. [46] believe that the fair allocation of relief should take equity and efficiency into consideration. Xue and Feng [40] quantified the effect of fair relief allocation in the case of a serious relief shortage after a disaster by introducing the proportion of demand that was not satisfied into the negative utility function. Pang and Liu [55], and Du et al. [56] reported that the fair allocation of relief should conform to the Nash equilibrium in the game. By considering the disaster severity and the vulnerability of each demand node when its demand is unsatisfied, this paper takes a people-oriented approach and constructs a loss function that fairly allocates relief in order to reduce the loss of demand nodes.
We define ϖ i as the loss of demand node i when its demand is unsatisfied; D is the total amount of allocated relief at all nodes; γ is the severity of the disaster, which is expressed by the earthquake intensity, degree of damage, and the disaster category; and δ i is the vulnerability of demand node i when its demand is unsatisfied, which mainly depends on its location, personnel composition, extent of disaster, capability for disaster reduction, and disaster-bearing sensitivity (Ge et al. [46]). The loss function of demand node i can be formulated as
ϖ i = δ i D γ ( s i d i ) γ
where 1 D γ is demand normalization, and γ 1 .
To measure the fairness of the relief allocation, the objective Z 1 , which minimizes the maximum loss of the demand node, can be formulated as
Z 1 = min ( max i C ϖ i )

2.4. Multi-Objective LRP Model for Fair Distribution of Relief

The lexicographic order multi-object planning method was employed to formulate a multi-objective LRP model for the fair distribution of relief. The goals of this LRP model are to (1) minimize the maximum loss of the demand node, which is the index of fair allocation of relief, (2) minimize the total loss of all nodes, which is the index of relief utility, and (3) minimize the maximum time required for the demand node to receive relief, which is the time indicator of fair delivery (Du [3], Chen and Zhao [43], Huang et al. [57], and Campbell et al. [58]). The multi-objective LRP model for the fair distribution of relief is as follows:
min l e x P 1 P 2 P 3
P 1 = Z 1
P 2 = i C ϖ i
P 3 = min ( max V T i r , max H T i k )
s . t   i C d i b B B Q b y b
i C d i β b i B Q b , b B
i C j C d i φ i j r b V Q r , r V , b B
i C j C d i e i j k b H Q k , k H , b B
j B C φ i j r b = i B C φ j i r b , j B C , r V , b B
j B C e i j k b = i B C e j i k b , j B C , k H , b B
i B j C φ i j r b 1 , r V , b B
i B j C e i j k b 1 , k H , b B
i B j C k H e i j k b 1 , b B
i B j C r V φ i j r b 1 , b B
b B j C r V φ b j r b y b , b B
j C φ b j r b y b , b B , r V
b B j C k H e b j k b y b , b B
j C e b j k b y b , b B , k H
V T j r = V T i r + V T i j r , j C , i B C , r V
H T j k = H T i k + H T i j k , j G , i B C , k H
V T i r T , H T i k T
y b { 0 , 1 } , β b i { 0 , 1 } , e i j k b { 0 , 1 } , φ i j r b { 0 , 1 }
Objective function (3) means fair distribution of relief. Constraint (4) is the maximum loss of demand node. Constraint (5) is the total loss of all demand nodes. Constraint (6) is the maximum time required for the demand node to receive relief. Constraint (7) ensures that the total amount of relief held at all open distribution centers is not less than the total amount of actual relief allocated at all nodes. Constraint (8) ensures that the total allocation quantity of the demand nodes, which are allocated to each opened distribution center, does not exceed available relief amount of the corresponding distribution center. Constraints (9) and (10) guarantee that the volume of all relief distributed to demand nodes by a vehicle or helicopter does not exceed capacity. Constraints (11) and (12) guarantee the route continuity of vehicles and helicopters. If a vehicle or helicopter enters a node, it must depart from the same node. Constraints (13) and (14) guarantee the elimination of sub-tour. Each route connects to at least one distribution center. Constraints (15) and (16) mean that each vehicle or helicopter is assigned to at least one distribution center. Constraints (17) and (18) guarantee that a vehicle is assigned to a distribution center as long as it is opened, and vehicles are only assigned to open distribution centers. Constraints (19) and (20) guarantee that a helicopter is assigned to a distribution center as long as it is opened, and helicopters are only assigned to open distribution centers. Constraint (21) indicates the time that a vehicle arrives at the demand node. Constraint (22) indicates the time that a helicopter arrives at the demand node. Constraint (23) indicates the time limit of a vehicle or helicopter arriving at the demand nodes. Constraint (24) defines the binary restrictions on the variables.

3. Hybrid Heuristic Algorithm

The traditional method of solving a multi-objective optimization problem is to first convert multiple objectives into a single objective and then use a single-objective optimization method to solve the proposed problem. However, it is difficult to realize real multi-objective optimization using traditional methods. In recent years, researchers have designed a variety of methods, including the constraint method, hierarchical sequence method, efficiency coefficient method, evaluation function method, and analytic hierarchy process, to solve multi-objective optimization problems based on the Pareto solution set. The hierarchical sequence method sorts all the goals in order of importance and then obtains the optimal solution for the most important goal. The optimal solution of the next most important target is then obtained under the premise of guaranteeing the optimal solution of the preceding objective. LRP-solving algorithms mainly include two-stage algorithms, which have shorter running times, and global solving algorithms, which have longer running times but better LRP plans (Peng et al. [4], Yi and Ozdamar [5], Sheu [6], Mete and Zabinsky [7]).
To obtain a better LRP solution, this paper designs a HHA comprising a greedy algorithm combined with an ant colony algorithm using a hierarchical sequence method. The specific steps of the HHA are as follows:
Procedure 1: Algorithm initialization. Input the data of the emergency logistics network. Define M A X i t e r as the maximum number of iterations of the HHA. Set the values of B Q b , V Q r , V S r , V Q min , H Q k , H S r , H Q min , T , η i j , s i , γ , δ i , and M A X i t e r . The greatest loss of demand node Z 1 = , the total loss of all demand nodes Z S = , maximum time required for the demand node to receive relief Z T = , and the current number of iterations i t e r = 1 .
Procedure 2: Fair relief allocation by greedy algorithm. Step 1: Allocate relief randomly. Step 2: Use Formula (1) to calculate the loss of each demand node Z 1 i t e r and the total loss of all demand nodes Z S i t e r in current iteration. If Z 1 i t e r Z 1 and Z S i t e r Z S , then Z 1 = Z 1 i t e r and Z S = Z S i t e r , and proceed to Procedure 3; otherwise, transfer 10 percent of relief allocated to the node with the smallest loss to the node with the biggest loss, and proceed to Step 2.
Procedure 3: Allocating demand nodes to distribution centers by greedy algorithm. Step 1: Define X B as the set of open distribution centers, and X B = ϕ . Step 2: Randomly select B m distribution centers from set B . Calculate b X B B Q b , which is the total amount of available relief supplied by set X B . If i C d i b X B B Q b , proceed to Step 3; otherwise, X B = ϕ , and proceed to Step 2. Step 3: Define W C as the set of all unallocated demand nodes; define F P b as the current total amount of relief allocated to the open distribution center b ( b X B ) , and F P b = 0 ; and define J B b j as the set of demand nodes allocated to b ( b X B ) , and J B b j = ϕ . Step 4: Select b ( b X B ) at random. Calculate the distance q b j , j ( j W C ) . Sort unallocated demand nodes and place them in a queue in order from smallest to largest in consideration of q b j . Step 5: First, allocate the demand node j ( j W C ) ranked first in the queue, F P b = F P b + d j . If F P b B Q b , j W C , j J B b j , and j = j + 1 ; otherwise, b = b + 1 . Step 6: If W C = ϕ , proceed to Procedure 4; otherwise, proceed to Step 4.
Procedure 4: Determine the delivery method of the demand nodes. Step 1: Define V J B b j as the set of demand nodes to which relief is delivered by vehicle, and define H J B b j as the set of demand nodes to which relief is delivered by helicopter. Step 2: Randomly select b ( b X B ) to obtain the corresponding set J B b j , b X B . Step 3: Randomly select j ( j J B b j ) : (1) if η b j = 1 , j V J B b j , else, j H J B b j ; and (2) if V T i j r T , j V J B b j ; else, j H J B b j . Step 4: If X B = ϕ , proceed to Procedure 5; otherwise, proceed to Step 2.
Procedure 5: Planning relief delivery solution using the ant colony algorithm (Li, 2004 [59]). Step 1: Randomly select b ( b X B ) to obtain the corresponding sets V J B b j and H J B b j , b X B . Step 2: Optimize the vehicle routes for sets V J B b j and plan the helicopter routes for sets H J B b j . Step 3: If X B = ϕ , proceed to Procedure 6; otherwise, proceed to Step 1.
Procedure 6: Algorithm ending rule. Step 1: Obtain Z T i t e r , which is the maximum time required for the demand node to receive relief in this iteration. Step 2: If Z T i t e r Z T , then Z T = Z T i t e r . Step 3: Compute i t e r = i t e r + 1 . If i t e r M A X i t e r , proceed to Procedure 2; otherwise, end the algorithm and output the optimal solution.

4. Case Study

The Great Wenchuan Earthquake, which occurred in Sichuan Province, China on May 12, 2008, measured 8.0 on the Richter scale. The distribution of relief tents on the first day after the earthquake is studied herein for the 11 areas most severely affected by the disaster (Table 1), and three candidate distribution centers (Table 2) to supply tents. Test data based on Du [3] are used to test the LRP model and HHA. The details of the test data are given as follows:
(1)
Demand node information. The demand nodes include the 11 areas most severely affected by the disaster. The 11 demand nodes are Wenchuan (V1), Mianzhu (V2), Beichuan (V3), Qingchuan (V4), Maoxian (V5), Dujiangyan (V6), Anxian (V7), Pingwu (V8), Pengzhou (V9), Jiangyou (V10), and Deyang (V11). The vulnerability and demand of each node are given in Table 1.
(2)
Candidate distribution center information. The three candidate distribution centers are Chengdu (V12), Mianyang (V13), and Guangyuan (V15). The amount of relief available at each candidate distribution center is shown in Table 2.
(3)
Distribution equipment information. Each candidate distribution center has 10 large trucks, six medium trucks, nine light trucks, and two helicopters. The speed of each mode of transportation is given in Table 3.
(4)
Logistics network information. The topology of the logistics network is illustrated in Figure 1, where Jiange (V14) is a transfer point. The links between nodes in Figure 1 represent the available road. A thicker link indicates that vehicles can travel on the road at a greater speed. Figure 1 shows the road network in Sichuan Province, China (Baidu Map).
(5)
In Table 4, a and b represent the distance and maximum allowable speed between nodes, respectively.
The HHA described in Section 3 was programmed in Matlab 2013a. We set M A X i t e r = 1000 , γ = 2 , and T = 8 h. The speed of tent loading/unloading was assumed to be 60 tents per minute.

4.1. Validity of Relief Allocation

The actual allocated amount of tent (AAAT) and loss of each demand node was calculated by our method (OM), the local fair allocation method (LFA) proposed by Chen and Zhao [43], and the proportion allocation method (PA) proposed by Zhang et al. [51]. The results are shown in Table 5. The largest loss of node (LLN), smallest loss of node (SLN), and total loss of all nodes (TLAN) were calculated by using the above three methods. The results are shown in Table 6.
The larger the gap between LLN and SLN, the more unfair the relief allocation is. Table 6 indicates that the smallest gap between LLN (0.0026) and SLN (0.0004) was obtained by OM, followed by PA (LLN = 0.0047, SLN = 0.0001) and LFA (LLN = 0.0089, SLN = 0). These results indicate that OM is more reasonable and effective than the other two methods; OM can produce a more equitable allocation of relief. In addition, OM and PA are global fair allocation methods that consider all demand nodes. However, LFA is a local fair allocation method that first meets the needs of the nodes according to the belongingness of relief. If there is surplus relief after the needs of the local area are met, the surplus relief is transferred to nodes in the other areas. Table 5 and Table 6 show that the loss of nodes obtained by the global fair allocation method is more balanced, whereas the loss of nodes obtained by local fair allocation method is unbalanced. Thus, the global fair allocation method is superior to the local fair allocation method.
TLAN indicates the effectiveness of relief; the smaller the value of TLAN, the greater the utility of relief. Table 6 shows that OM produces the largest utility of relief among the tested methods.

4.2. Fairness of Distribution Time

The tent distribution solution shows that two helicopters, one light truck, one medium truck, and seven large trucks are assigned to the delivery tent (Table 7). The maximum time for a node to receive a tent is 6.73 h. The average time for a node to receive a tent is 3.45 h. 82% of demand nodes have received tents in about 20% of the average time. The fair distribution of tents is effectively guaranteed within the specified time.
The specific distribution routes are shown in Figure 2. From Figure 1 and Figure 2, we can deduce that national and provincial highways should by selected to effectively ensure the distribution of relief after an earthquake because these highways can guarantee the passage of vehicles and can shorten the distribution time. When the road to a demand node is difficult for a vehicle to pass, helicopters should be assigned to deliver relief. In fact, roads in affected areas are often damaged to some extent by earthquakes. This also highlights the need for multimodal relief delivery after earthquakes.
The data in Tables 5.4 and 5.7 in Du [3] were adopted as the actual allocated amount of relief. The actual allocated amount of relief is the product of the relief amount in Table 5.4 and the demand satisfaction rates under three solutions of each node in Table 5.7. The loading/unloading speed of mineral water was assumed to be 60 boxes per minute. In addition, Table 2, Table 3 and Table 4 and Figure 1 were employed to calculate the maximum time required for demand node to received relief by the HHA proposed in this paper. The results obtained by the HHA and NSGA-II algorithms for the three solutions proposed by Du [3] are shown in Table 8.
Table 8 shows that HHA is better than NSGA-II. With respect to the maximum time required for demand node to received relief, HHA is able to save 15% compared to NSGA-II at least, or even 37% at most. This is attributed to the fact that the model proposed by Du [3] considered the distribution cost. Thus, several light trucks were assigned to deliver relief. Although the cost of a light truck is cheaper than the costs of other trucks, its speed of travel is slower, leading to a relatively long distribution time. In addition, for disconnected nodes, helicopters are also used to deliver relief in this paper, effectively shortening the delivery time. In the early days after an earthquake, relief must be delivered to the demand nodes in the shortest possible time to effectively save people’s lives and treat the wounded. Thus, the distribution tool with the fastest speed should be assigned to deliver relief, and helicopters should be used in extreme cases.
Assuming that the parameters remain unchanged, we expanded the example of the candidate distribution centers and demand nodes to test the running time of HHA in this paper (run environment: CPU AMD A8-4500M 1.90GHz, RAM 4GB). The results in Table 9 show that the running time of HHA is relatively short. HHA can quickly obtain a reasonable relief distribution solution.

4.3. Managerial Implications

Earthquakes are a kind of natural hazard that occurs suddenly, causing great destruction, and often leading to serious casualties. After the earthquake, the disaster areas urgently need a large amount of emergency relief. In the early stages after an earthquake, it is difficult to distribute emergency supplies from outside the disaster area to demand nodes in a short period of time. At the same time, prepositioned relief in the disaster areas usually cannot meet the total need for all the demand nodes.
Psychology, prospect theory and behavioral science should be introduced into the research of relief allocation and distribution. At present, the situation related to relief allocation and distribution is usually published on the Internet in real time. Those affected by the disaster are physically and mentally vulnerable. Thus, if the relief is distributed inequitably, the victims will always want to make up the gap between themselves and the areas with the minimum loss due to the limited rationality of human beings. Thus, a “bandwagon effect” is generated. The “bandwagon effect” may arouse victims’ anger and even cause mass incidents, leading to serious consequences, for example, relief looting incidents in disaster areas. Therefore, relief distribution should put people first, and the emergency supplies must be dealt out and distributed fairly in the early stages after an earthquake.
The road network may be destroyed to a certain extent after an earthquake. In extreme cases, roads are badly damaged and it is difficult for vehicles to travel. Distribution planning of relief should be carried out reasonably according to road conditions. Multiple distribution tools should be used for relief distribution according to the actual situation of affected areas after the earthquake. To delivery vital relief to affected areas, the distribution tool with fastest speed should be assigned to deliver relief (for example, helicopters).

5. Conclusions

Focusing on the shortage of relief in a disaster area in the early post-earthquake stage, LRP was studied from the perspective of fairness. Urgent window constraints, partial road damage, multimodal relief delivery, disaster severity, and the vulnerability of each demand node when its demand is unsatisfied were considered in order to develop a multi-objective model for fair LRP using the lexicographic order object optimal method. The goals of the LRP model were to (1) minimize the maximum loss of demand nodes, which is the index of fair allocation of relief, (2) minimize the total loss of all nodes, which is the index of relief utility, and (3) minimize the maximum time required for demand nodes to receive relief. The HHA was proposed to solve the model. Finally, the feasibility and validity of the model and the HHA were demonstrated by camp distribution in the first day after the Wenchuan earthquake in China. The proposed approaches not only quickly solve the relief distribution program in the prescribed period after the earthquake, but also take fairness and utility into consideration.
Further research will consider the dynamic scheduling of emergency vehicles, coordination among emergency vehicles, and big data in humanitarian supply chain management. For example, humanitarian organizations need information to effectively execute their task. The concerns identified for big data in humanitarian supply chain management are humanitarian logistics, remote sensing, information security, social media, and so on (Gupta et al. [39], Masuya et al. [60]). In particular, big data analytics capability could enhance trust and collaborative performance between civil and military organizations engaged in disaster relief operations (Dubey et al. [61]).

Author Contributions

Conceptualization, C.L. and Y.P.; methodology, G.K.; software, C.L.; validation, C.L., Y.P. and F.A.; formal analysis, C.L.; resources, F.A.; writing—original draft preparation, C.L. and Y.P.; writing—review and editing, G.K. and F.A.; funding acquisition, G.K. and Y.P.

Funding

This research was funded by the National Natural Science Foundation of China (#71725001, and #71471149), the National Natural Science Foundation Hunan Province of China (#2019JJ40147), the Hunan Social Science Achievements Appraisal Committee Foundation of China (#GLX235), the Hunan Social Science Foundation of China (#18YBA267) and the Project of Education Department of Hunan Province of China (#18A297, and #17C0881).

Conflicts of Interest

The authors declare no conflict of interest. The funders had no role in the design of the study; in the collection, analyses, or interpretation of data; in the writing of the manuscript, or in the decision to publish the results.

References

  1. Caunhye, A.M.; Zhang, Y.; Li, M.Z.; Nie, X.F. A location-routing model for prepositioning and distributing emergency supplies. Transp. Res. E Log. Transp. Rev. 2016, 90, 161–176. [Google Scholar] [CrossRef]
  2. Bozorgi-Amiri, A.; Jabalameli, M.S.; Al-e-Hashem, S.M. A multi-objective robust stochastic programming model for disaster relief logistics under uncertainty. OR Spectr. 2013, 35, 905–933. [Google Scholar] [CrossRef]
  3. Du, L.J. Multi-Objective Optimization of Relief Distribution in Emergency; Huazhong University of Science and Technology: Wuhan, China, 2015. (In Chinese) [Google Scholar]
  4. Peng, M.; Peng, Y.; Cheng, H. Post-seismic supply chain risk management: A system dynamics disruption analysis approach for inventory and logistics planning. Comput. Oper. Res. 2014, 42, 14–24. [Google Scholar] [CrossRef]
  5. Yi, W.; Ozdamar, L. A dynamic logistics coordination model for evacuation and support in disaster response activities. Eur. J. Oper. Res. 2007, 179, 1177–1193. [Google Scholar] [CrossRef]
  6. Sheu, J.B. An emergency logistics distribution approach for quick response to urgent relief demand in disasters. Transp. Res. E Log. Transp. Rev. 2007, 43, 687–709. [Google Scholar] [CrossRef]
  7. Mete, H.O.; Zabinsky, Z.B. Stochastic optimization of medical supply location and distribution in disaster management. Int. J. Prod. Econ. 2010, 126, 76–84. [Google Scholar] [CrossRef]
  8. Vitoriano, B.; Ortuno, M.T.; Tirado, G.; Montero, J. A multi-criteria optimization model for humanitarian aid distribution. J. Glob. Optim. 2011, 51, 189–208. [Google Scholar] [CrossRef]
  9. Dai, Y.; Ma, Z.J.; Zhu, D.L.; Fang, T. Fuzzy dynamic location-routing problem in post-earthquake delivery of relief materials. J. Manag. Sci. China 2012, 15, 212–218. (In Chinese) [Google Scholar]
  10. Li, S.L.; Ma, Z.J.; Zhen, B.; Dai, Y. Fuzzy multi-objective location-multimodal transportation problem for relief delivery during the initial post-earthquake period. Chin. J. Manag. Sci. 2013, 21, 144–151. (In Chinese) [Google Scholar]
  11. Wang, H.J.; Du, L.J.; Ma, S.H. Multi-objective open location-routing model with split delivery for optimized relief distribution in post-earthquake. Transp. Res. E Log. Transp. Rev. 2014, 69, 160–179. [Google Scholar] [CrossRef]
  12. Ruan, J.H.; Wang, X.P.; Yang, T. A Clustering-Based Approach for Medical Supplies Intermodal Transportation in Large-Scale Disasters. Chin. J. Manag. Sci. 2014, 22, 80–89. (In Chinese) [Google Scholar]
  13. Ma, Z.J.; Dai, Y.; Li, S.L. Fuzzy multi-objective open location-routing problem with deadlines in post-earthquake relief deliveries. J. Syst. Manag. 2014, 23, 658–667. (In Chinese) [Google Scholar]
  14. Rath, S.; Gutjahr, W. A math-heuristic for the warehouse location–routing problem in disaster relief. Comput. Oper. Res. 2014, 42, 25–39. [Google Scholar] [CrossRef]
  15. Rennemo, S.J.; Ro, K.F.; Hvattum, L.M.; Tirado, G. A three-stage stochastic facility routing model for disaster response planning. Transp. Res. E Log. Transp. Rev. 2014, 62, 116–135. [Google Scholar] [CrossRef] [Green Version]
  16. Ahmadi, M.; Seifi, A.; Tootooni, B. A humanitarian logistics model for disaster relief operation considering network failure and standard relief time: A case study on San Francisco district. Transp. Res. E Log. Transp. Rev. 2015, 75, 145–163. [Google Scholar] [CrossRef]
  17. Liu, C.S.; Peng, Y.; Kou, G. Research on fuzzy location-routing problem in post-earthquake delivery of relief materials. Chin. J. Manag. Sci. 2016, 24, 111–118. (In Chinese) [Google Scholar]
  18. Moreno, A.; Alem, D.; Ferreira, D. Heuristic approaches for the multi-period location-transportation problem with reuse of vehicles in emergency logistics. Comput. Oper. Res. 2016, 69, 79–96. [Google Scholar] [CrossRef]
  19. Sharma, B.; Ramkumar, M.; Subramanian, N.; Malhotra, B. Dynamic temporary blood facility location-allocation during and post-disaster periods. Ann. Oper. Res. 2017, 1–32. [Google Scholar] [CrossRef]
  20. Kim, S.; Ramkumar, M.; Subramanian, N. Logistics service provider selection for disaster preparation: A socio-technical systems perspective. Ann. Oper. Res. 2018, 1–24. [Google Scholar] [CrossRef]
  21. Zhang, B.; Li, H.; Li, S.G.; Peng, J. Sustainable multi-depot emergency facilities location-routing problem with uncertain information. Appl. Math. Comput. 2018, 333, 506–520. [Google Scholar] [CrossRef]
  22. Alinaghian, M.; Aghaie, M.; Sabbagh, M.S. A mathematical model for location of temporary relief centers and dynamic routing of aerial rescue vehicles. Comput. Oper. Res. 2019, 131, 227–241. [Google Scholar] [CrossRef]
  23. Maya Duque, P.A.; Dolinskaya, I.S.; Sorensen, K. Network repair crew scheduling and routing for emergency relief distribution problem. Eur. J. Oper. Res. 2016, 248, 272–285. [Google Scholar] [CrossRef]
  24. Celik, M. Network restoration and recovery in humanitarian operations: Framework, literature review, and research directions. Surv. Oper. Res. Manag. Sci. 2016, 21, 47–61. [Google Scholar]
  25. Li, G.X.; Kou, G.; Peng, Y. A group decision making model for integrating heterogeneous information. IEEE Trans. Syst. Man. Cybern. A 2018, 48, 982–992. [Google Scholar] [CrossRef]
  26. Kou, G.; Chao, X.; Peng, Y.; Alsaadi, F.E.; Herrera-Viedma, E. Machine learning methods for systemic risk analysis in financial sectors. Technol. Econ. Dev. Econ. 2019, 1–27. [Google Scholar] [CrossRef]
  27. Akbari, V.; Salman, F.S. Multi-vehicle synchronized arc routing problem to restore post-disaster network connectivity. Eur. J. Oper. Res. 2017, 257, 625–640. [Google Scholar] [CrossRef]
  28. Vahdani, B.; Veysmoradi, D.; Shekari, N.; Mousavi, S.M. Multi-objective, multi-period locationrouting model to distribute relief after earthquake by considering emergency roadway repair. Neural Comput. Appl. 2018, 30, 835–854. [Google Scholar] [CrossRef]
  29. Li, S.L.; Teo, K.L. Post-disaster multi-period road network repair: Work scheduling and relief logistics optimization. Ann. Oper. Res. 2018. [Google Scholar] [CrossRef]
  30. Starr, M.K.; Van Wassenhove, L.N. Introduction to the Special Issue on Humanitarian Operations and Crisis Management. Prod. Oper. Manag. 2014, 23, 925–937. [Google Scholar] [CrossRef]
  31. Chao, X.; Kou, G.; Peng, Y.; Alsaadi, F.E. Behavior monitoring methods for trade-based money laundering integrating macro and micro prudential regulation: A case from China. Technol. Econ. Dev. Econ. 2019, 1–16. [Google Scholar] [CrossRef]
  32. Zhang, H.H.; Kou, G.; Peng, Y. Soft consensus cost models for group decision making and economic interpretations. Eur. J. Oper. Res. 2019, 277, 964–980. [Google Scholar] [CrossRef]
  33. Altay, N.; Gunasekaran, A.; Dubey, R.; Childe, S.J. Agility and resilience as antecedents of supply chain performance under moderating effects of organizational culture within the humanitarian setting: A dynamic capability view. Prod. Plan. Control 2018, 29, 1158–1174. [Google Scholar] [CrossRef]
  34. Alhassany, H.; Faisal, F. Factors influencing the internet banking adoption decision in North Cyprus: An evidence from the partial least square approach of the structural equation modeling. Financ. Innov. 2018, 4, 29. [Google Scholar] [CrossRef]
  35. Selvamuthu, D.; Kumar, V.; Mishra, A. Indian stock market prediction using artificial neural networks on tick data. Financ. Innov. 2019, 5, 16. [Google Scholar] [CrossRef] [Green Version]
  36. Tatham, P.; Spens, K.; Kovács, G. The humanitarian common logistic operating picture: A solution to the inter-agency coordination challenge. Disasters 2017, 41, 77–100. [Google Scholar] [CrossRef]
  37. Nayak, S.C.; Misra, B.B. Estimating stock closing indices using a GA-weighted condensed polynomial neural network. Financ. Innov. 2018, 4, 21. [Google Scholar] [CrossRef]
  38. Challa, M.L.; Malepati, V.; Kolusu, S.N.R. Forecasting risk using auto regressive integrated moving average approach: An evidence from S&P BSE Sensex. Financ. Innov. 2018, 4, 24. [Google Scholar]
  39. Gupta, S.; Altay, N.; Luo, Z. Big data in humanitarian supply chain management: A review and further research directions. Ann. Oper. Res. 2017, 1–21. [Google Scholar] [CrossRef]
  40. Xue, K.; Feng, C. Local distribution of emergency supplies with equity concerning. Syst. Eng. 2015, 33, 103–107. (In Chinese) [Google Scholar]
  41. Song, Y.; Wang, H.; Zhu, M. Sustainable strategy for corporate governance based on the sentiment analysis of financial reports with CSR. Financ. Innov. 2018, 4, 2. [Google Scholar] [CrossRef]
  42. Ahmed, I.; Socci, C.; Severini, F.; Yasser, Q.R.; Pretaroli, R. Forecasting investment and consumption behavior of economic agents through dynamic computable general equilibrium model. Financ. Innov. 2018, 4, 7. [Google Scholar] [CrossRef] [Green Version]
  43. Chen, Y.Z.; Zhao, Q.H. The model and algorithm for emergency supplier distribution based on fairness. Syst. Eng. Theory Pract. 2015, 35, 3065–3073. (In Chinese) [Google Scholar]
  44. An, L.L. Research on Allocation Strategy of First Batch of Emergency Materials after Disasters: A Case Study on Earthquake Emergency Logistics System; South China University of Technology: Guangzhou, China, 2010. (In Chinese) [Google Scholar]
  45. Wang, X.P.; Dong, L.; Chen, M.T. Multiple-area Post-disaster Resource Distribution Model Considering Perception Satisfaction. J. Syst. Manag. 2013, 22, 251–256. (In Chinese) [Google Scholar]
  46. Ge, H.L.; Liu, N.; Zhang, G.C.; Yu, H.H. A model for distribution of multiple emergency commodities to multiple affected areas based on loss of victims of calamity. J. Syst. Manag. 2010, 19, 541–545. (In Chinese) [Google Scholar]
  47. Yu, L.N.; Zhang, C.R.; Yang, H.S.; Miao, L.X. Novel methods for resource allocation in humanitarian logistics considering human suffering. Comput. Ind. Eng. 2018, 119, 1–20. [Google Scholar] [CrossRef]
  48. Cao, C.; Li, C.; Yang, Q.; Liu, Y.; Qu, T. A novel multi-objective programming model of relief distribution for sustainable disaster supply chain in large-scale natural disasters. J. Clean. Prod. 2018, 174, 1422–1435. [Google Scholar] [CrossRef]
  49. Zhen, B.; Ma, Z.J.; Li, S.L. Joint location-transportation problem in relief distribution systems based on bi-level programming. Syst. Sci. Math. Sci. 2013, 33, 1045–1060. (In Chinese) [Google Scholar]
  50. Pang, H.Y.; Liu, N.; Wu, Q. Decision-making model for transportation and distribution of emergency materials and its modified particle swarm optimization algorithm. Control Decis. 2012, 27, 871–874. (In Chinese) [Google Scholar]
  51. Zhang, Y.; Wang, Y.T.; Feng, C. Equitable allocation models in emergency relief supplies. J. Syst. Sci. 2015, 23, 79–83. (In Chinese) [Google Scholar]
  52. Sheng, Q.L. Integration Utility and Fair Distribution; Zhejiang University Press: Hangzhou, China, 2013. (In Chinese) [Google Scholar]
  53. Balinski, M. What Is Just? Am. Math. Mon. 2005, 112, 502–511. [Google Scholar] [CrossRef]
  54. Medernach, E.; Sanlaville, E. Fair resource allocation for different scenarios of demands. Eur. J. Oper. Res. 2012, 218, 339–350. [Google Scholar] [CrossRef]
  55. Pang, H.Y.; Liu, N. Game models for incomplete put-out distribution of emergency relief supplies for natural disasters. J. Zhejiang Univ. Eng. Sci. 2012, 46, 2068–2108. (In Chinese) [Google Scholar]
  56. Du, S.P.; Zhu, J.A.; Gao, D.; Du, C. Optimal decision-making for Nash bargaining fairness concerned newsvendor in two-level supply chain. J. Manag. Sci. China 2013, 16, 68–72. (In Chinese) [Google Scholar]
  57. Huang, M.; Smilowitz, K.; Balcik, B. Models for relief routing: Equity, efficiency and efficacy. Transp. Res. E Log. Transp. Rev. 2012, 48, 2–18. [Google Scholar] [CrossRef]
  58. Campbell, A.M.; Vandenbussche, D.; Hermann, W. Routing for relief efforts. Transp. Sci. 2008, 42, 127–145. [Google Scholar] [CrossRef]
  59. Li, S.Y. Ant Colony Algorithms with Applications; Harbin Institute of Technology Press: Harbin, China, 2004. (In Chinese) [Google Scholar]
  60. .Masuya, A.; Dewan, A.; Corner, R.J. Population evacuation: Evaluating spatial distribution of flood shelters and vulnerable residential units in Dhaka with geographic information systems. Nat. Hazards 2015, 78, 1859–1882. [Google Scholar] [CrossRef]
  61. Dubey, R.; Gunasekaran, A.; Childe, S.J.; Roubaud, D.; Wamba, S.F.; Giannakis, M.; Foropon, C. Big data analytics and organizational culture as complements to swift trust and collaborative performance in the humanitarian supply chain. Int. J. Prod. Econ. 2019, 210, 120–136. [Google Scholar] [CrossRef]
Figure 1. Emergency logistics network for the Wenchuan earthquake.
Sustainability 11 03420 g001
Figure 2. Tent delivery routes.
Sustainability 11 03420 g002
Table 1. Demand and vulnerability of each node.
Demand NodeV1V2V3V4V5V6V7V8V9V10V11
demand amount3458364796915458184391348321557710023199
vulnerability1.71.41.41.41.711.41.711.41
Table 2. Relief available at each candidate distribution center.
Distribution CenterV12V13V15
available tent700040003000
Table 3. Available distribution equipment of each candidate distribution center.
DeviceLarge TruckMedium TruckLight TruckHelicopter
capacity (unit)21006503602000
speed (km/hr)503020500
Table 4. Distance and maximum allowable speed between nodes.
Link(a, b)Link(a, b)Link(a, b)Link(a, b)
V1–V5(39, 24)V1–V6(78, 29)V2–V6(85, 32)V2–V7(48, 48)
V2–V9(55, 27)V2–V11(36, 38)V2–V13(88, 46)V3–V5(89, 22)
V3–V7(37, 45)V3–V8(131, 26)V3–V10(48, 38)V3–V11(85, 35)
V4–V5(251, 27)V4–V8(116, 30)V4–V10(155, 47)V4–V14(120, 34)
V4–V15(145, 52)V5–V8(211, 24)V5–V9(41, 44)V5–V10(131, 22)
V6–V9(35, 37)V6–V12(59, 47)V7–V10(48, 48)V7–V13(17, 43)
V8–V10(120, 29)V8–V14(146, 40)V9–V12(41, 44)V10–V13(46, 64)
V10–V14(105, 50)V11–V12(74, 53)V11–V13(53, 60)V13–V14(185, 52)
V14–V15(127, 64)
Table 5. AAAT and the loss of each demand node.
NodeV1V2V3V4V5V6V7V8V9V10V11
LFAAAAT199424069699734722531348202433410032224
loss0.00890.005300.00110.00050.000100.00590.000100.0023
PAAAAT23952526671107056630493322264006942215
loss0.00470.00430.00030.00080.00030.00010.00060.00410.00010.00030.0024
MAAAT2706277160410704593093324331556242215
loss0.00240.00260.00050.00080.00050.00040.00060.00250.00040.00050.0024
Table 6. Results obtained by different allocation methods.
Allocation MethodLLNSLNTLAN
LFA0.008900.0243
PA0.00470.00010.0178
OM0.00260.00040.0136
Table 7. Tent delivery solution.
Distribution CenterRoute (Delivery Device, Delivery Time)Maximum Time
V12V12–V1 (2 helicopters, 3.6 h)3.62 h
V12–V9–V5 (1 medium truck, 3.62 h)
V12–V6 (1 light truck, 2.96 h)
V12–V11 (1 large truck, 2.6 h)
V12–V11–V2 (1 large truck, 3.35 h)
V13V13–V7–V3 (1 large truck, 2.53 h)5.48 h
V13–V10–V8 (1 large truck, 5.48 h)
V13–V11–V2 (1 large truck, 3.54 h)
V15V15–V4 (1 large truck, 6.73 h)6.73 h
V15–V14–V8 (1 large truck, 3.54 h)
Table 8. Results of HHA and NSGA-II algorithms for three solutions.
Test MethodSolution 1Solution 2Solution 3
HHANSGA-IIHHANSGA-IIHHANSGA-II
maximum time (hours)6.447.612.4719.97.879.3
Table 9. Running time of test cases.
CaseCandidate Distribution CentersDemand NodesRunning Time (Seconds)
131111.84
234026.72
345039.95
457053.16
568068.63

