Article

Semi-Continuous Anaerobic Digestion of Orange Peel Waste: Effect of Activated Carbon Addition and Alkaline Pretreatment on the Process

1
Dipartimento di Ingegneria Civile, Università Mediterranea di Reggio Calabria, dell’Energia, dell’Ambiente e dei Materiali, Reggio Calabria IT 89122, Italy
2
Department of Environmental Engineering, Democritus University of Thrace, GR 67100 Xanthi, Greece
*
Authors to whom correspondence should be addressed.
Sustainability 2019, 11(12), 3386; https://doi.org/10.3390/su11123386
Submission received: 17 May 2019 / Revised: 7 June 2019 / Accepted: 13 June 2019 / Published: 19 June 2019
(This article belongs to the Special Issue Advances in Biorefining of Biowaste)

Abstract

:
The valorization of orange peel waste (OPW) is sought worldwide mainly via anaerobic digestion. A common problem encountered during the biological treatment is the seasonality of its production and the presence of d-Limonene. The latter is a typical anti-microbial compound. This work aims to evaluate the effect of the use of granular activated carbon (GAC) combined with alkaline pretreatment to enhance methane generation during semi-continuous anaerobic digestion of OPW. The experimental design consisted of two groups of experiments, A and B. Experiment A was designed to verify the maximum OPW loading and to assess the effect of pH and nutrients on the process. Experiment B was designed to study the effect of alkaline pretreatment alone and of alkaline pretreatment aided by biochar addition to the process. Apart from the methane yields, the d-Limonene contents were measured in all experiments. The preliminary results showed that OPW alkaline pretreatment after the addition of a moderate amount of GAC can render anaerobic digestion of OPW sustainable as long as the organic loading does not exceed 2 gVS·L−1·day−1 and nutrients are supplemented. The experiment in which GAC was added after alkaline pretreatment resulted in the highest methane yield and reactor stability.

1. Introduction

Orange peel waste (OPW) is produced in large quantities in many parts of the world [1,2,3] but a fully sustainable solution for its valorization has not been found until now.
Currently, part of OPW produced is used as animal feed. However, in many parts of the world, uncontrolled dumping near production sites is common, leading to malodors and water and soil pollution [4,5,6,7].
A promising solution is to use OPW as a substrate for anaerobic digestion. However, problems linked to the seasonality of its production and to the presence of d-Limonene, a well-known anti-microbial agent, must be resolved first. A conventional solution is to co-digest OPW with other substrates. However, this option is not practical when large quantities of this residue must be managed.
Although the potential for the application of anaerobic digestion of OPW is high, literature is not abundant, especially for experiments carried out in continuous/semi-continuous mode and in mesophilic conditions [4,8,9,10]. As previously reported, citrus peel has an inhibitory effect on anaerobic digestion due to the presence of essential oils and in particular to d-Limonene. Indeed, Zema et al. [4] employed orange peel waste for semi-continuous mesophilic tests and found that the process was stable at a loading of 1 gVS·L−1·d−1. Increasing loading, a partial inhibition was detected at 2 gVS·L−1·d−1, while the process stopped at 2.5 gVS·L−1·d−1. Methane yield was 0.46 NL·gVS−1 with sludge retention times (SRTs) between 23 and 70 days.
According to the review of Ruiz and Flotats [11], analysing existing literature has found that the maximum dosage of limonene for a stable anaerobic digestion process ranges from 24 to 192 mg of citrus essential oil per liter of digester and day. Zema et al. [4], in the experiment already cited, found that the inhibition begun when essential oil (EO) loading was increased from about 48 to about 90 mg·L−1·d−1. Calabrò et al. [1], in batch experiments, found that slight inhibition occurred when 250–500 mg·L−1 of d-Limonene were added in the reactor and that a significant degradation of it was detected after 15–18 days of digestion. Several approaches have been investigated in order to overcome this issue, namely: acclimation of bacterial cells, adopting thermophilic operating conditions and reducing the concentration of the inhibitors either by dilution or co-digestion with other substrates [11]. However, since the inhibitor is not removed from the process, the destabilization of the anaerobic digestion (AD) system can occur [11] due to its accumulation and eventually due to the presence of metabolic intermediates of the substrate (such as long chain fatty acids, ammonia, limonene, heavy metals and phenols [12]) that are as inhibitory to microbial activity as d-Limonene itself [10,11,12].
Other methods for sustainable OPW digestion (e.g., steam distillation [9]) focusing on d-Limonene reduction have also been studied [3,13,14]. Martin et al. [9] working using treated OPW (d-Limonene removal 70%) observed process stability up to loadings of 3.0–3.5 gVS·L−1·d−1 and registered a methane yield of 0.23 NL·gVS−1 with an SRT of 25 days. However, pretreatment methods are often expensive, thus making the overall process not economically sustainable. Another option consists of the reduction of contaminants or toxic compounds by using carbonaceous sorbents [15], such as graphite, graphene, biochar, activated carbon, carbon cloth and nanotubes, maghemite and magnetite carbons capable of adsorbing chemicals onto their surface [16].
Biochar is produced during thermal treatment (mainly by pyrolysis process) of lignocellulosic biomass in the partial or total absence of oxygen. During this process, the volatilization of the organic matter increases, the pore sizes enlarge and the structure of the biomass is rearranged [17]. These pores (distinguished in micropores, mesopores and macropores [15]) allow the adsorption of contaminants thus reducing the mobility and bioavailability of potential toxic chemicals [14].
Biochar is structurally similar to activated carbon [14], which has been used in this study. Compared to activated carbon, biochar is produced at a lower temperature (<700 °C) without any form of activation [18]. This means that the production on activated carbon is more expensive. On the other hand, the surface area of the biochar is less efficient (less porous) than that of activated carbon [19].
Due to these characteristics, the use of granular activated carbon (GAC) during anaerobic digestion of citrus peel waste could be a suitable approach for the stabilization of the process [14].
GAC, similarly to biochar, could have a positive impact on the operational stability of the AD process [20] because there are indications that it can adsorb monoterpene compounds [21], heavy metals and other organic compounds like pesticides, furfural and limonene [21,22,23]. From this point of view, the application of an adsorbent such as GAC represents an innovative way to remove and to reduce the effect of the inhibitory compounds during AD [15].
Moreover, the surface of adsorbent materials may be colonized by microorganisms [24] able to metabolize the material trapped within the pores of the adsorbent [15]. The immobilization of microbial communities (i) facilitates interspecies electron transfer [25], (ii) allows for the acclimation of the microbial cell [13,15,26] and (iii) reduces the distance between syntrophic bacteria and methanogens, increasing the oxidation of volatile fatty acids (VFAs) and hydrogen production [27,28]. The electron transfer also promote VFAs conversion to CH4 [29].
From an energetic point of view, Fagbohungbe et al. [14] observed an enhancement of methane production from 163.9 to 186.8 mL CH4·g VS−1 when biochar was added during the AD of citrus peel waste. Peng et al. [30] found that CH4 yield increased by 13.1% and 20% through the additions of GAC and magnetic GAC, respectively. Martínez et al. [31] observed an increase in methane yields of approximately 33% when 10 g·L−1 of biochar was added and 56% when 30 g·L−1 was added. Under semi-continuous digestion, an improvement in methane yields of approximately 60% was observed at a hydraulic retention time (HRT) of 30–20 days (reaching methane production values above 500 LCH4·kgVS−1 at an organic loading rate (OLR) of 1.49 kgVS·m−3·d−1).
In summary, the use of adsorbent leads to a reduction of the lag phase [20] and to a higher production of methane [14] by the sorption of inhibitors, the increasing of the buffering capacity of the system [15] and other phenomena.
In this paper, semi-continuous anaerobic digestion experiments, designated as Experiments A, B1 and B2, respectively, are presented. In Experiment A, the effect of pH and nutrients on the sustainable OPW loading is analysed. In Experiments B1 and B2, the effect of granular activated carbon (GAC) use and of alkaline pretreatment on OPW digestion is assessed.

2. Materials and Methods

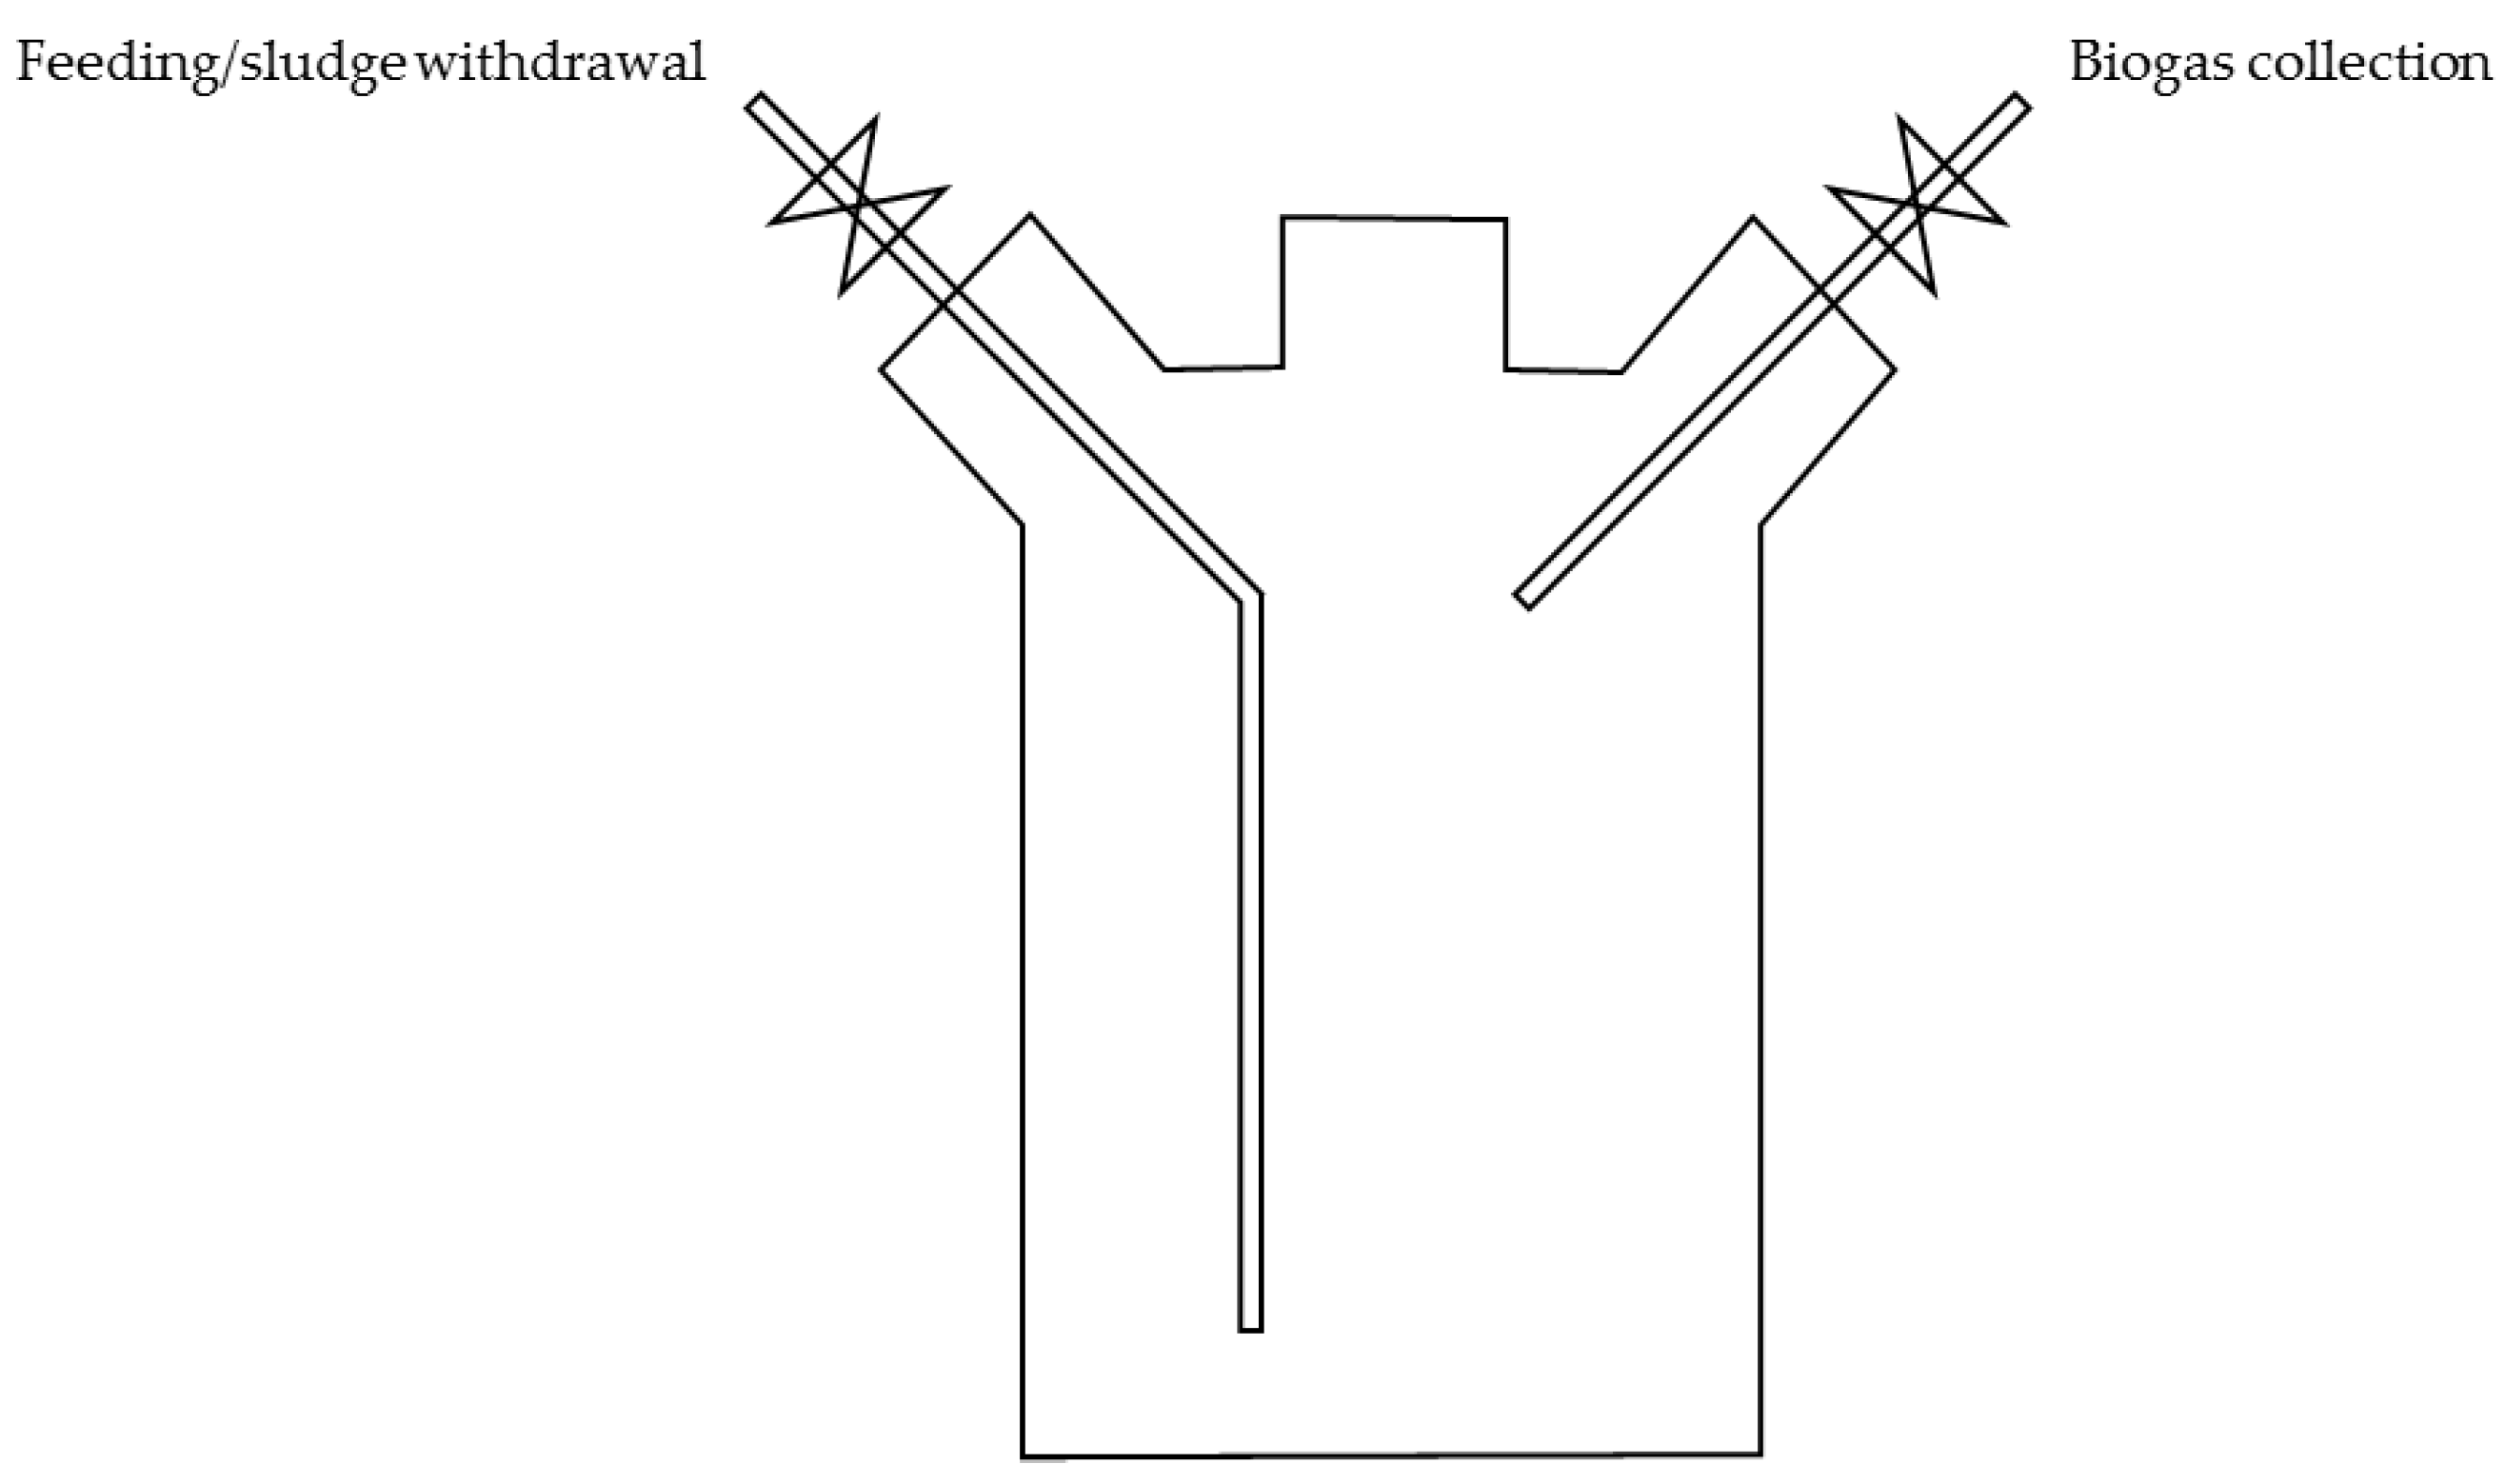
2.1. Semi-Continuous Reactor Setup

Semi-continuous reactors (three-neck bottles, volume 1.1 L, WTW-Germany, equipped with valves allowing biogas collection and feeding/sludge withdrawal, Figure 1) were placed in a thermostatic cabinet at 35 ± 0.5 °C and mixed by a magnetic stirrer throughout the test period.
Two or three times per week, a biogas measurement was carried out by a water displacement method [1,5,32] adapted to this specific experimental setup. The produced biogas was slowly transferred into a second bottle (alkaline trap) containing 0.8 L of a 3M NaOH solution using a 100 mL syringe. Through a side opening of the second bottle, a tube allowed the transfer of biogas via the syringe. The carbon dioxide present in the biogas was absorbed into the alkaline solution. The pressure increase in the alkaline trap provoked the displacement of a certain volume of that alkaline solution that was transferred by a tube connected to another side opening of the bottle to a graduated volumetric cylinder. The total volume of the alkaline solution displaced by the gas was considered equal to the volume of methane present in the biogas. The volume of carbon dioxide was, therefore, calculated by the difference of the methane volume from the total biogas volume [1,2].

2.2. Substrates, Inocula and Additives

The substrate used was a lyophilized OPW collected from an orange processing industry in Sicily (Table 1). Lyophilization allows to preserve as much as possible the characteristics of OPW and thus to ensure the stability of the substrate for the whole experiment. In Experiments B1 and B2 (Table 2), in order to reduce d-Limonene concentration and to increase buffering capacity [2], lyophilized OPW was subjected to an alkaline pretreatment using NaOH (5% TS, 50% NaOH solution, Sigma-Aldrich) at room temperature for 24 h [33,34,35].
D-Limonene was extracted from substrates by mixing for two hours 0.3 g of lyophilized sample with 3 mL of a solution of Toluene (Sigma-Aldrich, St. Louis, MO, USA) and cyclohexane (0.1 M, Sigma-Aldrich) used as internal standard. The liquid obtained was then injected into a gas chromatograph (Agilent 6890, Santa Clara, CA, USA) equipped with a wide-bore capillary column and a flame ionization detector (FID). The capillary column was a J&W DB-WAXetr 50 m × 320 mm × 1 mm and the gas carrier was nitrogen with a flow rate of 10 mL/min. The injector was settled at 250 °C. The temperature program started at 50 °C, held for 8 min, the temperature was raised to 230 °C at 5 °C/min, held for 2 min, raised to 240 °C and held for 4 min during the post run [35].
In Experiment B2, GAC was also added (CARBOSORB 2040-20 × 40 mesh, Comelt srl, Milan, Italy) at the beginning of the experiment (2% of the operational volume, 8.0 g) and then with the substrate.
The inoculum used in the experiments was a liquid digestate obtained from a full-scale plant treating manure and various residues from the agro-industry. It was sieved to remove fibrous materials (e.g., straw) and then kept in anaerobic conditions in an oven at 35 °C before the experiments to reduce as much as possible of the non-specific biogas production. In Experiment A, NaHCO3 was added several times during the experiment to increase the pH and to provide buffering capacity. Since the C/N of the OPW was about 51, a nutrient solution compliant with the UNI/TS 11703:2018 norm recently introduced in Italy was periodically added to reduce the C/N ratio. The norm includes the use of three different nutrients solutions defined as Solutions A, B and C. Solution A contains specified quantities of KH2PO4, Na2HPO4·12H2O, NH4Cl and distilled water. The amount to be used was assessed to supplement nitrogen present in OPW so as to reach a C/N in the feed of about 30. Solution B contains CaCl2·2H2O, MgCl2·6H2O, FeCl2·4H2O and distilled water and the amount to be used is the same as Solution A. Solution C contains MnCl2·4H2O, H3BO3, ZnCl2, CuCl2, Na2MoO4·2H2O, CoCl2·6H2O, NiCl2·6H2O, Na2SeO3 and distilled water and the amount to be used is 1/5 of the volume of Solution A.

2.3. Experimental Design

During Experiment A, designed to verify the maximum OPW loading applicable to the process, after 14 days of acclimation, the substrate loading (Table 1, Figure 2) was set to 1 gVS·L−1·day−1 (corresponding to an HRT of 46.3 days and to about 3.1 mgd-Limonene·L−1·day−1) and then to 2 gVS·L−1·day−1 (HRT equal to 23.1 days, 6.2 mgd-Limonene·L−1·day−1). Due to pH reduction, 2 g and 4 g of NaHCO3 were added on days 52 and 56, respectively. Since pH stabilization and the biogas production achieved were unsatisfactory, nutrients Solutions B and C were added on day 63 and Solution A on day 70. The experiment was terminated due to excessive pH reduction on day 100.
Experiment B was designed to assess if, reducing HRT to 13 days, whether the adoption of a chemical (alkaline) pretreatment at a higher loading was sustainable and if GAC addition could aid the process. During this experiment, two bottles (B1 and B2) were prepared. The only difference was the presence of 2% GAC in bottle B2. GAC was supplied with the substrate at each loading so as to try keeping its concentration constant. In this experiment, due to the necessity of preparing pretreated substrate, feeding was reduced to twice a week. HRT was kept equal to 13 days, similar to that used in many full-scale plants fed with agro-industrial residues.
The loading (Figure 3) was gradually increased from 0.5 gVS·L−1·day−1 for days 1–3 to 1 gVS·L−1·day−1 (days 4–11, corresponding to about 1.3 mgd-Limonene·L−1·day−1) and finally to 2 gVS·L−1·day−1 (corresponding to about 2.6 mgd-Limonene·L−1·day−1). In this case, days 1–11 were also considered an acclimation period to allow the adaptation of the inoculum to the substrate. On day 45, feeding was suspended for the summer closing of the laboratory and for 11 days reactors worked as batches. Nutrient solutions were added every two weeks.
Total, volatile solids, buffering capacity and pH were measured according to standard methods [36]. During Experiment B, total volatile fatty acids (VFA) were measured by a three points titration method [37].

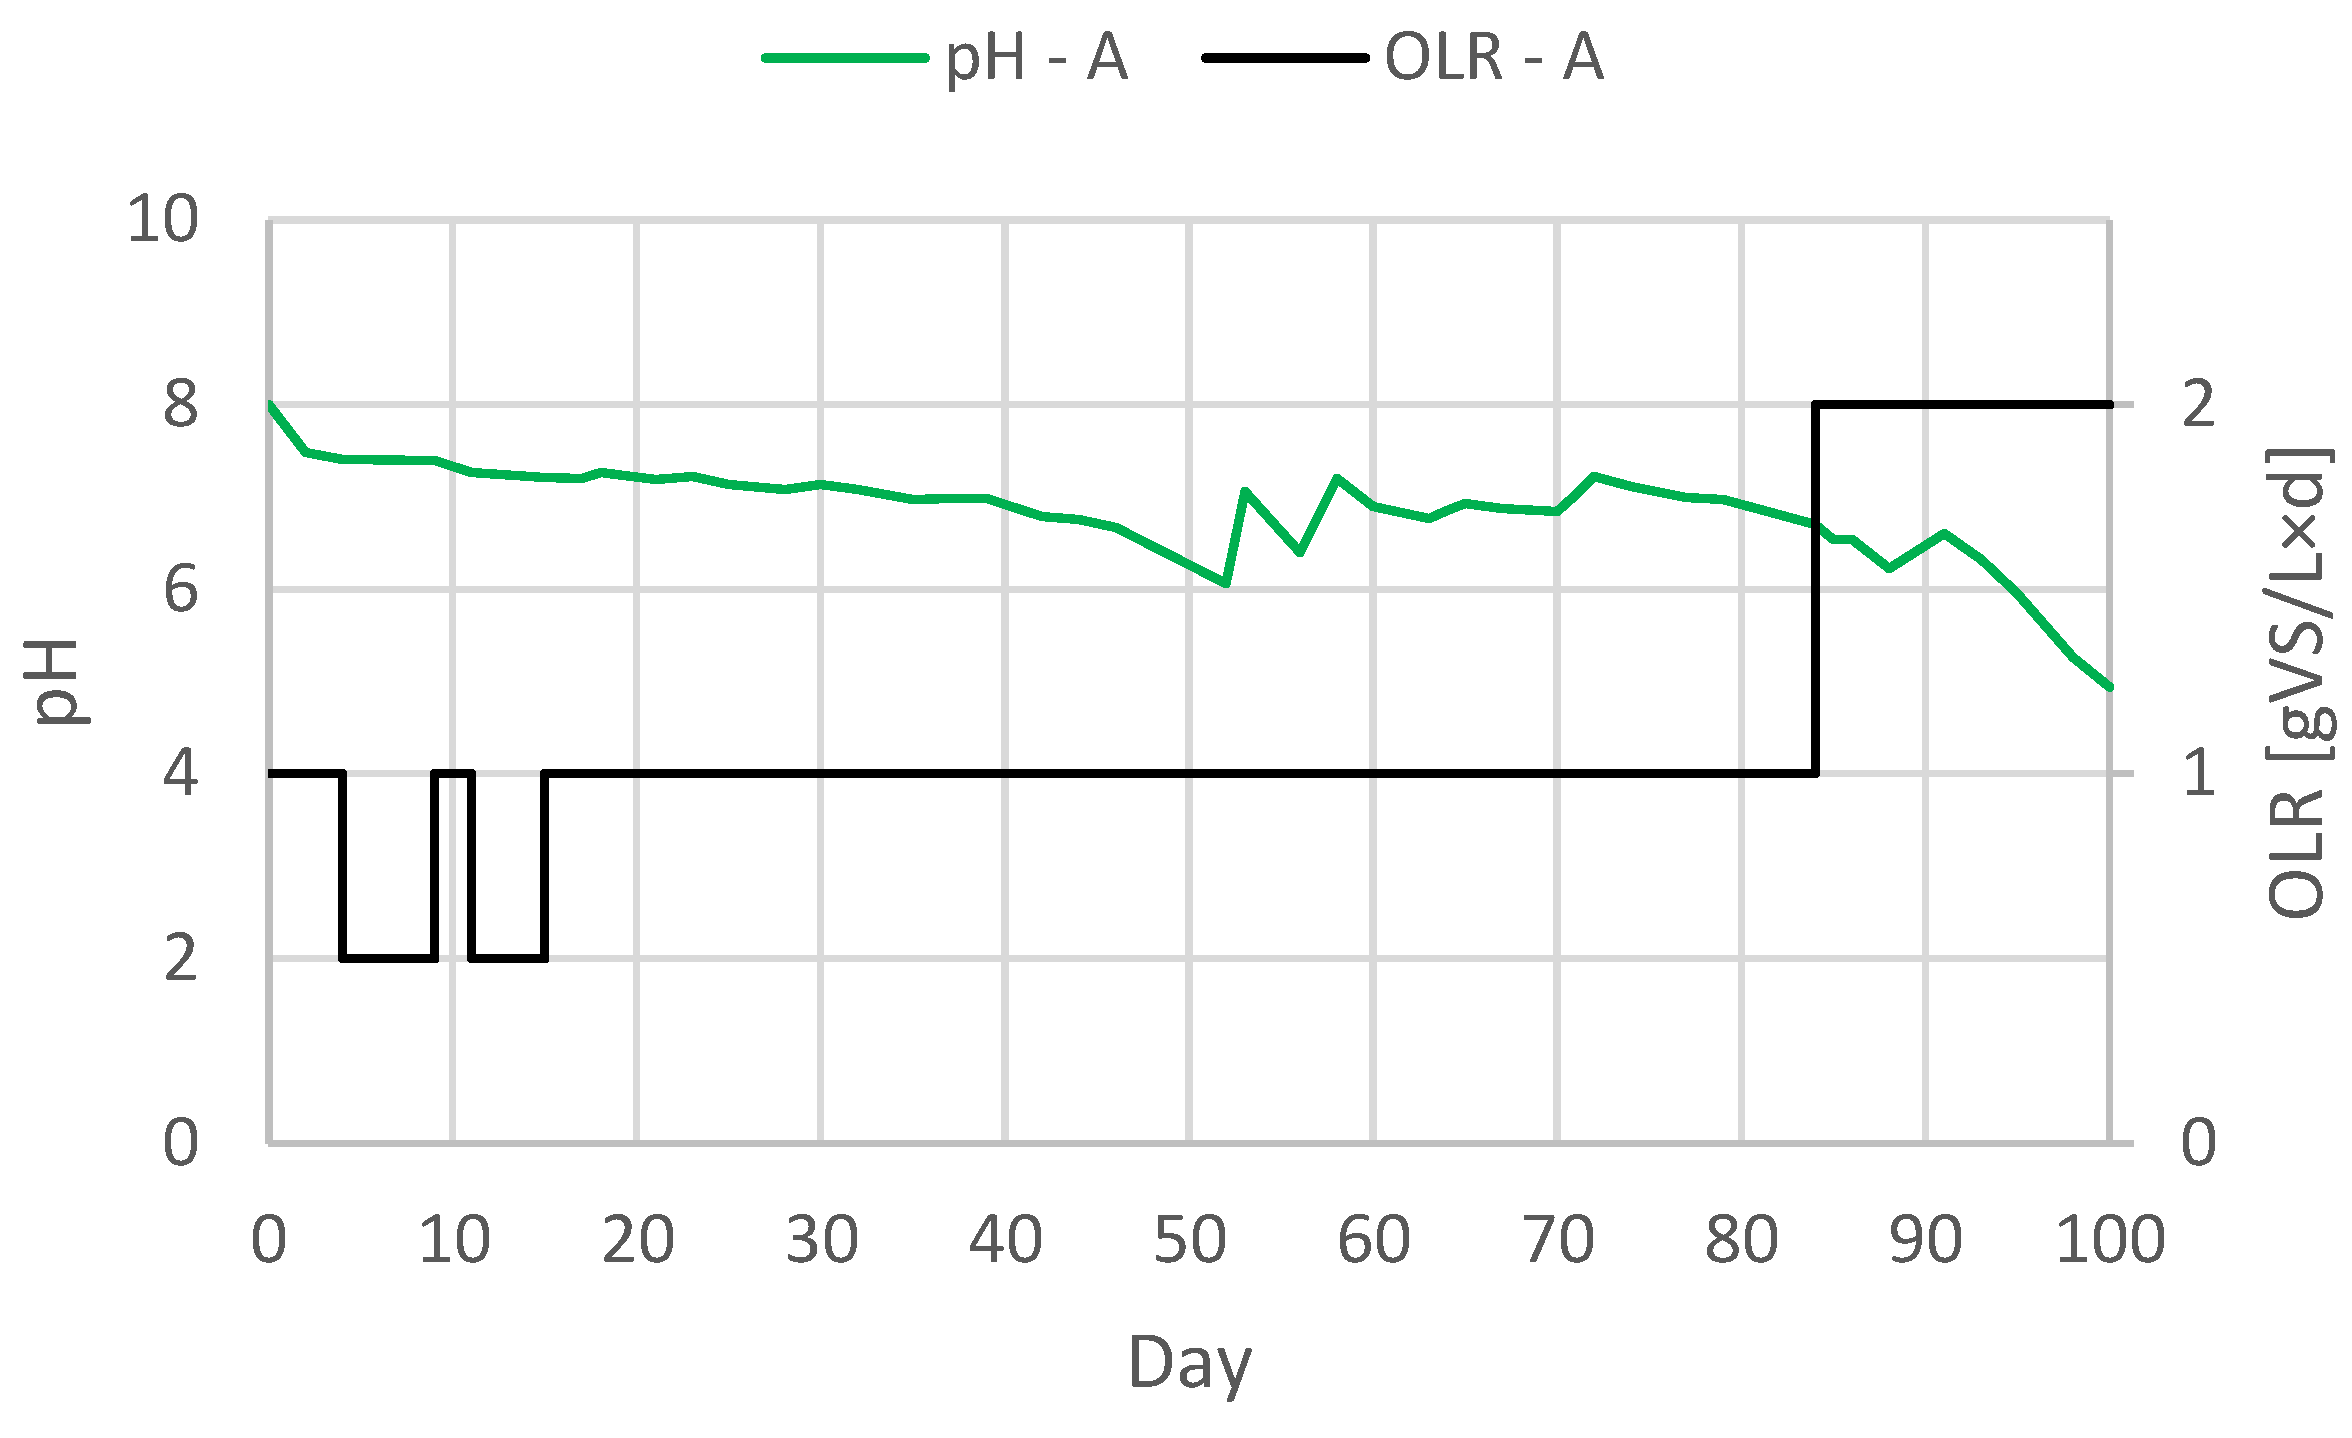
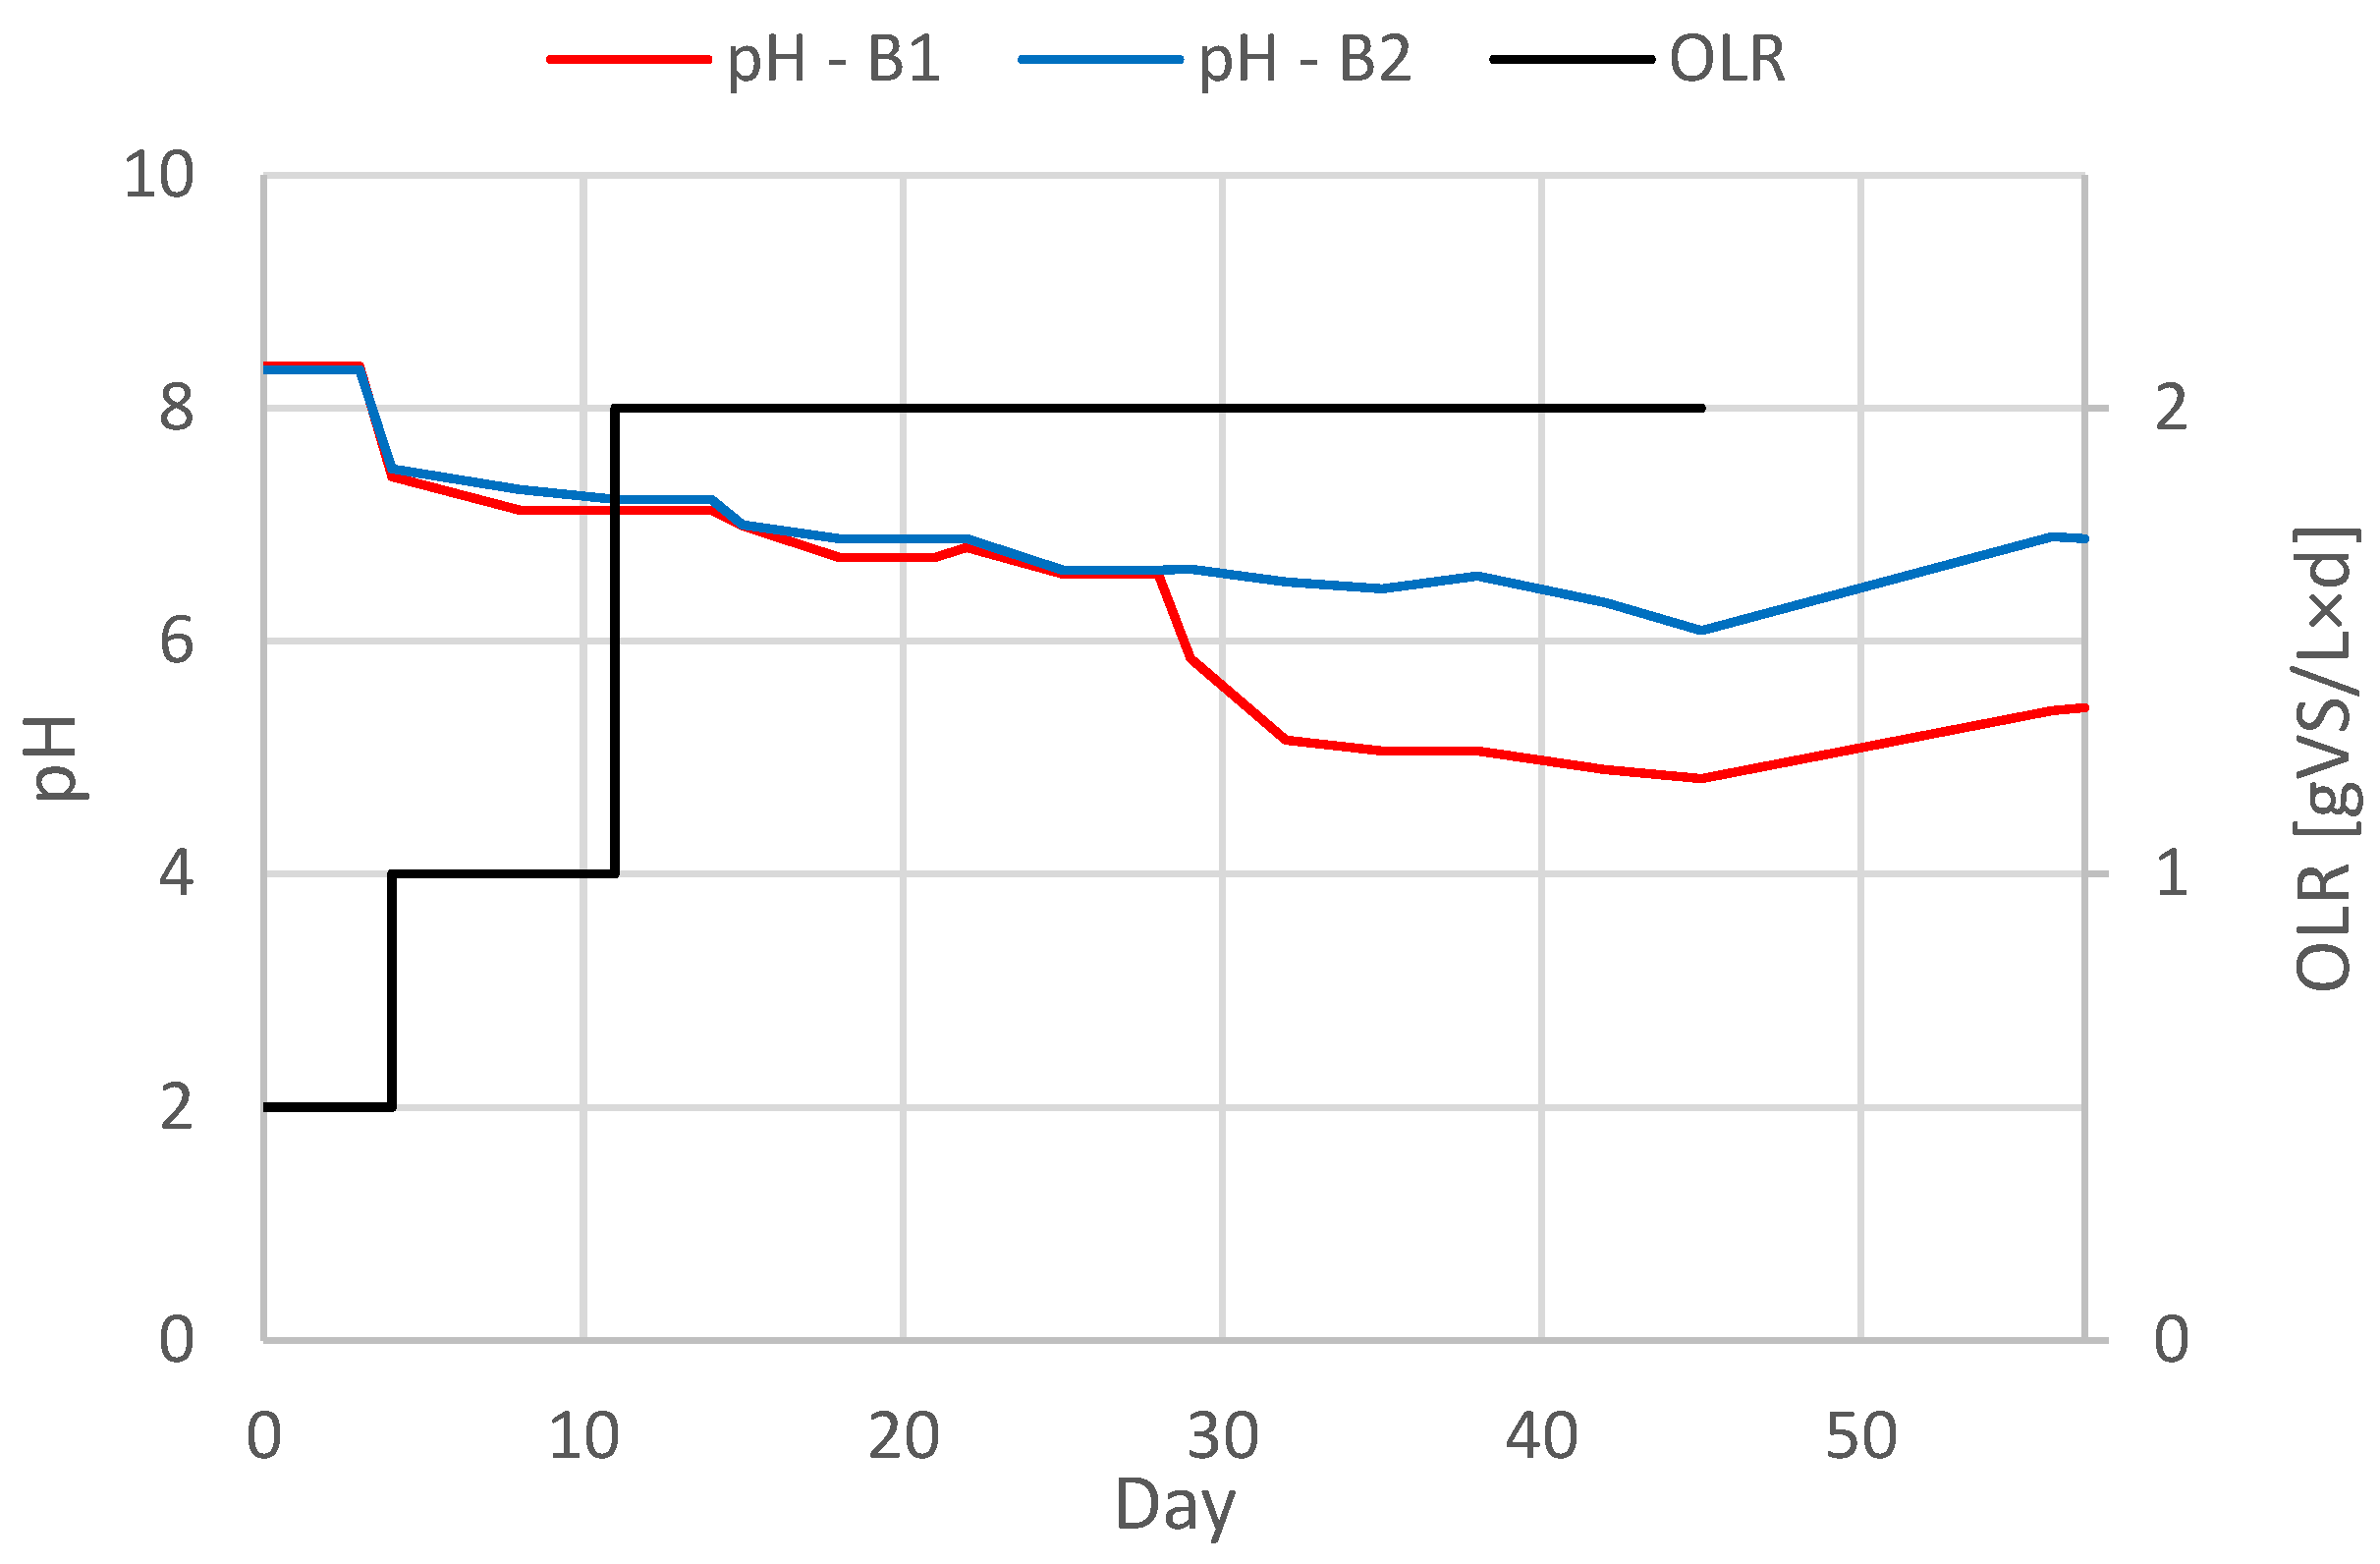
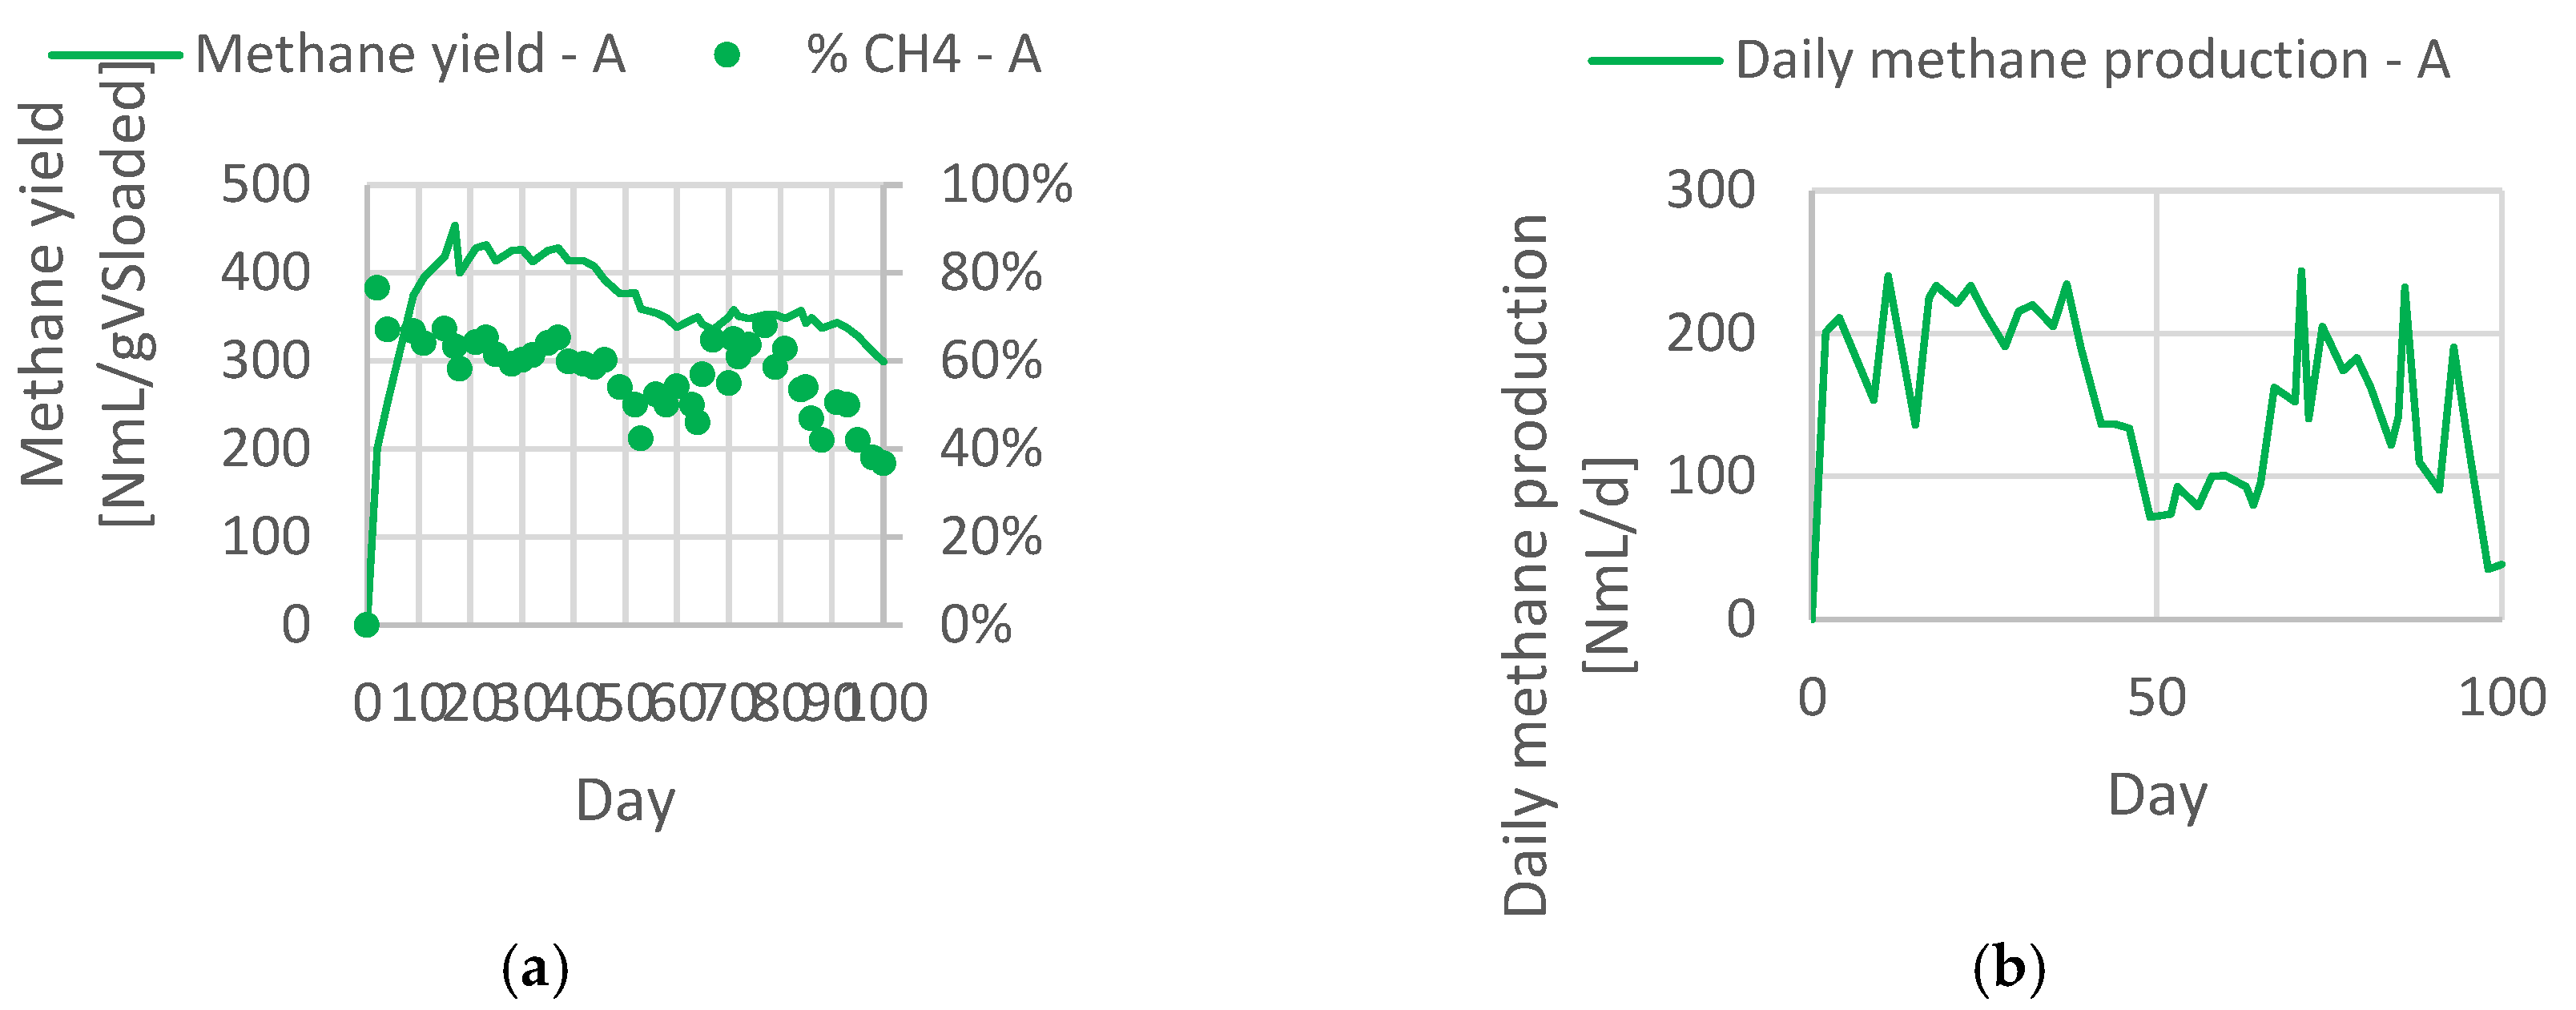
3. Results and Discussion

During Experiment A, pH slowly decreased from the initial value (7.9) down to 6.7 during the first 46 days, then it decreased to 6.1 (day 52, Figure 2), probably due to an accumulation of VFA. The addition of NaHCO3 and of nutrients solutions raised pH to about 7 (until day 81). In this period, it is possible that nutrients addition helped to stimulate bacterial activity, thus consuming accumulated VFA, and to stabilize the process. Then, in correspondence to OLR increase (to 2 gVS·L−1·day−1), pH decreased and neither sodium bicarbonate nor nutrients solutions addition were able to successfully raise it. The experiment was terminated at day 100 (pH = 4.9).
Methane yield (Figure 4) was fairly stable during days 18–81 and remained between 0.35–0.43 NL·gVSadded−1 (average 0.38 NL·gVSadded−1, %CH4 in biogas, 63% on average), then it decreased almost steadily down to 0.3 NL·gVSadded−1 on day 100. However, daily methane production and the percentage of methane in biogas observed a partial instability of the reactor that was remedied after the addition of nutrients (on days 63 and 70). These findings confirm that nutrients and micro-nutrients supplementation is essential for a successful AD of this type of substrate [38,39].
Loading increase led to a reduction of pH, daily methane production and presence in biogas until the experiment was terminated.
Data on methane yield were in agreement with those present in scientific literature for this specific substrate [4,6]. According to this experiment, the maximum organic loading rate for untreated OPW is about 1–2 gVS·L−1·day−1, thus in the lower end of the range present in scientific literature [40,41]. If optimal conditions (i.e., sufficient nutrients availability, days 44–70 in this experiment) are not kept or if accumulation of d-Limonene [1] occurs, which is likely what happened when OLR was increased, the process becomes unstable, VFAs accumulate, buffering capacity reduces and pH tends to decrease (compare Figure 2 and Figure 5).
During Experiment B, pH (Figure 3) started from a value above 8, then sharply decreased to about 7.4 at day 4 and then begun a slow and steady decrease (6.6 at day 28 for both reactors). From day 28 onward, reactor B2, the one where GAC was added, performed better, both in terms of a more stable pH and a higher methane production. In fact, in reactor B1 between days 28 and 32, pH decreased sharply to 5.2 and then more slowly to 4.8 in day 45. In reactor B2, the decrease was more limited and pH was equal to 6.1 on day 45. Figure 6 shows that VFA tended to accumulate in reactor B1, reaching 6000 mg/L after about one month from the beginning of the experiment and up to about 9400 mg/L at its end. In weeks VI and VII, it was impossible to measure VFA in reactor B1 due the low pH (<5, incompatible with the titration method used), while week VIII corresponds to the period of laboratory closure. In reactor B2, the presence of GAC allowed to keep VFA concentration at a maximum value of 3000 mg/L, only when loading was resumed and the VFA concentration in this reactor increased up to about 4000 mg/L.
According to [1], d-Limonene degradation for the adopted hydraulic residence time (HRT) can be considered unlikely, therefore, under the hypothesis that no degradation at all occurs in the reactor, the concentration of this compound after the reactor start-up should have been in the order of 33.5 mg·L−1. According to the review of Ruiz and Flotats [11], inhibition of anaerobic digestion of OPW by d-Limonene is possible if the concentration is higher than 10 mg·L−1 and it is therefore possible that the accumulation of VFA due to the partial inhibition of methanogenesis was likely due to d-Limonene.
At day 28, accumulated methane production (Figure 7) was identical in the two reactors, while at day 57 (end of experiment), that of reactor B2 was 65% higher than reactor B1. Average methane content in biogas (Figure 8) was practically the same between days 11 and 28 (57% for B1 and 55% for B2, respectively), while in days 28–57 it was 45% in B1 and 57% in B2.
During the 11 days that the reactors operated in batch conditions (feeding was suspended on day 45 due to the summer closure of the laboratory), pH increased similarly in both reactors (from 4.8 to 5.4 in reactor B1 and from 6.1 to 6.9 in reactor B2) and methane was produced (average daily production during this period was significantly lower than that in the preceding week, Figure 8).
At the end of the experiment (day 57), methane yield was 0.13 NL·gVSadded−1 for reactor B1 and 0.22 NL·gVSadded−1 for reactor B2 (about 70% higher). The value of methane yield in B2 was about 42% lower than that recorded during Experiment A when, however, HRT was set at about 46 days, about 4 times the value set in Experiment B.
Daily methane production in reactor B was fairly stable between days 14 and 45 (Figure 8). This is probably a result of a higher process stability for the reactor supplemented with GAC.
The different behaviour observed in reactors B1 and B2 after the necessary acclimation of the microbial community (the first 28 days) and consisting in a higher cumulated methane production (+65%), higher amount of methane in biogas (+27%) and higher methane yield (+68%) can be attributed to GAC addition. It is highly probable that the most important benefits are d-Limonene adsorption [21,22,23] and the immobilization of microbial community [15] with the already mentioned linked benefits.

4. Conclusions

These preliminary results demonstrate that OPW pretreatment with the addition of a moderate amount of GAC can render anaerobic digestion of pure OPW sustainable in terms of a fairly good process stability and applicable loading (up to 2 gVS·L−1·day−1 if an alkaline pretreatment is adopted). Both experiments clearly indicate that the supplementation of nutrients is necessary which can be achieved either by the direct addition of nutrients (in the form of an N salt) or by the addition of an appropriate N rich co-substrate. At the end of the experiment, GAC addition (reactor B2) increased methane yield of pretreated OPW by 65%. However, in the first 30 days, methane production was practically the same in reactors B1 and B2, indicating that most probably GAC induced some effect in term of biomass selection.

Author Contributions

Conceptualization, P.S.C.; Data curation, F.F.; Formal analysis, D.K.; Funding acquisition, Paolo S.C.; Investigation, P.S.C., F.F., A.F. and E.P.; Methodology, P.S.C., F.F., A.F. and E.P.; Project administration, P.S.C.; Supervision, P.S.C.; Validation, D.K.; Writing—original draft, P.S.C., F.F. and A.F.; Writing—review and editing, P.S.C. and D.K.

Funding

This research received no external funding.

Conflicts of Interest

The authors declare no conflict of interest.

References

  1. Calabrò, P.S.; Pontoni, L.; Porqueddu, I.; Greco, R.; Pirozzi, F.; Malpei, F. Effect of the concentration of essential oil on orange peel waste biomethanization: Preliminary batch results. Waste Manag. 2016, 48, 440–447. [Google Scholar] [CrossRef] [PubMed]
  2. Calabrò, P.S.; Paone, E.; Komilis, D. Strategies for the sustainable management of orange peel waste through anaerobic digestion. J. Environ. Manag. 2018, 212, 462–468. [Google Scholar] [CrossRef] [PubMed]
  3. Zema, D.A.; Calabrò, P.S.; Folino, A.; Tamburino, V.; Zappia, G.; Zimbone, S.M. Valorisation of citrus processing waste: A review. Waste Manag. 2018, 80, 252–273. [Google Scholar] [CrossRef] [PubMed]
  4. Zema, D.A.; Fòlino, A.; Zappia, G.; Calabrò, P.S.; Tamburino, V.; Zimbone, S.M. Anaerobic digestion of orange peel in a semi-continuous pilot plant: An environmentally sound way of citrus waste management in agro-ecosystems. Sci. Total Environ. 2018, 630, 401–408. [Google Scholar] [CrossRef] [PubMed]
  5. Calabrò, P.S.; Panzera, M.F. Anaerobic digestion of ensiled orange peel waste: Preliminary batch results. Therm. Sci. Eng. Prog. 2018, 6, 355–360. [Google Scholar] [CrossRef]
  6. Cadena, E.; Adani, F.; Font, X.; Artola, A. Including an Odor Impact Potential in Life Cycle Assessment of waste treatment plants. Int. J. Environ. Sci. Technol. 2018. [Google Scholar] [CrossRef]
  7. Liu, J.; Wang, X.; Nie, X.; Li, R.; Song, M. In-situ emission characteristics of odorous gases from two food waste processing plants. J. Mater. Cycles Waste Manag. 2013, 15, 510–515. [Google Scholar] [CrossRef]
  8. Wikandari, R.; Nguyen, H.; Millati, R.; Niklasson, C.; Taherzadeh, M.J. Improvement of Biogas Production from Orange Peel Waste by Leaching of Limonene. Biomed. Res. Int. 2015, 2015. [Google Scholar] [CrossRef]
  9. Martín, M.A.; Siles, J.A.; Chica, A.F.; Martín, A. Biomethanization of orange peel waste. Bioresour. Technol. 2010, 101, 8993–8999. [Google Scholar] [CrossRef]
  10. Koppar, A.; Pullammanappallil, P. Anaerobic digestion of peel waste and wastewater for on site energy generation in a citrus processing facility. Energy 2013, 60, 62–68. [Google Scholar] [CrossRef]
  11. Ruiz, B.; Flotats, X. Citrus essential oils and their influence on the anaerobic digestion process: An overview. Waste Manag. 2014, 34, 2063–2079. [Google Scholar] [CrossRef] [PubMed]
  12. Duetz, W.A.; Bouwmeester, H.; Beilen, J.B.; Witholt, B. Biotransformation of limonene by bacteria, fungi, yeasts, and plants. Appl. Microbiol. Biotechnol. 2003, 61, 269–277. [Google Scholar] [CrossRef] [PubMed]
  13. Chen, Y.; Cheng, J.J.; Creamer, K.S. Inhibition of anaerobic digestion process: A review. Bioresour. Technol. 2008, 99, 4044–4064. [Google Scholar] [CrossRef] [PubMed]
  14. Fagbohungbe, M.O.; Herbert, B.M.J.; Hurst, L.; Li, H.; Usmani, S.Q.; Semple, K.T. Impact of biochar on the anaerobic digestion of citrus peel waste. Bioresour. Technol. 2016, 216, 142–149. [Google Scholar] [CrossRef] [PubMed]
  15. Fagbohungbe, M.O.; Herbert, B.M.J.; Hurst, L.; Ibeto, C.N.; Li, H.; Usmani, S.Q.; Semple, K.T. The challenges of anaerobic digestion and the role of biochar in optimizing anaerobic digestion. Waste Manag. 2017, 61, 236–249. [Google Scholar] [CrossRef] [PubMed] [Green Version]
  16. Zhang, J.; Zhao, W.; Zhang, H.; Wang, Z.; Fan, C.; Zang, L. Recent achievements in enhancing anaerobic digestion with carbon- based functional materials. Bioresour. Technol. 2018, 266, 555–567. [Google Scholar] [CrossRef] [PubMed]
  17. Lua, A.C.; Yang, T.; Guo, J. Effects of pyrolysis conditions on the properties of activated carbons prepared from pistachio-nut shells. J. Anal. Appl. Pyrolysis 2004, 72, 279–287. [Google Scholar] [CrossRef]
  18. Schultz, P.W.; Oskamp, S.; Mainieri, T. Who recycles and when? A review of personal and situational factors. J. Environ. Psychol. 1995, 15, 105–121. [Google Scholar] [CrossRef]
  19. Lehmann, J.; Joseph, S. Biochar for Environmental Management: Science, Technology and Implementation; Routledge: Abingdon-on-Thames, UK, 2015; ISBN 1134489536. [Google Scholar]
  20. Mumme, J.; Srocke, F.; Heeg, K.; Werner, M. Use of biochars in anaerobic digestion. Bioresour. Technol. 2014, 164, 189–197. [Google Scholar] [CrossRef]
  21. Hale, S.E.; Endo, S.; Arp, H.P.H.; Zimmerman, A.R.; Cornelissen, G. Sorption of the monoterpenes α-pinene and limonene to carbonaceous geosorbents including biochar. Chemosphere 2015, 119, 881–888. [Google Scholar] [CrossRef]
  22. Kılıç, M.; Kırbıyık, Ç.; Çepelioğullar, Ö.; Pütün, A.E. Adsorption of heavy metal ions from aqueous solutions by bio-char, a by-product of pyrolysis. Appl. Surf. Sci. 2013, 283, 856–862. [Google Scholar] [CrossRef]
  23. Taha, S.M.; Amer, M.E.; Elmarsafy, A.E.; Elkady, M.Y. Adsorption of 15 different pesticides on untreated and phosphoric acid treated biochar and charcoal from water. J. Environ. Chem. Eng. 2014, 2, 2013–2025. [Google Scholar] [CrossRef]
  24. Watanabe, R.; Tada, C.; Baba, Y.; Fukuda, Y.; Nakai, Y. Enhancing methane production during the anaerobic digestion of crude glycerol using Japanese cedar charcoal. Bioresour. Technol. 2013, 150, 387–392. [Google Scholar] [CrossRef] [PubMed]
  25. Lü, F.; Bize, A.; Guillot, A.; Monnet, V.; Madigou, C.; Chapleur, O.; Mazéas, L.; He, P.; Bouchez, T. Metaproteomics of cellulose methanisation under thermophilic conditions reveals a surprisingly high proteolytic activity. ISME J. 2013, 8, 88–102. [Google Scholar] [CrossRef] [PubMed]
  26. Montalvo, S.; Guerrero, L.; Borja, R.; Sánchez, E.; Milán, Z.; Cortés, I.; Angeles de la la Rubia, M. Application of natural zeolites in anaerobic digestion processes: A review. Appl. Clay Sci. 2012, 58, 125–133. [Google Scholar] [CrossRef] [Green Version]
  27. Stams, A.J.M. Metabolic interactions between anaerobic bacteria in methanogenic environments. Antonie Van Leeuwenhoek 1994, 66, 271–294. [Google Scholar] [CrossRef]
  28. Schink, B. Energetics of Syntrophic Cooperation in Methanogenic Degradation. Microbiol. Mol. Biol. Rev. 1997, 61, 262–280. [Google Scholar]
  29. Zhao, Z.; Zhang, Y.; Woodard, T.L.; Nevin, K.P.; Lovley, D.R. Enhancing syntrophic metabolism in up-flow anaerobic sludge blanket reactors with conductive carbon materials. Bioresour. Technol. 2015, 191, 140–145. [Google Scholar] [CrossRef]
  30. Peng, H.; Zhang, Y.; Tan, D.; Zhao, Z.; Zhao, H.; Quan, X. Roles of magnetite and granular activated carbon in improvement of anaerobic sludge digestion. Bioresour. Technol. 2018, 249, 666–672. [Google Scholar] [CrossRef]
  31. Judith Martínez, E.; Rosas, J.G.; Sotres, A.; Moran, A.; Cara, J.; Sánchez, M.E.; Gómez, X. Codigestion of sludge and citrus peel wastes: Evaluating the effect of biochar addition on microbial communities. Biochem. Eng. J. 2018, 137, 314–325. [Google Scholar] [CrossRef]
  32. Schievano, A.; Scaglia, B.; D’Imporzano, G.; Malagutti, L.; Gozzi, A.; Adani, F. Prediction of biogas potentials using quick laboratory analyses: Upgrading previous models for application to heterogeneous organic matrices. Bioresour. Technol. 2009, 100, 5777–5782. [Google Scholar] [CrossRef] [PubMed]
  33. Calabrò, P.S.; Catalán, E.; Folino, A.; Sánchez, A.; Komilis, D. Effect of three pretreatment techniques on the chemical composition and on the methane yields of Opuntia ficus-indica (prickly pear) biomass. Waste Manag. Res. 2018, 36, 17–29. [Google Scholar] [CrossRef] [PubMed]
  34. Taherzadeh, M.J.; Karimi, K. Pretreatment of lignocellulosic wastes to improve ethanol and biogas production: A review. Int. J. Mol. Sci. 2008, 9, 1621–1651. [Google Scholar] [CrossRef] [PubMed]
  35. Antonopoulou, G.; Dimitrellos, G.; Vayenas, D.; Lyberatos, G. Different Physicochemical Pretreatment Methods on Lignocellulosic Biomass: The Efeect on Biochemical Methane Potential. In Proceedings of the 14th International Conference on Environmental Science and Technology, Rhodes, Greece, 3–5 September 2015. [Google Scholar]
  36. APHA; AWWA; WEF. Standard Methods for the Examination of Water and Wastewater, 22nd ed.; Rice, E.W., Baird, R.B., Eaton, A.D., Clesceri, L.S., Eds.; American Public Health Association/American Water Works Association/Water Environment Federation: Washington, DC, USA, 2012; ISBN 9780875530130. [Google Scholar]
  37. Buchauer, K. A comparison of two simple titration procedures to determine volatile fatty acids in influents to waste-water and sludge treatment processes. Water SA 1998, 24, 49–56. [Google Scholar]
  38. Choong, Y.Y.; Norli, I.; Abdullah, A.Z.; Yhaya, M.F. Impacts of trace element supplementation on the performance of anaerobic digestion process: A critical review. Bioresour. Technol. 2016, 209, 369–379. [Google Scholar] [CrossRef]
  39. Romero-Güiza, M.S.; Vila, J.; Mata-Alvarez, J.; Chimenos, J.M.; Astals, S. The role of additives on anaerobic digestion: A review. Renew. Sustain. Energy Rev. 2016, 58, 1486–1499. [Google Scholar] [CrossRef]
  40. Li, L.; Peng, X.; Wang, X.; Wu, D. Anaerobic digestion of food waste: A review focusing on process stability. Bioresour. Technol. 2018, 248, 20–28. [Google Scholar] [CrossRef]
  41. Xu, F.; Li, Y.Y.; Ge, X.; Yang, L.; Li, Y.Y. Anaerobic digestion of food waste—Challenges and opportunities. Bioresour. Technol. 2018, 247, 1047–1058. [Google Scholar] [CrossRef]
Figure 1. Experimental reactor.
Sustainability 11 03386 g001
Figure 2. Substrate loading and pH trend, Experiment A.
Sustainability 11 03386 g002
Figure 3. Substrate loading and pH trend, Experiment B.
Sustainability 11 03386 g003
Figure 4. Experiment A: (a) Methane yield and % CH4 in biogas; (b) daily production.
Sustainability 11 03386 g004
Figure 5. Buffering capacity, Experiment A.
Sustainability 11 03386 g005
Figure 6. Volatile fatty acid (VFA) concentration, Experiment B.
Sustainability 11 03386 g006
Figure 7. Cumulative biogas and methane production, Experiment B.
Sustainability 11 03386 g007
Figure 8. Experiment B: (a) Methane yield and %CH4 in biogas; (b) daily production.
Sustainability 11 03386 g008
Table 1. Substrate and inocula characteristics.
TS (%)VS (%TS)pH d-Limonene (mg/g)
Inoculum (Exp. A)4.871.97.9-
Inoculum (Exp. B)4.164.68.1-
Raw lyophilized OPW93.296.9-0.37 *
Pretreated OPW12.6 *77.6 *10.7 *0.15 *
* Value measured on rehydrated OPW.
Table 2. Experimental design.
Reactor SubstrateGACSubstrate PretreatmentHRT
[day]
Regime OLR
[gVS·L−1·day−1]
ALyoph. OPWNONO46.3 *–23.1 **1 *–2 **
B1Lyoph. OPWNOAlkaline132
B2Lyoph. OPWYESAlkaline132
* Days 14–81; ** Days 81–101.

