Article

Relationships between Riparian Vegetation Pattern and the Hydraulic Characteristics of Upslope Runoff

1
Key Laboratory of Geospatial Technology for the Middle and Lower Yellow River Regions (Henan University), Ministry of Education, Kaifeng 475004, China
2
College of Environment and Planning, Henan University, Kaifeng 475004, China
*
Author to whom correspondence should be addressed.
Sustainability 2019, 11(10), 2966; https://doi.org/10.3390/su11102966
Submission received: 5 April 2019 / Revised: 8 May 2019 / Accepted: 20 May 2019 / Published: 24 May 2019
(This article belongs to the Special Issue Soil Erosion and the Sustainable Management of the Landscape)

Abstract

:
Riparian vegetation plays a vital role in inhibiting soil and water loss, but few studies have quantified the relationships between vegetation spatial pattern and the hydraulic characteristics of upslope runoff. This study investigated how hydraulic characteristics (e.g., runoff coefficient, flow regime, flow resistance, and flow shear stress of overland flow) responded to differences in vegetation cover (15% and 30%), slope gradient (5°, 10°, 15°, and 20°), and vegetation pattern in the riparian zone along the lower Yellow River, China, based on landscape pattern analysis and a runoff scouring experiment with flow rates of 9 and 15 L/min and an experimental plot size of 1 m × 3 m. We found that runoff generation on shallow slopes was moderated by increasing vegetation cover, but that this moderating effect decreased on steeper slopes. The regime of overland flow switched from laminar and subcritical on the 5° slope (Fr = 0.56–0.87) to laminar and critical on the 10°, 15°, and 20° slopes (Fr = 1.02–2.18). Flow resistance increased with vegetation cover and flow rate and decreased with slope gradients, and it was larger on shallow slopes with high vegetation cover. Flow shear stress had a range of 1.42–3.55 N m−2, and it increased with increasing slope gradient, vegetation cover, and flow rate. The hydraulic characteristics of upslope runoff, especially flow resistance, were significantly related to vegetation pattern at both the landscape and class levels. Flow resistance was negatively related to patch density, and positively related to perimeter–area fractal dimension and connectance index. The influencing mechanism of landscape patterns on soil erosion processes is dependent on the landscape scale, since the relationships between flow resistance and some landscape pattern indices (aggregation index, effective mesh size, and splitting index) were opposite at the landscape level compared to the class level. We conclude that fragmented vegetation distributions reduce flow resistance, and that riparian vegetation could be managed to inhibit slope erosion by increasing flow resistance.

1. Introduction

Soil erosion is a global environmental problem that can cause land degradation, decrease productivity, cause ecological deterioration, and may be a threat to the sustainable development of human society [1]. Therefore, understanding the processes and driving mechanisms of soil erosion is extremely important [2,3]. The hydrodynamic mechanism of slope erosion is one area of current investigation [4,5]. Slope erosion depends on the hydraulic characteristics of slope water flow and surface conditions, and erosion can only occur when slope water flow exceeds a certain hydraulic criticality [5,6]. Research has developed from the study of how slope hydraulic parameters change with runoff volume and slope gradient, and the division and attribution of flow regime under variable slope gradients [4,7], to the critical hydraulic conditions of overland flow [7], and the hydraulic process of slope erosion [5,6], gradually changing from empirical analysis to the study of hydrodynamic mechanisms. However, most of these studies were simulation experiments with a bare slope of uniform soil texture and smooth surface [5,8,9], lacking any consideration of the complex underlying surface conditions that occurs in nature, especially the relationship between vegetation and hydraulic characteristics.
Vegetation can significantly affect runoff production and sediment transportation, including slowing velocity, increasing infiltration, and the resistance of overland flow [7]. Vegetation can also cause the turbulent flow to be more laminar and subcritical by changing the hydraulic characteristics of the upslope inflow, and can eventually reduce the erosive power of overland flow and sediment yield [5]. Thus, the presence of vegetation, vegetation type, and effective vegetation cover all influence the hydraulic characteristics of slope runoff [10,11,12]. However, the influence of the spatial distribution of vegetation on the hydraulic characteristics of slope runoff is rarely discussed, or is limited to a regular distribution of slope vegetation. For instance, Liu et al. [13], Su et al. [14], and Ren et al. [15] investigated the effects of a regular distribution of vegetation at different slope positions on the sediment yield and hydraulic characteristics of overland flow. Yang et al. [16] studied the influence of clustered, regular, and random vegetation distribution patterns on the hydraulic characteristics of overland flow. Zhang and Hu [17] quantified the effects of four different patchily distributed vegetation patterns (checkerboard pattern, banded pattern perpendicular to the slope direction, single long strip parallel to slope direction, and a pattern with small patches distributed like the letter ‘X’) on the flow resistance of overland flow. These studies showed that the influence of vegetation on erosion and sediment yield and hydraulic characteristics of overland flow is related not only to its quantity and structure, but also to where that vegetation is growing.
Water and soil loss, characterized by runoff and sediment production and transportation, is an important part of the eco-hydrological process of the complex land surface systems [18]. It is closely related to the spatial and temporal heterogeneity of landscape elements such as climate, soil, terrain, vegetation, and hydrology [19,20]. Further, landscape pattern, as an embodiment of landscape heterogeneity, can reflect the spatial distribution and configuration of landscape elements (patches) of different sizes, shapes, and attributes, as well as the role of various ecological processes at different scales [21]. The landscape indices, which reflect fragmentation, shape, and diversity of a landscape, can be considered as a bridge connecting landscape patterns and ecological processes. However, research on these indices has tended only to describe the characteristics of landscape pattern, which fails to adequately reflect the ecology of landscape patterns [22]. This is especially so for the relationship between landscape pattern and soil erosion, where the role of the conventional landscape indices as a bridge is particularly limited [23]. Accordingly, new indices such as the location-weighted landscape contrast index [24], leakiness index [19], and Flowlength index [25] have been developed. These indices emphasize processes over the static landscape pattern and can better evaluate the relationship between landscape spatial pattern and water and soil loss. However, affected by the heterogeneity of landscape, complexity of ecological process, and spatial and temporal variation at multiple scales, these new indices still face many limitations and challenges in their verification and application [23]. Therefore, it is still important to explore the ecological significance of the landscape pattern indices and how they reflect ecological processes.
As the last barrier in a watershed that inhibits runoff and sediment transportation to the river, riparian vegetation plays a vital role in intercepting, filtering, and depositing any sediment transported by surface runoff, as well as stabilizing river banks via increasing infiltration, reducing runoff and flow velocity, and improving soil corrosion resistance [26,27]. However, the soil and water conservation functions of riparian vegetation have being seriously impacted by anthropogenic factors, especially urbanization, land use change, road construction and large water conservancy projects, and intensifying agricultural practices [28,29]. For example, the lower region of the Yellow River is one of China’s major grain-producing areas. Here, population growth and the expansion of agricultural practices have resulted in the cultivation of most of the riparian vegetation, negatively impacting the maintenance and sustainability of the ecosystem services [30]. In particular, the soil and water conservation and non-point source pollution control functions of riparian vegetation have gradually degenerated or even disappeared. Although many studies have been conducted to analyze the structural and functional characteristics, as well as the ecological restoration and management, of the degenerated riparian zone of the Yellow River [30,31], we lack an understanding of how the unique features of riparian vegetation structure influence the complex mechanisms of soil and water conservation.
Therefore, based on a runoff scouring experiment and landscape pattern analysis, this study aimed to analyze:
(1)
the runoff coefficient under different slope gradients and vegetation cover,
(2)
regime, resistance, and shear stress of slope overland flow under different slope gradients and vegetation cover, and
(3)
the relationship between hydraulic parameters of overland flow and riparian vegetation patterns, in the lower reaches of the Yellow River.
The results of this study can provide a basis for understanding the relationship between landscape pattern and water and soil loss at larger scales, and provide some theoretical guidance for the restoration of degraded riparian ecosystems and the sustainable development of riparian ecosystem services.

2. Materials and Methods
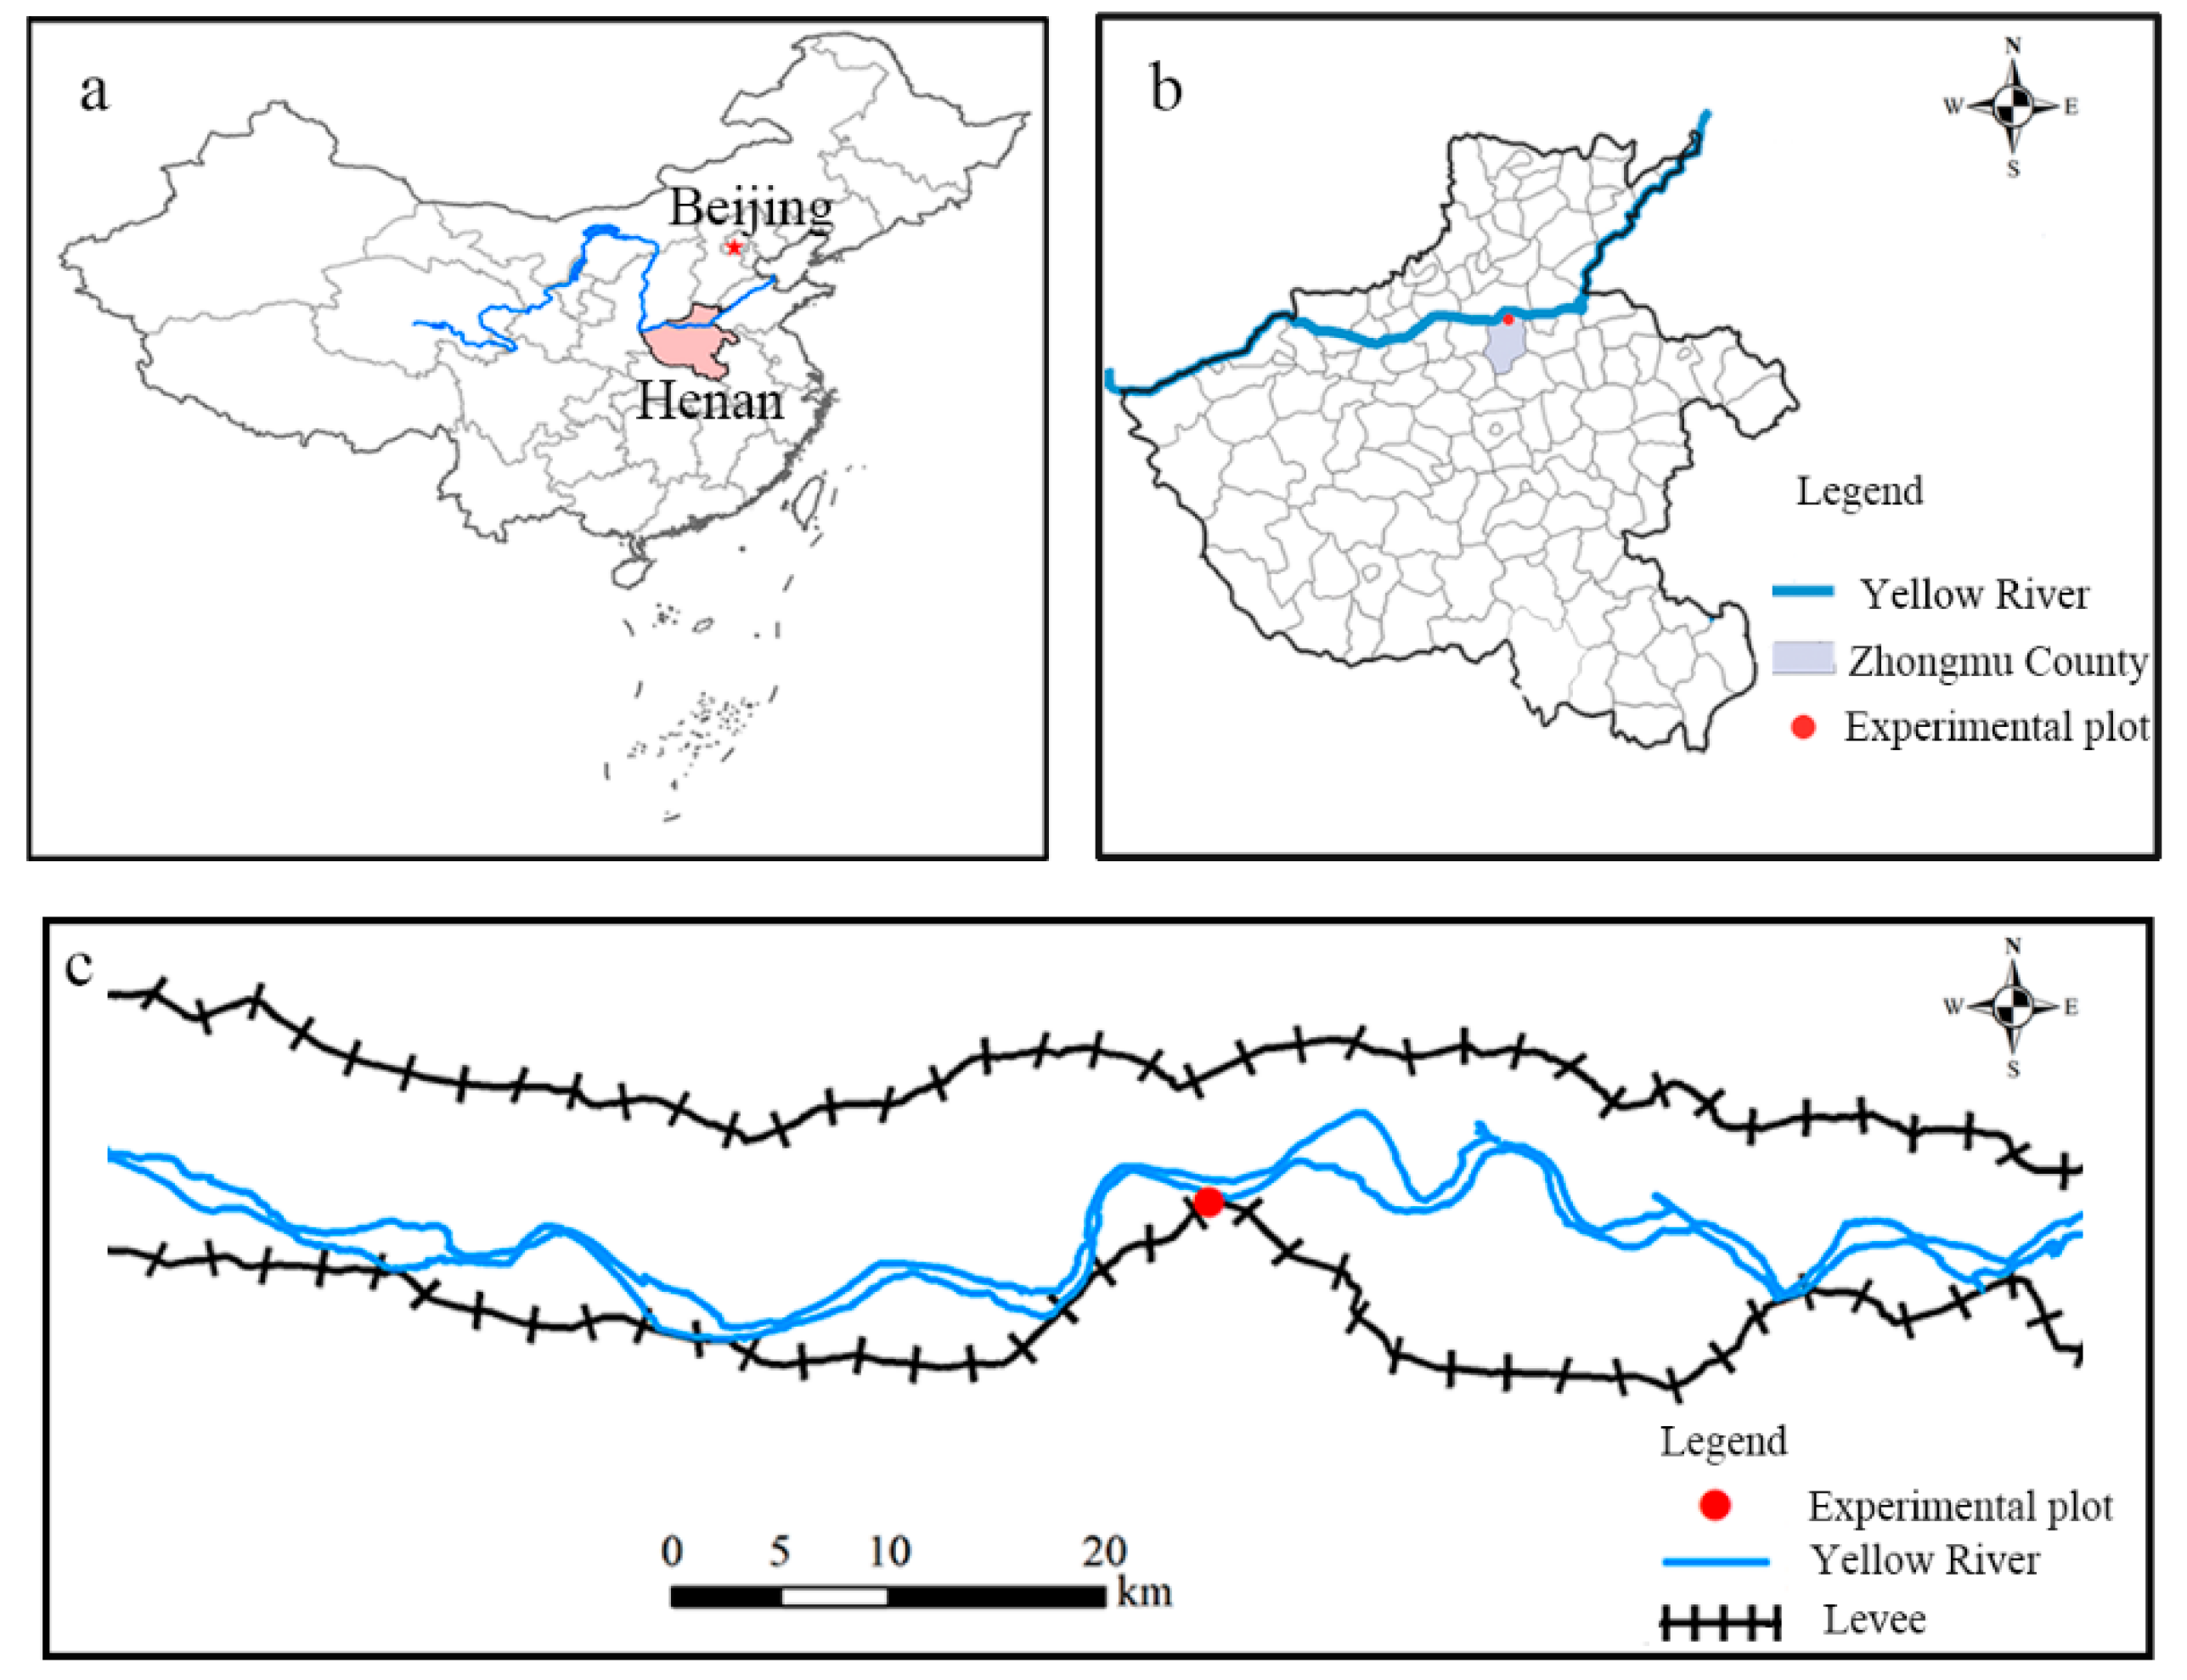
2.1. Study Site

The runoff scouring experiments were conducted on riparian slopes of the lower Yellow River (34°55′52.15′′ N, 114°1′21.51′′ E), Zhongmu County, Henan province, China (Figure 1), from September to October 2015. Zhongmu County is the epitome of an agricultural landscape located on the south bank of the Yellow River, with a total area of 1406 km2.
The climate of the experimental site is a typical warm temperate continental monsoon climate, characterized by mild windy springs (April–June), hot rainy summers (July–September), and cool dry autumns and winters (October–March) [30]. The mean annual temperature is 14.2 °C, and the maximum and minimum monthly temperatures occur in July and January, respectively. Rainfall is strongly seasonal and mostly occurs in summer and autumn, with considerable annual variation and uneven spatial distribution. Annual precipitation is 616 mm. In recent years, the number of rainy days has decreased, heavy rain fall has increased, and drought and flood disasters have become more common [31]. Soils in the study area are dominated by fluvo-aquic and yellow cinnamon soils, which contain much sub-sand and silt-sand due to historical floods of the Yellow River. In addition to floods, climatic characteristics, soil and water sources, and especially the frequent human interventions such as agricultural planting and tourism development, have led to serious damage to the vegetation in the riparian zone and degradation of soil and water quality. The dominant plant species in the study area include willow (Salix babylonica L.), aspen (Populus L.), and grass (Setaria viridis (L.) Beauv.) [30,31]. The main agricultural crops are wheat (Triticum aestivum L.) and maize (Zea mays L.).

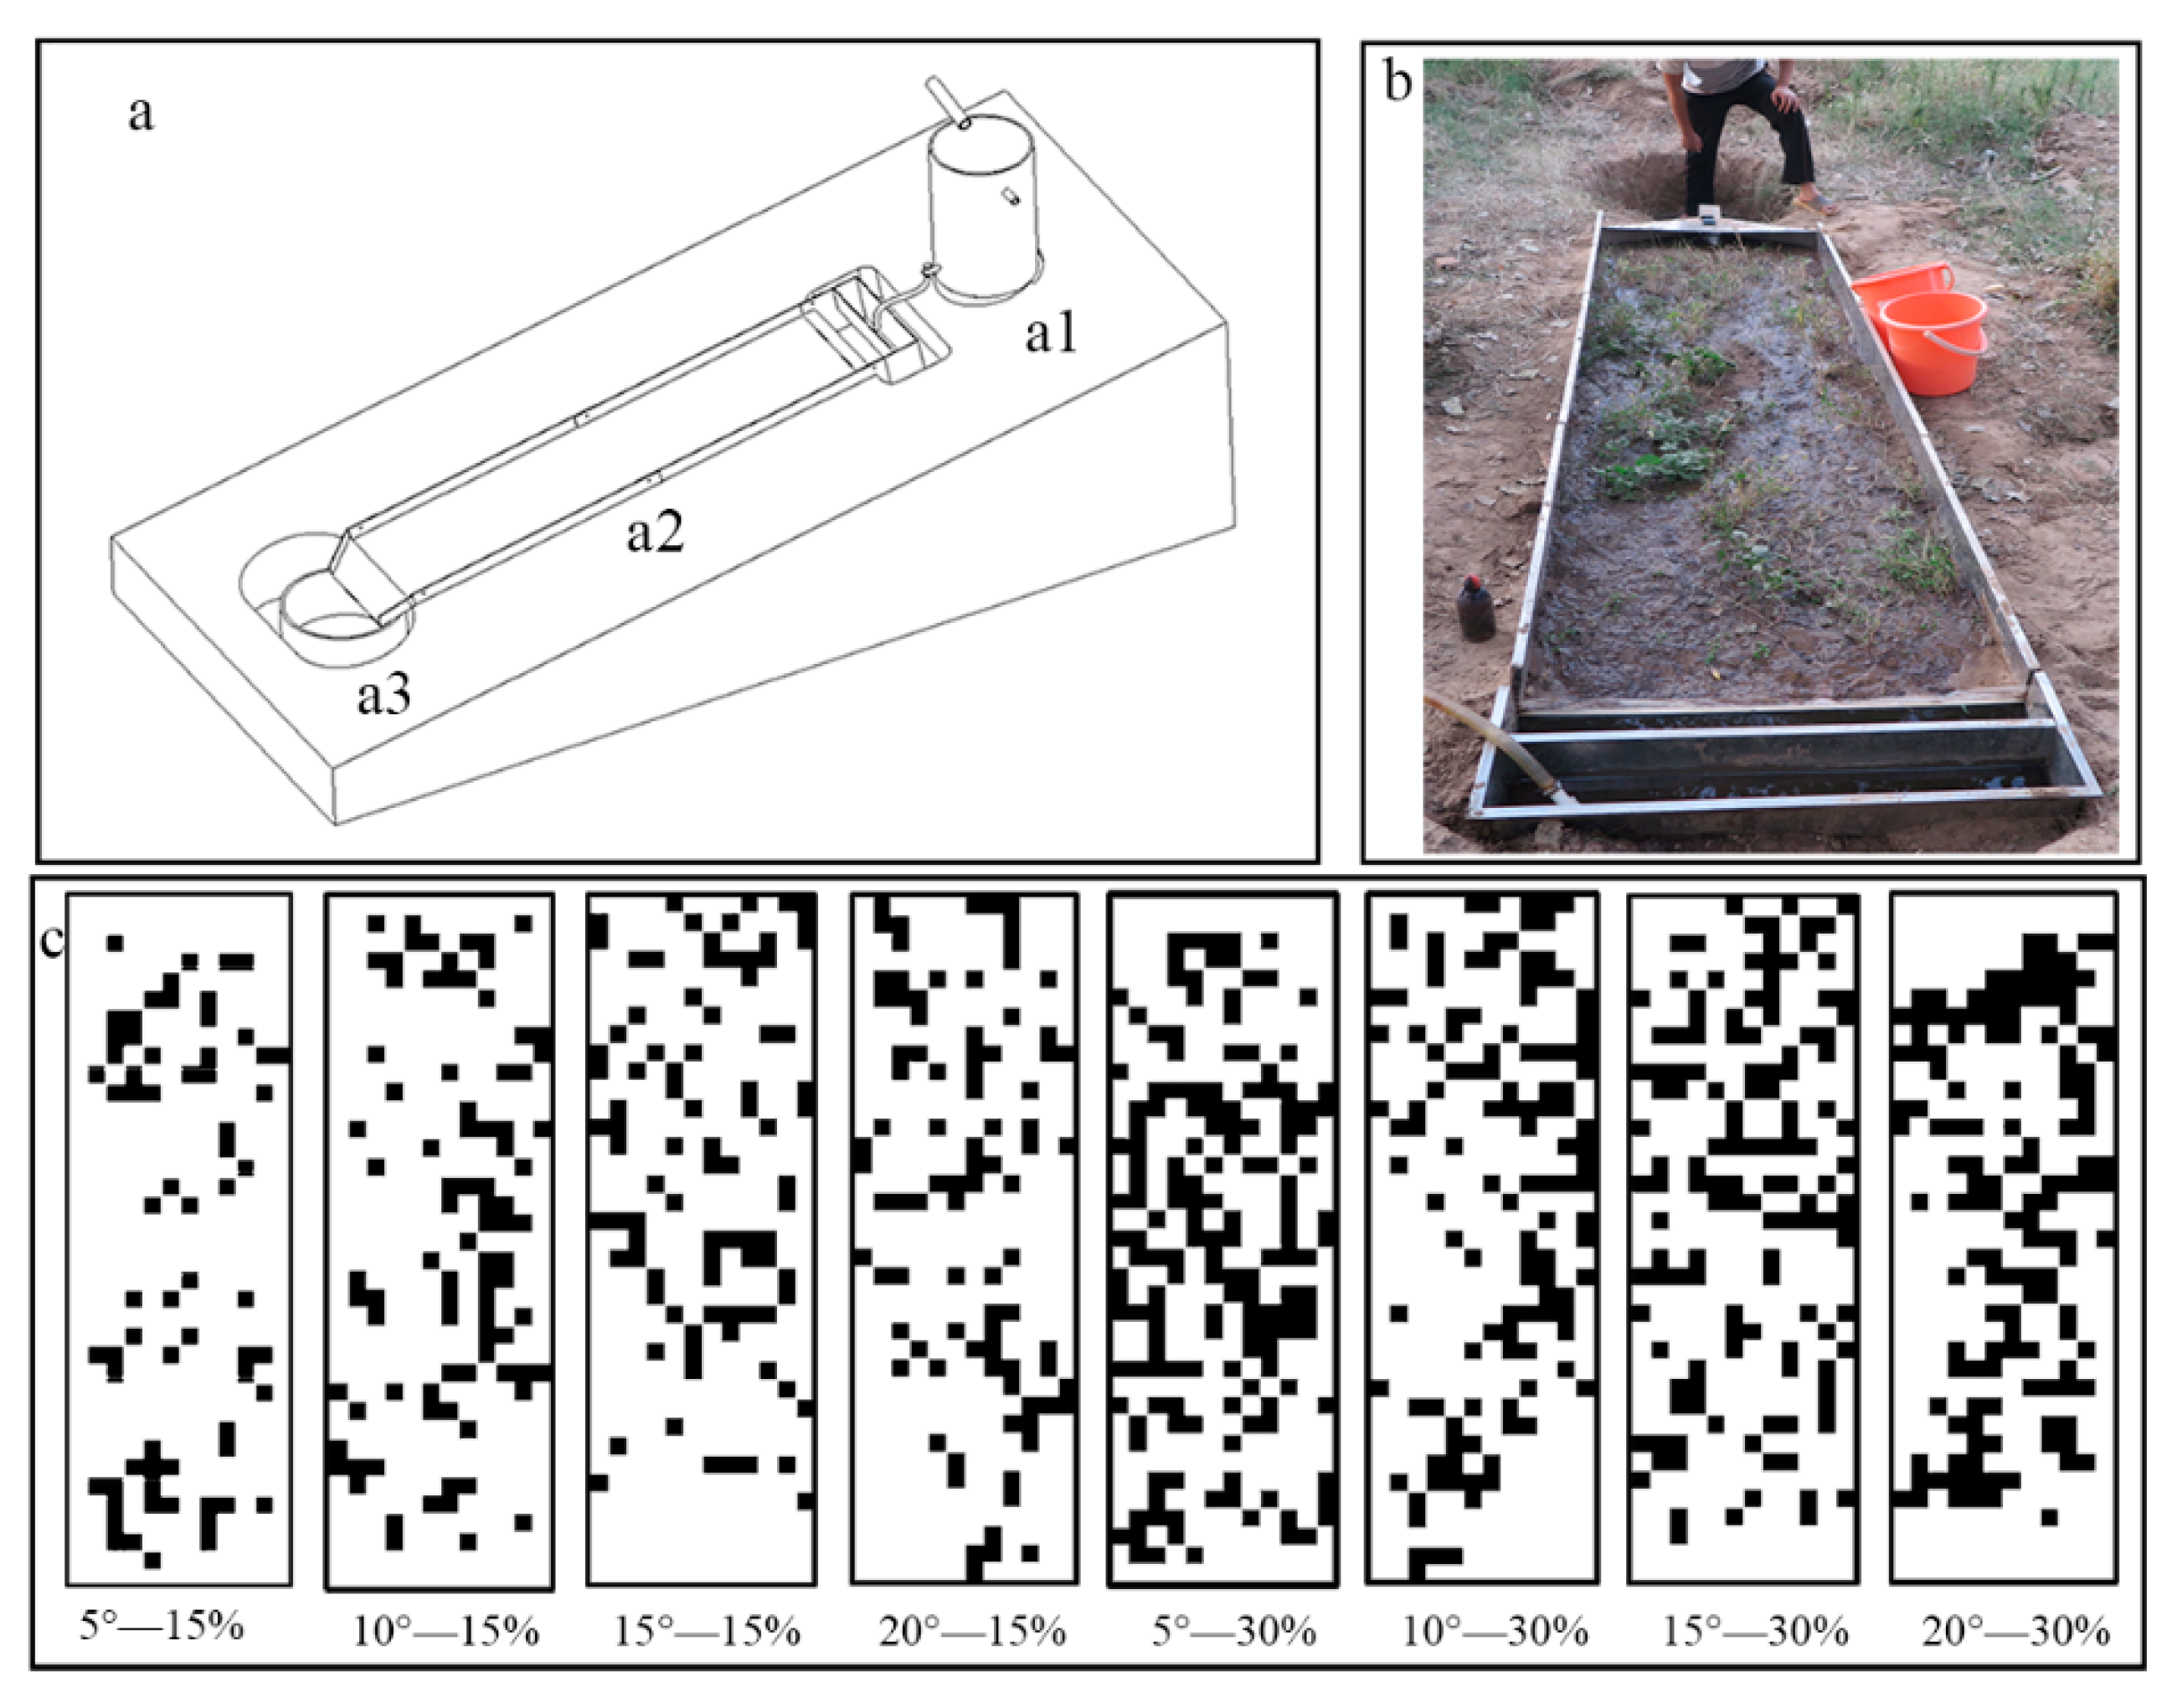
2.2. Experimental Design

The runoff scouring experiments were conducted with a self-designed runoff scouring system which is composed of a water supply subsystem, a steel catchment subsystem, and a runoff and sediment collection subsystem (Figure 2a). The water supply subsystem is mainly composed of a water storage tank, a constant head scouring setup, water pipes, a water pump, and a water valve. The water storage tank is filled with water which is continuously supplied by a high-pressure automatic water supply tower to ensure consistent hydraulic pressure throughout the experiment. The constant head scouring setup placed at the top of the steel flume is to maintain a uniform water flow into the steel catchment subsystem. The steel catchment subsystem is placed on the riparian slope with the steel flume on the outside of the experimental plot (size = 1 m × 3 m) to separate the plots from the surrounding environment so as to limit and catch the runoff and sediments scoured from upslope. The runoff and sediment collection subsystem is mainly composed of a plastic container (20 L) placed at the foot of the steel catchment subsystem, which is used to collect the runoff and sediments scoured from upslope at the outlet of the steel catchment subsystem.
On the basis of existing research results, riparian topography, vegetation condition, and the discharge per unit width produced by the heavy rain in the study area [27], we used flow rates of 9 L/min and 15 L/min, corresponding to moderate (18 mm/h) and heavy rainfall (30 mm/h) in the study area, to conduct the runoff scouring experiments on four natural riparian slopes with minimal human disturbances at four slope gradients (5°, 10°, 15°, and 20°) and two vegetation cover levels (15% and 30%). Thus, a total of 16 treatments were conducted; each treatment lasted 30 min and was repeated twice. Meanwhile, the soil properties and vegetation types were similar among the four slopes (Table 1).

2.3. Data Measurements and Parameter Calculation

Prior to each runoff scouring experiment, vegetation in the experimental plot was randomly trimmed and was then photographed with a digital camera (Canon SX60 HS) at a height of 2 m perpendicular to the plot. Vegetation cover was then extracted using the Photoshop CS4 software, until the error was less than 0.5% in comparison with the pre-set vegetation cover (Figure 2c). After this, vegetation data observed from the camera was converted to raster data with a pixel size of 8 cm and imported into the FRAGSTATS software program (version 4, University of Massachusetts, Amherst, MA, USA) to calculate the landscape pattern metrics. We computed patch density (PD), perimeter–area fractal dimension (FRAC-MN), perimeter–area ratio distribution (PARA-MN), connectance index (CONNECT), effective mesh size (MESH), splitting index (SPLIT), and aggregation index (AI), at both the landscape level (full-plot with vegetation patches and bare soil patches) and the class level (vegetation patches only). The mathematical expressions and ecological meanings of these metrics representing different landscape aspects are listed in Appendix C of the FRAGSTATS software manual [32].
Prior to each runoff scouring experiment, a sprinkle water process was applied to the experimental plot, in order to reduce heterogeneity of the initial soil moisture between different experimental plots and to ensure the initial conditions were consistent. The volume of the sprinkling water depended on the degree of saturation of the soil surface, which should be fully saturated but with no runoff generated. The flow rate was repeatedly calibrated before the runoff scouring experiments until it was close to the pre-set value with an error less than 2%.
During each runoff scouring experiment, the time of runoff initiation and duration of runoff recession were recorded, and runoff and sediment samples were collected in a marked plastic container at 1 min (0–5 min) and then at 5 min (5–30 min) intervals for a total of 10 samples. The slope flow velocity was measured by the KMnO4 coloration method [8,9,10] and measured at the same time intervals. The average surface flow velocity was multiplied by a correction factor of 0.67 used for calculating the hydraulic characteristics of upslope runoff [8,9,10].
After completion of the runoff scouring experiment, the total runoff volume of each interval was recorded using the weighing method, and then the total amount of sediment was weighed, separated, and dried at 105 °C in an oven for at least 24 h until a constant sediment weight was reached. The runoff coefficient was defined as the ratio of runoff volume to the amount of water release over the same interval.
In this study, hydraulic characteristics, including the runoff coefficient (the ratio of observed total runoff volume to total inflow volume), Froude number (Fr), Reynolds number (Re), Manning roughness coefficient (n), Darcy–Weisbach friction coefficient (f), and flow shear stress (τ) were calculated to indicate the regime, resistance, and stress of overland flow [33]. Fr is the ratio of inertia to gravitational forces, where Fr < 1 indicates the occurrence of subcritical flow, while Fr > 1 indicates the occurrence of supercritical flow. Re is the ratio of inertia to viscous forces; we chose Re = 500 as the critical value of laminar/turbulent flow. Fr and Re are both used to indicate flow regime and are calculated as follows:
F r = U g · h
R e = U · h v
where U is average surface flow velocity (m s−1), v is kinematic viscosity (m2 s−1), g is acceleration of gravity (m s−2), and h is flow depth (m) calculated as:
h = q U = Q U · B t
where q is the discharge (m2 s−1) per unit width, Q is the observed total runoff volume (m3) during time t (s), and B is width of the water-crossing section (m).
The Darcy–Weisbach friction coefficient (f) and Manning roughness coefficient (n) reflect the resistance of overland flow, which were calculated from Equations (4) and (5), respectively:
f = 8 · g · h · J U 2
n = h 2 / 3 · J 1 / 2 U
where J is the flow energy gradient (m m−1) calculated as the sine value of slope gradient, and then U, h, and g are as defined above (Equation (1)).
Flow shear stress (τ, N m2) characterizes the force generated by slope runoff along the direction of slope, which reflects the magnitude of force required to disperse soil particles and is calculated from Equation (6):
τ = γ · R · J = γ · Q · J U · B t
where γ (N m−3) is the gravity of water, R is the hydraulic radius, which was considered equal to the flow depth (h) under the overland flow condition, and then Q, J, U, and Bt are as defined above.
In addition, the relationship between riparian vegetation pattern indices and the hydraulic characteristics of the upslope runoff was determined by Pearson’s correlation analysis using the SPSS 17.0 software package (SPSS, Chicago, IL, USA).

3. Results

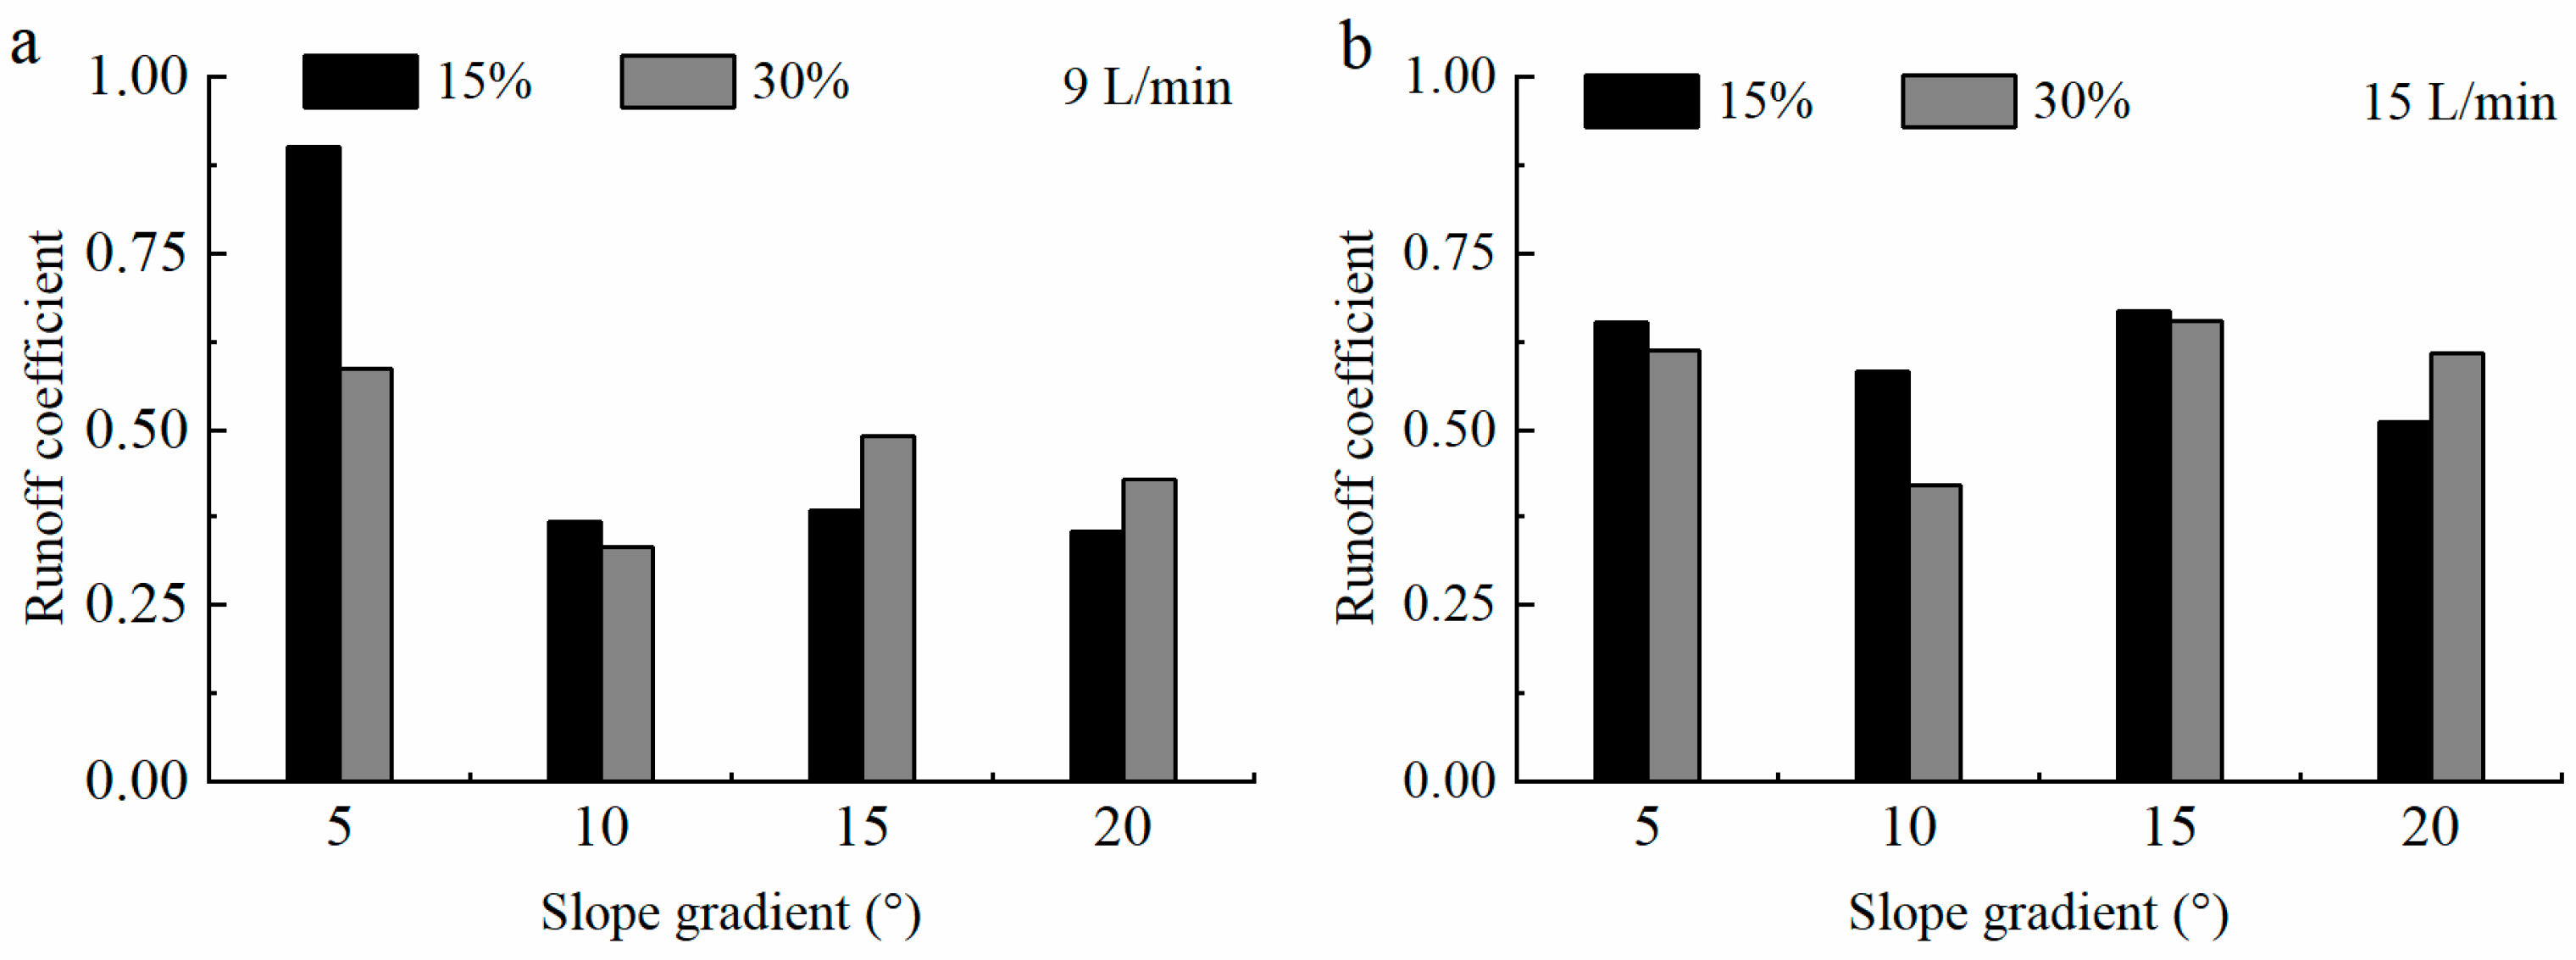
3.1. Runoff Coefficient on Different Riparian Slopes

The runoff coefficient ranged from 0.33 to 0.90 during the experiment (Figure 3). The largest runoff coefficient of 0.90 was observed on the 5° slope with a flow rate of 9 L/min and 15% vegetation cover, which could be related to the soil crust caused by the initial rainfall. More likely, the distribution of vegetation patch of this treatment, which showed aggregated pattern in the center of the experimental plot, may lead to the high runoff coefficient. This indicates that vegetation pattern may be a significant factor that influences runoff generation. Runoff decreased with increasing slope, given the same flow rate and vegetation cover. On the 10°, 15°, and 20° slopes, the runoff coefficient was basically stable. The difference between different slopes under the same vegetation cover was small when the flow rate was 15 L/min.
As expected, runoff coefficients under the 15 L/min flow rate were larger than under the 9 L/min flow rate. Moreover, the runoff coefficient was higher at 15% vegetation cover than at 30% vegetation cover in most treatments with shallow slopes (5° and 10°), indicating that increasing the vegetation cover can moderate the runoff generation.

3.2. Hydraulic Characteristics on Different Riparian Slopes
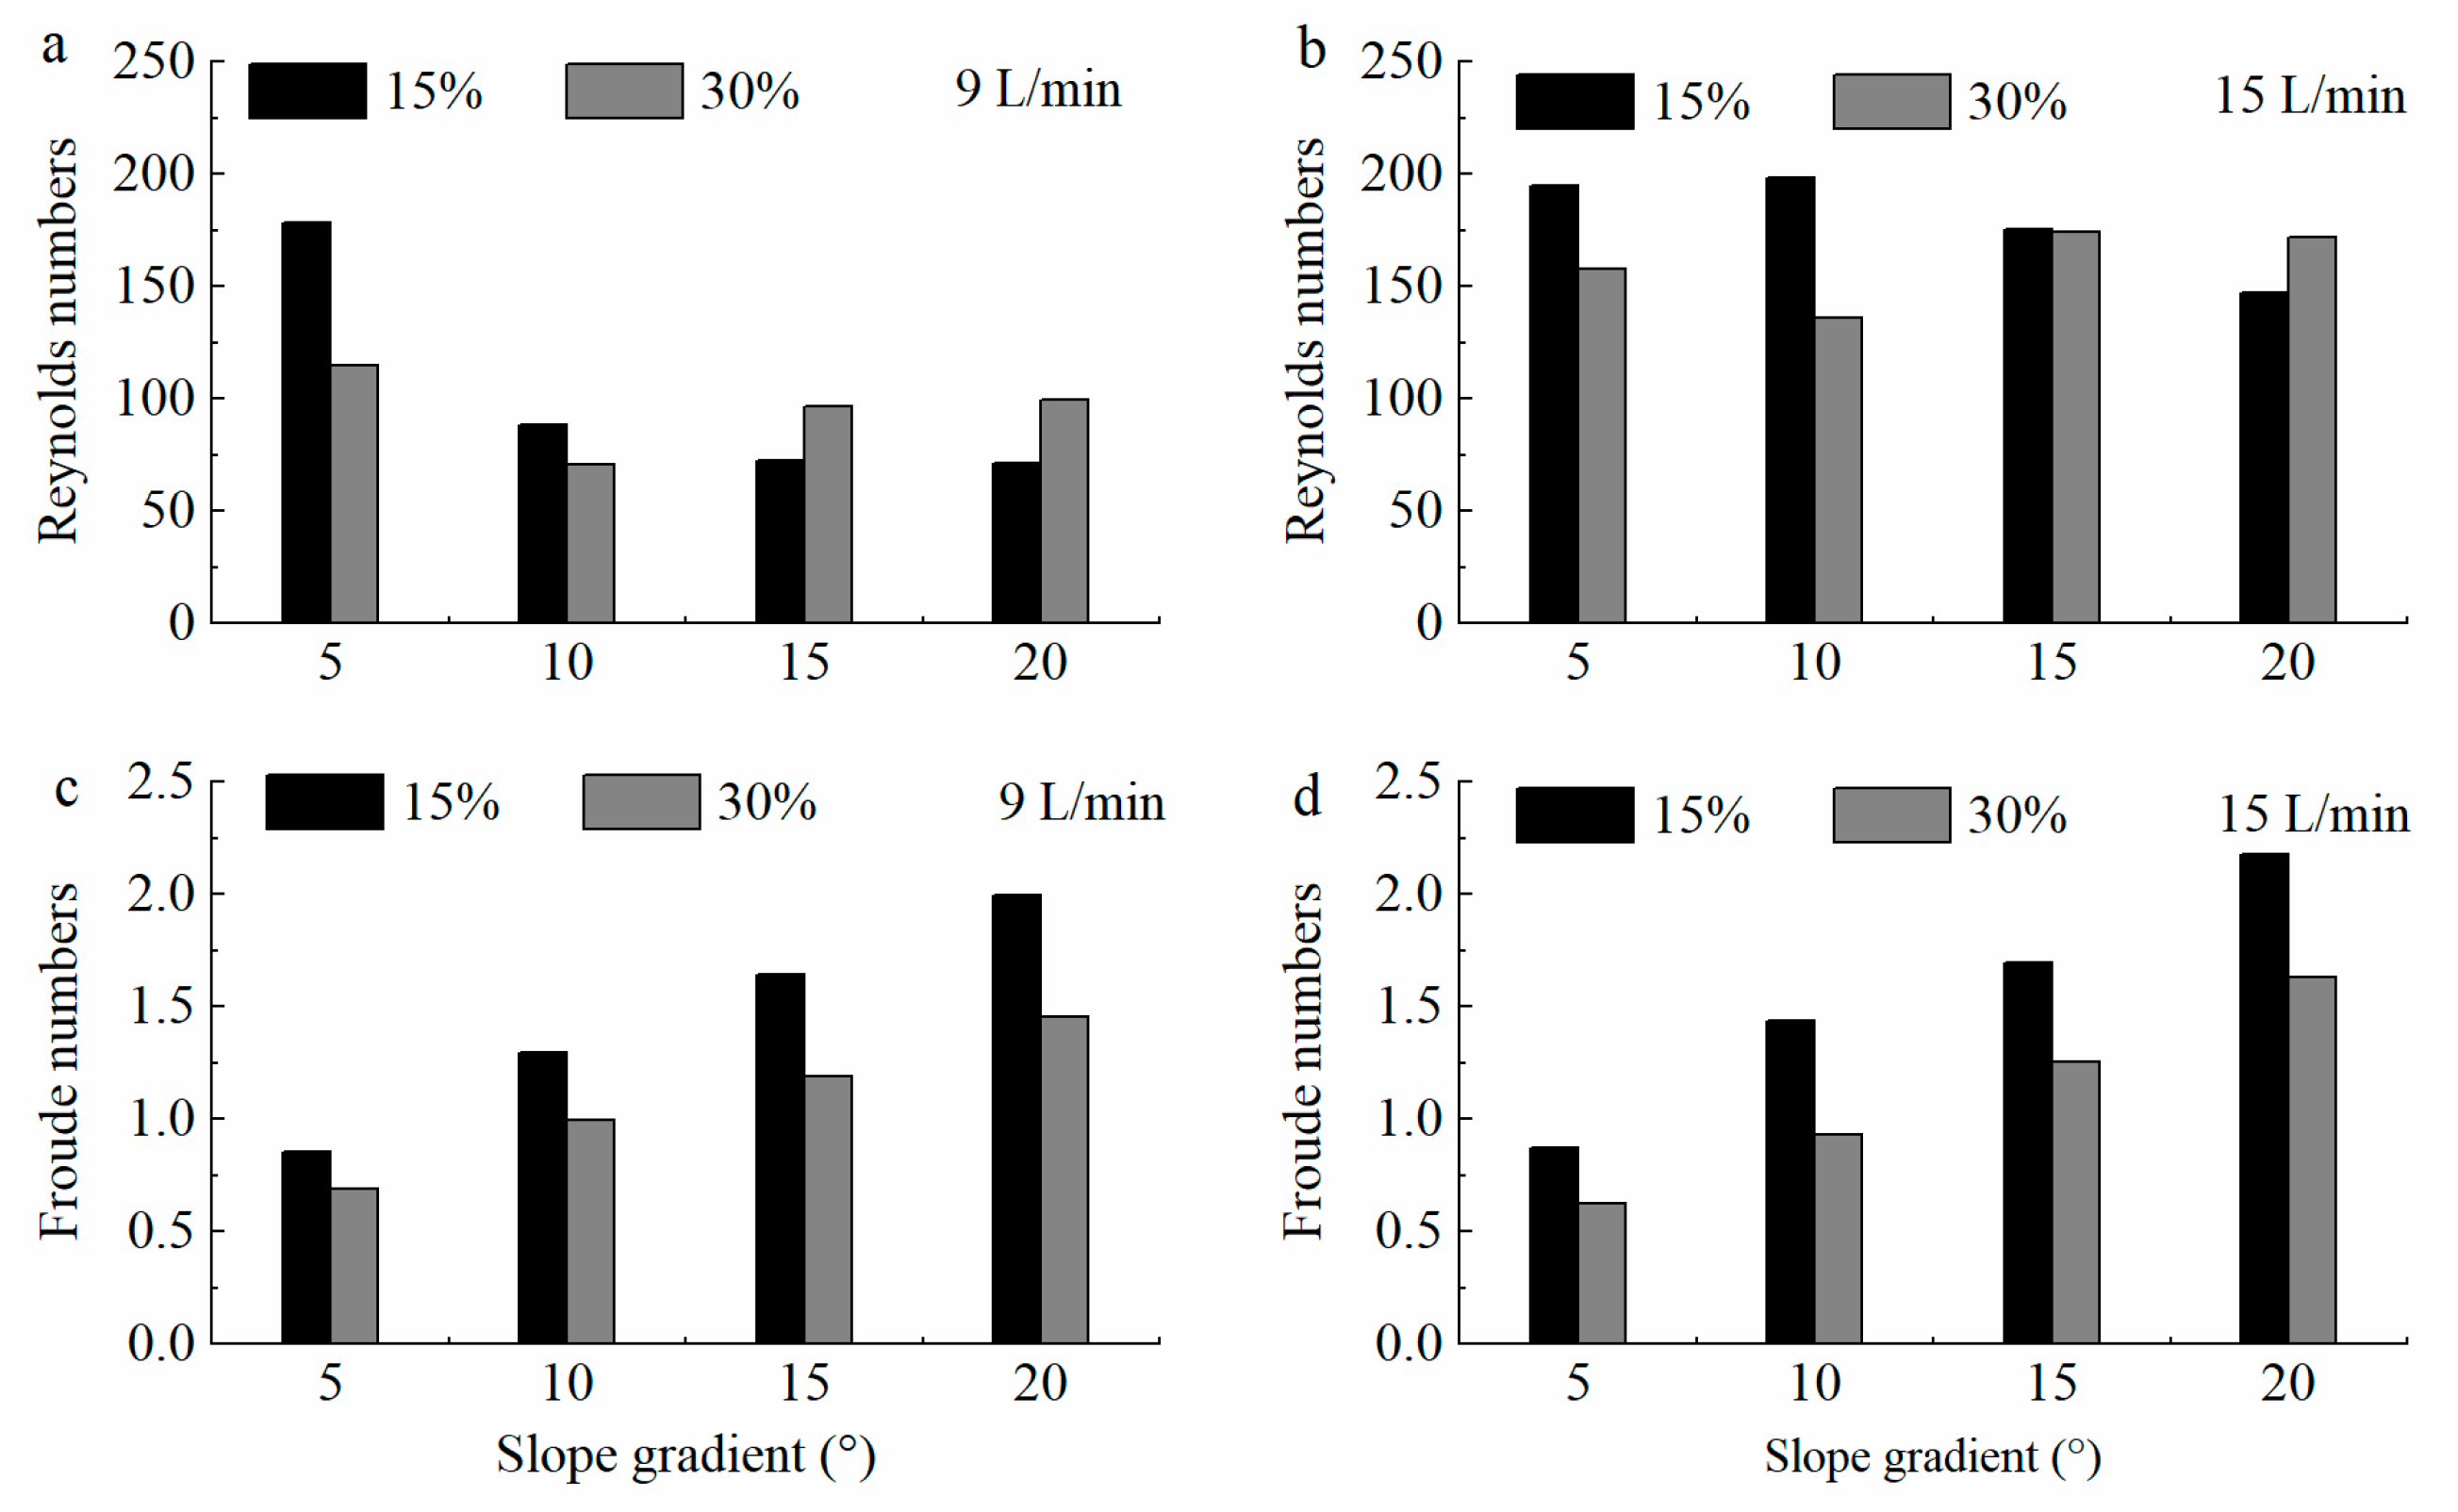
3.2.1. Flow Regime

The Reynolds number (Re) characterizes the turbulence degree of the overland flow. The range of Re was 70.86–198.32 (always less than the critical value of 500), indicating that overland flow on all slopes was laminar according to the criterion of open channel flow (Figure 4).
The Froude number (Fr) represents the supercritical (> 1) or subcritical (< 1) nature of the flow. Fr was greater at the higher flow rate under the same slope gradient, indicating that flow rate affects the flow regime of slope runoff. However, Fr was lower on steeper slopes under the same flow rate, indicating that slope also determines the flow regime of overland flow.
Under different slope gradients, vegetation cover, and flow rate, Fr of overland flow ranged from 0.62 to 2.18 (Figure 4). Fr decreased at the higher vegetation cover and flow rate treatments. Fr was less than 1 on the 5° slope (range = 0.62–0.87) indicating subcritical flow, but was greater than 1 on the steeper slopes (range = 1.02–2.18) indicating supercritical flow. Thus, slope gradient effectively determined the flow regime of overland flow.

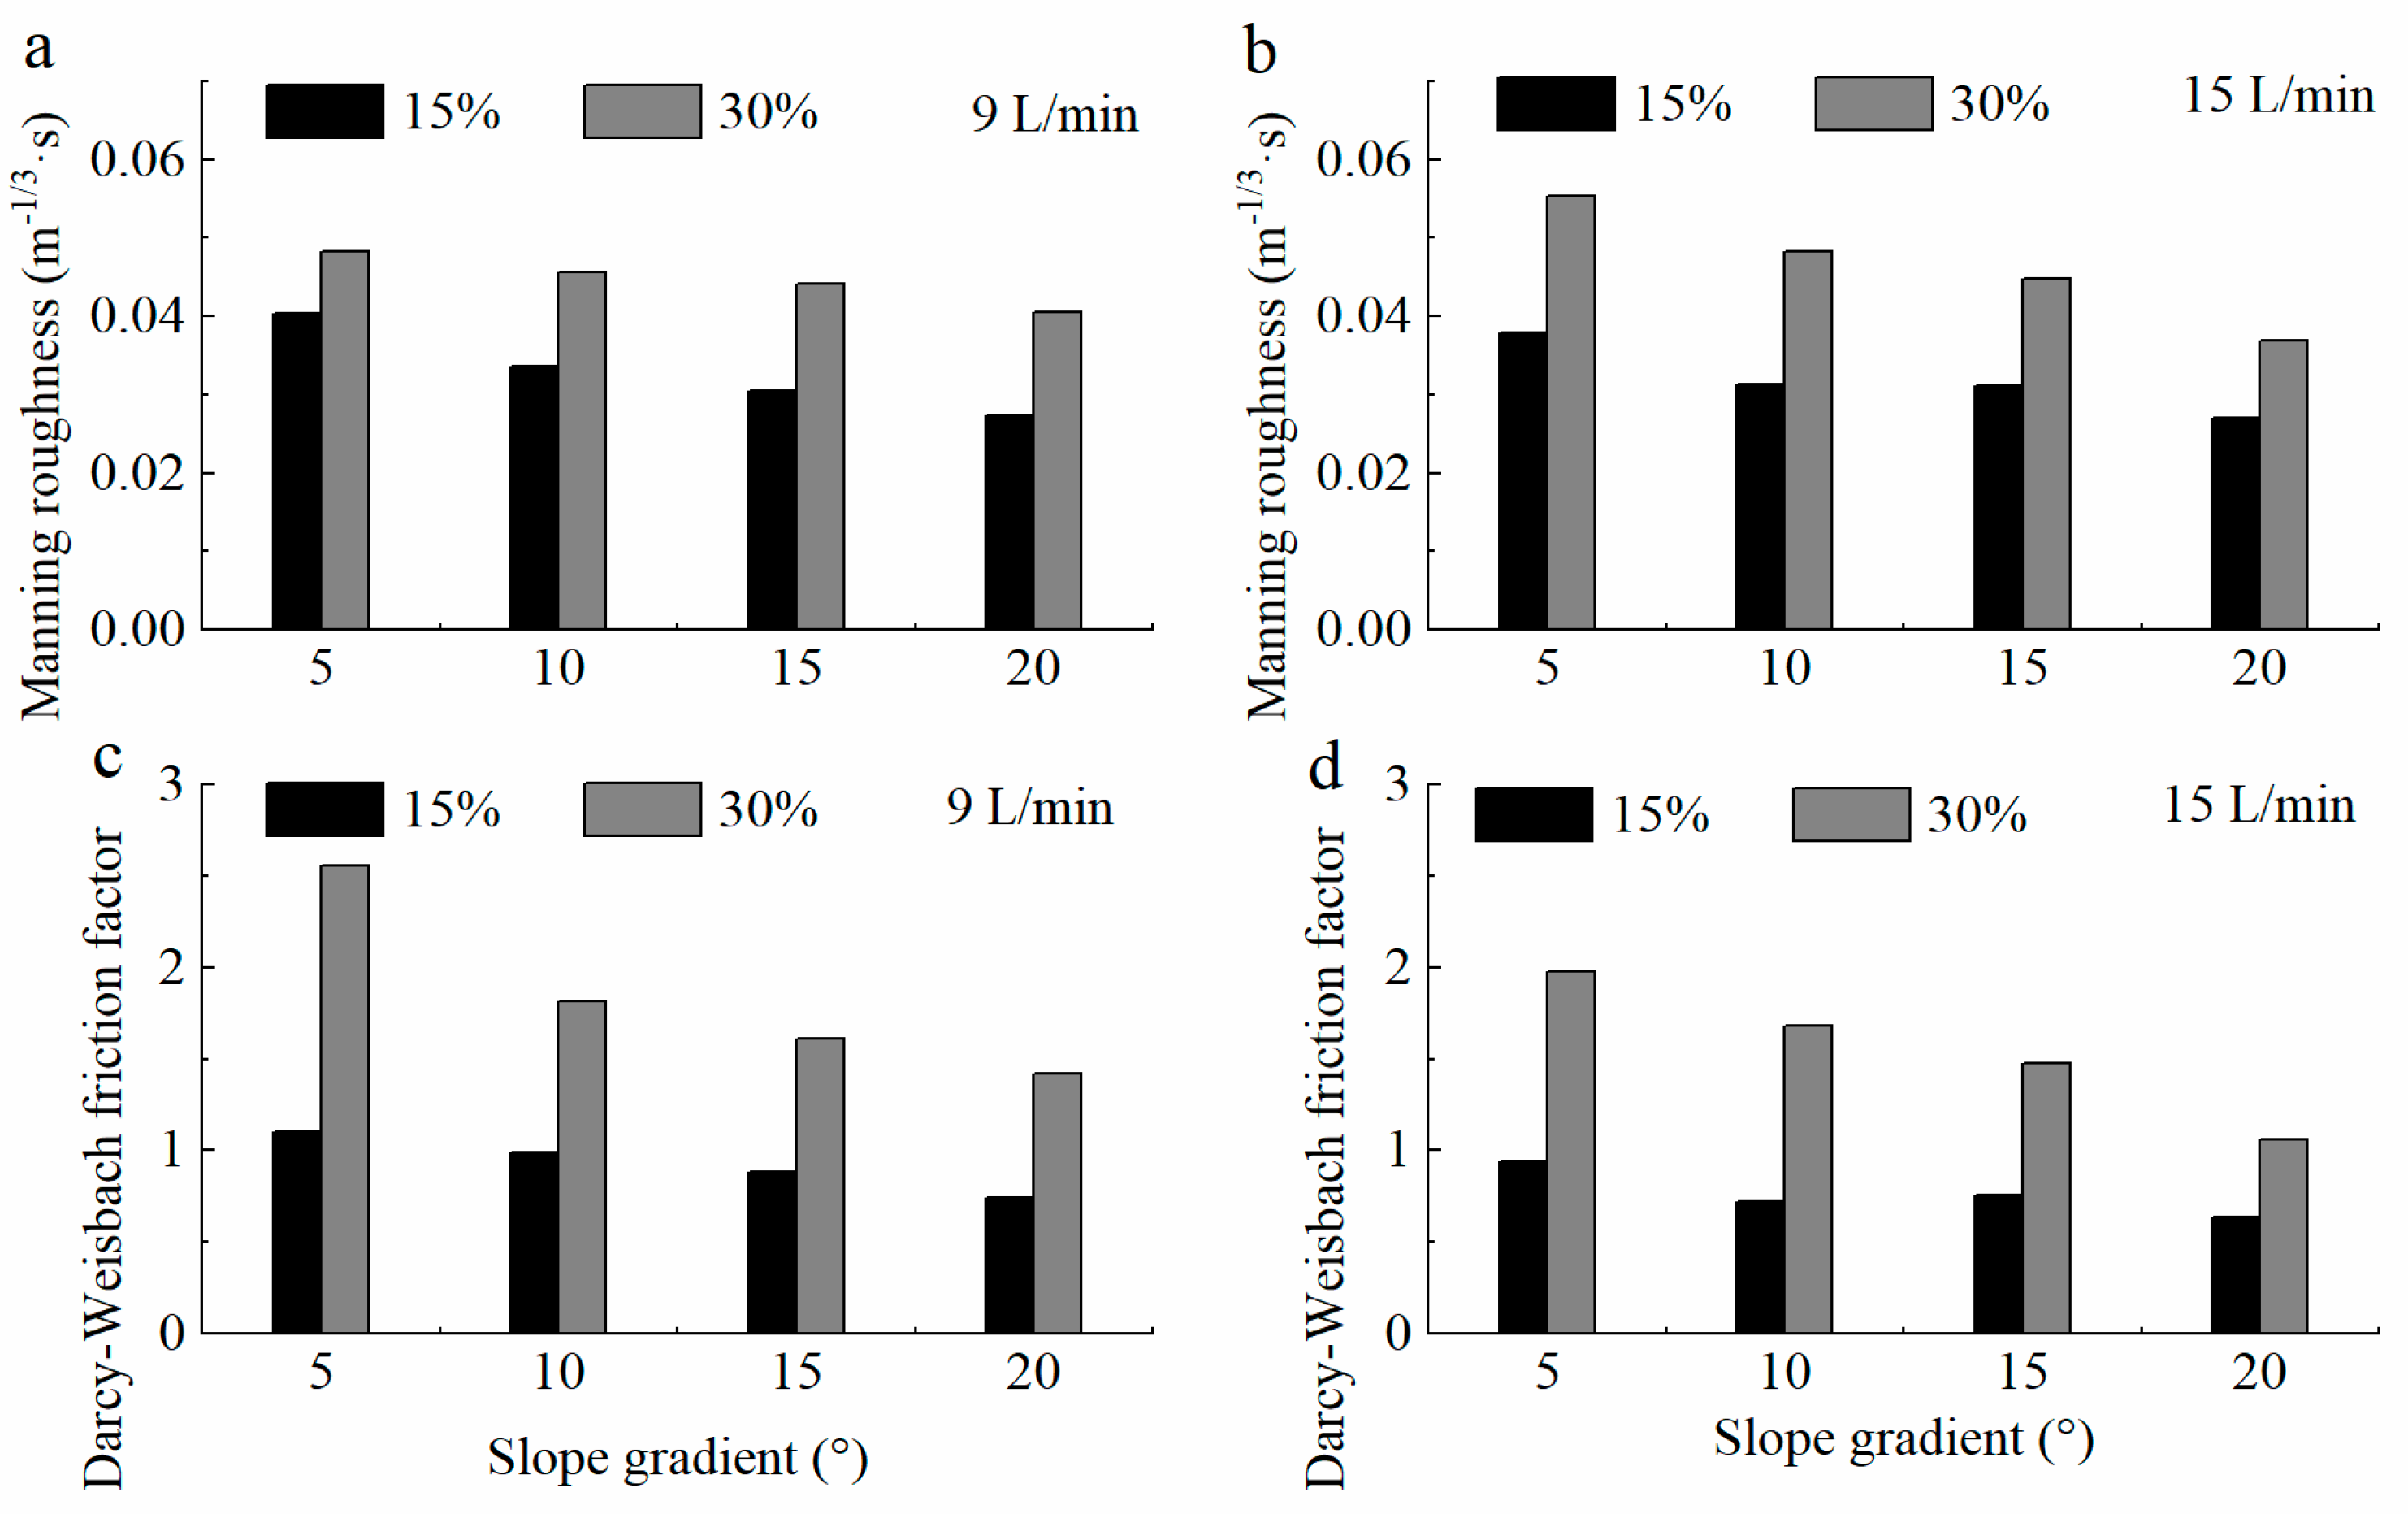
3.2.2. Flow Resistance

Vegetation patchiness effectively increases flow resistance. The Manning roughness coefficient (n) was generally higher at the higher vegetation cover and flow rate treatments but decreased with increasing slope gradient (Figure 5). The range of n was 0.037–0.055 for the 15% vegetation cover and 0.021–0.038 for the 30% vegetation cover treatment, suggesting that vegetation is less effective at inhibiting overland flow on steeper slopes.
The Darcy–Weisbach friction coefficient (f) was similar to n (Figure 5). Its range was from 0.633–1.102 at the 15% vegetation cover and 1.059–2.555 at the 30% vegetation cover treatment, so f was higher with greater vegetation cover. Additionally, f decreased with an increasing slope gradient, but only on slopes with 30% vegetation cover where f was much higher at shallow slope gradients than on the 15% vegetation cover plots.

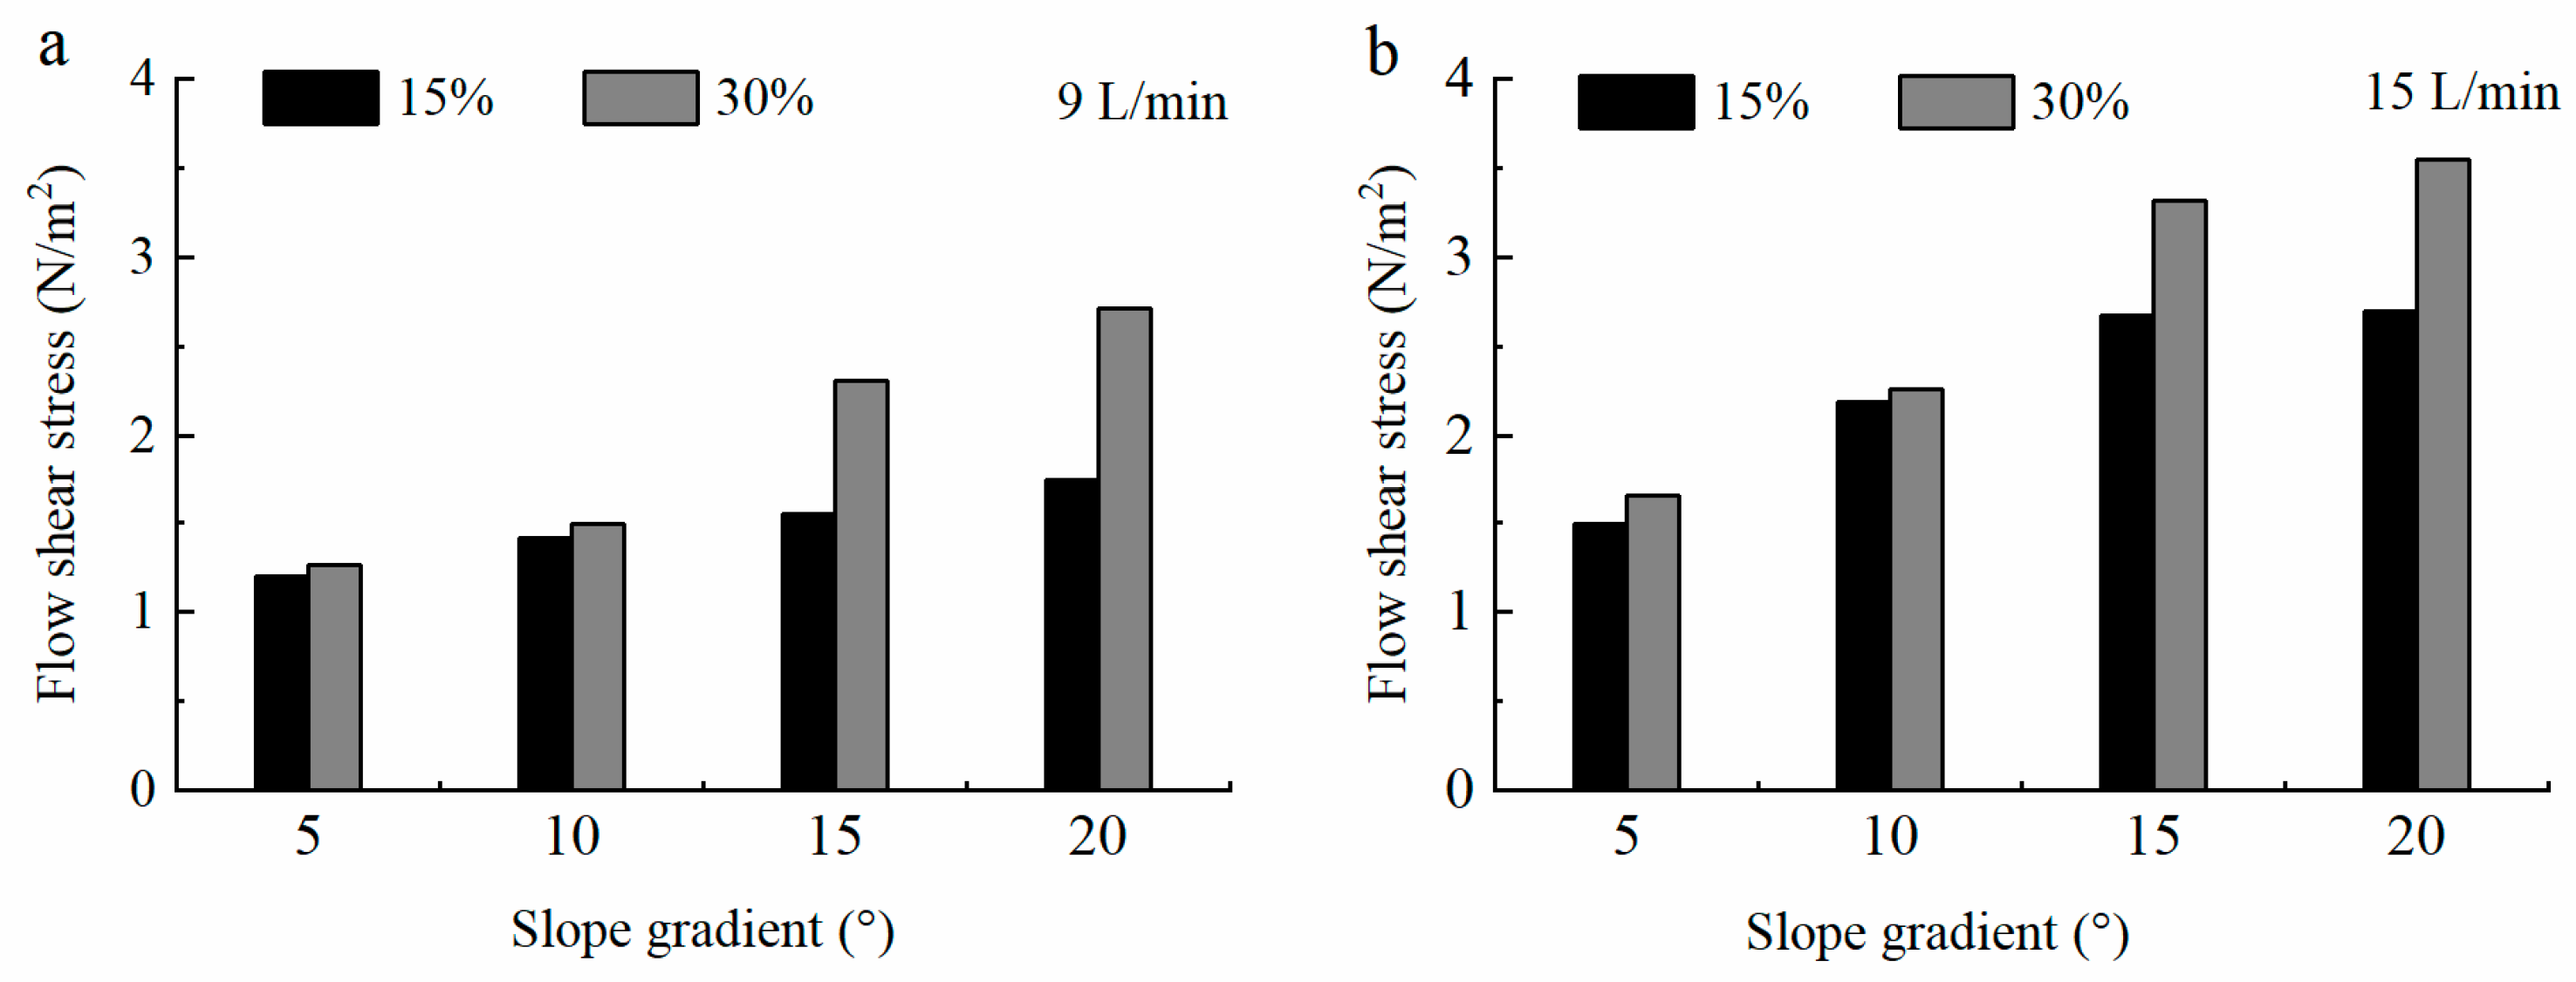
3.2.3. Flow Shear Stress

Flow shear stress (τ) is the primary driving force that detaches and disperses soil particles from land surface. Flow shear stress ranged from 1.42–2.70 N m−2 on the 15% vegetation cover plots and 1.50–3.55 N m−2 on plots with 30% vegetation cover (Figure 6). In general, τ was higher on steeper slopes with more vegetation cover and a high flow rate.

3.3. Relationship between Riparian Vegetation Pattern and Hydraulic Characteristics

Changes in the vegetation pattern indices for the same vegetation cover were notable, both at the landscape and class levels (Table 2). PD, CONNECT, and MESH varied obviously between different slopes with the same vegetation cover. This variation indicated that, in addition to vegetation cover and slope gradient, the distribution of vegetation might be a significant factor influencing the hydraulic characteristics of overland flow.
At the landscape level, both n and f were negatively related to PD, PARA-MN, MESH, and AI, and positively related to FRAC-MN, CONNECT, and SPLIT (Table 3). Fr was positively related to PD and AI. These results indicated that greater fragmentation of the landscape is associated with lower flow resistance of overland flow, increasing the velocity of overland flow, as well as the erosion of surface soil.
Compared to the landscape level, at the class level vegetation indices (MESH, SPLIT, and AI) showed the opposite relationships with hydraulic characteristics (n and f). n and f were negatively related to PD and SPLIT, but positively related to FRAC-MN, CONNECT, MESH, and AI. τ was negatively related to PARA-MN. Fr was negatively related to FRAC-MN and MESH, but positively related to PD and SPLIT. The larger mesh size and more fragmented vegetation was associated with the lower τ and slower runoff, indicating that dispersed vegetation patches can decrease the shear stress of overland flow and subcritical flow.

4. Discussion

4.1. Effects of Vegetation Cover and Slope Gradient on Runoff Hydraulic Characteristics

Surface runoff is the main driver of hydraulic erosion, but vegetation and topography can change the characteristics and erosion dynamics of surface runoff, and ultimately affect the detachment and transport of sediment [34,35]. The hydrodynamics of surface runoff (i.e., erosion and sediment yield) in any topographic unit is mainly determined by slope gradient and length under any given rainfall or runoff scouring conditions. However, vegetation slows flow velocity, increasing infiltration and flow resistance, changing the flow regime from turbulent flow to laminar or subcritical flow. Vegetation cover interacted with slope gradient to moderate runoff generation on slight slopes, the effect of which decreased with increasing slope gradient.
This result is consistent with our previous experiment conducted on the riparian slope of the Beijiang River [36], as well as other researchers’ findings on the relationships between vegetation cover and runoff and sediment yield [15,26,37], and between slope gradient and erosion and hydraulic characteristics [9,16], suggesting that the effect of vegetation in inhibiting runoff generation depends on the slope gradient [36]. This result also supports the viewpoint of Qin et al. [35], who concluded that changes in the erosion dynamics of upslope runoff are determined by a combination of vegetation and topography and only by understanding the mechanism of their interacting effects on runoff and sediment characteristics can we provide theoretical support for high-efficiency soil and water conservation. Little research has been done in this area and it is urgently needed to understand the multiple factors influencing the slope soil erosion process [35].
The flow regime of overland flow is closely related to the flow rate, vegetation cover, and slope gradient. In this study, overland flow on all slopes were laminar (all Re were < 500) [38], but subject to some variation. As vegetation cover, slope gradient, and surface roughness decreased, Re became larger, thereby the flow became more turbulent. Conversely, the more uneven and steep the slope and the denser the vegetation, the flow became more laminar. Meanwhile, Fr decreased with greater vegetation cover and flow rate, and increased on steeper slopes. Fr was subcritical flow on the 5° slope. This result agrees with Pan and Shangguan [39], Li et al. [40], and Zhang and Hu [17], who all indicated that the flow regime of overland flow on sloped grass plots was laminar. In contrast, as slope gradient increased, the flow regime of overland flow shifted from laminar and subcritical flow to laminar and supercritical flow, suggesting that in our study slope gradient had a greater influence on flow regime than vegetation cover.
Vegetation and slope gradient both are important ground surface characteristics affecting the flow resistance of overland flow. Many previous studies have reported that vegetation can effectively increase flow resistance by increasing the energy that overland flow consumes in order to run through it, and thus reduce the energy available for separating and transporting soil particles [16,37,41]. Our result generally agrees with previous studies, apart from slope gradient. In our study, the flow resistance (f and n) of overland flow tended to decrease with increasing slope gradient, consistent with the runoff scouring experiments of Yang et al. [16]. These studies contrast with Pan and Shangguan [39] and Shen et al. [38], who found that flow resistance was associated with an increase in slope gradient. Such differences may be attributable to many factors, including experimental methods, soil type and soil texture, vegetation type and distribution, and erosion type [8,38]. Additionally, slope gradient exhibited a greater impact on flow resistance caused by vegetation cover. The difference in flow resistance between 15% and 30% vegetation cover decreased as slope gradient increased, indicating that steeper slopes harbor more energy for overland flow. Although the interaction between slope gradient and vegetation cover plays a dominant role in determining flow resistance, the inhibiting effect of vegetation will be constant once the slope attains a certain gradient [10,39].
Flow shear stress (τ) increased with increasing slope gradient, vegetation cover, and flow rate. The difference in τ between vegetation cover became larger with an increasing slope gradient. This result is consistent with Zhang et al. [42], who examined slope erosion in the grasslands of Southern China with simulated rainfall. However, opposite results were obtained by Yang et al. [43], who concluded that τ decreased with increasing vegetation cover because vegetation increases infiltration and decreases runoff depth. The change in runoff depth is important. When erosion changes from inter-rill erosion to rill erosion, runoff will continuously converge into the rills and incise the slope, which in combination with the inhibiting and intercepting effects of vegetation can ultimately result in an increase in runoff depth [44]. In our study, the experimental slopes were kept in their original state with little artificial damage, so the soil structure and cohesion were better than an artificial slope in the laboratory, maintaining inter-rill erosion patterns and potentially the reason that more vegetation cover can increase τ.
As mentioned above, in addition to vegetation cover and slope gradient, experimental methods, soil attributes (type and soil texture), vegetation type and distribution, and erosion type also influence the hydraulic characteristics of overland flow, and thus influence the detachment and transport processes of soil erosion [8,38]. For instance, soil particle size of the experimental slopes is a significant factor influencing detachability of surface soil and resistance of overland flow due to the physical mass of coarse particles and cohesion of small particles [45]. Correspondingly, high-silt soils show a higher erodibility than high-clay and high-sand soils. In this study, the clay/silt contents varied among the experimental plots; however, the differences were insignificant. Its influence on the hydraulic characteristics of overland flow could be ignored as the tested plots were located at the same riparian slope with different slope gradient and vegetation cover. Moreover, slope gradient and vegetation cover are important factors in the mathematical modeling of the soil erosion processes [7,26], thus our results can provide new and consistent data for calibrating such models.

4.2. Relationship between Vegetation Pattern and Runoff Hydraulic Characteristics

The relationship between vegetation and soil erosion is important for soil and water conservation. Many studies have demonstrated that increasing vegetation cover is an effective measure to control soil erosion, but variation in the specific vegetation and its distribution can result in better or worse control of soil and water loss [31,46,47,48]. Bare land with a mosaic of vegetation patches forms a source and sink pattern of soil and water loss [25,34,47,49]. Under certain topographic conditions, the influence of vegetation on runoff and water erosion dynamics depends not only on total cover but also on the distribution. In this study, we analyzed the relationship between vegetation pattern and the hydraulic characteristics of the lower reaches of the Yellow River at the landscape and class levels. We observed that, at both levels, flow resistance (f and n) was negatively related to PD and positively related to FRAC-MN and CONNECT. However, relationships between flow resistance and AI, MESH, and SPLIT at the landscape level were the opposite of those at the class level. These results suggest that a fragmented landscape reduces flow resistance and increases soil erosion. Therefore, it is important to consider the influence of landscape patterns on soil erosion processes in particular, and examine the variation in ecological processes at several spatial scales in general [50].
Previous studies indicated that the correlation between landscape indices and process variables is different at different levels [50], with the correlation at the class level showing a stronger statistical relationship than that at the landscape level [51]. Although our results confirmed the difference between these different levels, we did not observe a stronger statistical relationship at the class level. In fact, we observed the opposite relationship between the landscape level and class level with respect to AI, MESH, and SPLIT. This result could be related to the fact that changes in landscape elements, especially the spatial distribution of vegetation patches, will inevitably lead to changes in eco-hydrological transfer processes across scales, leading to non-linear changes in soil erosion processes [19,23]. For example, the AI, which reflects the degree of fragmentation of patches within a landscape, not only has a direct positive effect on the average patch area at the landscape level, but also has a negative effect on the fractal dimension at the class level [50]. Coincidentally, PD and MESH, which both indicate landscape fragmentation, were positively related to Fr at the landscape level but negatively at the class level. These results mean that the effects of landscape patterns on the processes of soil and water loss are the result of nesting and combining of patches at several different levels. Furthermore, the negative relationship between the AI and flow resistances of overland flow is consistent with Yang et al. [16] and Zhang et al. [1], who found that aggregated vegetation patches showed the least flow resistance compared to uniformly and randomly distributed patches; erosion modulus were closely related to changes in the AI at the landscape level. The effect of vegetation patterns on soil erosion processes is therefore very complex. Only by correctly understanding the relationships between vegetation and soil erosion at different scales can we deepen our understanding of the mechanism of soil erosion [50,52].

4.3. Implications for Sustainable Management of Riparian Ecosystems

Over the past decade, considerable attention has been focused on the restoration of riparian vegetation to filter and retain sediment, remove nonpoint source pollution, and improve the biological integrity of the riparian ecosystems [2]. Numerous studies have provided evidence for the efficacy of riparian ecosystems with different vegetation type, cover, and buffer width in their soil and water conservation functions and non-point source pollution control functions [2,27,28,36,41,53]. This increased understanding provides a solid basis for the sustainable management of riparian ecosystems [28]. However, we lack an understanding of how the spatial distribution of vegetation influences the complex mechanisms of the soil erosion process. This study aimed to overcome this issue by linking vegetation patterns to hydraulic characteristics of upslope runoff. Our results suggest that, in addition to terrain conditions, not only vegetation cover but also vegetation patterns contribute to hydraulic characteristics of upslope runoff. This indicates that establishing vegetation with a certain degree of cover within the riparian zone may not be sufficient for promoting soil and water conservation. In light of the evidence synthesized in this study, we recommend that soil and water conservation functions of riparian ecosystems could be enhanced by incorporating vegetation patterns, rather than relying on vegetation type or cover alone. This would be useful where a better understanding of soil and water conservation functions of riparian ecosystems is desired [54,55]. Through watershed planning and restoring measures, an optimal pattern of riparian vegetation may be implemented as an effective tool for sustainable management of riparian ecosystems [56].

5. Conclusions

Vegetation cover and slope gradient are the main factors affecting the soil and water conservation functions of riparian ecosystems and are critical parameters of empirical and process-based models for assessing riparian ecosystem services. However, their relationships with the soil erosion process vary considerably. This is especially true for the vegetation cover–soil loss relationship, in which vegetation cover alone is insufficient to explicitly address the effects of vegetation on soil loss. Vegetation patterns such as size, shape and spatial organization of patches may be responsible for the unexplained variation in the vegetation cover–soil loss relationship. In the present study, we examined the relationship between riparian vegetation pattern and the hydraulic characteristics of upslope runoff in the riparian zone of the lower Yellow River, China.
We confirmed the significant effects of vegetation cover and slope gradient on the hydraulic characteristics of upslope runoff. The runoff coefficient varied between different vegetation cover and slope gradient. However, it should be determined by a combination of vegetation cover and distribution and slope gradient. It can be enhanced by increasing the flow rate and moderated by increasing vegetation cover, in particular on shallow slopes. Flow resistance, which increased with vegetation cover and decreased with slope gradient, was high on shallow slopes with high vegetation cover. Flow shear stress increased with slope gradient, vegetation cover, and flow rate, and the difference in flow shear stress between vegetation cover became larger with an increasing slope gradient.
The hydraulic characteristics of upslope runoff, especially flow resistance, were significantly related to vegetation pattern. At both the landscape and class levels, flow resistance was negatively related to PD and positively related to FRAC-MN and CONNECT. AI, MESH, and SPLIT showed the opposite relationships with flow resistance at each level. Thus, a fragmented landscape may reduce flow resistance. The influencing mechanism on the soil erosion process therefore dependents on scale.
This study suggests that less fragmented vegetation not only effectively increases flow resistance of upslope runoff but also plays an important role in reducing flow shear stress. These results will contribute to improving the effectiveness of riparian vegetation in trapping sediment, and even in intercepting the pollutants carried by runoff flowing into the river.

Author Contributions

Conceptualization, Q.Z.; methodology, Q.Z.; software, X.J.; formal analysis, Q.Z.; investigation, Q.Z., Y.Z., S.X., X.J. and S.W.; resources, Q.Z. and S.D.; writing—original draft preparation, Q.Z.; writing—review and editing, Q.Z. and S.D.; visualization, Q.Z.; funding acquisition, Q.Z. and S.D.

Funding

This research was funded by the National Natural Sciences Foundation of China (U1804119, 41301197, 41771202), the Colleges and Universities Key Scientific Research Projects of Henan Province (18A170004), and the Science and Technology Project of Henan Province (192102310304).

Acknowledgments

We would like to thank Simon Queenborough at Yale University for his assistance with the English language editing of the manuscript.

Conflicts of Interest

The authors declare no conflicts of interest.

References

  1. Zhang, S.; Fan, W.; Li, Y.; Yi, Y. The influence of changes in land use and landscape patterns on soil erosion in a watershed. Sci. Total Environ. 2017, 574, 34–45. [Google Scholar] [CrossRef]
  2. Márquez, C.O.; García, V.J.; Schultz, R.C.; Isenhart, T.M. Assessment of soil degradation through soil aggregation and particulate organic matter following conversion of riparian buffer to continuous cultivation. Eur. J. Soil Sci. 2017, 68, 295–304. [Google Scholar] [CrossRef]
  3. Wu, B.; Wang, Z.; Zhang, Q.; Shen, N. Distinguishing transport-limited and detachment-limited processes of interrill erosion on steep slopes in the Chinese loessial region. Soil Tillage Res. 2018, 177, 88–96. [Google Scholar] [CrossRef]
  4. Huang, Y.; Chen, X.; Li, F.; Zhang, J.; Lei, T.; Li, J.; Chen, P.; Wang, X. Velocity of water flow along saturated loess slopes under erosion effects. J. Hydrol. 2018, 561, 304–311. [Google Scholar] [CrossRef]
  5. Xing, H.; Huang, Y.-H.; Chen, X.-Y.; Luo, B.-L.; Mi, H.-X. Comparative study of soil erodibility and critical shear stress between loess and purple soils. J. Hydrol. 2018, 558, 625–631. [Google Scholar] [CrossRef]
  6. Wang, B.; Zhang, G.-H.; Yang, Y.-F.; Li, P.-P.; Liu, J.-X. The effects of varied soil properties induced by natural grassland succession on the process of soil detachment. CATENA 2018, 166, 192–199. [Google Scholar] [CrossRef]
  7. Mirzaee, S.; Ghorbani-Dashtaki, S. Deriving and evaluating hydraulics and detachment models of rill erosion for some calcareous soils. CATENA 2018, 164, 107–115. [Google Scholar] [CrossRef]
  8. Xiao, H.; Liu, G.; Liu, P.; Zheng, F.; Zhang, J.; Hu, F. Response of soil detachment rate to the hydraulic parameters of concentrated flow on steep loessial slopes on the Loess Plateau of China. Hydrol. Process. 2017, 31, 2613–2621. [Google Scholar] [CrossRef]
  9. An, J.; Zheng, F.; Lu, J.; Li, G. Investigating the role of raindrop impact on hydrodynamic mechanism of soil erosion under simulated rainfall conditions. Soil Sci. 2012, 177, 517–526. [Google Scholar] [CrossRef]
  10. Zhao, C.; Gao, J.E.; Huang, Y.; Wang, G.; Zhang, M. Effects of vegetation stems on hydraulics of overland flow under varying water discharges. Land Degrad. Dev. 2016, 27, 748–757. [Google Scholar] [CrossRef]
  11. Liu, Y.-J.; Hu, J.-M.; Wang, T.-W.; Cai, C.-F.; Li, Z.-X.; Zhang, Y. Effects of vegetation cover and road-concentrated flow on hillslope erosion in rainfall and scouring simulation tests in the Three Gorges Reservoir Area, China. CATENA 2016, 136, 108–117. [Google Scholar] [CrossRef]
  12. Zhang, X.; Yu, G.Q.; Li, Z.B.; Li, P. Experimental study on slope runoff, erosion and sediment under different vegetation types. Water Resour. Manag. 2014, 28, 2415–2433. [Google Scholar] [CrossRef]
  13. Liu, J.G.; Zhang, X.C.; Li, L.I.; Huang, X.H.; Can, X.U. Effects of vegetation patterns on soil and water loss in purple soil slopeland. J. Soil Water Conserv. 2014, 28, 1–6. [Google Scholar]
  14. Su, Y.; Peng, L.; Li, Z.; Ren, Z.; Xiao, L.; Li, C.; Tang, S.; Wang, T.; Zhang, Y. Effects of slope vegetation patterns on energy regulation and water-sediment response relations in slope-gully system. J. Soil Water Conserv. 2017, 31, 32–39. [Google Scholar]
  15. Ren, K.M.; Wei, W.; Zhao, X.N.; Feng, T.J.; Chen, D.; Yu, Y. Simulation of the effect of slope vegetation cover and allocation pattern on water erosion in the loess hilly region. Acta Ecol. Sin. 2018, 8, 8031–8039. [Google Scholar]
  16. Yang, P.; Zhang, H.; Wang, Y.; Chao, M.A.; Zhang, X. Effects of vegetation coverage and spatial distribution pattern on hydrodynamic characteristics of overland flow. J. Soil Water Conserv. 2016, 30, 26–33. [Google Scholar]
  17. Zhang, G.; Hu, J. Effects of patchy distributed Artemisia capillaris on overland flow hydrodynamic characteristics. Int. Soil Water Conserv. Res. 2019, 7, 81–88. [Google Scholar] [CrossRef]
  18. Zhang, Q.; Wang, Z.; Wu, B.; Shen, N.; Liu, J.E. Identifying sediment transport capacity of raindrop-impacted overland flow within transport-limited system of interrill erosion processes on steep loess hillslopes of China. Soil Tillage Res. 2018, 184, 109–117. [Google Scholar] [CrossRef]
  19. Ludwig, J.A.; Bastin, G.N.; Chewings, V.H.; Eager, R.W.; Liedloff, A.C. Leakiness: A new index for monitoring the health of arid and semiarid landscapes using remotely sensed vegetation cover and elevation data. Ecol. Indic. 2007, 7, 442–454. [Google Scholar] [CrossRef]
  20. Chen, L.; Huang, Z.; Gong, J.; Fu, B.; Huang, Y. The effect of land cover/vegetation on soil water dynamic in the hilly area of the loess plateau, China. CATENA 2007, 70, 200–208. [Google Scholar] [CrossRef]
  21. Bakker, M.M.; Govers, G.; van Doorn, A.; Quetier, F.; Chouvardas, D.; Rounsevell, M. The response of soil erosion and sediment export to land-use change in four areas of Europe: The importance of landscape pattern. Geomorphology 2008, 98, 213–226. [Google Scholar] [CrossRef]
  22. Chen, L.; Liu, Y.; Lv, Y.; Feng, X.; Fu, B. Landscape pattern analysis in landscape ecology: Current, challenges and future. Acta Ecol. Sin. 2008, 28, 5521–5531. [Google Scholar]
  23. Liu, Y. Effectiveness of landscape metrics in coupling soil erosion with landscape pattern. Acta Ecol. Sin. 2017, 37, 4923–4935. [Google Scholar]
  24. Chen, L.; Fu, B.; Xu, J.; Jie, G. Location-weighted landscape contrast index: A scale independent approach for landscape pattern evaluation based on Source-Sink ecological processes. Acta Ecol. Sin. 2003, 23, 2406–2413. [Google Scholar]
  25. Mayor, Á.G.; Bautista, S.; Small, E.E.; Dixon, M.; Bellot, J. Measurement of the connectivity of runoff source areas as determined by vegetation pattern and topography: A tool for assessing potential water and soil losses in drylands. Water Resour. Res. 2008, 44, W10423. [Google Scholar] [CrossRef]
  26. Hould-Gosselin, G.; Rousseau, A.N.; Gumiere, S.J.; Hallema, D.W.; Ratté-Fortin, C.; Thériault, G.; van Bochove, E. Modeling the sediment yield and the impact of vegetated filters using an event-based soil erosion model—A case study of a small Canadian watershed. Hydrol. Process. 2016, 30, 2835–2850. [Google Scholar] [CrossRef]
  27. Cao, Z.; Zhao, Q.; Ding, S.; Zhang, Y.; Liu, P.; Wu, C.; Bian, Z. Effect of slope gradient and vegetation cover on sediment yielding characteristics of the riparian slope. J. Nat. Resour. 2017, 32, 1892–1904. [Google Scholar]
  28. Stella, J.C.; Rodríguez-González, P.M.; Dufour, S.; Bendix, J. Riparian vegetation research in Mediterranean-climate regions: Common patterns, ecological processes, and considerations for management. Hydrobiologia 2013, 719, 291–315. [Google Scholar] [CrossRef]
  29. Méndez-Toribio, M.; Zermeño-Hernández, I.; Ibarra-Manríquez, G. Effect of land use on the structure and diversity of riparian vegetation in the Duero river watershed in Michoacán, Mexico. Plant Ecol. 2014, 215, 285–296. [Google Scholar] [CrossRef]
  30. Zhao, Q.; Liu, Q.; Ma, L.J.; Ding, S.; Lu, X.L.; Zhang, Y.; Cao, Z. Spatial-temporal dynamics of vegetation pattern in a typical riparian buffer zone of the middle and lower reaches of Yellow River. Chin. J. Ecol. 2017, 36, 2127–2137. [Google Scholar]
  31. Cao, Z.; Zhao, Q.; Xianyu, Z.; Ding, S.; Zhang, Y.; Xu, S.; Wu, D. Optimizing vegetation pattern for the riparian buffer zone along the lower Yellow River based on slope hydrological connectivity. Chin. J. Appl. Ecol. 2018, 29, 739–747. [Google Scholar]
  32. McGarigal, K.; Cushman, S.A.; Ene, E. FRAGSTATS v4: Spatial Pattern Analysis Program for Categorical and Continuous Maps. Computer software program produced by the authors at the University of Massachusetts, Amherst. Available online: http://www.umass.edu/landeco/research/fragstats/fragstats.html (accessed on 8 August 2015).
  33. Zhao, Q.; Li, D.; Zhuo, M.; Guo, T.; Liao, Y.; Xie, Z.J.S.E.R.; Assessment, R. Effects of rainfall intensity and slope gradient on erosion characteristics of the red soil slope. Stoch. Environ. Res. Risk Assess. 2015, 29, 609–621. [Google Scholar] [CrossRef]
  34. Xu, X.; Ma, K.; Fu, B.; Liu, X.; Huang, Y.; Qi, J. Research review of the relationship between vegetation and soil loss. Acta Ecol. Sin. 2006, 26, 3137–3143. [Google Scholar]
  35. Qin, W.; Cao, W.; Zuo, C. Review on the coupling influences of vegetation and topography to soil erosion and sediment yield. J. Sediment Res. 2015, 40, 74–80. [Google Scholar]
  36. Zhao, Q.; Ji, X.; Xu, S.; Wu, C. Inhibiting effect of riparian vegetation on erosion and sediment yield of slope runoff. Trans. Chin. Soc. Agric. Eng. 2018, 34, 170–178. [Google Scholar]
  37. Ding, W.; Li, M. Effects of grass coverage and distribution patterns on erosion and overland flow hydraulic characteristics. Environ. Earth Sci. 2016, 75, 477. [Google Scholar] [CrossRef]
  38. Shen, H.; Zheng, F.; Wen, L.; Han, Y.; Hu, W. Impacts of rainfall intensity and slope gradient on rill erosion processes at loessial hillslope. Soil Tillage Res. 2016, 155, 429–436. [Google Scholar] [CrossRef]
  39. Pan, C.; Shangguan, Z. Runoff hydraulic characteristics and sediment generation in sloped grassplots under simulated rainfall conditions. J. Hydrol. 2006, 331, 178–185. [Google Scholar] [CrossRef]
  40. Li, M.; Yao, W.; Yang, J.; Chen, J.; Ding, W.; Li, L.; Yang, C. Experimental study on the effect of grass cover on the overland flow pattern in the hillslope-gully side erosion system. J. Basic Sci. Eng. 2009, 17, 513–523. [Google Scholar]
  41. Xu, X.; Zheng, F.; Qin, C.; Wu, H.; Wilson, G.V. Impact of cornstalk buffer strip on hillslope soil erosion and its hydrodynamic understanding. CATENA 2017, 149, 417–425. [Google Scholar] [CrossRef]
  42. Zhang, S.; Liang, Z.; Xie, Z.; Zhuo, M.; Liao, Y.; Guo, T.; Li, D. Mechanisms of grass in slope erosion control in red soil region of southern China. J. Soil Water Conserv. 2016, 30, 1–5. [Google Scholar]
  43. Yang, C.; Wang, D.; Wang, L. Influence of grass cover degree to hydrodynamic parameters of slope water. Soil Water Conserv. China 2008, 9, 36–38. [Google Scholar]
  44. Li, P.; Cai, W.; Zheng, L.; Ru, H. Effects of vegetative cover on runoff hydraulic characteristics and erosion. Sci. Soil Water Conserv. 2006, 4, 55–59. [Google Scholar]
  45. Wang, L.; Shi, Z.H. Size selectivity of eroded sediment associated with soil texture on steep slopes. Soil Sci. Soc. Am. J. 2015, 79, 917–929. [Google Scholar] [CrossRef]
  46. Lu, R.; Liu, Y.-F.; Jia, C.; Huang, Z.; Liu, Y.; He, H.; Liu, B.-R.; Wang, Z.-J.; Zheng, J.; Wu, G.-L. Effects of mosaic-pattern shrub patches on runoff and sediment yield in a wind-water erosion crisscross region. CATENA 2019, 174, 199–205. [Google Scholar] [CrossRef]
  47. Boer, M.; Puigdefábregas, J. Effects of spatially structured vegetation patterns on hillslope erosion in a semiarid Mediterranean environment: A simulation study. Earth Surf. Process. Landf. 2010, 30, 149–167. [Google Scholar] [CrossRef]
  48. Zhang, G.H.; Liu, G.B.; Liang, Y.I. Effects of vegetation patterns on overland flow resistance. J. Soil Water Conserv. 2014, 28, 55–59, 109. [Google Scholar]
  49. Qin, W.; Cao, W.; Guo, Q.; Yu, Y.; Yin, Z. Review of the effects of vegetation patterns on soil erosion and sediment yield. Acta Ecol. Sin. 2017, 37, 4905–4912. [Google Scholar]
  50. Wang, J.; Yang, L.; Wei, W.; Chen, L.; Huang, Z. Effects of landscape patterns on soil and water loss in the hilly area of loess plateau in China: Landscape-level and comparison at multiscale. Acta Ecol. Sin. 2011, 31, 5531–5541. [Google Scholar]
  51. Tischendorf, L. Can landscape indices predict ecological processes consistently? Landsc. Ecol. 2001, 16, 235–254. [Google Scholar] [CrossRef]
  52. Wang, J.; Yang, L.; Wei, W.; Chen, L.; Huang, Z. Effects of landscape pattern on watershed soil erosion and sediment delivery in hilly and gully region of the Loess Plateau of China: Patch class-level. Acta Ecol. Sin. 2011, 31, 5739–5748. [Google Scholar]
  53. Monteiro, J.A.F.; Kamali, B.; Srinivasan, R.; Abbaspour, K.; Gücker, B. Modelling the effect of riparian vegetation restoration on sediment transport in a human-impacted Brazilian catchment. Ecohydrology 2016, 9, 1289–1303. [Google Scholar] [CrossRef]
  54. Mander, Ü.; Tournebize, J.; Sauvage, S.; Sánchez-Perez, J.M. Wetlands and buffer zones in watershed management. Ecol. Eng. 2017, 103, 289–295. [Google Scholar] [CrossRef]
  55. Keeton, W.S.; Copeland, E.M.; Sullivan, S.M.P.; Watzin, M.C. Riparian forest structure and stream geomorphic condition: Implications for flood resilience. Can. J. For. Res. 2017, 47, 476–487. [Google Scholar] [CrossRef]
  56. Feld, C.K.; Fernandes, M.R.; Ferreira, M.T.; Hering, D.; Ormerod, S.J.; Venohr, M.; Gutiérrez-Cánovas, C. Evaluating riparian solutions to multiple stressor problems in river ecosystems—A conceptual study. Water Res. 2018, 139, 381–394. [Google Scholar] [CrossRef]
Figure 1. Location of the study area and schematic diagram of vegetation distribution and experimental setup. The experiment was conducted in Henan province, China (a), located on the southern bank of the lower Yellow River (b). The lower Yellow River is a perched river with a main-channel width of 0.5 to 3.0 km and a riparian zone with width of 5 to 20 km that restricted by levees (c).
Sustainability 11 02966 g001
Figure 2. The runoff scouring system (a) is composed of a water supply subsystem (a1), a steel catchment subsystem (a2), and a runoff and sediment collection subsystem (a3). Vegetation in the experimental plot was randomly trimmed and was then photographed with a digital camera (b). The black squares indicate vegetation patch, and then the residual blank indicates bare soil patch (c). All treatments were described as slope gradient (°)—vegetation cover (%).
Sustainability 11 02966 g002
Figure 3. Variation in runoff coefficient under four slope gradients, two vegetation cover levels, and two flow rates for a runoff scouring experiment in the lower Yellow River, China. Runoff coefficients under the 9 L/min flow rate (a) were less than under the 15 L/min flow rate (b).
Sustainability 11 02966 g003
Figure 4. Variation in flow regime (Reynolds—(a) and (b) and Froude numbers—(c) and (d)) under four slope gradients, two vegetation cover levels, and two flow rates for a runoff scouring experiment in the lower Yellow River, China.
Sustainability 11 02966 g004
Figure 5. Variation in flow resistance (Manning roughness, n—(a) and (b), and Darcy–Weisbach friction factor, f—(c) and (d)) under four slope gradients, two vegetation cover levels, and two flow rates for a runoff scouring experiment in the lower Yellow River, China.
Sustainability 11 02966 g005
Figure 6. Variation in runoff shear stress under four slope gradients, two vegetation cover levels, and two flow rates for a runoff scouring experiment in the lower Yellow River, China. Flow shear stress under the 9 L/min flow rate (a) were less than under the 15 L/min flow rate (b).
Sustainability 11 02966 g006
Table 1. Soil physical and vegetation characteristic of experimental slopes.
Slope Gradients (°)Initial Soil Moisture (%)Soil Bulk Density (g/cm³)Soil Capillary Porosity (%)Clay Content (%)Silt Content (%)Sand Content (%)Vegetation Type (Plant)
522.001.6032.920.3446.8052.87Grass (Setaria viridis (L.) Beauv.)
1018.001.5734.380.5651.3948.06Grass (Setaria viridis (L.) Beauv.)
1519.001.5536.890.4560.6338.93Grass (Setaria viridis (L.) Beauv.)
2020.001.5938.810.6164.3235.07Grass (Setaria viridis (L.) Beauv.)
Table 2. Landscape pattern indices of different treatments.
VCSGPDFRAC-MNPARA-MNCONNECTMESHSPLITAI
Landscape level15%651.041.114158.0712.501.911.4572.80
10°809.401.084179.789.091.841.5471.76
15°879.791.094105.5410.141.831.5570.64
20°879.791.103986.4513.041.821.5671.16
30%457.491.153685.9729.171.282.2257.38
10°674.721.103981.0215.691.531.8464.15
15°703.831.123954.3413.041.372.0866.48
20°387.111.133612.6635.141.412.0167.41
Class level15%614.871.094338.5812.500.01272.8425.38
10°774.211.074317.109.090.02157.7133.76
15°844.591.094228.4810.140.01196.1628.30
20°844.591.094104.0013.040.01282.4332.30
30%351.911.153973.6226.670.1816.1544.26
10°639.201.094118.3315.690.0648.7738.46
15°702.071.103994.9513.040.1450.8835.95
20°316.721.123694.5433.330.0834.4652.36
Note: Vegetation cover = VC, slope gradient = SG, patch density = PD, perimeter–area fractal dimension = FRAC-MN, perimeter–area ratio distribution = PARA-MN, connectance index = CONNECT, effective mesh size = MESH, splitting index = SPLIT, and aggregation index = AI.
Table 3. Correlation coefficient and significance of the relationships between vegetation pattern and runoff hydraulic characteristics.
PDFRAC-MNPARA-MNCONNECTMESHSPLITAI
Landscape levelRe−0.1310.0520.123−0.0170.139−0.1250.160
Fr0.537 *−0.458 *0.128−0.2180.406−0.4060.571 *
n−0.706 **0.715 **−0.557 *0.556 *−0.725 **0.710 **−0.855 **
f−0.640 **0.733 **−0.576 **0.521 *−0.820 **0.819 **−0.919 **
τ−0.1340.134−0.3610.266−0.3060.2 870.061
Class levelRe−0.1200.0490.165−0.021−0. 4000.145−0.152
Fr0.530 *−0.445 *−0.077−0.201−0.518 *0.462 *−0.119
n−0.710 **0.699 **−0.3680.546 *0.708 **−0.676 **0.489 *
f−0.645 **0.702 **−0.4110.505 *0.838 **−0.779 **0.526 *
τ−0.0890.005−0.587 **0.2890.153−0.2750.413
Note: Reynolds numbers = Re, Froude numbers = Fr, Manning roughness coefficient = n, Darcy–Weisbach friction coefficient = f, and flow shear stress = τ. Vegetation cover = VC, slope gradient = SG, patch density = PD, perimeter–area fractal dimension = FRAC-MN, perimeter–area ratio distribution = PARA-MN, connectance index = CONNECT, effective mesh size = MESH, splitting index = SPLIT, and aggregation index = AI. Asterisks indicate statistical significance (* p < 0.05, ** p < 0.01).

