Article

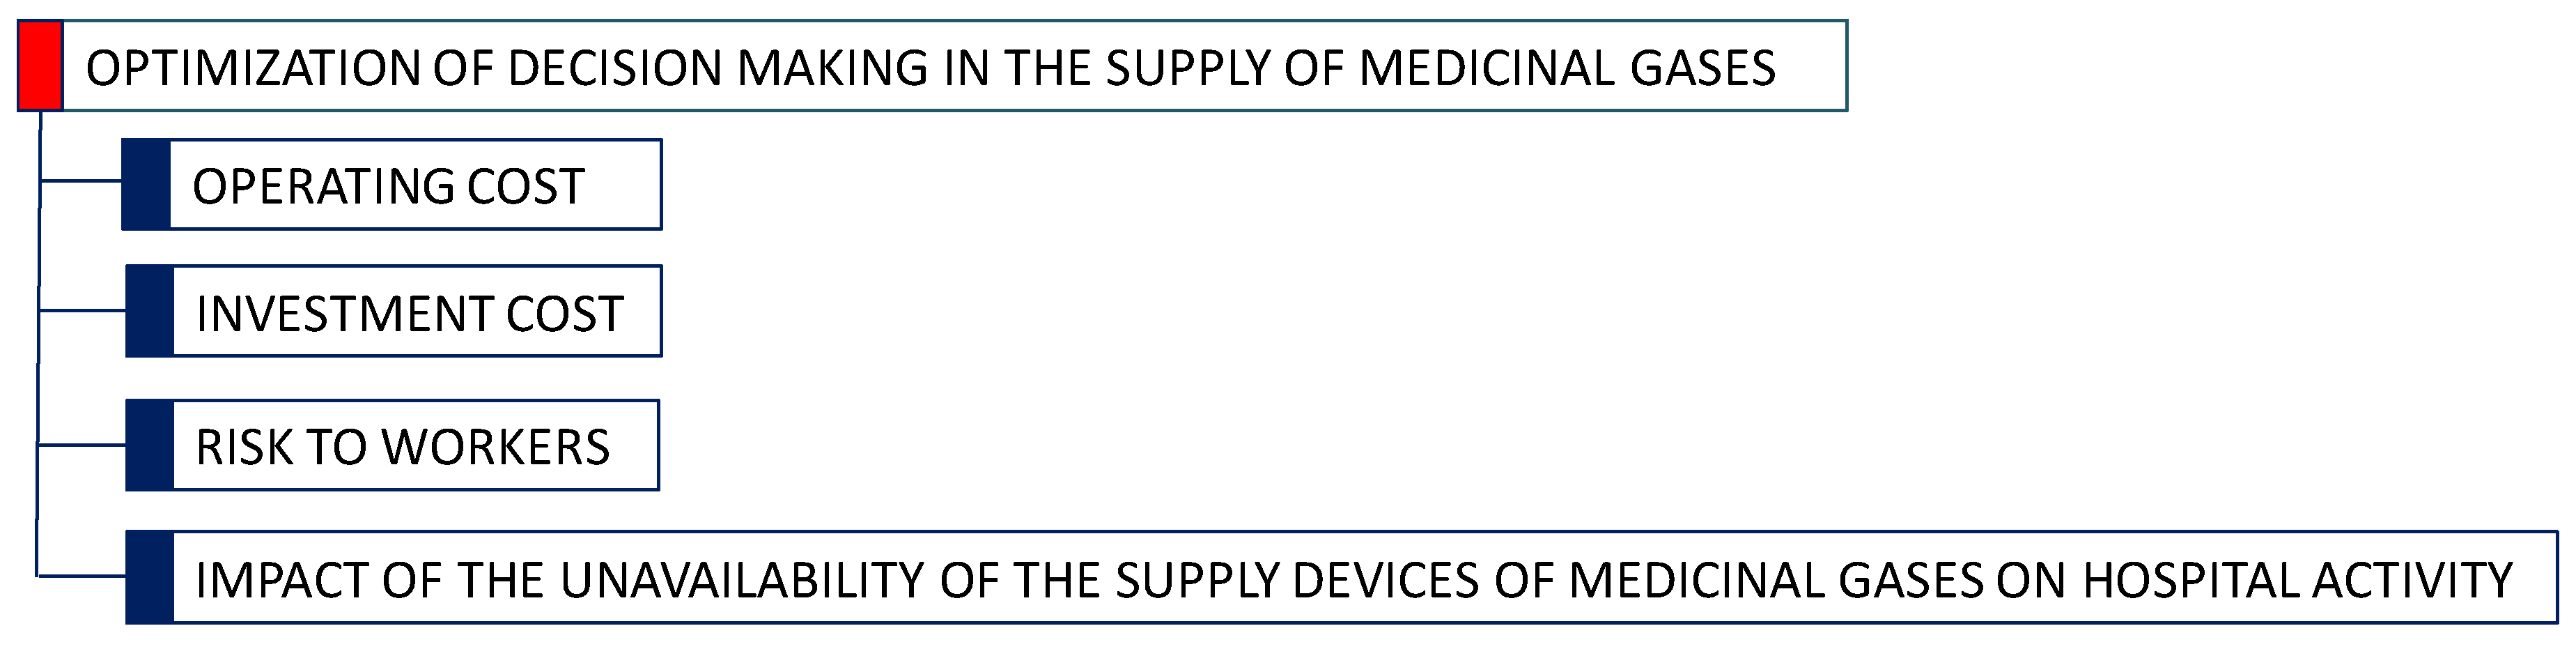
Optimization of Decision Making in the Supply of Medicinal Gases Used in Health Care

by
María Carmen Carnero
1,2,* and
Andrés Gómez
1
1
Technical School of Industrial Engineering, University of Castilla-la Mancha, 13071 Ciudad Real, Spain
2
CEG-IST, Instituto Superior Técnico, Universidade de Lisboa, 1049-001 Lisbon, Portugal
*
Author to whom correspondence should be addressed.
Sustainability 2019, 11(10), 2952; https://doi.org/10.3390/su11102952
Submission received: 12 April 2019 / Revised: 13 May 2019 / Accepted: 21 May 2019 / Published: 24 May 2019
(This article belongs to the Special Issue Sustainability in Healthcare Facilities)

Abstract

:
Systems that supply medicinal gases—oxygen, nitrous oxide and medical air—serve all care units of a hospital; for example, they feed distribution systems for operating theatres, neonatal and pediatric units, dialysis, X-ray, casualty, special tests, outpatients, etc. Systems for the provision of medicinal gases are therefore critical in guaranteeing hospital sustainability, since the functionality or availability of other hospital systems depends on them. Availability of 100% in these systems would avoid the need to reschedule patient appointments. It would also eliminate repeat testing, which poses risk to staff and patients, and could avoid affecting people’s lives through unavailability of, for example, operating theatres or intensive care units. All this contributes to a more rational resource consumption and an increase in quality of care both for the hospital itself and for patients and visitors. Although these systems are of vital importance to health care organizations, no previous work has been found in the literature that optimizes the technical decisions on supply in these systems. This research describes a model for these systems via continuous-time Markov chains. The results obtained are used in a multicriteria model constructed with the measuring attractiveness by a categorical-based evaluation technique (MACBETH) approach. In order to assess reliability when incorporating doubt or uncertainty via the MACBETH approach, the model has been validated by means of the fuzzy analytic hierarchy process. The aim is to obtain the best objective decision, with respect to the design of these systems, by analyzing the use of economic resources, the risks, and the impact on hospital activity, all with the aim of guaranteeing the best quality of care. The models constructed by means of MACBETH and the fuzzy analytic hierarchy process give, as the most suitable alternatives, duplicate the external supply in medical oxygen systems and maintain the original design conditions for supply systems of nitrous oxide and medicinal air.

1. Introduction

Medicinal gases are gases or mixtures of gases with known concentrations and impurity content intended for direct contact with humans or animal organisms. They act pharmacologically, immunologically, or metabolically with the goal of preventing, diagnosing, treating, relieving, or curing illnesses and ailments [1]. The most commonly used medicinal gases are oxygen (O2), nitrous oxide (N2O), medicinal air (O2-N2 and other trace components), vacuum (the vacuum process is considered a medicinal gas), and other gases such as helium (He), carbon dioxide (CO2), and nitrogen (N2).
Oxygen is a colorless, odorless, and tasteless gas. It cannot be detected in a hyper-oxygenated atmosphere. It is also flammable and, thus, one of the necessary elements for combustion. When handling oxygen or performing maintenance work in the presence of it, a flame or spark may lead to a fire, which may affect care and noncare staff, patients, and visitors. A breakage or malfunction may lead to air concentrations above 25% (the normal proportion in air is 21%), at which level most materials can burn and sometimes explode [2]. Oil, grease, and organic materials, in general, in hyper-oxygenated atmospheres tend to burn explosively, even from a slight blow. Furthermore, oxygen can impregnate the clothing of workers without leaving any sign, and so any source of ignition can cause it to burst into flame. It is also stored in cryogenic form, which may cause burns if it leaks. Nitrous oxide on the other hand has an important role in anesthesia, but is also toxic and may cause intoxication of care or noncare staff if the ambient daily exposure level reaches 50 ppm (the limit set by the EU). Medicinal air is used as a carrier for inhaled anesthetic substances, and some patients depend on a reliable, high-quality supply to protect their breathing tract [3]. The distribution of medicinal gases in hospitals is usually carried out through systems involving long sections of tubing and many supply points originating in cryogenic tanks or bottles (which are very large and carry a risk to the staff who handle them). There are, then, medicines circulating in large quantities through pipes, meaning that their maintenance must be of a very high standard, as the end point is the patients. However, the age of the facilities, the quality of its design and materials, the lack of plans, alterations/enlargements, preventive maintenance, etc., lead to significant risks in handling and distribution. There is need to have plans to guarantee the appropriate quality and handling of medicinal gases [4]. It is therefore recommended that staff use suitable individual protective equipment (grease-free gloves, protective goggles, etc.) when handling these gases.
A constant, reliable supply of medicinal gases is essential in virtually all care areas, as they feed distribution systems for operating theatres; neonatal, pediatric, dialysis, and X-ray units; casualty; special testing; outpatients, etc. Systems for supply of medicinal gases are thus critical to ensuring reliability, as functionality and availability of the other hospital systems depend on them. It is therefore necessary to optimize these systems to avoid rescheduling of patient appointments, repeating tests, breakdowns due to failure of supply, risks to staff and patients, etc.
All this contributes to a more rational resource consumption, both for the hospital itself and for patients and visitors (for example, by reducing hospital visits and, thus, fuel used for transport), and it could avoid affecting people’s lives through unavailability of, for example, operating theatres or intensive care units. That is, a fault or unavailability in the supply of medicinal gases can affect the schedule of medical tests or treatments; for example, a fault in the supply of medicinal gases can cause cancellation of an operation when anesthesia cannot be administered. A worsening state of health for a patient with asthma or chronic obstructive pulmonary disease (COPD) could also occur since medicinal air is the effective way of delivering pharmacological treatment directly to the lungs by inhalation. This undoubtedly affects the quality of care experienced by the patient. Furthermore, an increase in the life of equipment, and a better use of resources, may be achieved. The end goal of all of this is to improve quality of care.
Multi-criteria decision-making (MCDM) techniques are widely applied and recognized to be one of the best tools for making real-world decisions in the fields of the environment, agriculture resource management, energy planning, immigration, education, transport, investment, water resource planning and management, defense, health care, etc. [5,6,7,8,9,10].
However, there is no precedent in the literature on optimization of medicinal gas supply systems. The single precedent related to medicinal gas analyzes the selection of an optimal maintenance policy for oxygen, protoxide, and vacuum distribution systems with two to four gas networks [11], but this does not address the best design for the gas supply system.
Therefore, to choose the relevant criteria to apply in this study, a decision group that was experienced in the use of these criteria, reviewed the literature that used MCDM methods for choosing optimum maintenance strategies [12,13,14,15,16,17,18,19,20]. That is, the best solution was investigated between corrective maintenance, which is applied immediately a failure occurs in a machine when no further planned activity may take place, and preventive maintenance, which refers to maintenance activities programmed independently of the state of the machine. Condition-based maintenance requires periodically or continuously monitoring physical parameters (like vibrations, temperature, total acid number or water content of lubricants in use, etc.) to identify when safe limits have been passed, suggesting the need to begin maintenance activity at the most suitable time for the plant. Otherwise, when an alarm level has been reached, the repairs will be needed as soon as possible [12]. Some more advanced maintenance strategies are also included in the decision models, including, for example, reliability-centered maintenance (RCM), proactive maintenance, or total productive maintenance (TPM). The use of fuzzy MCDM techniques is increasing in the literature, for example in [21,22,23,24,25,26,27,28,29,30].
Examples of applying MCDM to health care organizations, not related to diagnosis or treatment of disease, may be found in Danner et al. [31] or Radaelli et al. [32], which were related to health technology assessment. Researchers in [33] included criteria such as function, age, recalls and maintenance requirements, hazard alerts, and mission criticality (with the subcriteria: utilization and availability of alternative devices), risk (failure frequency, detectability, and failure consequence (including the subcriteria: operational (with downtime as a subcriterion), nonoperational (assessed by means of cost of repair), and safety and environment)) in a hierarchy structure to calculate the risk of a variety of failure modes of a medical device. Using the analytic hierarchy process (AHP) gives a normalized risk for each medical device, which allows the most suitable maintenance strategy to be associated with each mode. Carnero [34] chose the best mix of maintenance policies with the measuring attractiveness by a categorical-based evaluation technique (MACBETH) and a model with costs, impact on care cover, and quality of care as criteria in dialysis systems used to treat acute and chronic hepatitis B and C patients. Marciano et al. [35] applied AHP in an Italian hospital setting in choosing an optimal ultrasound device by using a research group and a decision. The criteria used were anthropometry, biomechanics, cognitive ergonomics, the patient, work environment, and work management. The study had the goal of meeting the organization’s ergonomic objectives. Additionally, other studies that aimed at choosing medical devices through AHP can be found in Joshi et al. [36] (related to picture archiving and communication systems), Pecchia et al. [37] (applied to computed tomography scanning), or Ivlev et al. [38] (applied to magnetic resonance imaging systems). Additionally, Agapova et al. [39] used the judgements of a group of radiologists and other emergency physicians to analyze the goodness of a number of diagnostic tests for appendicitis. The multicriteria technique used was AHP, with ultrasound, magnetic resonance imaging, and computed tomography as alternatives. Lasorsa et al. [40] applied methodology based on the Potentially All Pairwise RanKings of all possible Alternatives (PAPRIKA) method to assess alternatives in the sterilization service such as doing it totally in-house, out-sourcing it, or having the technology in-house but subcontracting the service. This supposed different panels of experts: international professionals to select the assessment criteria relevant to the target service and a local panel that knew the requirements and characteristics of the hospital.
Literature on MCDM in the healthcare environment generally applies deterministic methods, that is, uncertainty or ambiguity are rarely included in these decision-making problems. Among the contributions managing the fuzzy environment, we can highlight Houria et al. [41] who applied a fuzzy analytic hierarchy process (FAHP) to find weightings for the criteria of age, class of equipment, degree of complexity, and the importance of maintenance, function, recalls and user errors, and risk, which allowed a measure for criticality to be attributed to the devices. Using the fuzzy technique for order preference by similarity to ideal situation (FTOPSIS), the most suitable maintenance strategy was chosen for medical devices depending on the previously determined criticality. Öztürk and Tozan [42] applied AHP, analytic network process (ANP), FAHP, and fuzzy analytic network process (FANP) to choose the most suitable dialyzer flux. Researchers in [43] calculated a risk priority index for each medical device through the use of fuzzy failure mode and effect analysis. To be able to include other aspects beyond those assessed in the risk priority index calculation, such as severity, occurrence, and detection, a number of dimensions are included to assess the medical devices: age, use, maintenance requirements, number of similar devices, recalls, hazards caused by use of the device, and function. Finally, a simple additive weighting model is used to choose the best maintenance strategy for each device among the alternatives: corrective maintenance, time-based preventive maintenance, condition-based maintenance, and predictive maintenance. Ozsahin et al. [44] used fuzzy preference ranking organization method for enrichment evaluations (PROMETHEE) to make comparisons between nuclear medicine devices including PET, SPECT, PET-CT, SPECT-CT, and PET-MRI, which took into account criteria such as price, sensitivity, spatial and energy resolution, radiation dose, specificity, and scan time. Cagri [45] applied an interval type-2 fuzzy set to look at financial options, known as a real option analysis, to assess the viability of purchasing a linear accelerator or of outsourcing the radiotherapy service.
To date, no previous work was found in the literature that used MCDM models to optimize supply systems of medicinal gases in the hospital environment (this literature review was carried out with the terms “medicinal gas MCDM” and “medicinal gas MCDA” in the bibliographic databases of Scopus and PUBMED). It should be observed that these systems, despite their criticality, do not interact directly with patients, but they do affect the availability of most hospital services, which will ultimately influence the sustainable management of resources and quality of care. Optimization of these systems will, therefore, have an impact on the medicinal gases used in neonatology or pediatrics, Accident and Emergency (A and E), nuclear medicine, operating theatres, dialysis systems, laboratories, and other areas of care. Thus, optimization of these systems will have an impact on people’s lives [46].
Innovative contributions of this research are:
(1)
Modelling supply systems for medicinal gases with continuous-time Markov chains, looking at different improvement alternatives over the original design of the systems.
(2)
Optimizing consumption of resources via objective decision making, which can be opened to public opinion. The result of this optimization is to guarantee clinical sustainability and avoid some consumption of hospital resources and of staff, both medical and nonmedical, patients, and visitors.
(3)
Developing multicriteria models using the MACBETH approach and FAHP to optimize the supply systems for medicinal gases.
(4)
Comparing the results obtained via the MACBETH approach and FAHP to assess the capacity of MACBETH to handle ambiguous, imprecise, or inadequate information, or the impossibility of giving precise values.
(5)
Considering the Buckley method as a means of applying FAHP to guarantee the accuracy of the priorities obtained and to avoid losing information in the results. This avoids certain problems arising from the use of Chang’s extent analysis method.
(6)
Applying the multicriteria models, specifically for intake and supply systems, for medicinal gases in health care organizations. These systems have high criticality as many other hospital systems and medical devices rely on them in order to operate. Furthermore, these dependent systems interact directly with patients and can, therefore, affect proper care and treatment.
(7)
Analysing the implications for quality of care of maintaining the original design and of introducing the alternative suggested by the multicriteria models.
(8)
Applying a model using real systems and data in a Spanish hospital.
The structure of the paper is as follows. Section 2 describes the multicriteria techniques used in producing the model: the MACBETH approach and FAHP. Then, using continuous-time Markov chains, different alternatives are modelled for the optimization of supply systems for medicinal gases in a Spanish hospital. Next, Section 4 sets out the multicriteria models, including the structuring and weighting phases. Then follow the results, the sensitivity analysis, and the real implications that alternatives proposed by the models would have on quality of care. Finally, Section 6 includes the conclusions.

2. Multicriteria Technique Methodologies

MCDM methods are held to be excellent decision-making tools [47] for performing optimization. They facilitate the justification of decisions [48] to the community at large, or to company management, by using objective models, which are easy to understand, and decision making is also participative [49]. That is, the decision-making process may involve one or more decision groups made up of different stakeholders, some of whom may be responsible for introducing the solution found. This means it can be introduced more efficiently, or it may have judgements from people involved with a variety of viewpoints, leading to a decision that includes more information and in which no criterion is ignored. Thus, the final aggregate judgements are more representative of the overall opinion. This study used a decision group comprising those in charge of a number of hospital departments and services, and it was coordinated by the head of the maintenance, safety, and environmental service of the hospital.

2.1. The Measuring Attractiveness by a Categorical-Based Evaluation Technique (MACBETH) Approach

The MACBETH approach is a complete multicriteria methodology, requiring only the qualitative judgements provided by a decision maker or decision group to make a quantitative assessment of the alternatives. Bana e Costa et al. [50,51,52] set out the theoretical foundations of MACBETH along with examples of real-world applications. Researchers in [53] described the decision support software M-MACBETH, which helped in building MACBETH models (the user guide can be downloaded at http://m-macbeth.com/demo/).
M-MACBETH introduces the reference levels neutral and good. These levels should be associated with two different scale levels for each attribute or fundamental point of view (FPV) [50]:
  • Neutral level (N): an impact level that the decision maker considers neither to be attractive nor unattractive and is assigned the arbitrary score 0.
  • Good level (G): the decision maker considers this impact level attractive, and MACBETH assigns it the arbitrary score 100.
The binary relations P and I are defined on a finite set A:
  • P   =   { ( a ,   b )     A   ×   A : a is more attractive than b }. This relation is asymmetric.
  • I   =   { ( a ,   b )     A ×   A : a is not more attractive than b and b is not more attractive than a }. This relation is reflexive and symmetric.
Ordinal information is obtained when the elements of A are ranked by decreasing attractiveness. Thus, for each element a     A , it is possible to associate a number v ( a ) that satisfies the two ordinal measurement conditions:
  •   a ,   b     A ,   a   has better performance than   b     v ( a ) > v ( b ) .
  •   a ,   b     A ,   a   has similar performance as   b v ( a ) = v ( b ) .
The decision maker must establish the preference between any two levels of the descriptor or alternatives. Thus, the decision maker is asked for a verbal judgement about the difference in attractiveness between a and b for each ( a ,   b ) in A × A with a P b . The question/answer procedure uses a partition of { ( a ,   b )     A × A a P b }   in the following six semantic categories:
  • C 1   =   { ( a ,   b )     A × A   a P b where the variation in performance between a and b is negligible or very weak} (encoded as VW in the pairwise judgement matrices included in Section 4).
  • C 2   =   { ( a ,   b )     A × A   a P b where the variation in performance between a and b is weak} (in the pairwise judgement matrices this judgement is encoded as W).
  • C 3   =   { ( a ,   b )     A × A   a P b where the variation in performance between a and b is moderate} (encoded as M when this judgement appears in the pairwise matrices).
  • C 4   =   { ( a ,   b )     A × A   a P b when the variation in performance between a and b is strong} (encoded as S in the pairwise judgement matrices included in Section 4).
  • C 5   =   { ( a ,   b )     A × A   a P b where the variation in performance between a and b is very strong} (encoded as VS).
  • C 6   =   { ( a ,   b )     A × A   a P b where the variation in performance between a and b is extreme} (encoded as E).
C 2 , C 4 , and C 6 are considered basic categories, and C 1 , C 3 , and C 5 are classified as intermediate categories. In addition, where there is no difference in attractiveness between a and b , the judgement “No” is encoded as N in the MACBETH judgement matrices.
The MACBETH approach procedure is as follows (see flowchart in Figure 1):
(1)
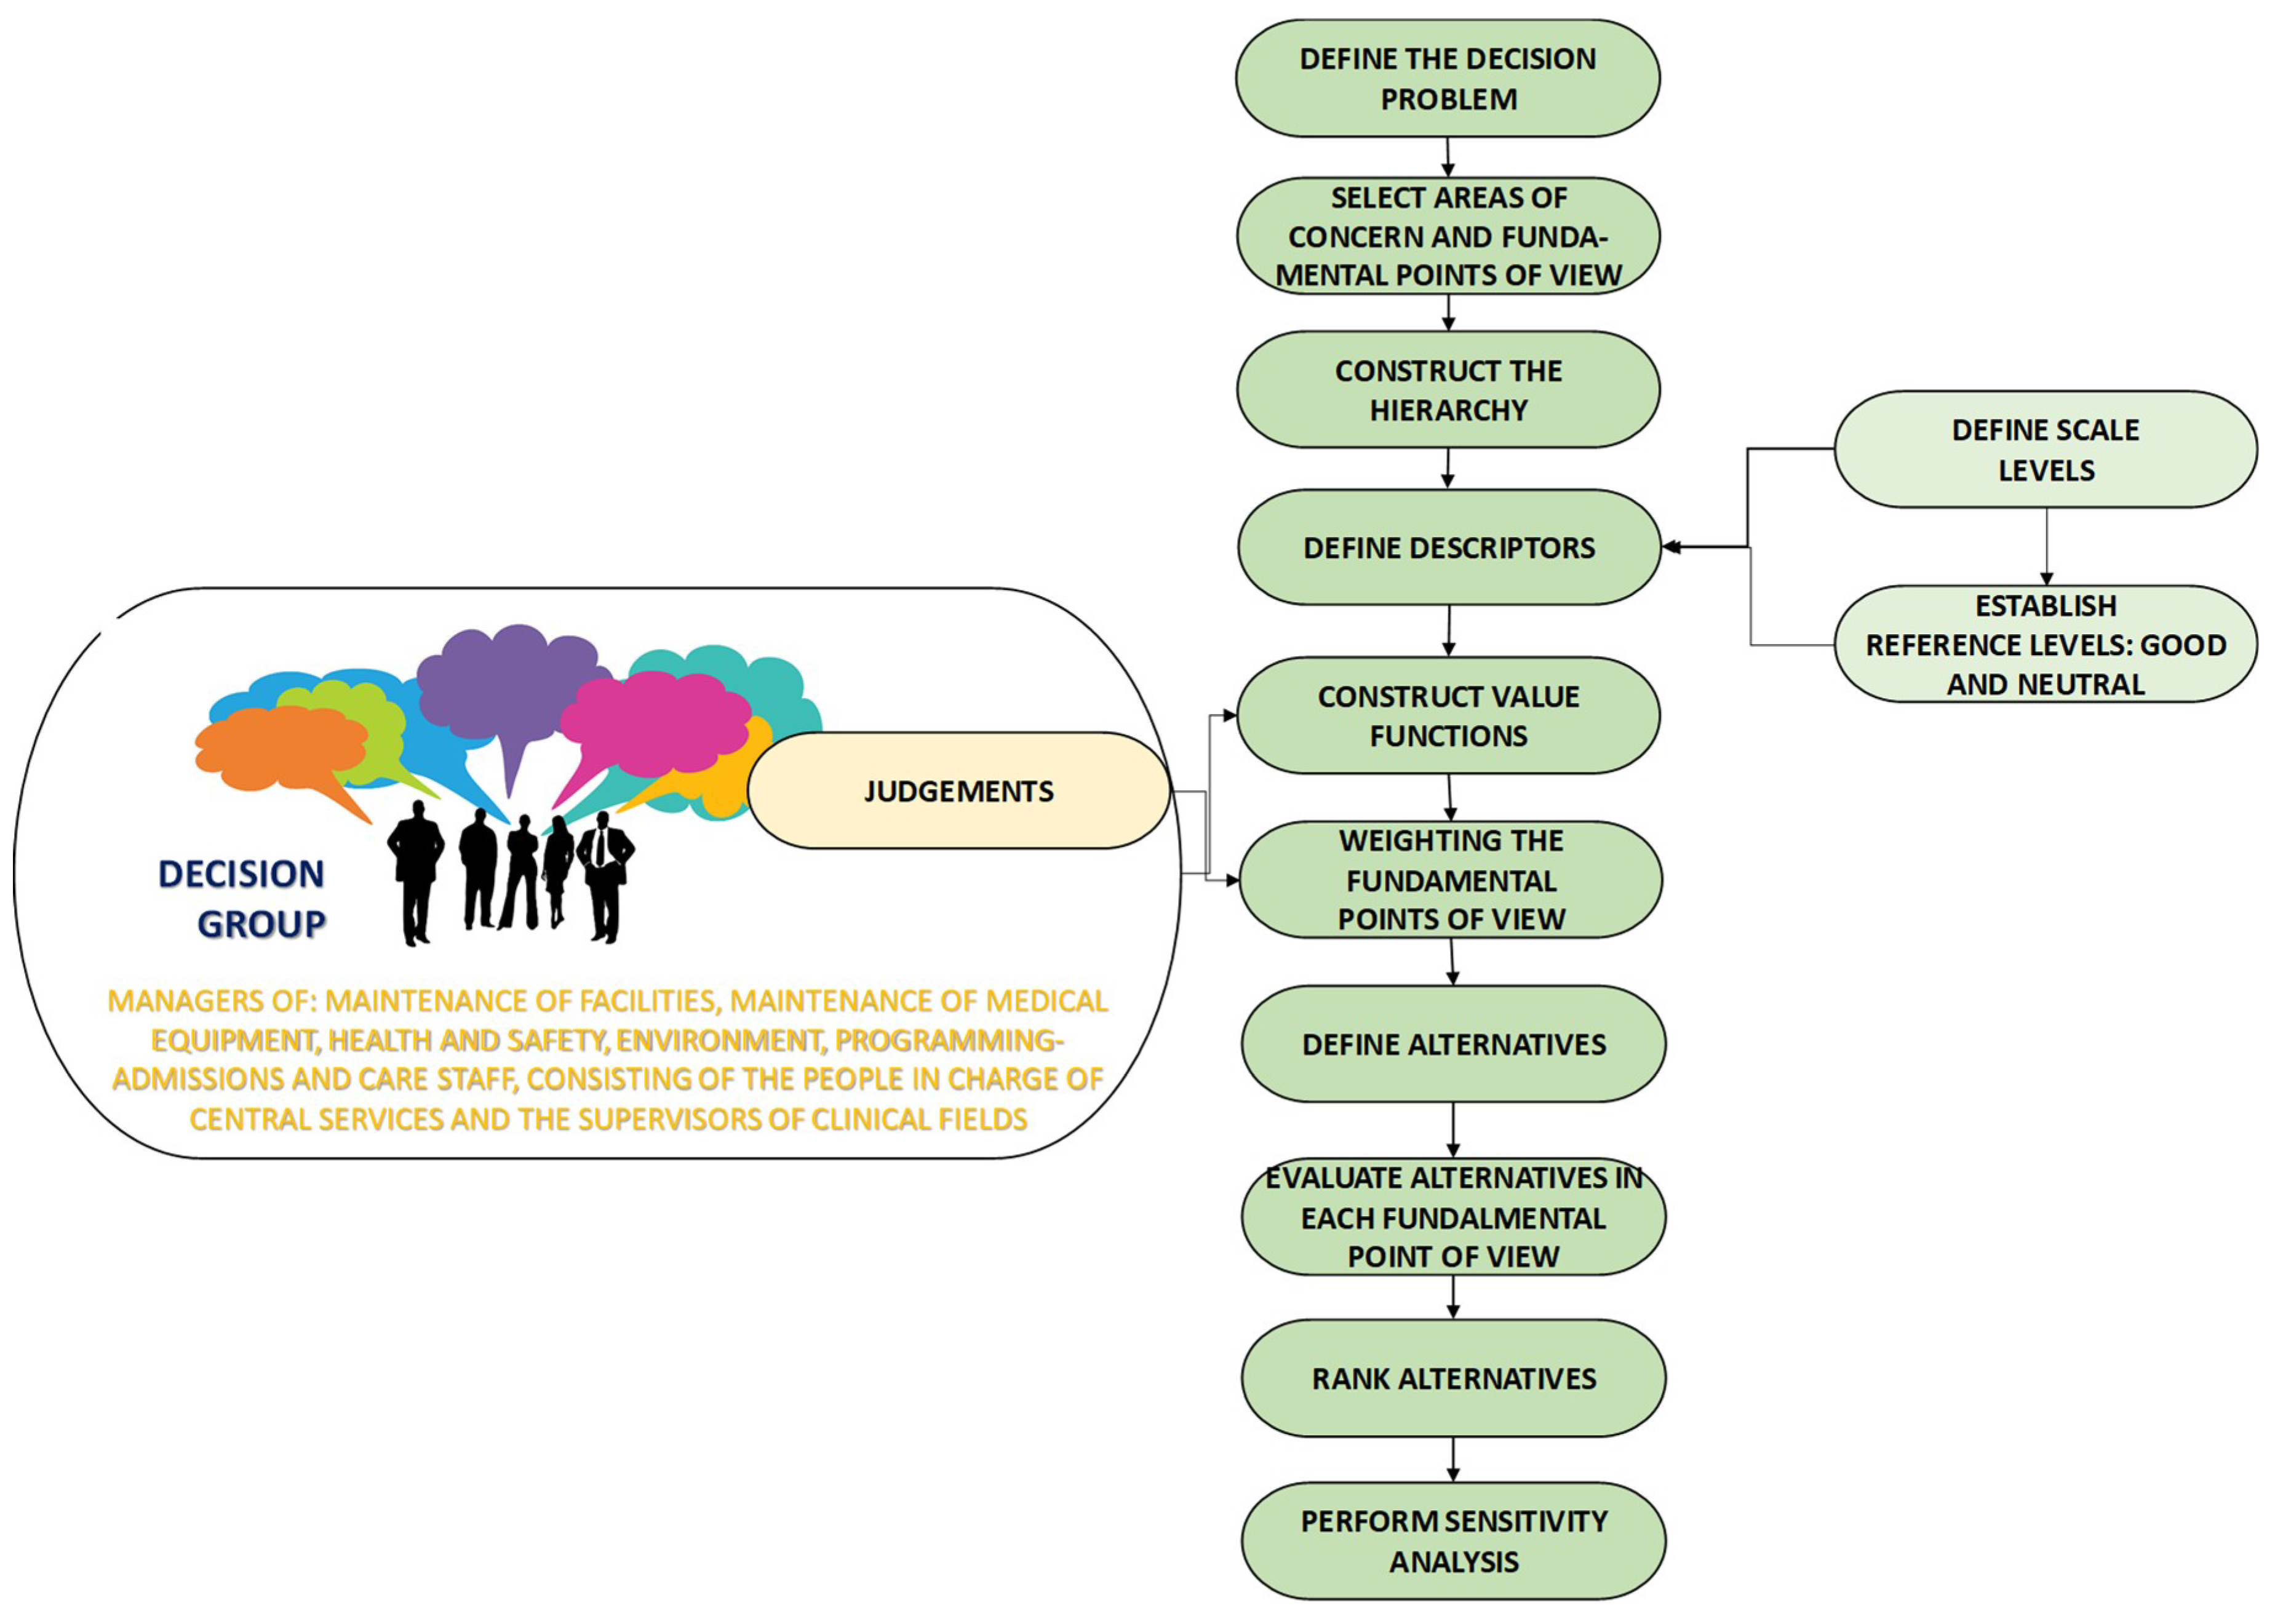
Define the decision problem. The background of the problem must be analyzed, including the assumptions and the perspective under which the decisions are taken. Different scenarios or stakeholder groups might be necessary to analyze the problem thoroughly.
(2)
Select areas of concern and FPV. Each criterion or FPV is some characteristic or property in a specific context that the decision maker or group considers relevant to provide a solution to the problem [50]. The FPVs must have the following characteristics: coherent with the decision, represented on the same scale, measurable, independent of each other, and not unrelated to the alternatives.
(3)
Construct the hierarchy. To structure the problem, a value tree must be created, including a goal at the higher level, which gives rise to criteria or areas of concern, attributes or FPVs, and the lower level of the hierarchy incorporates the alternatives [51]. The structuring process starts with the identification of a set of areas of concern, and each comprises one or more FPV’s, which are attributes that allow the alternatives to be assessed.
(4)
Define descriptors. For each FPV, a descriptor must be defined and is made up of a performance scale in which the reference levels of neutral and good must be identified. This avoids the problem that, on assessing the FPV in the alternatives, results will not be imprecisely or ambiguously interpreted. The descriptors can measure (qualitatively, quantitatively, or a mix of the two) the degree of performance of an alternative with respect to each FPV. Different types of descriptors are possible: one-dimensional qualitative scales, pictorial descriptors, and multidimensional descriptors.
(5)
Construct value functions. Ordinal scales must be transformed into cardinal scales or value functions. A value function is representative of the decision maker’s judgement [52] and are calculated by M-MACBETH applying linear programming [53].
The decision maker or group must give judgements using one of the MACBETH semantic categories: N, VW, V, M, S, VS, and E. When there is uncertainty or disagreement within the decision group about assigning a value, MACBETH allows a range of two or more consecutive semantic categories to be included. The category positive (P) can be used when the information available on comparing two scale levels is very limited. M-MACBETH assigns scores of 0 and 100 in the value function to the scale levels of the descriptors identified as neutral and good, respectively.
M-MACBETH assesses the consistency of the pairwise judgement matrix every time a judgement is added, generating a value function only if all the judgements given in the matrix are consistent. If the judgement matrix is inconsistent, M-MACBETH suggests revising the inconsistent judgements [54].
(6)
Weighting the FPVs. A new alternative is defined with all the FPVs at the neutral level. The decision group uses the MACBETH semantic categories to give judgements about the rise in overall performance, provided by a swing from the neutral level to the good level, in each of the FPVs. This allows the final column of the MACBETH judgement matrix to be completed, and the FPVs end up ordered from greater to lesser attractiveness. A judgement is then given, again through the MACBETH semantic categories, about how much better the change is from a neutral to a good level in the most important FPV compared with the second-placed FPV in the matrix. The process goes on to compare the change from the first FPV, with respect to the third-placed FPV, and then the fourth, the fifth, etc.
(7)
Define alternatives. This consists of defining, as accurately as possible, the solutions to a problem. The proposed alternatives should be: available, comparable, real (not ideal), and practical or feasible.
(8)
Evaluate alternatives in each FPV. The values that each alternative would have for each criterion or subcriterion should be specified by choosing one of the scale levels of the descriptor.
(9)
Rank alternatives. MACBETH uses an additive aggregation method (see Equation (1)) to assess each alternative.
v ( x ) = i = 1 n w i v i ( x ) i = 1 n w i = 1 ; w i > 0 ,
where x is the alternative assessed; v ( x ) is the global value of alternative x calculated from the summation of the n FPVs included in the model; v i (x) is the value of the impact of alternative x on FPV i, considering v i (most desirable impact level on i) = 100, v i ( mostattractiveimpactleveloni ) = 100 and v i (most undesirable impact level on i) = 0; and w i   is the weight of FPV i.
(10)
Sensitivity analysis. The sensitivity analysis assesses the stability of the model, by making logical changes in the weighting of an FPV while keeping the proportionality of the weightings of the other FPVs, to analyze the resulting changes in the ranking of alternatives. M-MACBETH has graphing tools to perform sensitivity and robustness analyses [53].

2.2. Fuzzy Analytic Hierarchy Process Methodology

Zadeh introduced fuzzy theory in 1965 [55] to deal with uncertainty due to imprecision or vagueness, which frequently results from human judgements like “rather probable” or “weak probability”. A fuzzy set is a class of objects with a continuum of degrees of membership. This fuzzy set is defined by a membership function, which assigns to each object a degree of membership ranging between zero and one [56]. Trapezoidal and triangular fuzzy numbers are generally used to account for the vagueness of the judgements. The triangular number is a particular case of the trapezoidal fuzzy number and is the most used in the literature.
A triangular fuzzy number (TFN) is identified by a tilde placed above it, and it comprises three numbers a ˜ = ( l ,   m , u ) , where l is the smallest value, m the most probable value, and u the upper bound of the fuzzy number. Liang [57] reviews the distribution of TFNs, and, according to this representation, it is possible to define its membership function μ ( x | a ˜ ) from Equation (2) [58].
μ ( x | a ˜ ) = { 0                           x < l ( x l ) / ( m l )           l x m ( u x ) / ( u m )         m x u 0                           x > u .
The literature contains different FAHP methodologies [57,58,59,60,61,62,63]. The geometric mean method suggested by Buckley [60] is applied in this research since it is easier to apply and to understand than other methods [64]. It also avoids the criticisms of the commonly applied Chang extent analysis methodology [65].
The procedure for applying FAHP via the Buckley method is the following:
(1)
Select the expert or group of experts who will provide the information and judgements necessary for the decision-making process.
(2)
Construct the hierarchy. Criteria and FPVs relevant to the problem are selected and structured into a hierarchy. The objective is placed at the upper level of the hierarchal structure, the criteria and subcriteria are placed at the intermediate levels, and the alternatives are at the lower level.
(3)
Select the fuzzy scale. Saaty’s original scale, made up of the association of a judgement with an integer from one to nine and its inverses, does not permit working with uncertainty, vagueness, or ambiguous situations [65]; however, these characteristics are found in real decision problems. In addition, the decision centres generally feel more confident giving their judgements in the form of intervals rather than as a crisp number [66]. A variety of fuzzy scales are described in the literature [66,67,68,69,70].
(4)
Obtain fuzzy judgements between criteria or FPVs and between the levels of scale of each descriptor. Elements of the MACBETH pairwise comparison matrix A ˜ (see Equation (3)) are the fuzzy values a ˜ i j , which express the decision centre’s judgement about the relative importance of element i over element j at the same level of hierarchy.
A ˜ = ( ( 1 , 1 , 1 ) ( l 21 , m 21 , u 21 ) ( l n 1 , m n 1 , u n 1 ) ( l 1 j , m 1 j , u 1 j ) ( l 21 , m 21 , u 21 ) ( l i 1 , m i 1 , u i 1 ) ( l 1 n , m 1 n , u 1 n ) ( l 2 n , m 2 n , u 2 n ) ( 1 , 1 , 1 ) ) ,
with a ˜ i j = ( l i j , m i j , u i j ) for i , j = 1 ,   2 ,   ,   n and i j .
(5)
Aggregate the fuzzy judgements. Buckley suggested the geometric mean method from Equations (4) and (5) [60] for calculating the fuzzy weights of each FPV and utilities for the scale levels of each descriptor. An example of their application can be seen in Park et al. [71].
r ˜ i = ( j = 1 n a ˜ i j ) 1 n   .
w ˜ i = r ˜ i ( i = 1 n r ˜ i ) 1 n i = 1 ,   2 ,   ,   n
(6)
Calculate the weightings of FPVs. The w ˜ i must be converted into a crisp number. The centroid method can be applied to perform the defuzzification process using Equation (6) [72,73]:
w i = l i + m i + u i 3 ,   i = 1 ,   2 ,   ,   n
(7)
Evaluate the consistency of the judgements. To quantify the consistency of the judgements given, Saaty [74] defined the consistency ratio (CR) as shown Equation (7).
C R   = C I I C R
where CI is a consistency index calculated from Equation (8), and ICR is a random consistency index obtained from the simulation with random matrices with dimensions equal to those assessed.
C I   =   ( λ m a x n ) ( n 1 )
According to Saaty [75], if C R is less than 0.1 for matrices of an order higher than 4 × 4, 0.08 for a 4 × 4 matrix, or 0.05 for a 3 × 3 matrix, the judgements given are considered consistent. In the case of FAHP, the central value m i j of the fuzzy number is used for the calculations, as set out [76], taking the same values as Saaty for matrices of different orders to guarantee consistency in the judgement matrix.

3. Markov Chains in Medicinal Gas Supply Systems

3.1. Methodology

Markov chains allow availability, reliability, and safety of systems or facilities to be evaluated, hence their wide use in the literature.
The procedure followed, using the standard CEI IEC 61165 [77] for the use of continuous time Markov chains in the supply systems of medicinal gases, is as follows:
(1)
Investigate the device. This includes the process characteristics, resources required, technical parameters, maintenance policies applied, etc.
(2)
Identify the failure modes of the device. This requires analysis of each element of the device, its working and failure modes, and their possible consequences.
(3)
Define the possible solutions of the problem. The possible alternatives to be applied to the system analyzed should be defined, and it should be possible to include redundancies or improvements in the design.
(4)
Determine the failure and repair rates. This is commonly done using the records of failures and repairs for the system analyzed. The failure rate of each fault is generally referred to as λ j , while the repair rate for each failure is called μ j .
(5)
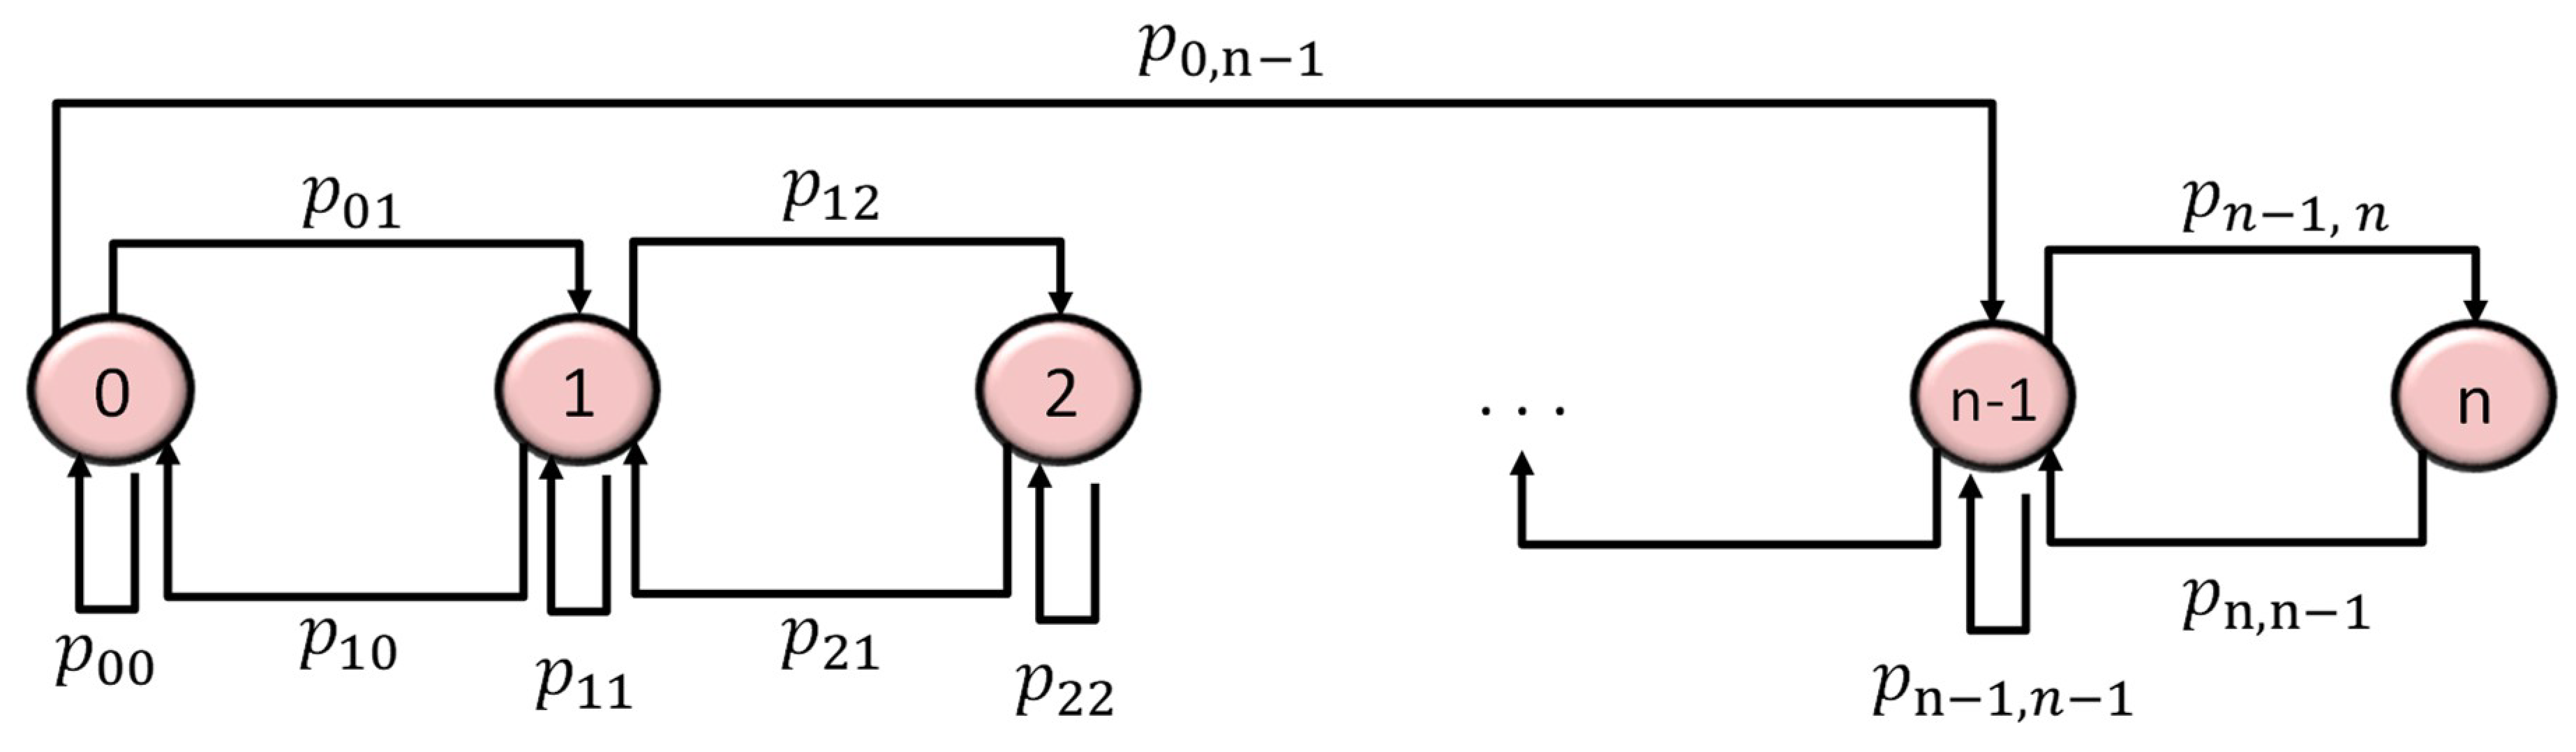
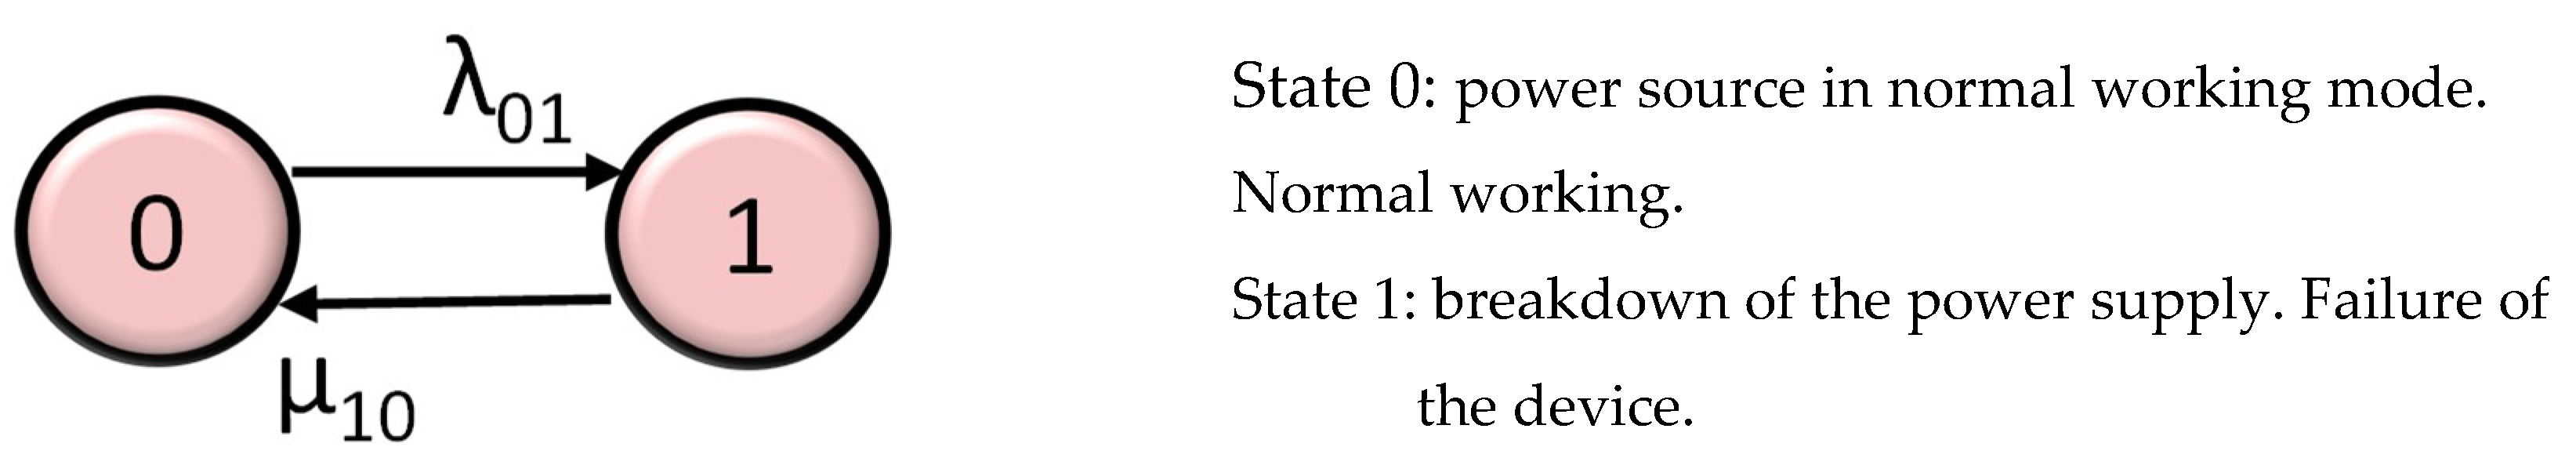
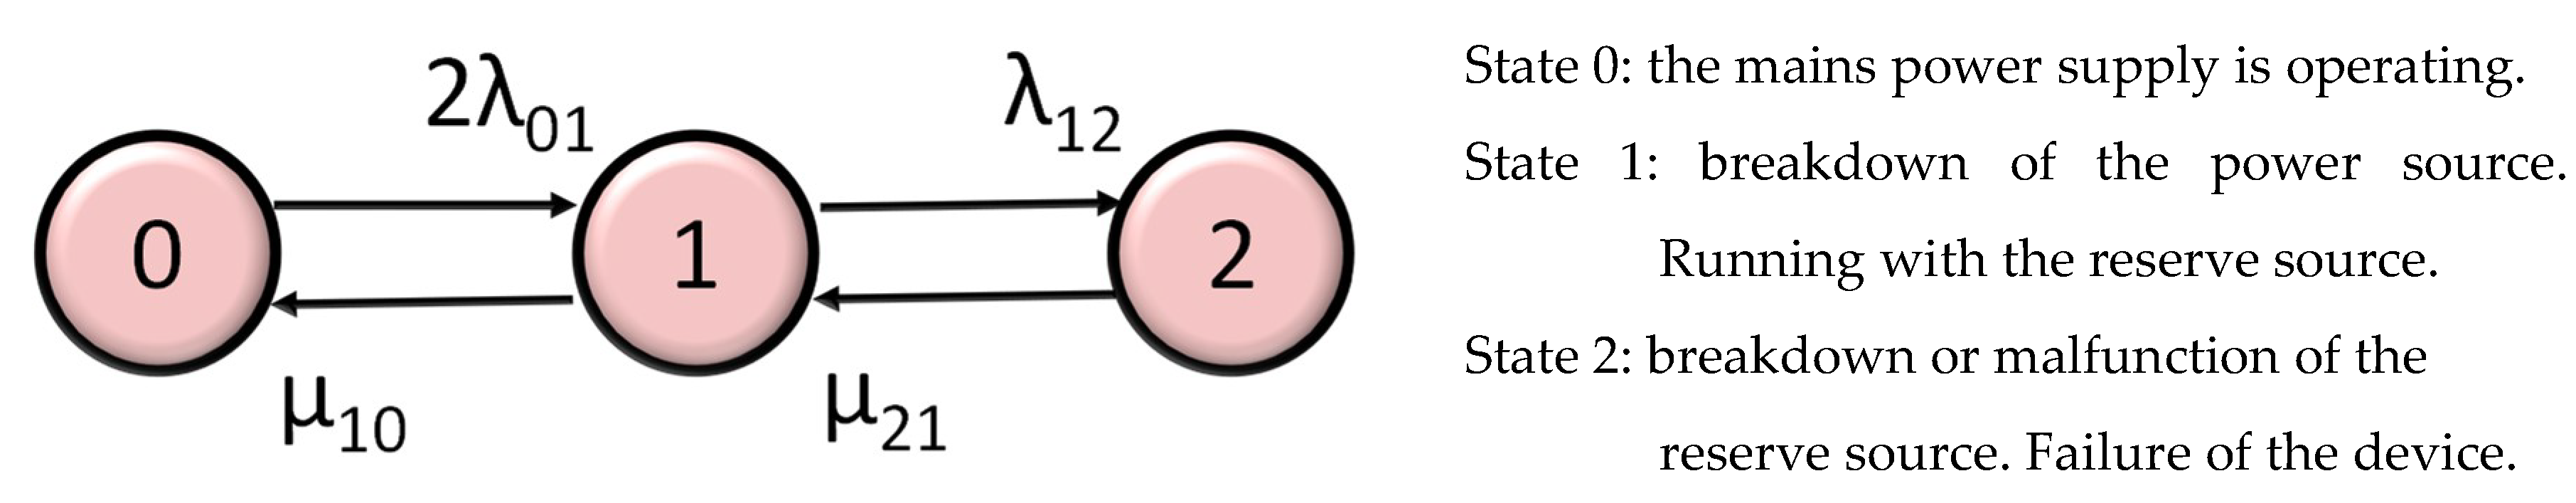
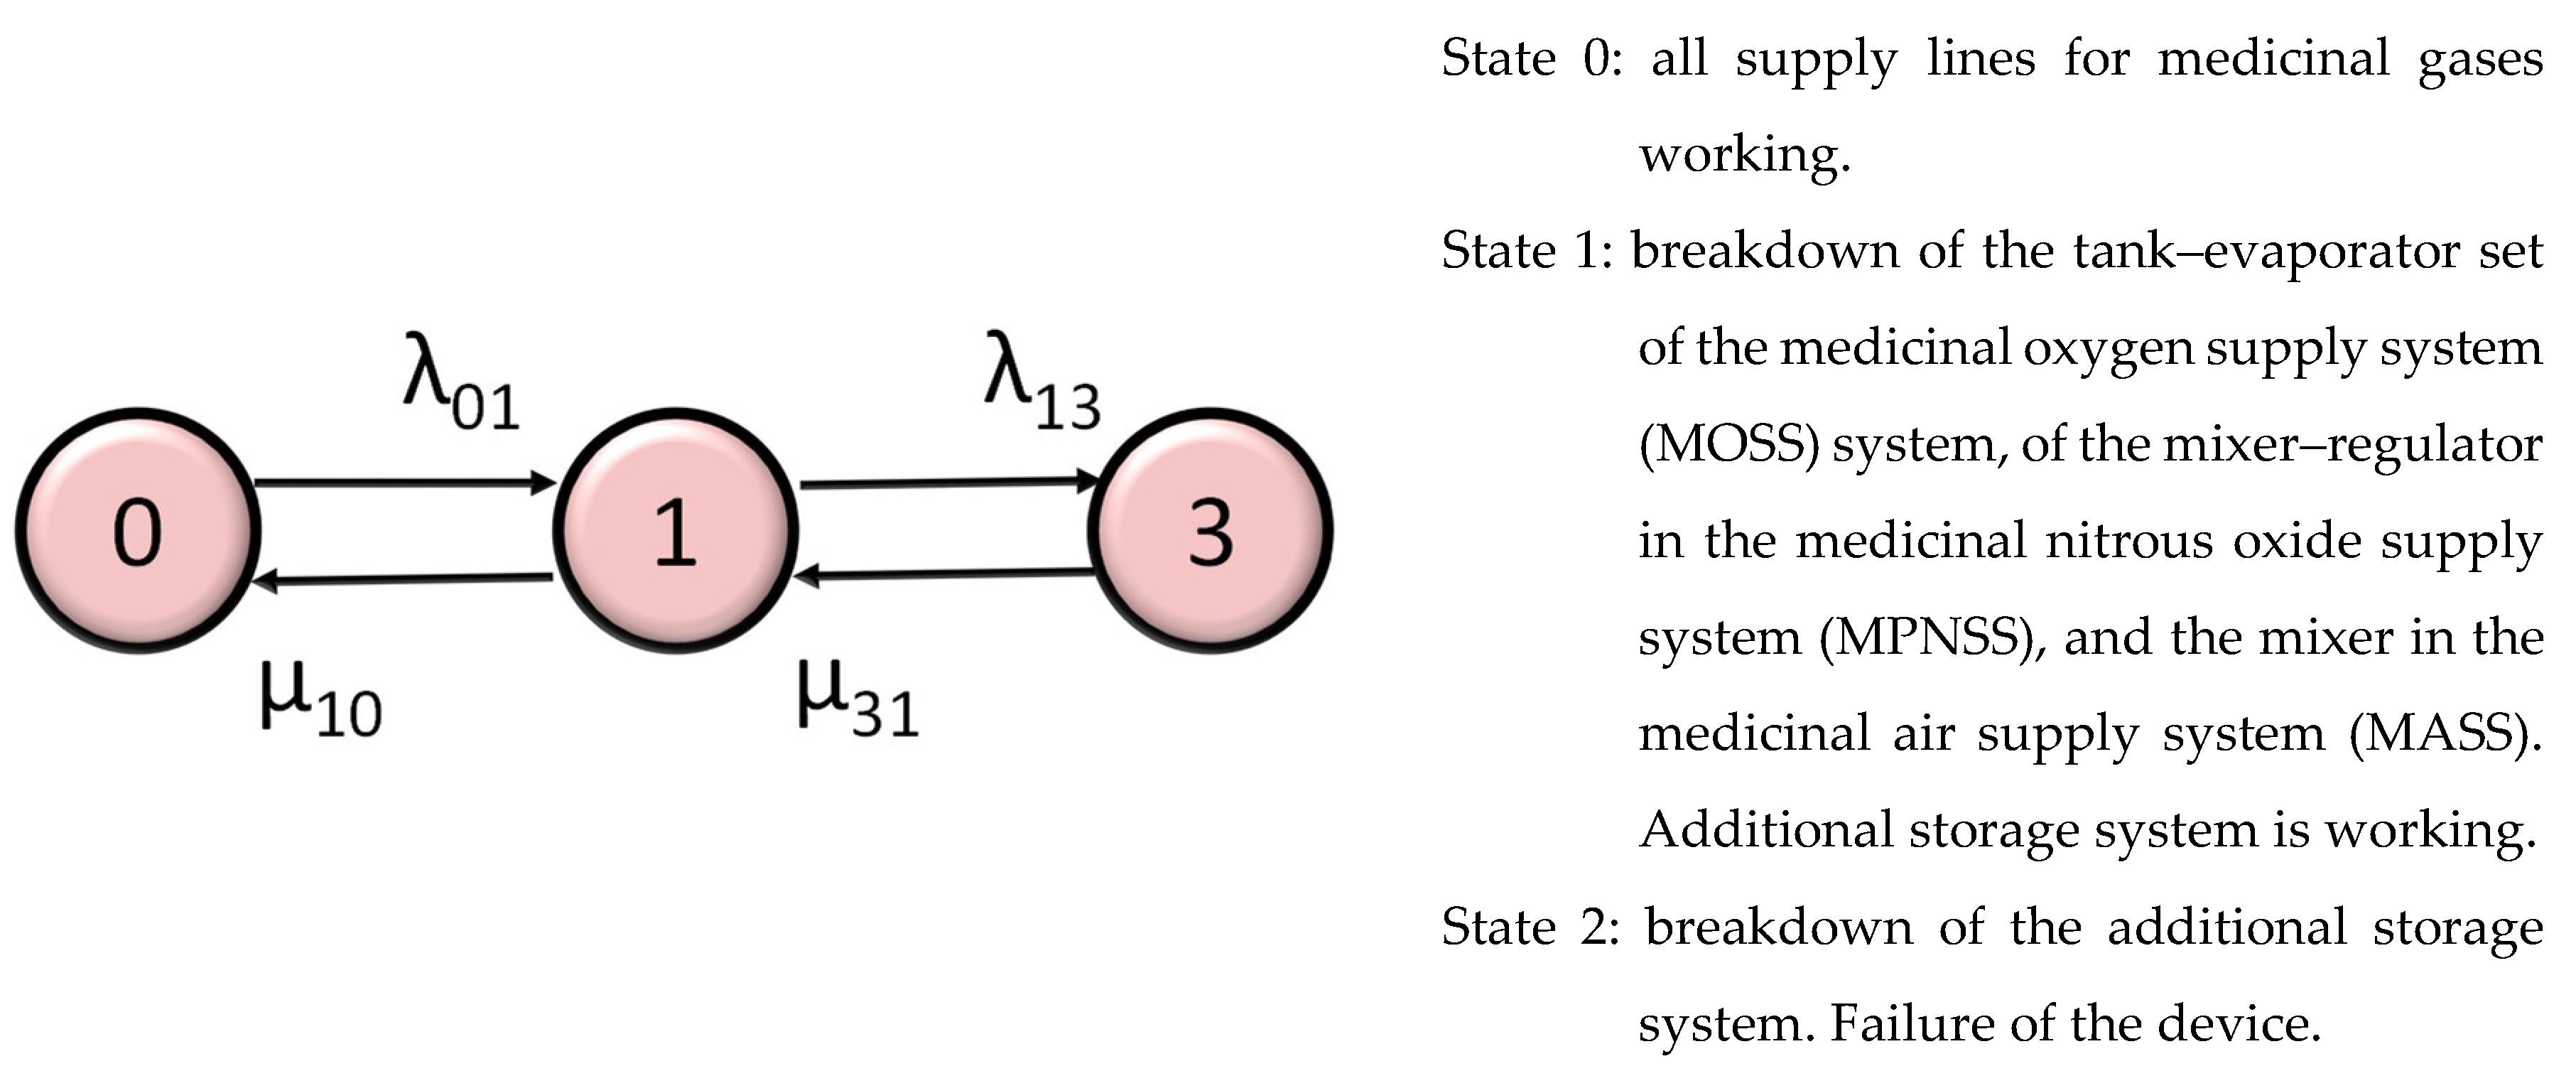
Establish the Markov graph. The Markov model assesses the probability of passing from one state to another and then returning through failures and repairs. A Markov graph is held to have n + 1 possible states, such that each state represents breakage of components or a level of wear. If k is the maximum number of failed states permitted such that the system can keep working, each level of wear can be identified by the number of failed elements. The following states can be defined [78]:
  • State 0. The device is in the perfect state.
  • State 1. One of the elements of the device is broken, or the system is in the first possible state of wear.
  • State 2. Two subsystems or elements of the device are not functioning, or the device is at the second possible state of wear.
  • State n − 1. n − 1 components or subsystems are broken, or the device is at level n − 1 of wear.
  • State n. Each element of the system is broken, or the device is in catastrophic breakdown.
Figure 2 shows an example of a Markov graph with n + 1 states where pn1,n indicates the likelihood of shifting from state n 1 to state n, whereas pn,n−1 indicates the probability that repair of the device would mean moving from state n to state n 1.
(6)
Compute the transition matrix. To construct the transition matrix A (see Equation (9)) it is first necessary to design the Markov graph. In each row i, corresponding to the columns j, the corresponding rates are placed for the links which leave state i for each of the states j in the graph. To calculate the main diagonal, each row i contains the sum, with the sign changed, of the transition rates for each row. The last column of the matrix is included to guarantee that summing all the probabilities gives the value 1.
A = ( j = 1 m λ 0 j λ 01 λ 0 k 1 μ 10 ( j = 1 m λ 0 j + μ 10 ) λ 1 k 1 μ k 0 μ k 1 ( j = k + 1 m λ k j + j = 0 k 1 μ k j ) 1 μ m 0 μ m 1 μ m k 1 ) .
(7)
Resolve the system of equations. The mathematical process followed to obtain the final system of equations (see Equation (10)) to resolve into continuous Markov chains for repairable systems can be seen in Kaufman [79], Hillier and Lieberman [80], and Haigh [81].
( p 0 , p 1 , , p n 1 , p n ) ( j = 1 m λ 0 j λ 01 λ 0 k 1 μ 10 ( j = 1 m λ 0 j + μ 10 ) λ 1 k 1 μ k 0 μ k 1 ( j = k + 1 m λ k j + j = 0 k 1 μ k j ) 1 μ m 0 μ m 1 μ m k 1 ) = ( 0 , 0 , , 0 , , 1 ) ,
with p =   ( p 0 , p 1 , , p k , , p n ) the vector of probabilities in the stationary state [82].
Equation (10) can be reformulated in matrix form as follows:
p × A = 1 .
Thus, the vector p can be calculated from Equation (12).
p = B × A 1 .
(8)
Calculate the availability of the device. Solving Equation (12) gives the mean availability D m , but Equation (13) will be applied if the device has a Markov graph with n 1 stable working states.
D m = p 0 + p 1 + + p n 1 .
where p i is the coefficient obtained from solving the above system of equations.
During the period studied for the medicinal gas distribution devices, the failure and repair rates are constant within the life cycle, and so the distribution of failures and repairs is exponential.

3.2. Markov Chain for the Medicinal Gas Supply Systems

Systems related to supply of medicinal gases are critical in guaranteeing activity in the hospital. The intention, then, was to create a decision model guaranteeing maximum average availability. The options considered were to include sequential redundancies, whose commutation mechanisms had a reliability of 1 and are reserved in a perfect working state, or to increase storage capacity so as to have sufficient autonomy until the main supply was restored.
Descriptions follow on the working of the supply systems of medicinal oxygen (MOSS), medicinal nitrous oxide (MPNSS), and medicinal air (MASS), which served all the care units at the hospital. Descriptions of the optimization alternatives and of the modelling by Markov chains were also considered. This modelling was common to the three systems.
The MOSS system provided medicinal oxygen to all care units at the hospital. Medicinal oxygen was made from an accumulation tank of liquid oxygen and an evaporator. Operation of this process was telemonitored. If there was a failure in the tank–evaporator system, the internal emergency system was activated automatically. This consisted of an automatic, pneumatic switching module with two sets of bottles of 60 m3 each; an alternate staggered working sequence with automatic, pneumatic control; and also a warning to the control center.
The MPNSS system provided medicinal nitrous oxide to surgical areas. Carbon dioxide and nitrous oxide were provided to the hospital by two racks of three bottles each. There was an automatic, pneumatic switching device that changed the rack when the first was exhausted, which sounded an alarm in the control center.
The MASS system provided medicinal air to all the care areas of the hospital. Medicinal air was manufactured in the hospital by mixing oxygen and nitrogen; this process was telemonitored. If there was a failure in the mixing system, the pneumatic switching device would bring online an alternative source of bottled air with a capacity of 262 m3 and sounded an alarm in the control center, which led to manual switching to another backup source of a further 262 m3. If the backup source was exhausted, the internal emergency system was activated; this comprised a pneumatic, automatic switching module with two sets of bottles of 60 m3 each, connected in parallel, and an alternate staggered operating sequence worked by a pneumatic, automatic system. As in the previous cases, a warning was sent to the control center.
The alternatives considered for the three systems were similar:
  • Retaining the original conditions designed for the hospital (Alternative A (ALT A)) with a single external supply.
  • Duplicating the external supply (Alternative B (ALT B)). This would involve producing twice the amount of the original hospital design. Although the process took place in the hospital, it was carried out by an authorized company with its own production process.
  • Increasing storage of gas to provide a higher level of autonomous operation than the maximum shortage of supply (Alternative C (ALT C)).
Let D 1 A , D 1 B , and D 1 C be the mean availabilities obtained for these systems when applying alternatives A, B, and C, respectively.
In the initial design conditions, it was considered that the MOSS system failed because available coverage was (in this case) insufficient, with only eight hours of self-sufficiency using the emergency racks, although they could be replaced manually until the fault in the production system was fixed.
In the initial design conditions, the MPNSS was considered to have failed when the mixer–regulator device failed; the emergency racks provided three days of self-sufficiency, although they could also be replaced manually until the fault in the production system was fixed.
In the initial design conditions, the MASS system was held to fail when the mixer failed, and the emergency racks provided one day of independent operation. Nonetheless, they could be replaced by hand until the fault in the production system was fixed.
Let λ 01 and μ 10 be the failure and repair rates of the tank–evaporator set for the MOSS system, of the mixer–regulator in the MPNSS system, and of the mixer in the MASS system. These failure and repair rates had very similar results in the three systems after analyzing the fault history of the hospital via the computerized maintenance management system. For the initial design, the Markov graph is shown in Figure 3 with a description of the feasible states of the system. A Markov graph is a series of nodes (states) and links. A link joins two nodes, showing that there is a relation between them. This is usually represented by a circle, indicating each node (or state of the system), and an arc or arrow joining each pair of nodes. An arrow from state 0 to state 1 indicates the existence of a possibility of transition from 0 to 1, which in this case was quantified by λ 01 .
From state 1, the system can reach state 0, quantified by μ 10 . The resulting transition matrix is presented in Equation (14).
( λ 01 1 μ 10 1 ) .
Considering the general expression for availability D ( t ) = ( μ / ( λ + μ ) ) + ( λ / ( λ + μ ) )   e ( λ + μ ) t (Creus, 2005), the solution to the previous equation has a transitory part and a steady state. Taking time as infinite, the second term on the right of the previous equation tends to 0, which gives as a result the D m shown in Equation (15).
D m = lim t D ( t ) = μ / ( λ + μ ) .
Mean availability for the three supply systems of medicinal gases, when the system is functioning with a single power source, D 1 m ( M C P ) = μ 1 λ 1 + μ 1 is, thus, shown in Equation (16).
D 1 A = μ 10 / ( λ 01 + μ 10 ) = 0.1 / ( 0.0003425 + 0.1 ) =   0.9966 .
The Markov graph for the production systems of medicinal gases when the service is duplicated is shown in Figure 4. The resulting transition matrix is set out in Equation (17).
( 2 λ 01 2 λ 01 1 μ 10 λ 12 μ 10 1 0 μ 21 1 ) .
The operating log of the hospital showed λ 12 = 0.000799 failures/h and μ 21 = 3 repairs/h. The device ran in states 0 and 1, and, therefore, the mean availability was D 1 B = p 0 + p 1 = 1 . The resulting mean availability was 1 using a recursive approach designed in MATLAB®.
If gas storage increased, the Markov graph in Figure 5 was displayed. The transition matrix can be checked in Equation (18), where λ 13 is the failure rate and μ 31 the repair rate of the extra storage device.
( λ 01 λ 01 1 μ 10 λ 13 μ 10 1 0 μ 31 1 ) .
The device ran states 0 and 1; therefore, D 1 C = p 0 + p 1 . Mean availability was calculated with a recursive approach developed in MATLAB® using the failure and repair data over the working time of the hospital, that is: λ 01 = 0.0003425 failures/h, λ 13 = 0.0003425 failures/h, μ 10 = 0.1 repairs/h, and μ 31 = 0.1 repairs/h. The resulting mean availability was 1.

4. Multicriteria Model for Optimization of Decision Making in Medicinal Gas Supply Systems

An expert group was put together by the management of different areas of the hospital. The group was coordinated by the maintenance manager at the hospital, who acted as facilitator, and had knowledge of a variety of multicriteria techniques, in particular the MACBETH approach and AHP.
The MACBETH approach was selected from among the MCDM methods for the following reasons:
  • If the decision group had any doubt or uncertainty when giving judgements, they may assign a range of MACBETH semantic categories.
  • M-MACBETH was a helpful software since it facilitated the construction of value functions and the validation of the results obtained. Also, every time a judgement was included in a judgement matrix, its consistency was checked. Additionally, it allowed sensitivity and robustness analyses to be carried out.
  • Validation of the results was an important aspect of the MACBETH approach and ensured a greater reliability of the results.
  • The use of the reference levels in each descriptor minimized inconsistency and produced more reliable, accurate, and objective results.
  • MACBETH was a complete methodology with a complete definition of each step that ensured objective decision making. Other MCDM methods lacked exhaustive and detailed procedures.
FAHP was chosen to include doubtful, uncertain, or ambiguous situations in the judgements given by the decision makers in real decision making. It is the most popular means of dealing with fuzziness and uncertainty. FAHP divided a complicated decision, which may involve many criteria (some of which may be in conflict), scenarios, stakeholders, etc., into a hierarchical structure, facilitating decision making. It allowed consistency of the given judgements to be evaluated, and it was a technique that could be easily understood by managers and those ultimately responsible for accepting a decision.

4.1. Structuring

The decision group analyzed the existing literature on MCDM as applied to technical decisions about optimization of systems. As a result, they saw that cost was the most important criterion, assessing cost from different perspectives such as investment costs, maintenance costs, and training costs. Cost savings was another criterion that frequently appeared in the literature. Here, issues such as reduction in energy consumption, in insurance policies, and in human resources were considered. Availability and safety were the next most commonly used criteria in the literature. Availability was generally assessed through mean time between failures (MTBF) or maintainability through mean time to repair (MTTR). These paremeters are the inverse, respectively, to the failure and repair rates used in this study. With regard to safety, both risk to and safety of, workers, equipment, and facilities were analyzed. Other criteria, in order of the frequency with which they appeared in the literature, were the sustainability of proposed improvements or strategies, quality (product quality, process quality, damage to image, customer satisfaction, etc.), competitiveness, social aspects (like acceptance by workers, motivation, labor effects, etc.), diagnostic features, environmental issues such as environmental damage and zero pollution, resource requirements, and technical questions [49].
The decision group considered that criteria of cost, availability, and safety were key in a health care organization, but given that most of the literature was applied to manufacturing companies, the group adapted these criteria to the specific characteristics of a hospital.
The decision group established areas of concern and FPVs, and they defined descriptors associated with each FPV and the associated performance levels.
The FPVs determined by the decision group were:
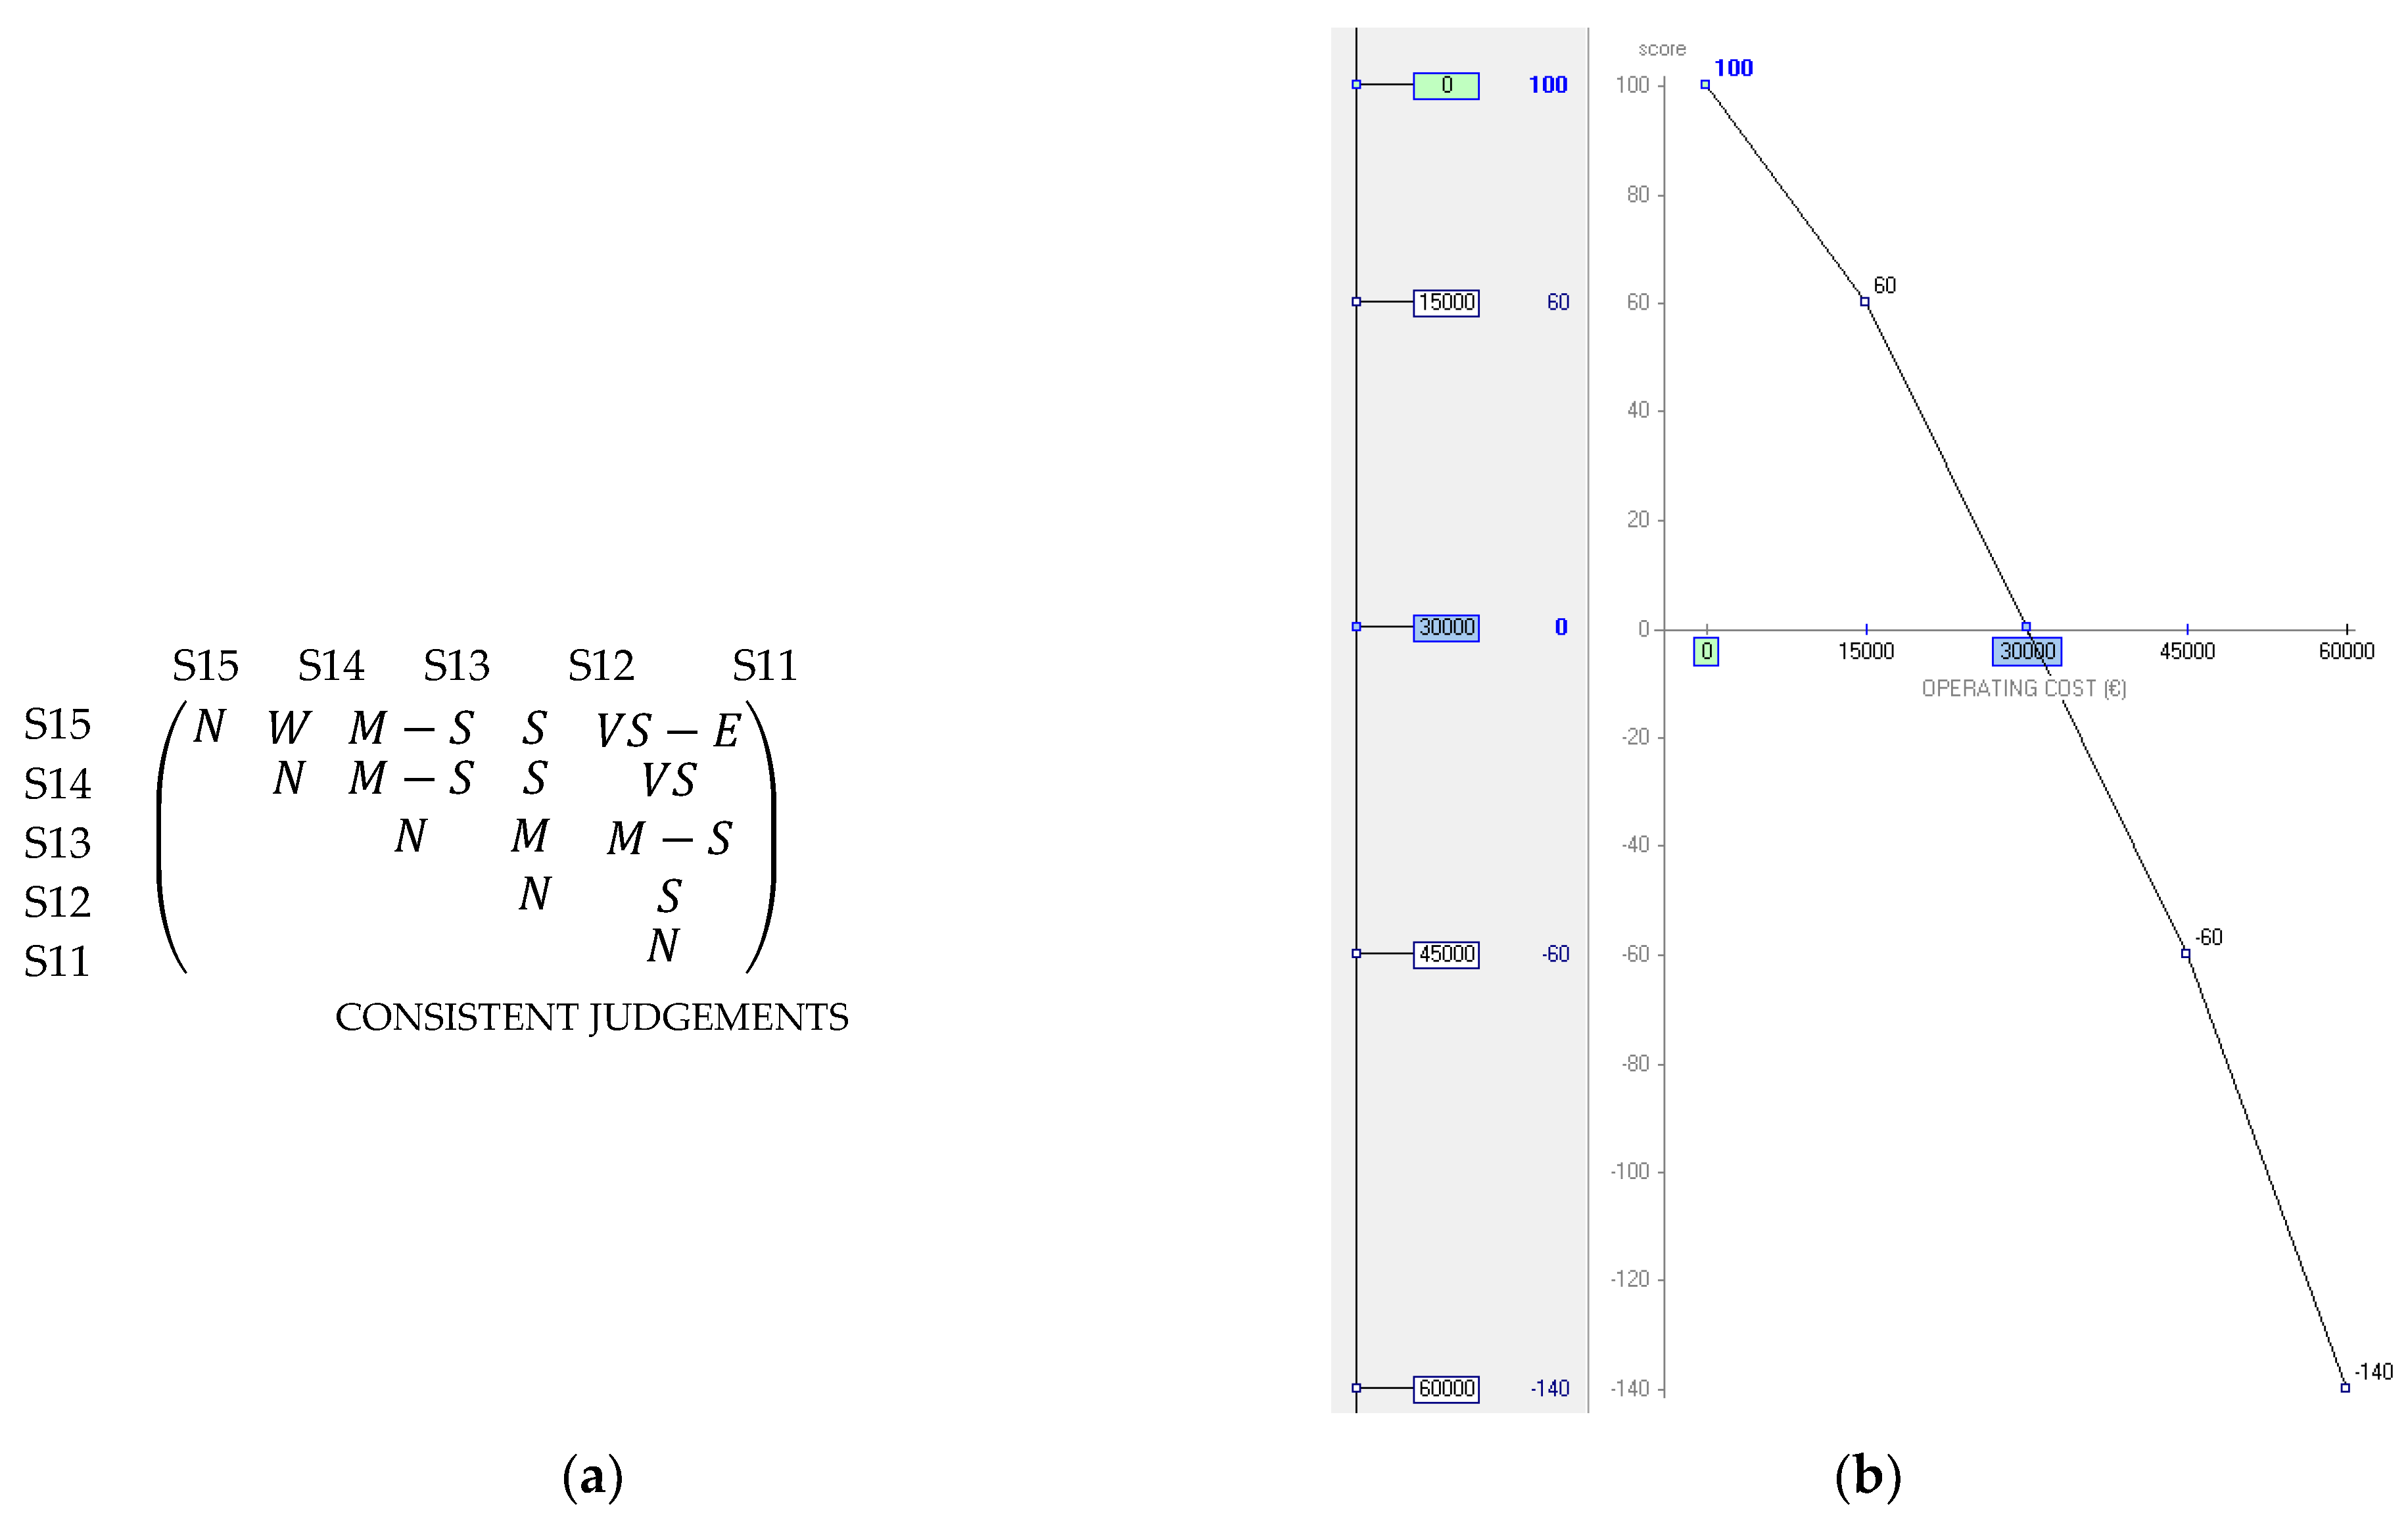
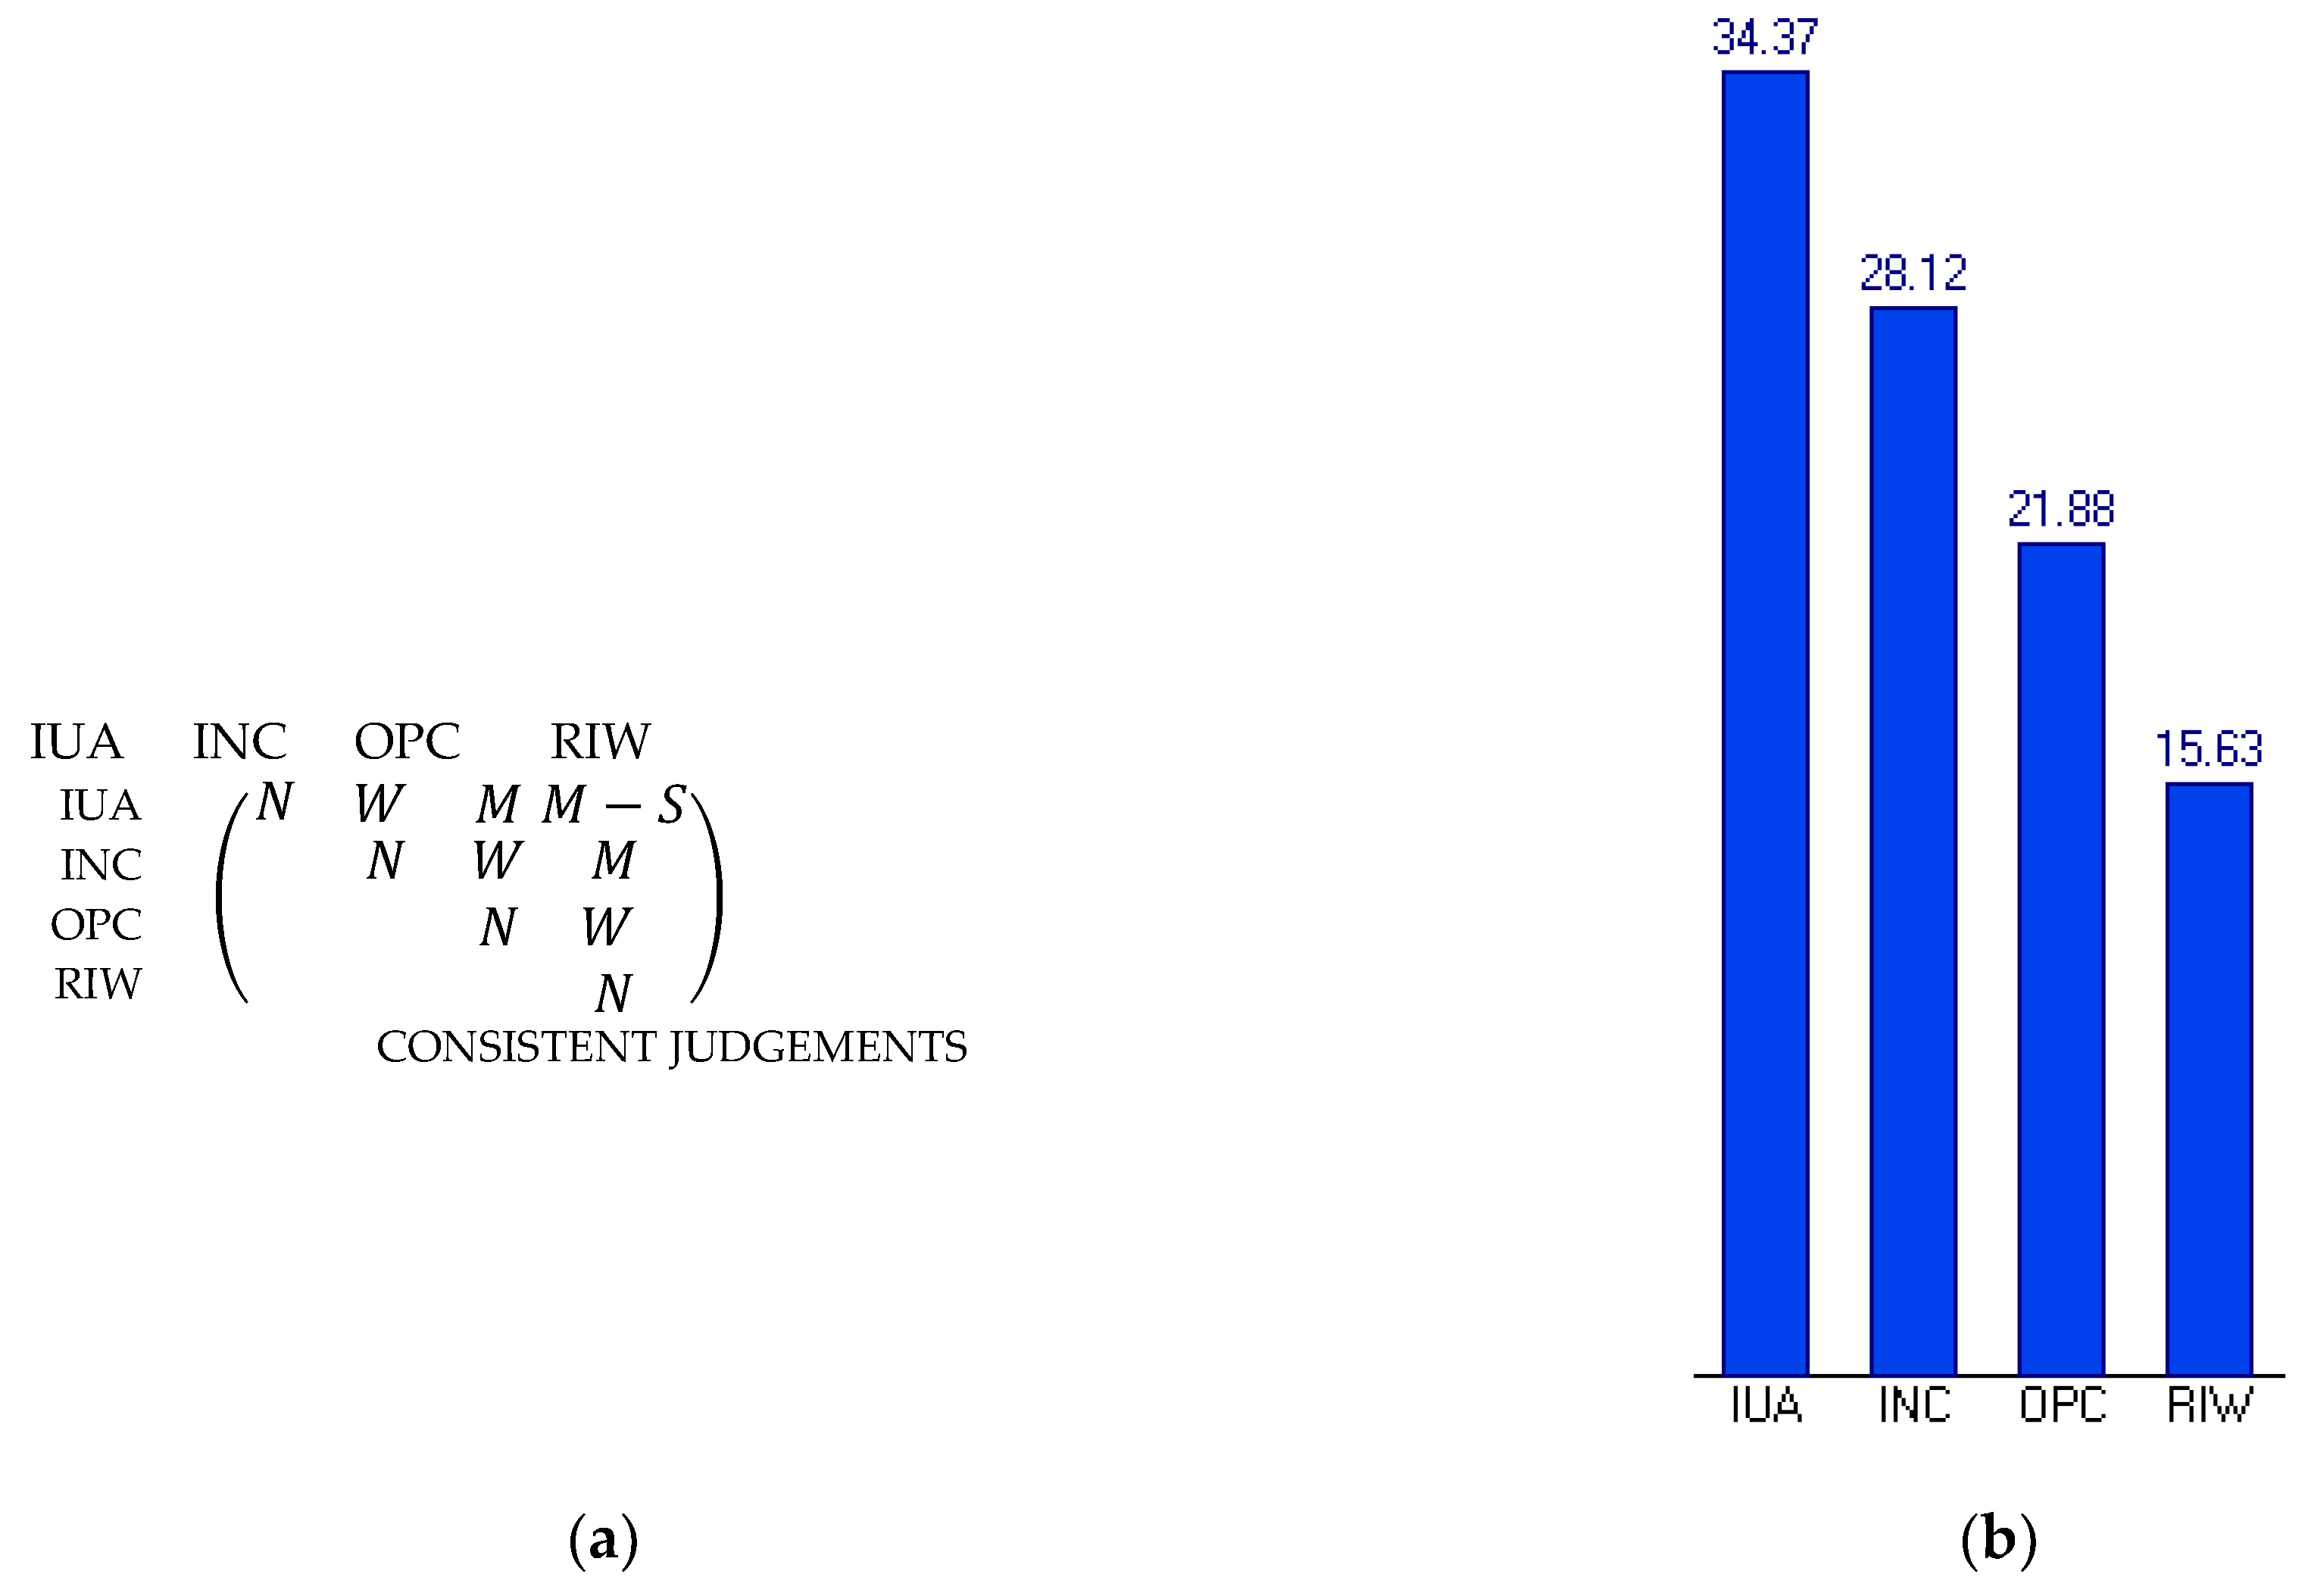
  • Cost. This included all annual costs, whether direct or indirect, produced by each alternative. It included both operating costs and investment costs:
  • Operating costs (OPC). This criterion considered the extra annual human resource costs corresponding to the technical maintenance staff. The following scale levels were defined for each descriptor, from lowest to highest level of achievement:
    -
    S11. Up to €60,000.
    -
    S12. Up to €45,000.
    -
    S13. (Neutral) Up to €30,000.
    -
    S14. Up to €15,000.
    -
    S15. (Good) €0.
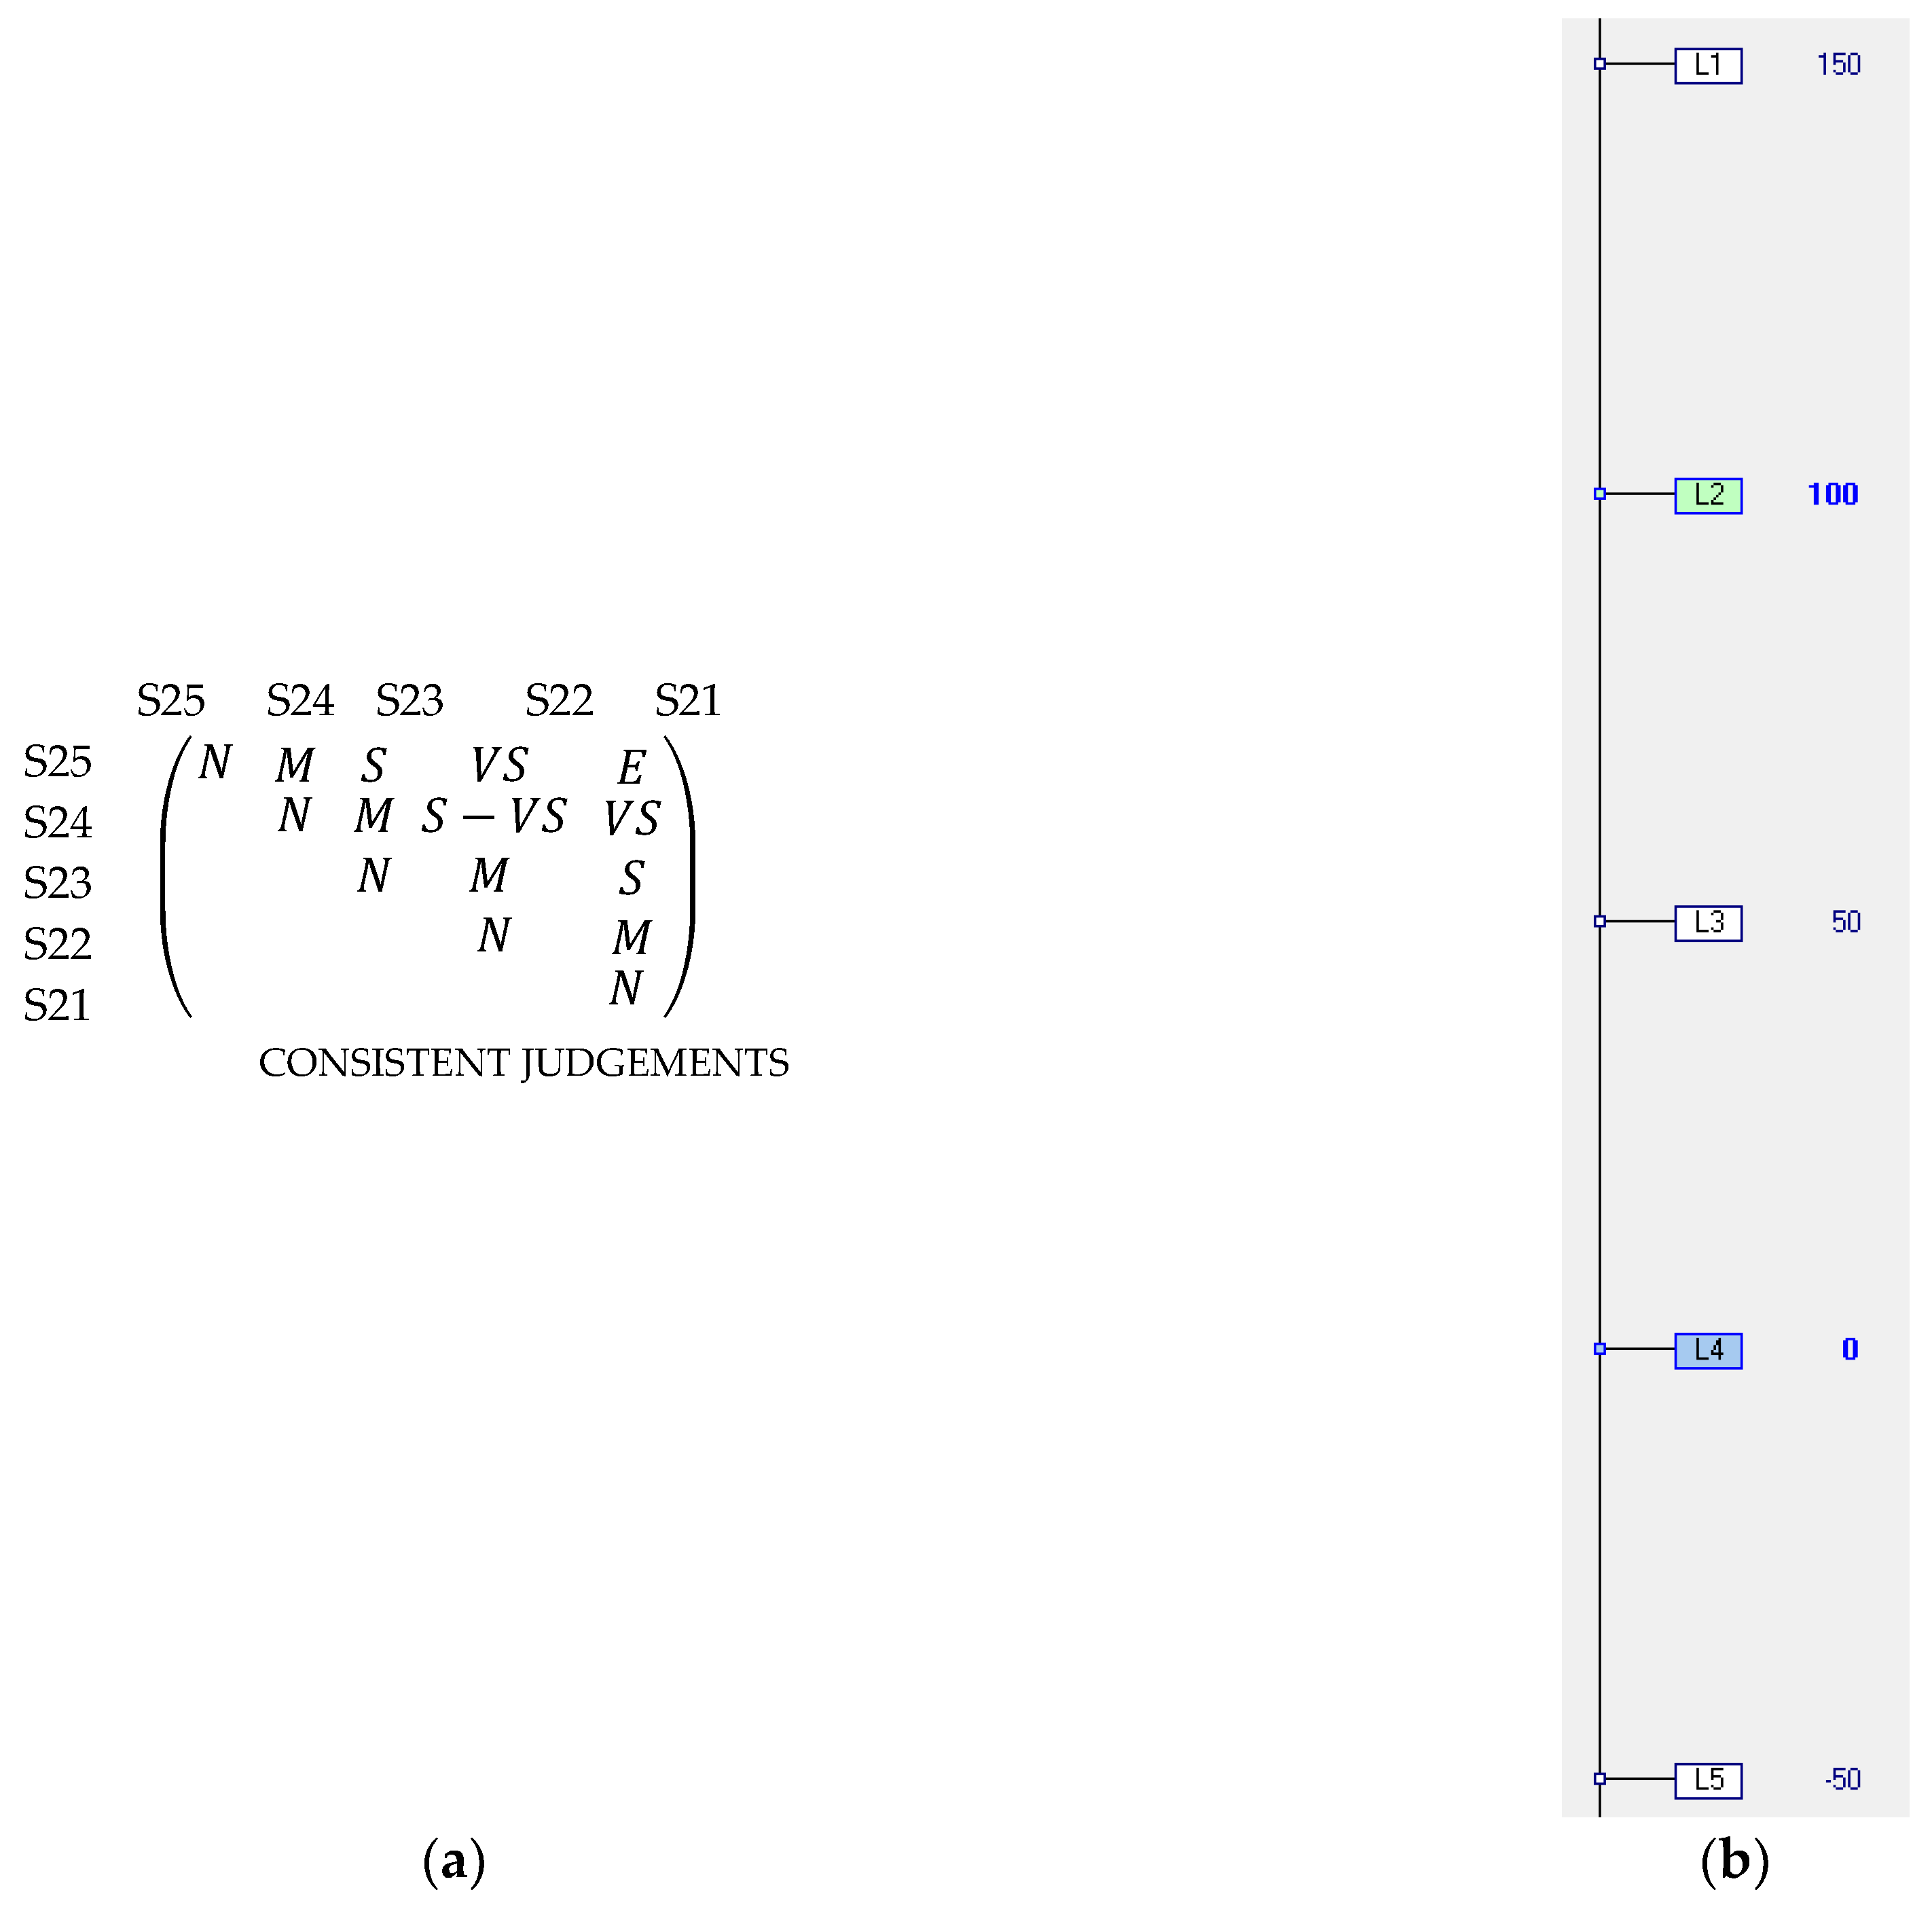
  • Investment costs (INC). This included all costs, both of setting up and starting the operation, produced by each action. The estimated value was considered as a percentage of the cost of the existing facilities. The scale levels are shown below, in order of greater to lesser attractiveness:
    -
    S21. Increase greater than 100% over the estimated value of the original facility.
    -
    S22. (Neutral) Increase between 75% and 100% over the estimated value of the original facility.
    -
    S23. Increase between 50% and 75% over the estimated value of the original facility.
    -
    S24. (Good) Increase between 25% and 50% over the estimated value of the original facility.
    -
    S25. Increase of up to 25% over the estimated value of the original facility.
  • Risk to workers (RIWs). This FPV assessed the risk to which maintenance workers, and any other hospital or outside workers who interacted with the system, were exposed. The descriptor defined was the existence of a level of risk and the need to take safety precautions. The scale levels of this descriptor in increasing order of relative achievement are:
    -
    S31. There was a definite risk, requiring basic, specific, and emergency precautions to carry out the operational or maintenance activities on the system.
    -
    S32. There was a definite risk, requiring basic precautions plus some specific precautions to carry out activity on the system.
    -
    S33. (Neutral) There was a definite risk, leading to the need to take basic precautions to carry out activity on the system.
    -
    S34. There was a specific potential risk, leading to the need to take certain basic precautions when carrying out activity on the system.
    -
    S35. (Good) No risk to workers was identified at any time, and there was no need to take any safety precautions.
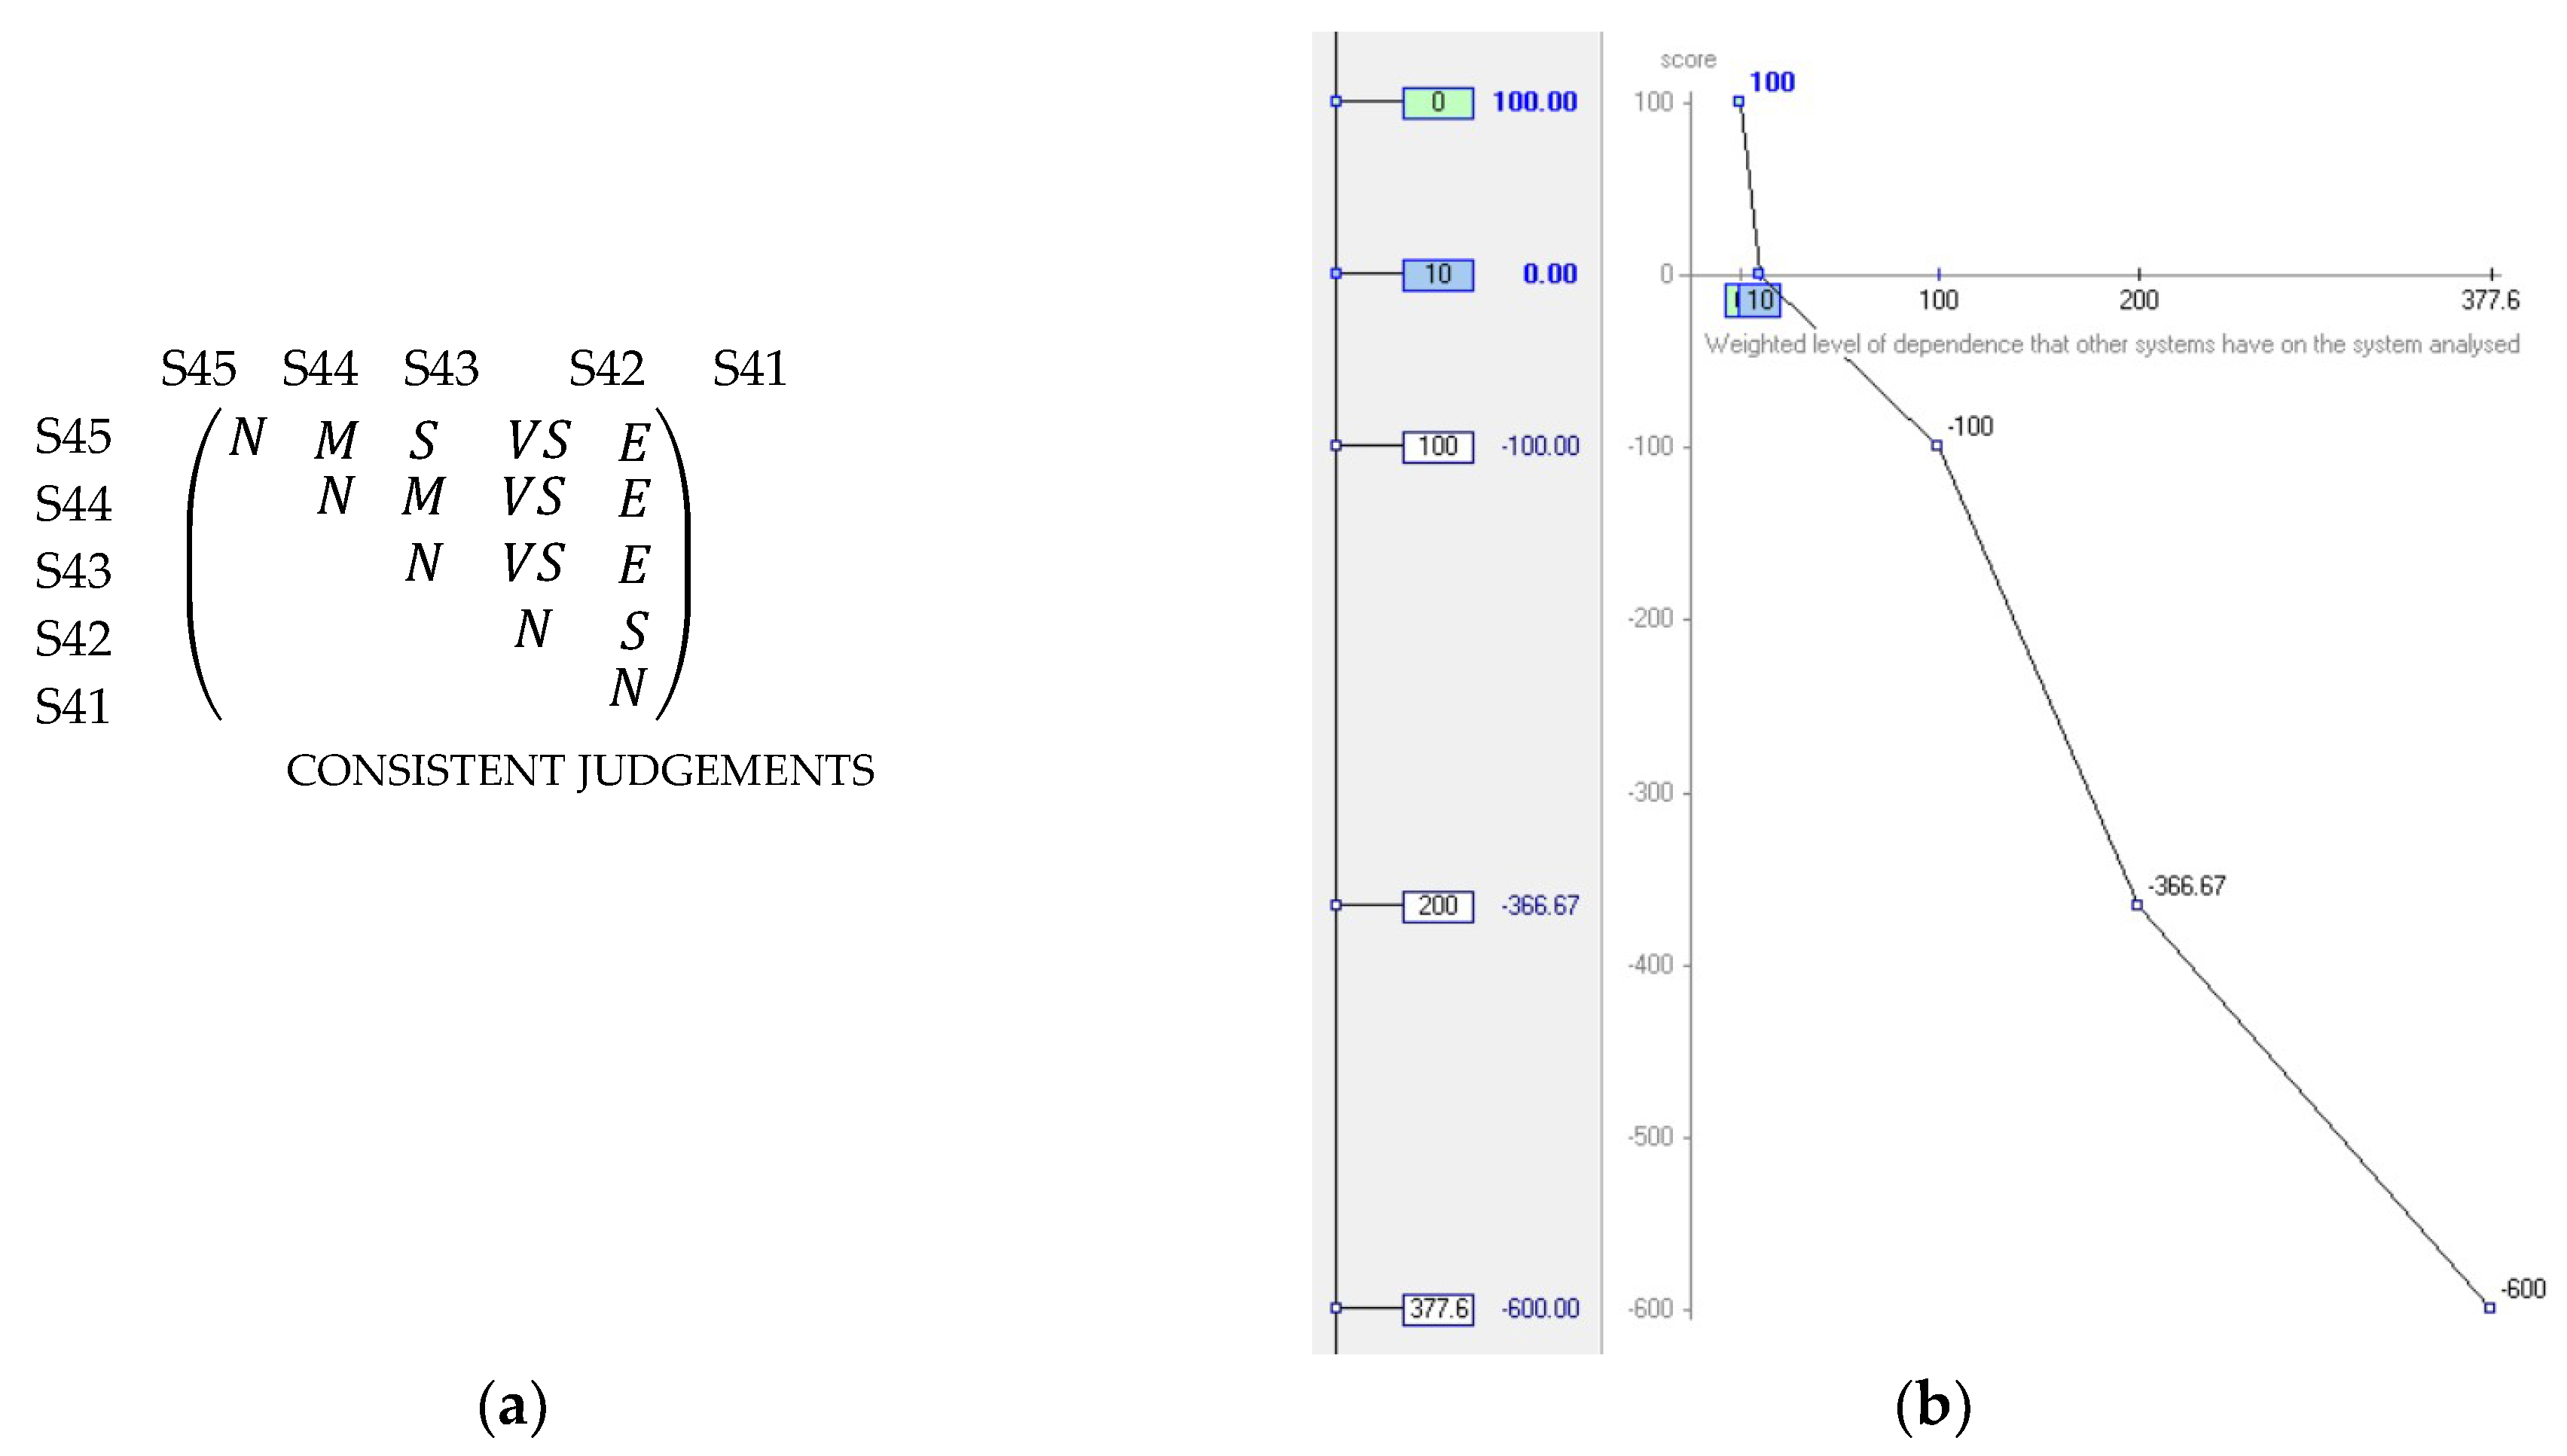
  • Impact of unavailability of the supply devices of medicinal gases on hospital activity (IUA). This measured the effect that unavailability of an intake system and supply of medicinal gases would have on dependent systems. The descriptor associated with this criterion is defined in Equation (19).
    Weighted   level   of   dependence   of   other   systems = = [ ( n c × 4 ) + ( n i × 2 ) + ( n n × 1 ) ] × ( 1 D m ) × 100 ,
    where n c is the number of critical systems which depend on the gas supply system studied, n i is the number of important systems, and n n is the number of dependent systems considered to be of normal criticality. These parameters were multiplied by four, two, or one depending on whether the dependent system was critical, important, or normal, respectively. (1 − D m ) was the mean unavailability of the system assessed. The scale levels of this descriptor were established as the upper and lower bounds, which were derived from a prior study on the 522 systems that carried out technical activity in the hospital. The most unfavourable scale level was found in the water-cooling system, which comprised four cooling towers. It had 15 critical dependent systems, nine important, and one with normal criticality. Furthermore, it had a mean unavailability of 0.0320. The most unfavourable resulting value was, therefore, 377.60. The most favourable value appeared when there were no dependent systems or the mean unavailability was 0; in both cases, the resulting value was 0. The scale levels of the descriptor Weighted level of dependence of other systems, from lowest to highest level of achievement, were
    -
    S41. (200, 377.60].
    -
    S42. (100, 200].
    -
    S43. (10, 100].
    -
    S44. (Neutral). (0, 10].
    -
    S45. (Good). 0.
The structuring process with criteria and descriptors defined was applied to both the model constructed by means of the MACBETH approach and elaborated with FAHP.

4.2. The MACBETH Approach Model

The MACBETH value tree of the supply systems for medicinal gases can be observed in Figure 6.
The decision group used the MACBETH semantic categories: no difference (N), C 1 , C 2 ,   C 3 , C 4 , C 5 , and C 6 to give judgements that allowed ordinal scales to be transformed into cardinal scales or value functions.
Figure 7 shows the MACBETH pairwise comparison matrix between the scale levels of the descriptor OPC and the value function obtained by means of M-MACBETH by linear programming. The judgement matrix for the operating costs criterion provided by the decision group was consistent. Since this FPV used a descriptor with quantitative performance levels, M-MACBETH gave two value functions—on the left of Figure 7b, the vertical axis has a numerical scale, which allocated the level good to the descriptor (€0) with a value 100, while the neutral level, with a value of €30,000 has the value 0. The right of the Figure 7b shows a piecewise linear value function graph. The horizontal axis reflects the scale levels of the descriptor, and the vertical axis the scores. The linear segments allowed the score to be calculated for any alternative whose performance in an FPV was between two consecutive performance levels. A numerical scale with three slightly different slopes was obtained: 0 to 15,000; 15,000 to 45,000; and 45,000 to 60,000.
Figure 8a shows the MACBETH pairwise comparison matrix, and Figure 8b shows the value function for the FPV INC. Here, the descriptor defined used qualitative scale levels, giving a linear, continuous numerical scale. In this case, the value function assigned the reference level good (S22) to the score 100, and the reference level neutral (S24) was assigned the score 0.
Figure 9a displays the pairwise comparison judgement matrix, and Figure 9b displays the value function for the FPV RIW. The judgement matrix of the FPV risk to workers was consistent. As with the previous FPV, the descriptor used qualitative scale levels, giving a continuous, linear numerical scale, which assigned reference levels to the scores 100 and 0.
Figure 10 shows the pairwise comparison judgement matrix and the value function for the FPV IUA. The resulting judgement matrix was consistent. This FPV used a descriptor with quantitative performance levels, giving a value function with four different segments: 0 to 10, 10 to 100, 100 to 200, and 200 to 377.60. The slopes for values of the descriptor Weighted level of dependence of other systems was higher between 0 and 10 than on of the other segments; this was because the systems with the most dependent systems were also those with the highest availability in the hospital. The judgement matrix was consistent.
All value functions were checked and validated by the group to guarantee that they satisfactorily represented the relative magnitude of the judgements [54].
The weighting process for the FPVs initially defined an alternative that included all the FPVs at the neutral level. The moderator asked the decision group to judge qualitatively, by means of the semantic categories, the increase in overall attractiveness provided by a swing from the neutral level to the most attractive impact level in each of the FPVs. If a very accurate judgement could not be given, it was possible to use “positive”, which meant choosing all the M-MACBETH semantic categories except “no”. For example, how much would a swing from neutral to good in risk to workers affect its overall attractiveness? The decision group could not accurately quantify this judgement with a specific semantic category, and so answered “positive”. The group was then asked how much would a swing from neutral to good in operating cost increase its overall attractiveness? The answer of the decision group was VS. In the case of investment cost and impact of unavailability of supply devices for medicinal gases on hospital activity, the answer was also “positive”. In this way, the last column of the judgement matrix in Equation (20) was filled in, allowing the FPVs in the matrix to be ordered from greater to lesser importance.
The group then compared how much more preferable the change from the neutral to the good level was in the FPV’s impact on unavailability of the supply devices of medicinal gases on hospital activity, as opposed to the same change in the Investment cost. The group answered W. The group was then asked how much more attractive a swing from neutral to good would be in impact on unavailability of the supply devices of medicinal gases on hospital activity than in operating costs? The answer was M. The group was asked how much more attractive a swing from neutral to good would be in impact on unavailability of the supply devices of medicinal gases on hospital activity than in risk to workers? In this case, the group had some doubts and gave M-S as a judgement, which was two consecutive categories. This completed the first row of the judgement matrix of Figure 11. Next, they were asked how much more attractive a swing from neutral to good would be in investment cost than in operating costs; the experts gave the judgement W. When asked the same question comparing investment costs with risk to workers, the category M was chosen. This process was completed by repeating the question for operating cost and risk to workers, which gave W [54].
The weightings obtained for the FPVs are displayed in the bar chart in Figure 12.
It was next necessary for the decision group to validate the results. This was done by asking the group whether they held the weightings obtained to be right or if some change was needed. However, the group of experts agreed with the weightings obtained.
M-MACBETH software can check the consistency of each judgement given by the group of experts. In all cases, the judgements were confirmed to be consistent.

4.3. The Fuzzy Analytic Hierarchy Process Model

Although a number of fuzzy scales have been described, the fuzzy scale that best corresponded to the original AHP preference scale [67] was that shown in Table 1. Thus, this was the one used in our study.
The hierarchy structure of the supply systems for medicinal gases to which FAHP was applied is shown in Figure 13. The value tree applied in MACBETH was slightly modified to consider a similar concept to this technique, where all the criteria were assessed at a similar level in the hierarchy.
The weightings of the FPVs were calculated from the fuzzy judgement matrix A ˜ of Equation (4). A similar decision group as in the application of the MACBETH approach was asked to perform the judgements of A ˜ . The fuzzy scale of Table 1 was used. The pairwise comparison matrix of FPVs obtained by consensus is set out in Table 2.
Equations (4) and (5) were applied to the fuzzy pairwise comparison matrix of the experts’ aggregated judgements, giving the following fuzzy weights for the FPVs:
r ˜ O P C = ( [ 0.250 0.333 1 1 ] 1 4 ,   [ 0.333 0.500 1 2 ] 1 4 , [ 0.500 1 1 3 ] 1 4 ) = ( 0.537 ,   0.760 ,   1.107 )   ;
r ˜ I N C = ( 0.904 ,   1.316 ,   1.861 )   ;
r ˜ R I W = ( 0.343 ,   0.439 ,   0.639 )   ;
r ˜ I U A = ( 1.565 ,   2.280 ,   2.913 )   ;
w ˜ O P C = ( 0.537 6.520 , 0.760 4.794 , 1.107 3.349 ) = ( 0.082 ,   0.158 ,   0.330 ) ;
w ˜ I N C = ( 0.139 ,   0.275 ,   0.556 ) ;
w ˜ R I W = ( 0.053 ,   0.092 ,   0.191 ) ;
w ˜ I U A = ( 0.240 ,   0.475 ,   0.870 ) ;
Applying Equation (6), the weightings were obtained as a crisp number for the criteria, and after normalization, the weights were: w I U A = 0.458 , w I N C = 0.280 , w O P C = 0.165 , and w R I W = 0.097 .
The C R , calculated from Equation (7), was 0.08.
The same computation was used for each descriptor, taking into account its scale levels. As an example, Table 3 collected the pairwise comparison matrix of the group of experts for the descriptor of OPC. The resultant nonfuzzy weighting vectors for all the descriptors are shown in Table 4.

5. Results and Discussion
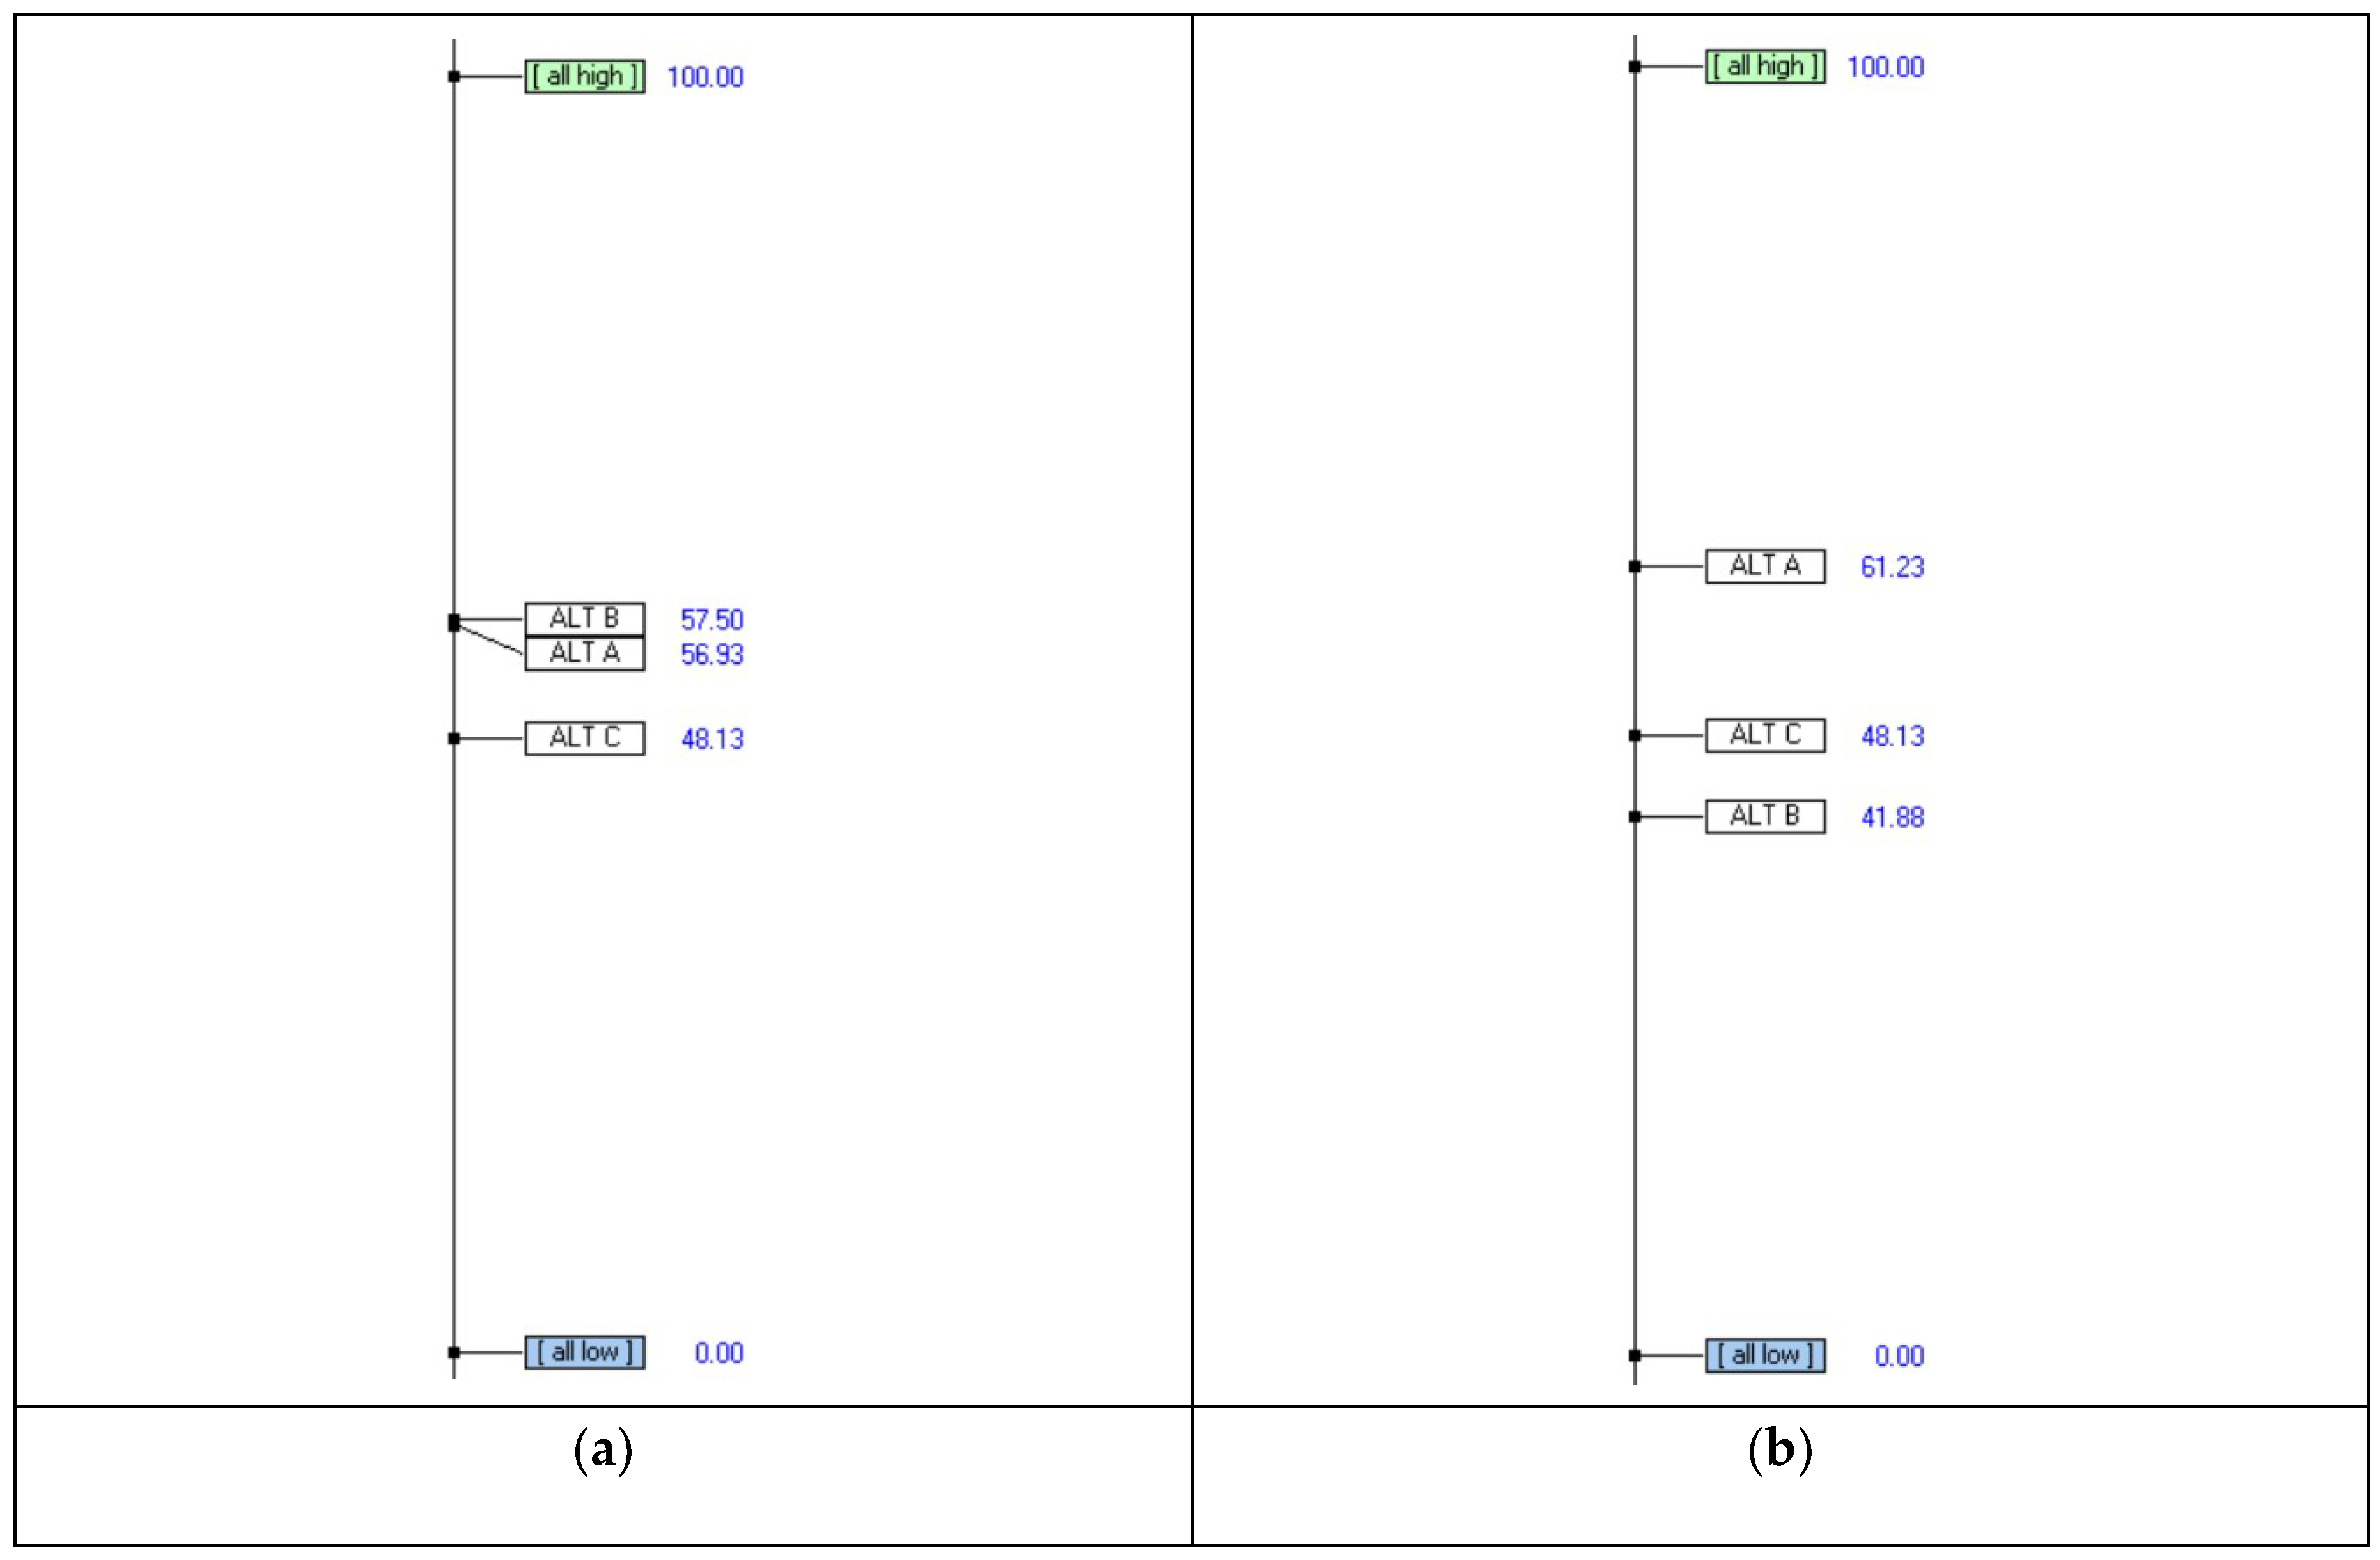
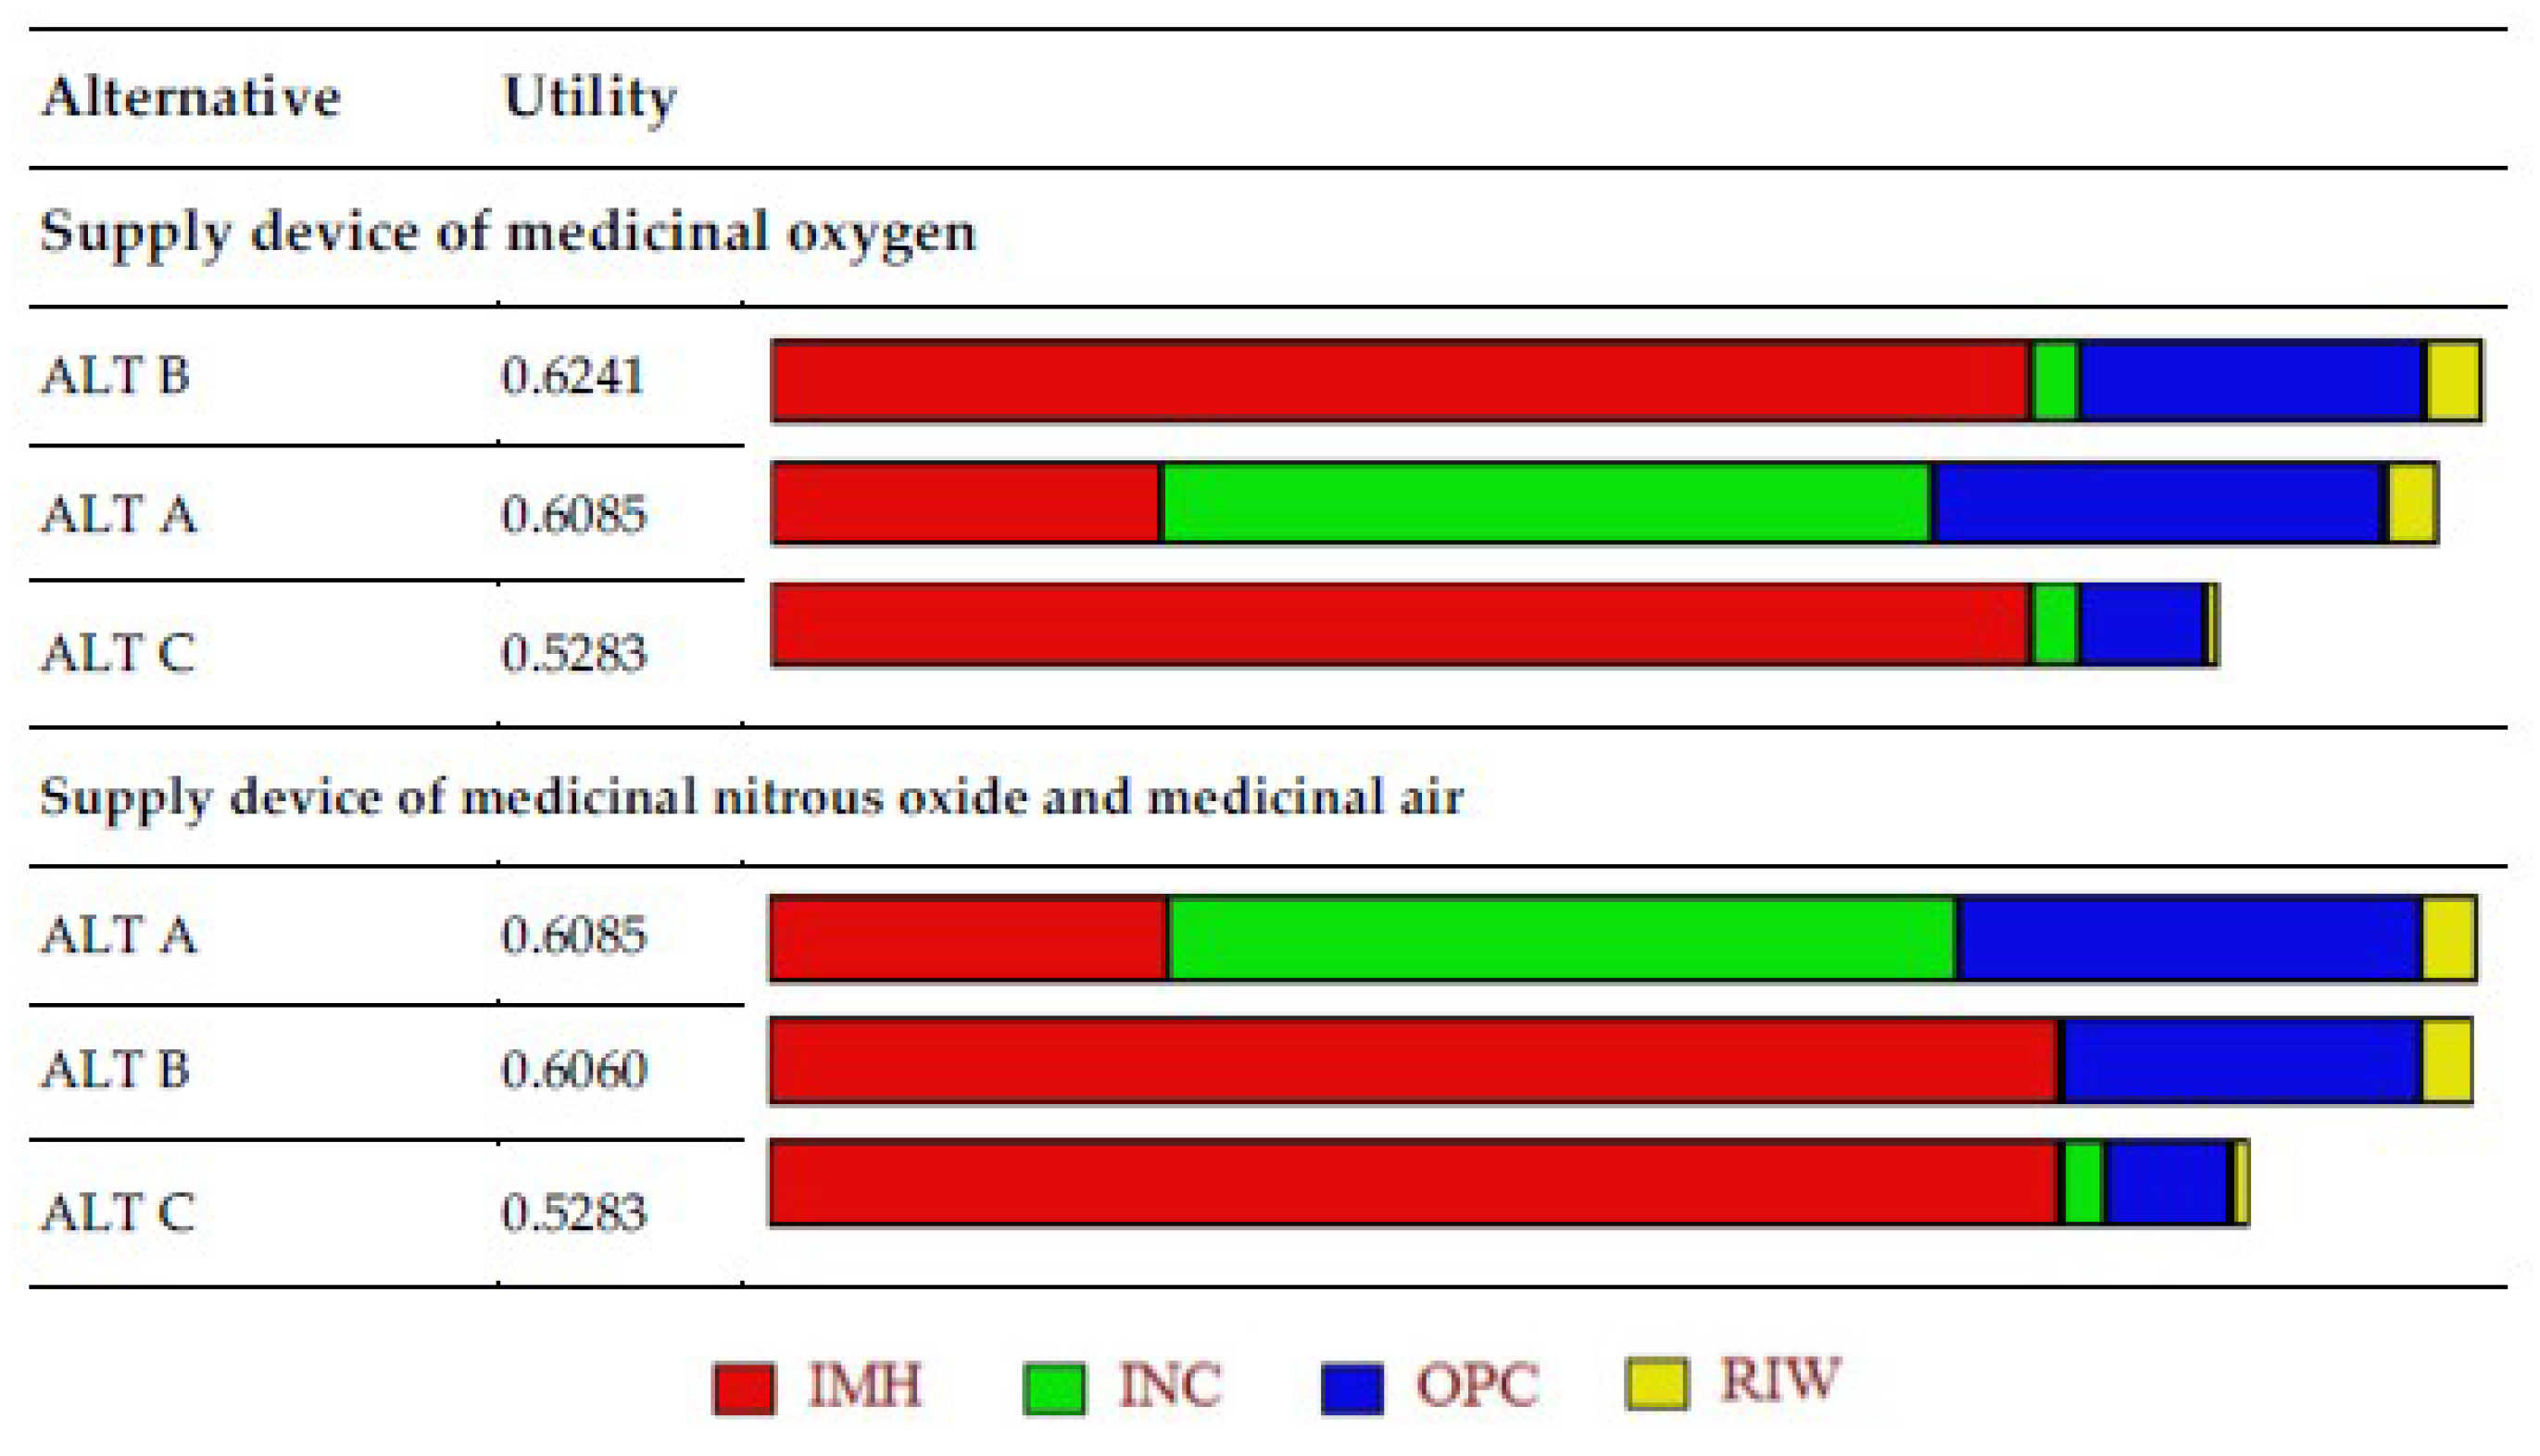
5.1. Global Scores

The rankings of alternatives in each device were obtained by assigning the impact of each FPV on each alternative. In the case of impact on unavailability of the supply devices of medicinal gases on hospital activity, the mean availabilities derived from modelling via continuous-time Markov chains in each system must be used. These values are summarized in Table 5. Each device investigated had the number of critical, important, and normal systems dependent on them, which are shown in Table 6.
Table 7 has information about the performance of PFVs in each of the alternatives of the supply devices for medicinal oxygen (MOSS), medicinal nitrous oxide (MPNSS), and medicinal air (MASS).
The global scores for each alternative and system using the MACBETH approach were obtained from Equation (2), and the results are shown in Figure 14. The run time for the M-MACBETH model was less than five milliseconds.
The MACBETH model returned, as the most appropriate alternative, ALT B (duplicate the external supply) in the supply systems of medicinal oxygen. For nitrous oxide and medicinal air supply systems, ALT A was recommended as optimal. All systems analyzed in the hospital were currently using alternative ALT A. That is, they had a single supply line.
The global scores for each alternative obtained by applying FAHP are shown in Figure 15. The FAHP model gave the same results as the model built with the MACBETH approach. In this case, the final weightings obtained in Table 4 for the scale levels of each descriptor were turned into utilities. Their values were recalculated so that they were between 0 (Si1) and 1 (Si5). In the case of the descriptor of OPC, the utilities ( U ) associated to its scale levels were the following: U S 11 = 1.000 ,   U S 12 = 0.7719 ,   U S 13 = 0.2759 ,   U S 14 = 0.1141 ,   and   U S 15 = 0.000 .
In this case, there was no software to facilitate the application of FAHP, and so the calculations were done manually.
When the models suggested a change in the design, a comparison of the alternative currently applied in the hospital with that given by the models is shown in Table 8.
From the results obtained by the model, the hospital developed a strategic introduction plan, assigning a priority to each of the optimization alternatives obtained, which involved a change with respect to the alternative currently used. The medicinal oxygen supply device was given a priority of 1 (the highest possible), since it had direct consequences for the functionality of the systems and of their dependent systems, with a profound effect on quality of care. A run time for introducing the optimization alternatives of one month was programmed. It was necessary to carry out an additional, specific project for their introduction.
There were some limitations to this study. Firstly, the FPVs or criteria used might differ with a different decision-making group. However, the criteria proposed could be a reference that could be used in other hospitals or supply systems as energy or water. This would help with designing objective models for decision making in hospitals. In any case, the criteria could be adapted to the final aims of each organization. Secondly, the current results were based on a specific economic and political situation in the organization and region. Changes in these areas could modify the judgements, leading to a need to update the models when these changes are detected. This would guarantee that the alternatives used were still ideal, and it would include the possibility of introducing new alternatives into the models that did not previously exist or had not previously been feasible.

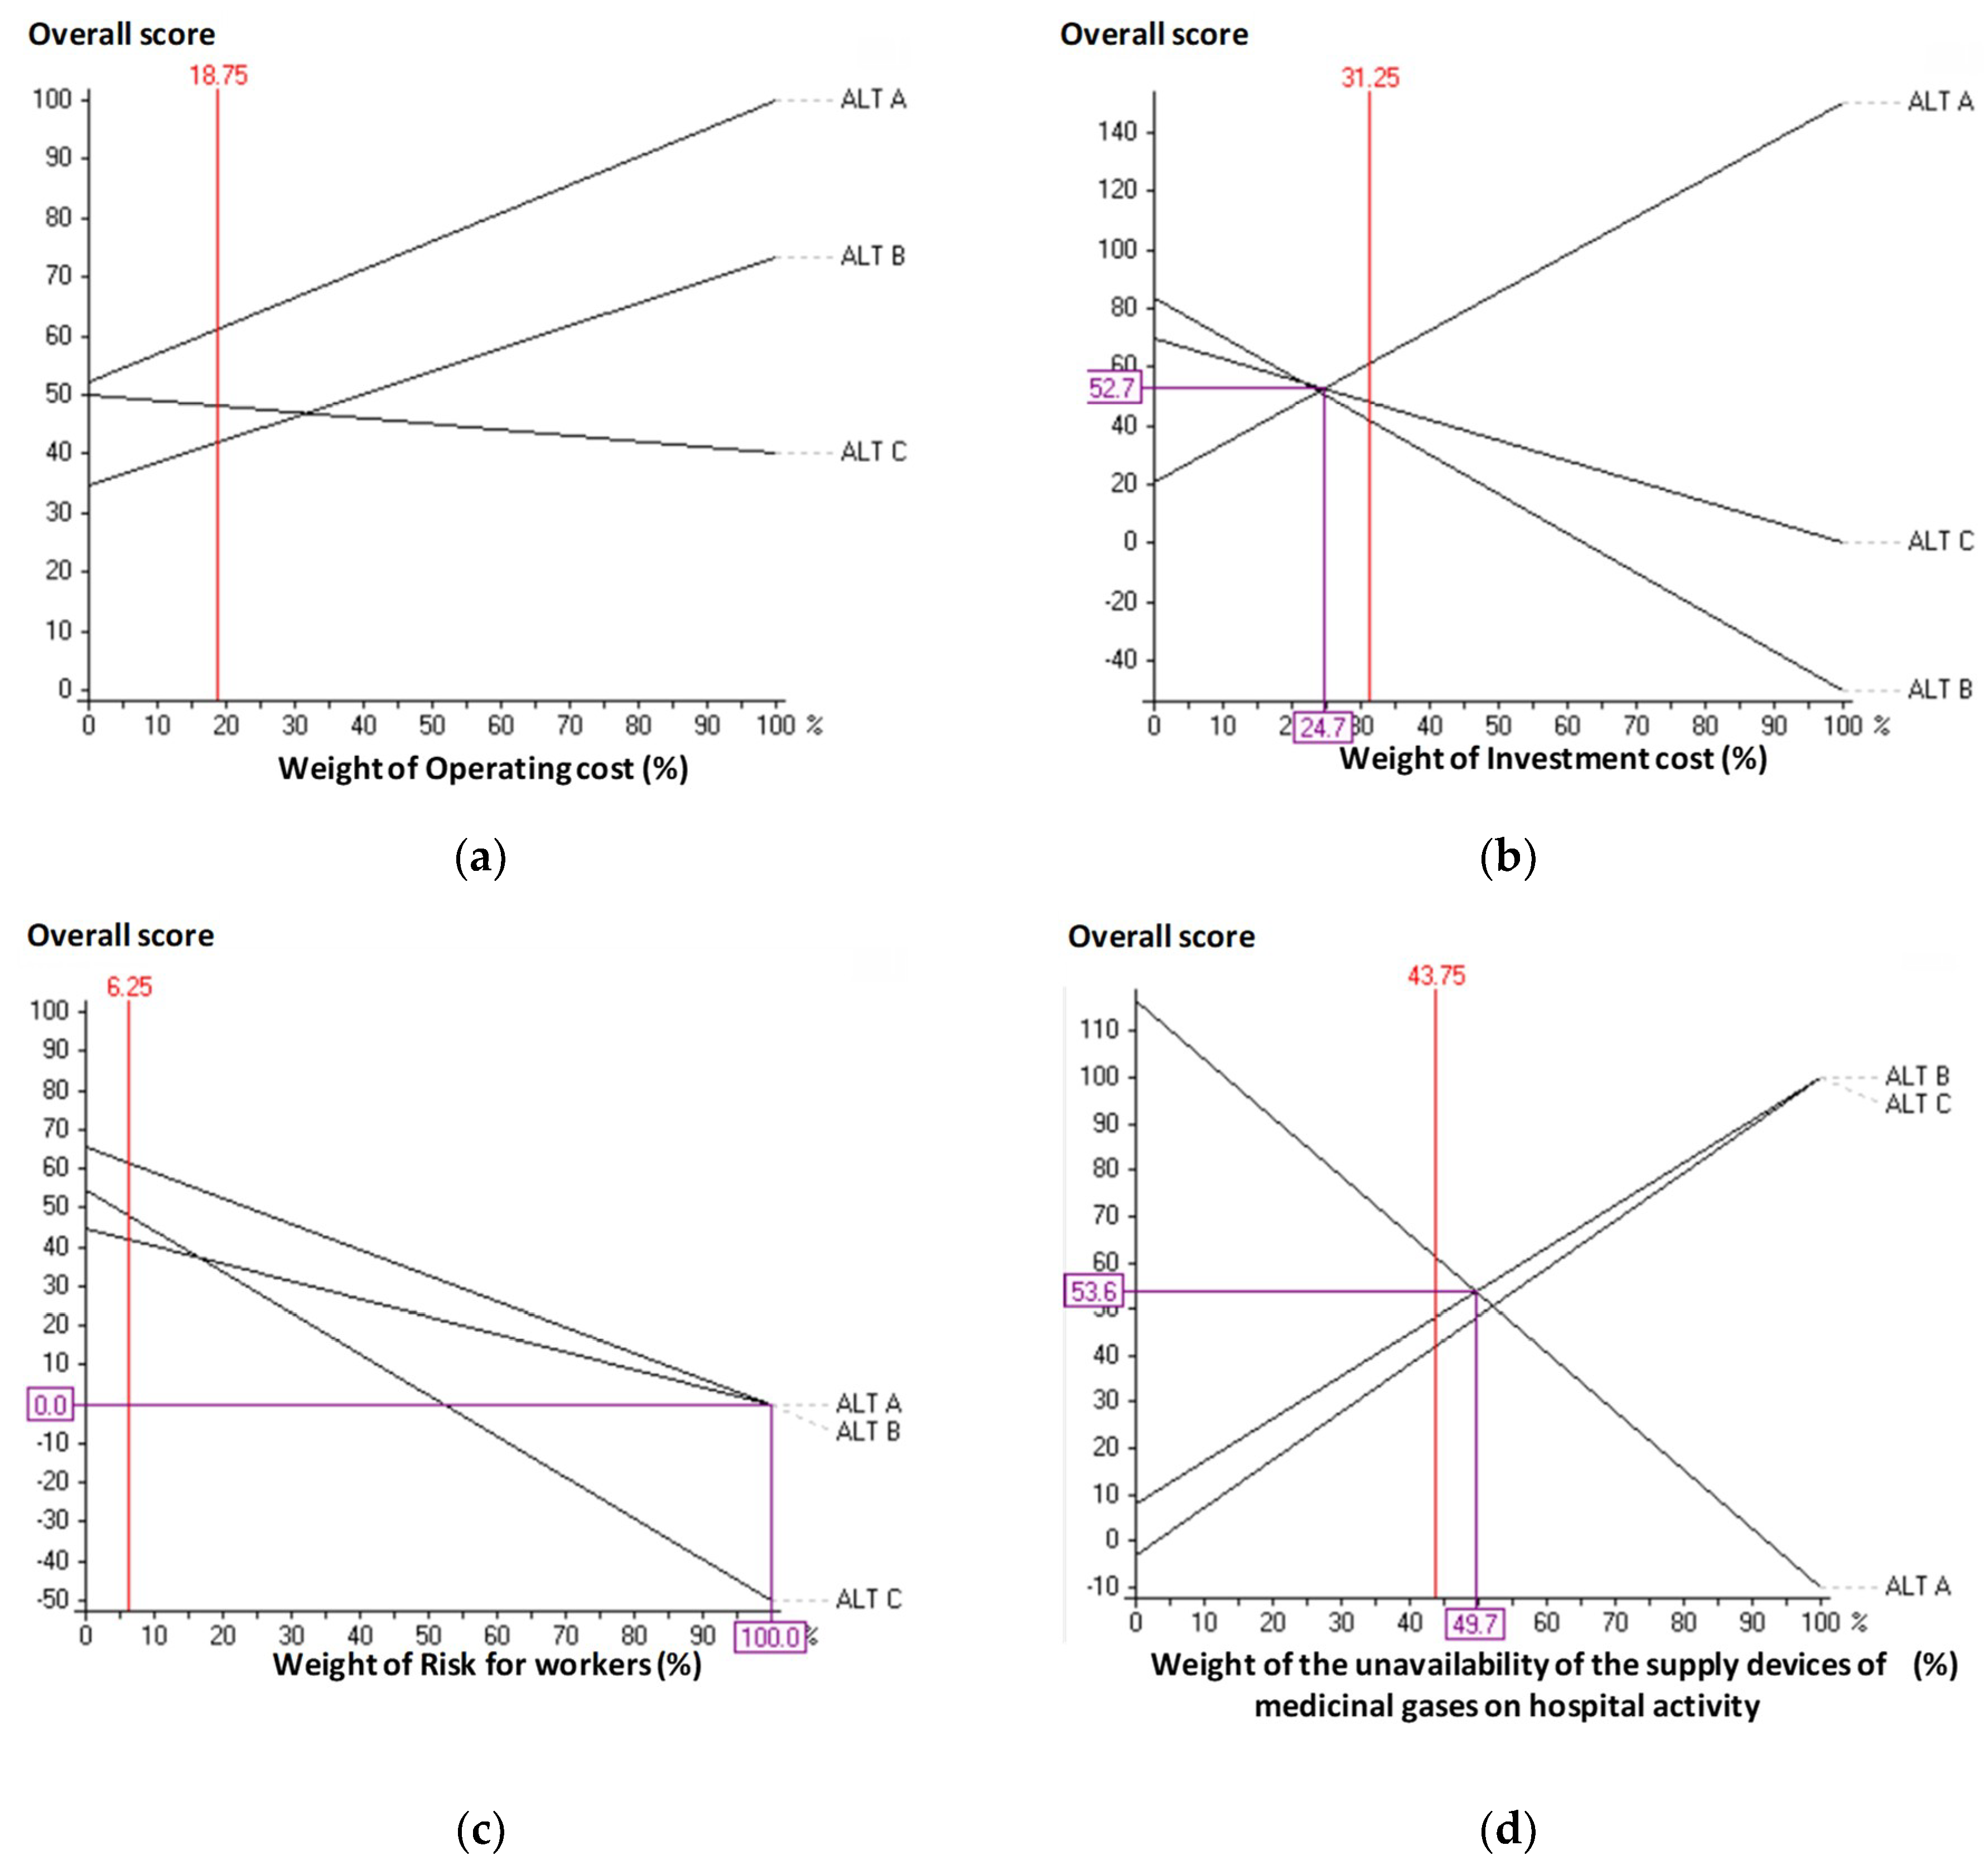
5.2. Sensitivity Analysis

A sensitivity analysis was carried out for each of the devices analyzed to guarantee the robustness of the model. In order to do this, the weightings of the FPV’s were modified one by one up to the limit values considered viable by the group of experts. The weightings of the remaining FPVs were simultaneously adjusted so that the sum of the weightings was 1 (or 100%). The results of the sensitivity analysis for medicinal nitrous oxide (MPNSS) and medicinal air (MASS) are shown in Figure 16. Firstly, the weighting of OPC was modified. The current weighting of OPC (18.75%) can be viewed at the top of Figure 16a. ALT A was the alternative chosen for any weightings of OPC, and so variation in the ranking of alternatives was not possible for any change in the weighting of the OPC. Next, possible modification in the position of alternatives on changing the weight of INC, set by the decision group at 31.25%, was analyzed. The intersection point between alternatives ALT A and ALT C was marked by pink lines. A switch in the ranking of alternatives ALT A and ALT C took place for weightings lower than 24.70%. This would mean a decrease higher than 20.96% in the weighting of the criterion. The decision group considered this decrease too high, and so a switch in the ranking was not feasible. In the case of the criterion RIW, which had a current weighting of 6.25%, it can be reviewed in Figure 16c that the classification of alternatives never switched. The weight of the criterion impact of the unavailability of the supply devices of medicinal gases on hospital activity was 43.75%, and the intersection point between ALT A and ALT B occurred when the weighting was 49.70% (see Figure 16d). Although this weighting was compatible with the judgements provided by the group of experts, they considered that because of the criticality of these systems, an increase of more than 13.60%, which would be necessary for a switch in the ranking of alternatives, would not be feasible.
Thus, the decision group considered that variation in the ranking from ALT A to another alternative was not possible; therefore, the model was considered robust. Another analysis was performed on the supply device of medicinal oxygen and reached the same conclusion.
In the case of the sensitivity analysis of the FAHP model carried out on the medicinal oxygen supply device, the conclusion was that no increase in the weightings of IUA led to an alteration in the results. However, when the weighting of IUA decreased 3.90%, the alternative selected would be ALT A. Although this decrease was small, it was not considered as a possible value by the expert group. When INC increased by 7.14%, a similar exchange occurred in the classification of alternatives. This increase was, however, considered too large and, therefore, not feasible by the decision group. For the criterion OPC, an increase of 45.45% in the weighting of this criterion could change the result and make ALT A the selected alternative, but this increase was so high that it was not held to be possible; in no case could a decrease in the weighting of this criterion lead to a change in the classification. Any kind of increase or decrease in the weight of RIW could not lead to any alteration in the ordering of alternatives. Therefore, the model was considered robust by the decision group.

6. Conclusions

Medicinal gas supply devices have high criticality, as they provide resources used by other systems in direct contact with patients, for example, in operating theatres, neonatology, pediatric services, dialysis, radiology, casualty, etc.
Despite this high criticality, there was no previous research that analyzed optimization of these noncare systems. Such optimization would guarantee sustainability of care, minimize consumption of resources, and ensure a greater quality of care.
This study, therefore, described multicriteria models, built with the MACBETH approach and FAHP, and included a number of improvement alternatives based on modelling by continuous-time Markov chains. The models proposed combined continuous-time Markov chains and considered different improvement alternatives over the original design of the devices.
The result was a full ranking analysis of the alternatives considered for each system. The results from the MACBETH approach model for the medicinal oxygen supply system showed that it would be best to duplicate the external supply, with a global score of 57.50, while that of retaining a single source was close, with a score of 56.93. The cost of installing a second supply line would be €150,000, but the availability would improve to a maximum value of 1. The ability to avoid serious consequences that might result from having only one such connection for a considerable period of time, despite the emergency racks, confirmed the need to introduce the alternative suggested by the multicriteria model.
For the nitrous oxide and medicinal air supply systems, it is recommended, by means of the MACBETH approach model, that they continue as they currently are with a single supply line, with an overall score of 61.23 as opposed to 41.88 with duplication of the supply. Although the availability of these systems would reach the value 1 if a second supply line was installed, the impact of these systems on quality of care was less than for the other systems analyzed; therefore, no further improvement action need be taken. Nonetheless, the study guarantees suitability of the decisions taken up to now for these systems.
Similar results were obtained from the FAHP-based model, which included doubts, uncertainties, and hesitations in the judgements provided by the group. The Buckley method was used in the application of FAHP to guarantee the accuracy of the priorities obtained and to avoid losing information in the results.
This research is aimed at improving, as its end goal, the quality of care in devices not devoted directly to care. Therefore, the implications for quality of care of maintaining the original design, and of introducing the alternative suggested by the multicriteria models, are compared. It should also be noted that the study was carried out on real working devices in a Spanish hospital; this real case study can ensure viability of the methodology used and the ease with which suitable results may be obtained and particularized for any kind and size of health care organizations. The models, criteria, descriptors, or alternatives included, then, should be useful for other hospitals with similar aims.
In future research it will be necessary to review the criteria used in the model and consider introducing new criteria. It will also be necessary to update the judgements of the decision group because of changes in personnel in certain positions as well as changes in the hospital environment regarding costs and care requirements. It would, likewise, be interesting to include new feasible alternatives from the hospital maintenance service such as outsourcing the service.

Author Contributions

M.C.C. and A.G. conceived and designed the research and reviewed the results and research content of the MACBETH model. M.C.C. edited and revised the manuscript and carried out the fuzzy AHP model. A.G. performed the acquisition and analysis of data.

Funding

This research received no external funding.

Conflicts of Interest

The authors declare no conflict of interest.

References

  1. Domínguez-Gil, A. Gases medicinales, nuevos medicamentos. Farm. Hosp. 2005, 29, 300–302. [Google Scholar] [CrossRef]
  2. Alonso, F. NTP 630: Riesgo de incendio y explosión en atmósferas sobreoxigenadas; Instituto nacional de Seguridad e Higiene en el Trabajo: Madrid, Spain, 2003. [Google Scholar]
  3. Linde. Available online: https://www.linde-healthcare.es/es/products_and_services/products_and_services_by_category/medical_gases (accessed on 9 April 2019).
  4. Asociación Ingeniería Hospitalaria (AIEH); Sociedad Farmacia Hospitalaria (SEFH); Asociación Fabricantes Gases Medicinales (AFGM). Procedimiento de gestión de gases medicinales Estándares de calidad de gases medicinales en el ámbito hospitalario, 2nd ed.; Farmacia Hospitalaria, Fabricantes de Gases Medicinales, Ingeniería Hospitalaria: Madrid, Spain, 2018. [Google Scholar]
  5. Hayashi, K. Multicriteria analysis for agricultural resource management: A critical survey and future perspectives. Eur. J. Oper. Res. 2000, 122, 486–500. [Google Scholar] [CrossRef]
  6. Gregory, R.; Failing, L.; Harstone, M.; Long, G.; McDaniels, T.; Ohlson, D. Structured Decision Making: A Practical Guide to Environmental Management Choices. John Wiley & Sons: Chichester, UK, 2012. [Google Scholar]
  7. Diaby, V.; Campbell, K.; Goeree, R. Multi-criteria decision analysis (MCDA) in health care: A bibliometric analysis. Oper. Res. Health Care 2013, 2, 20–24. [Google Scholar] [CrossRef]
  8. Thokala, P.; Devlin, N.; Marsh, K.; Baltussen, R.; Boysen, M.; Kalo, Z.; Longrenn, T.; Mussen, F.; Peacock, S.; Watkins, J.; et al. Multiple criteria decision analysis for health care decision making & An Introduction: Report 1 of the ISPOR MCDA emerging Good Practices task force. Value Health 2014, 19, 1–13. [Google Scholar]
  9. Majumder, M. Impact of Urbanization on Water Shortage in Face of Climatic Aberrations; Springer: New York, NY, USA, 2015. [Google Scholar]
  10. Kumar, A.; Sah, B.; Singh, A.R.; Deng, Y.; He, X.; Kumar, P.; Bansal, R.C. A review of multi criteria decision making (MCDM) towards sustainable renewable energy development. Renew. Sustain. Energy Rev. 2017, 69, 596–609. [Google Scholar] [CrossRef]
  11. Gómez, A.; Carnero, M.C. Decision Support System for maintenance policy optimization in medicinal gases subsystems. Ifac-Pap. 2016, 49, 268–273. [Google Scholar]
  12. Bevilacqua, M.; Braglia, M. The analytic hierarchy process applied to maintenance strategy selection. Reliab. Eng. Syst. Safe 2000, 70, 71–83. [Google Scholar] [CrossRef]
  13. Emblemsvag, J.; Tonning, L. Decision support in selecting maintenance organization. J. Qual. Maint. Eng. 2003, 9, 11–24. [Google Scholar] [CrossRef] [Green Version]
  14. Bertolini, M.; Bevilacqua, M. A combined goal programming-AHP approach to maintenance selection problem. Reliab. Eng. Syst. Safe 2006, 91, 839–848. [Google Scholar] [CrossRef]
  15. Shyjith, K.; Ilangkumaran, M.; Kumanan, S. Multi-criteria decision-making approach to evaluate optimum maintenance strategy in textile industry. J. Qual. Maint. Eng. 2008, 14, 375–386. [Google Scholar] [CrossRef]
  16. Ahmadi, A.; Gupta, S.; Karim, R.; Kumar, U. Selection of maintenance strategy for aircraft systems using multi-criteria decision making methodologies. Int. J. Reliab. Qual. Saf. Eng. 2010, 17, 223–243. [Google Scholar] [CrossRef]
  17. Ishizaka, A.; Nemery, P. Assigning machines to incomparable maintenance strategies with ELECTRE-SORT. Omega-Int. J. Manag. 2014, 47, 45–59. [Google Scholar] [CrossRef] [Green Version]
  18. Goossens, A.J.M.; Basten, R.J.I. Exploring maintenance policy selection using the Analytic Hierarchy Process; An application for naval ships. Reliab. Eng. Syst. Safe 2015, 142, 31–41. [Google Scholar] [CrossRef] [Green Version]
  19. Shafiee, M. Maintenance strategy selection problem: An MCDM overview. J. Qual. Maint. Eng. 2015, 21, 378–402. [Google Scholar] [CrossRef]
  20. Parmar, M.; Soni, M.; Patidar, S. Selection of Plant Maintenance Strategy and Performance Enhancement of a Wire Manufacturing Industry using AHP. Int. J. Res. Aeronaut. Mech. Eng. 2016, 4, 81–85. [Google Scholar]
  21. Al-Najjar, B.; Alsyouf, I. Selecting the most efficient maintenance approach using fuzzy multiple criteria decision making. Int. J. Prod. Econ. 2003, 84, 85–100. [Google Scholar] [CrossRef]
  22. Ghosh, D.; Roy, S. A decision-making framework for process plant maintenance. Eur. J. Ind. Eng. 2010, 4, 78–98. [Google Scholar] [CrossRef]
  23. Ilangkumaran, M.; Kumanan, S. Selection of maintenance policy for textile industry using hybrid multi-criteria decision making approach. J. Manuf. Technol. Manag. 2009, 20, 1009–1022. [Google Scholar] [CrossRef]
  24. Aslam-Zainudeen, N.; Labib, A. Practical application of the Decision Making Grid (DMG). J. Qual. Maint. Eng. 2011, 17, 138–149. [Google Scholar] [CrossRef]
  25. Chan, F.T.S.; Prakash, A. Maintenance policy selection in manufacturing firms using the fuzzy MCDM approach. Int. J. Prod. Res. 2012, 50, 7044–7056. [Google Scholar] [CrossRef]
  26. Fouladgar, M.M.; Yazdani-Chamzini, A.; Lashgari, A.; Zavadskas, E.K.; Turskis, Z. Maintenance strategy selection using AHP and COPRAS under fuzzy environment. Int. J. Strateg. Prop. Manag. 2012, 16, 85–104. [Google Scholar] [CrossRef]
  27. Sadeghi, A.; Manesh, R.A. The Application of Fuzzy Group Analytic Network Process to Selection of Best Maintenance Strategy—A Case Study in Mobarakeh Steel Company, Iran. Procedia Soc. Behav. Sci. 2012, 62, 1378–1383. [Google Scholar] [CrossRef]
  28. Kirubakaran, B.; Ilangkumaran, M. Selection of optimum maintenance strategy based on FAHP integrated with GRA–TOPSIS. Ann. Oper. Res. 2016, 245, 285–313. [Google Scholar] [CrossRef]
  29. Azadeh, A.; Abdolhossein, S. An integrated fuzzy analytic hierarchy process and fuzzy multiple-criteria decision-making simulation approach for maintenance policy selection. Simulation 2016, 92, 3–18. [Google Scholar] [CrossRef]
  30. Tajadod, M. A Comparison of Multi-Criteria Decision Making Approaches for Maintenance Strategy Selection (A Case Study). Int. J. Strateg. Decis. Sci. 2016, 7, 51–69. [Google Scholar] [CrossRef] [Green Version]
  31. Danner, M.; Hummel, J.M.; Volz, F.; van Manen, J.G.; Wiegard, B.; Dintsios, C.M.; Bastian, H.; Gerber, A.; IJzerman, M.J. Integrating patients’ views into health technology assessment: Analytic hierarchy process (AHP) as a method to elicit patient preferences. Int. J. Technol. Assess. Health Care 2011, 27, 369–375. [Google Scholar] [CrossRef]
  32. Radaelli, G.; Lettieri, E.; Masella, C.; Merlino, L.; Strada, A.; Tringali, M. Implementation of EUnetHTA core models in Lombardia: The VTS framework. Int. J. Technol. Assess. Health Care 2014, 30, 105–112. [Google Scholar] [CrossRef]
  33. Taghipour, S.; Banjevic, D.; Jardine, A.K.S. Prioritization of medical equipment for maintenance decisions. J. Oper. Res. Soc. 2011, 62, 1666–1687. [Google Scholar] [CrossRef]
  34. Carnero, M.C.; Gómez, A. A multicriteria decision making approach applied to improving maintenance policies in healthcare organizations. Bmc Med. Inf. Decis. Mak. 2016. [Google Scholar] [CrossRef]
  35. Marciano, F.; Rossi, D.; Cabassa, P.; Cocca, P. Analytic Hierarchy Process to support ergonomic evaluation of ultrasound devices. Ifac-Pap. 2018, 51, 328–333. [Google Scholar] [CrossRef]
  36. Joshi, V.; Lee, K.; Melson, D.; Narra, V.R. Empirical Investigation of Radiologists’ Priorities for PACS Selection: An Analytical Hierarchy Process Approach. J. Digit. Imaging 2011, 24, 700–708. [Google Scholar] [CrossRef]
  37. Pecchia, L.; Martin, J.L.; Ragozzino, A.; Vanzanella, C.; Scognamiglio, A.; Mirarchi, L.; Morgan, S.P. User needs elicitation via analytic hierarchy process (AHP). A case study on a Computed Tomography (CT) scanner. Bmc Med. Inf. Decis. Mak. 2013, 13, 2. [Google Scholar] [CrossRef]
  38. Ivlev, I.; Vacek, J.; Kneppo, P. Multi-criteria decision analysis for supporting the selection of medical devices under uncertainty. Eur. J. Oper. Res 2015, 247, 216–228. [Google Scholar] [CrossRef]
  39. Agapova, M.; Bresnahan, B.W.; Linnau, K.F.; Garrison, L.P.; Higashi, M.; Kessler, L.; Devine, B. Using the Analytic Hierarchy Process for Prioritizing Imaging Tests in Diagnosis of Suspected Appendicitis. Acad. Radiol. 2017, 24, 530–537. [Google Scholar] [CrossRef]
  40. Lasorsa, I.; Padoano, E.; Marceglia, S.; Accardo, A. Multi-criteria decision analysis for the assessment of non-clinical hospital services: Methodology and case study. Oper. Res. Health Care 2018, in press. [Google Scholar] [CrossRef]
  41. Houria, B.; Besbes, Z.; Elaoud, M.; Masmoudi, B.; Masmoudi, M.F. Maintenance strategy selection for medical equipments using fuzzy multiple criteria decision making approach. In Proceedings of the 45th International Conference on Computers and Industrial Engineering, Metz, France, 28–30 October 2015. [Google Scholar]
  42. Öztürk, N.; Tozan, H. A Fuzzy-Based Decision Support Model for Selecting the Best Dialyser Flux in Haemodialysis. J. Healthc. Eng. 2015, 6, 303–324. [Google Scholar] [CrossRef]
  43. Jamshidi, S.A.; Rahimi, D.; Ait-kadi, A.; Ruiz, A. Comprehensive fuzzy risk-based maintenance framework for prioritization of medical devices. Appl. Soft. Comput. 2015, 32, 322–334. [Google Scholar] [CrossRef]
  44. Ozsahin, D.U.; Uzun, B.; Musa, M.S.; Şentürk, N.; Nurçin, F.V.; Ozsahin, I. Evaluating nuclear medicine imaging devices using fuzzy PROMETHEE method. Procedia Comput. Sci. 2017, 120, 699–705. [Google Scholar] [CrossRef]
  45. Cagri, A. Real options valuation of an IoT based healthcare device with interval Type-2 fuzzy numbers. Socio-Econ. Plan. Sci. 2019, in press. [Google Scholar]
  46. Guenther, R.; Vittori, G. Sustainable Healthcare Architecture, 1st ed.; John Wiley & Sons, Inc.: Hoboken, NJ, USA, 2008. [Google Scholar]
  47. Zamarrón-Mieza, I.; Yepes, V.; Moreno-Jiménez, J.M.A. Systematic review of application of multi-criteria decision analysis for aging-dam management. J. Clean. Prod. 2017, 147, 217–230. [Google Scholar] [CrossRef]
  48. Huang, I.B.; Keisler, J.; Linkov, I. Multi-criteria decision analysis in environmental sciences: Ten years of applications and trends. Sci. Total Environ. 2011, 409, 3578–3594. [Google Scholar] [CrossRef]
  49. Carnero, M.C. MCDA Techniques in Maintenance Policy Selection. In Encyclopedia of Business Analytics and Optimization; Wang, J., Ed.; IGI Gobal: Hershey, PA, USA, 2014; pp. 406–415. [Google Scholar]
  50. Bana e Costa, C.A.; Vansnick, J.C. Applications of the MACBETH approach in the framework of an additive aggregation model. J. Multi-Criteria Decis. Anal. 1997, 6, 107–114. [Google Scholar] [CrossRef]
  51. Bana e Costa, C.A.; Ensslin, L.; Correa, E.C.; Vansnick, J.C. Decision Support System in action: Integrated application in a multicriteria decision aid process. Eur. J. Oper. Res. 1999, 113, 315–335. [Google Scholar] [CrossRef]
  52. Bana e Costa, C.A.; De Corte, J.M.; Vansnick, J.C. MACBETH. Int. J. Inf. Technol. Decis. Mak. 2012, 11, 359–387. [Google Scholar] [CrossRef]
  53. Bana e Costa, C.A.; De Corte, J.M.; Vansnick, J.C. MACBETH. User’s guide. 2005. Available online: http://m-macbeth.com/wp-content/uploads/2017/10/M-MACBETH-Users-Guide.pdf (accessed on 24 March 2019).
  54. Bana e Costa, C.A.; Chagas, M.P. A career choice problem: An example of how to use MACBETH to build a quantitative value model based on qualitative value judgments. Eur. J. Oper. Res. 2004, 153, 323–331. [Google Scholar] [CrossRef]
  55. Zadeh, L.A. Fuzzy sets. Inf. Control 1965, 8, 338–353. [Google Scholar] [CrossRef] [Green Version]
  56. Cebeci, U. Fuzzy AHP-based decision support system for selecting ERP systems in textile industry by using balanced scorecard. Expert Syst. Appl. 2009, 36, 8900–8909. [Google Scholar] [CrossRef]
  57. Liang, X.; Zhao, X.; Wang, M.; Li, Z. Small and Medium-Sized Enterprises Sustainable Supply Chain Financing Decision Based on Triple Bottom Line Theory. Sustainability 2018, 10, 4242. [Google Scholar] [CrossRef]
  58. Chang, D.Y. Applications of the extent analysis method on fuzzy AHP. Eur. J. Oper. Res. 1996, 95, 649–655. [Google Scholar] [CrossRef]
  59. Van Laarhoven, P.J.M.; Pedrycz, W. A fuzzy extension of Saaty’s priority theory. Fuzzy Sets Syst. 1983, 11, 229–241. [Google Scholar] [CrossRef]
  60. Buckley, J.J. Fuzzy hierarchical analysis. Fuzzy Sets Syst. 1985, 17, 233–247. [Google Scholar] [CrossRef]
  61. Wang, Y.M.; Elhag, T.M.S.; Hua, Z.S. A modified fuzzy logarithmic least squares method for fuzzy analytic hierarchy process. Fuzzy Sets Syst. 2006, 15, 055–3071. [Google Scholar] [CrossRef]
  62. Xu, R. Fuzzy least-squares priority method in the analytic hierarchy process. Fuzzy Sets Syst. 2000, 112, 359–404. [Google Scholar] [CrossRef]
  63. Csutora, R.; Buckley, J.J. Fuzzy hierarchical analysis: The lambda-max method. Fuzzy Sets Syst. 2001, 120, 181–195. [Google Scholar] [CrossRef]
  64. Jenatabadi, H.S.; Babashamsi, P.; Yusoff, N.I. The Combination of a Fuzzy Analytical Hierarchy Process and the Taguchi Method to Evaluate the Malaysian Users’ Willingness to Pay for Public Transportation. Symmetry 2016, 8, 90. [Google Scholar] [CrossRef]
  65. Bozbura, F.T.; Beskese, A.; Kahraman, C. Prioritization of human capital measurement indicators using fuzzy AHP. Expert Syst. Appl. 2007, 32, 1100–1112. [Google Scholar] [CrossRef]
  66. Isaai, M.T.; Kanani, A.; Tootoonchi, M.; Afzali, H.R. Intelligent timetable evaluation using fuzzy AHP. Expert Syst. Appl. 2011, 38, 3718–3723. [Google Scholar] [CrossRef]
  67. Cheng, C.H. Evaluating naval tactical missile systems by fuzzy AHP based on the grade value of membership function. Eur. J. Oper. Res. 1996, 96, 343–350. [Google Scholar] [CrossRef]
  68. Zhu, K.J.; Jing, Y.; Chang, D.Y. A discussion on Extent Analysis Method and applications of fuzzy AHP. Eur. J. Oper. Res. 1999, 116, 450–456. [Google Scholar] [CrossRef]
  69. Wang, Y.M.; Luo, Y.; Hua, Z. On the extent analysis method for fuzzy AHP and its applications. Eur. J. Oper. Res. 2008, 186, 735–747. [Google Scholar] [CrossRef]
  70. SeongKon, L.; Gento, M.; SangKon, L.; JongWook, K. Prioritizing the weights of hydrogen energy Technologies in the sector of the hydrogen economy by using a fuzzy AHP approach. Int. J. Hydrog. Energy 2011, 36, 1897–1902. [Google Scholar]
  71. Park, K.S.; Seo, Y.J.; Kim, A.R.; Ha, M.H. Ship Acquisition of Shipping Companies by Sale & Purchase Activities for Sustainable Growth: Exploratory Fuzzy-AHP Application. Sustainability 2018, 10, 1763. [Google Scholar] [CrossRef]
  72. Opricovic, S.; Tzeng, G.H. Defuzzification within a multicriteria decision model. Int. J. Uncertain. Fuzziness Knowl. -Based Syst. 2003, 11, 635–652. [Google Scholar] [CrossRef]
  73. Chang, T.H.; Wang, T.C. Using the fuzzy multi-criteria decision making approach for measuring the possibility of successful knowledge management. Inf. Sci. 2009, 179, 355–370. [Google Scholar] [CrossRef]
  74. Saaty, T.L. The Analytic Hierarchy Process; McGraw Hill: New York, NY, USA, 1980. [Google Scholar]
  75. Saaty, T.L. Decision Making with Dependence and Feedback: The Analytic Network Process; RWS Publications: Pittsburgh, PA, USA, 2001. [Google Scholar]
  76. Meixner, O. Fuzzy AHP Group Decision Analysis and its Application for the Evaluation of Energy Sources. In Proceedings of the 10th International Symposium on the Analytic Hierarchy/Network Process, Pittsburgh, PA, USA, 29 July–1 August 2009. [Google Scholar]
  77. CEI IEC 61165:2006. Application of Markov Techniques; International Electrotechnical Commission (IEC): Geneva, Switzerland, 2006. [Google Scholar]
  78. Creus, A. Fiabilidad y Seguridad, 2nd ed.; Marcombo S.A.: Barcelona, Spain, 2005. [Google Scholar]
  79. Kaufman, A. Methods and Models of Operations Research; Prentice-Hall: Englewood Cliffs, NJ, USA, 1963. [Google Scholar]
  80. Hillier, F.; Lieberman, G. Introduction to Operations Research; McGraw-Hill Science: New York, NY, USA, 2002. [Google Scholar]
  81. Haigh, J. Probability Models; Springer-Verlag Limited: London, UK, 2002. [Google Scholar]
  82. Rojo, H.; Miranda, M. Investigación Operativa. Cadenas de Markov; Facultad de Ingeniería, Universidad de Buenos Aires: Buenos Aires, Argentina, 2009. [Google Scholar]
Figure 1. Flowchart of the measuring attractiveness by a categorical-based evaluation technique (MACBETH) approach.
Sustainability 11 02952 g001
Figure 2. Markov graph.
Sustainability 11 02952 g002
Figure 3. Markov graph for the power supply with a single source.
Sustainability 11 02952 g003
Figure 4. Markov graph of the power supply device with a reserve source.
Sustainability 11 02952 g004
Figure 5. Markov graph of the medicinal gas supply device with additional storage system.
Sustainability 11 02952 g005
Figure 6. MACBETH hierarchy.
Sustainability 11 02952 g006
Figure 7. Operating costs: (a) MACBETH judgement matrix with a quantitative scale; (b) value function.
Sustainability 11 02952 g007
Figure 8. Investment costs: (a) MACBETH judgement matrix with a qualitative scale; (b) value function.
Sustainability 11 02952 g008
Figure 9. Risk to workers: (a) MACBETH judgement matrix; (b) value function.
Sustainability 11 02952 g009
Figure 10. Impact of unavailability of the supply devices for medicinal gases on hospital activity: (a) MACBETH judgement matrix; (b) value function.
Sustainability 11 02952 g010
Figure 11. MACBETH judgement matrix.
Sustainability 11 02952 g011
Figure 12. The weightings obtained for the fundamental point of views (FPVs): (a) MACBETH judgement matrix, IUA = impact of unavailability, INC = investment costs, OPC = operating costs, and RIW = risk to workers; (b) bar chart.
Sustainability 11 02952 g012
Figure 13. Hierarchy structure to which the fuzzy analytic hierarchy process (FAHP) is applied.
Sustainability 11 02952 g013
Figure 14. Ranking of alternatives obtained with M-MACBETH for: (a) supply device of medicinal oxygen (MOSS); (b) medicinal nitrous oxide (MPNSS) and medicinal air (MASS) devices.
Sustainability 11 02952 g014
Figure 15. Ranking of alternatives obtained with FAHP for supply devices of medicinal oxygen (MOSS), medicinal nitrous oxide (MPNSS), and medicinal air (MASS).
Sustainability 11 02952 g015
Figure 16. Sensitivity analyses for the supply systems of medicinal nitrous oxide (MPNSS) and medicinal air (MASS): (a) Operating cost criterion; (b) Investment cost criterion; (c) Risk for workers criterion; and (d) Impact of the unavailability of the supply devices of medicinal gases on hospital activity.
Sustainability 11 02952 g016
Table 1. Fuzzy conversion scale.
Linguistic ScaleFuzzy ScaleFuzzy Reciprocal Scale
EI: Equally important 1 ˜ = ( 1 ,   1 , 1 ) (1, 1, 1)
EI-MI: Between equally and moderately more important 2 ˜ = ( 1 ,   2 , 3 ) (1/3, 1/2, 1)
MI: Moderately more important 3 ˜ = ( 2 ,   3 , 4 ) (1/4, 1/3, 1/2)
MI-SI: Between moderately and strongly more important 4 ˜ = ( 3 ,   4 , 5 ) (1/5, 1/4, 1/3)
SI: Strongly more important 5 ˜ = ( 4 ,   5 , 6 ) (1/6, 1/5, 1/4)
SI-VSI: Between strongly and very strongly more important 6 ˜ = ( 5 , 6 , 7 ) (1/7, 1/6, 1/5)
VSI: Very strongly more important 7 ˜ = ( 6 ,   7 , 8 ) (1/8, 1/7, 1/6)
VSI-EMI: Between very strongly and extremely more important 8 ˜ = ( 7 ,   8 , 9 ) (1/9, 1/8, 1/7)
EMI: Extremely more important 9 ˜ = ( 8 ,   9 , 9 ) (1/9, 1/9, 1/8)
Table 2. The fuzzy pairwise comparison matrix of criteria.
IUAINCOPCRIW
l i j m i j u i j l i j m i j u i j l i j m i j u i j l i j m i j u i j
IUA11112323434.5006
INC0.3330.5001.000111123234
OPC0.2500.3330.5000.3330.5001111123
RIW0.1670.2220.3330.2500.3330.5000.3330.5001111
Table 3. Fuzzy matrix of levels of scale of descriptor of OPC.
S15S14S13S12S11
l i j m i j u i j l i j m i j u i j l i j m i j u i j l i j m i j u i j l i j m i j u i j
S1511112324645646.59
S140.3330.5001111244456678
S130.1670.2500.5000.1670.2500.500111234246
S120.1670.2000.2500.1670.2000.2500.2500.3330.500111456
S110.1110.1540.2500.1250.1430.1670.1670.2500.5000.1670.2000.250111
Table 4. Weightings of descriptor scale levels.
CriteriaScale Levels r ˜ i Weights after Defuzzification and NormalizationConsistency Ratio (CR)
Extra annual human resource costs corresponding to the technical maintenance staff
OPCS15
S14
S13
S12
S11
r ˜ 1 = ( 2.000 ,   3.041 ,   3.959 )
r ˜ 2 = ( 1.741 ,   2.339 ,   3.104 )
r ˜ 3 = ( 0.644 ,   0.944 ,   1.431 )
r ˜ 4 = ( 0.488 ,   0.582 ,   0.715 )
r ˜ 5 = ( 0.208 ,   0.256 ,   0.349 )
w 1 = 0.414
w 2 = 0.328
w 3 = 0.141
w 4 = 0.080
w 5 = 0.037
0.091
Costs of setting up and starting the operation as a percentage of the cost of the existing facilities
INCS25
S24
S23
S22
S21
r ˜ 1 = ( 3.288 ,   3.936 ,   4.441 )
r ˜ 2 = ( 1.644 ,   2.112 ,   2.639 )
r ˜ 3 = ( 0.803 ,   1.000 ,   1.246 )
r ˜ 4 = ( 0.379 ,   0.474 ,   0.608 )
r ˜ 5 = ( 0.225 ,   0.254 ,   0.304 )
w 1 = 0.497
w 2 = 0.275
w 3 = 0.131
w 4 = 0.063
w 5 = 0.033
0.053
Existence of a level of risk and the need to take safety precautions
RIWS35
S34
S33
S32
S31
r ˜ 1 = ( 3.388 ,   3.936 ,   4.441 )
r ˜ 2 = ( 1.741 ,   2.141 ,   2.551 )
r ˜ 3 = ( 0.803 ,   1.000 ,   1.246 )
r ˜ 4 = ( 0.401 ,   0.491 ,   0.608 )
r ˜ 5 = ( 0.220 ,   0.242 ,   0.287 )
w 1 = 0.497
w 2 = 0.276
w 3 = 0.131
w 4 = 0.064
w 5 = 0.032
0.052
Weighted dependence level of other systems on the system analyzed
IUAS45
S44
S43
S42
S41
r ˜ 1 = ( 3.288 ,   3.936 ,   4.441 )
r ˜ 2 = ( 1.888 ,   2.290 ,   2.702 )
r ˜ 3 = ( 1.149 ,   1.332 ,   1.552 )
r ˜ 4 = ( 0.379 ,   0.429 ,   0.488 )
r ˜ 5 = ( 0.187 ,   0.194 ,   0.218 )
w 1 = 0.476
w 2 = 0.282
w 3 = 0.165
w 4 = 0.053
w 5 = 0.024
0.097
Table 5. Mean availability of devices for each alternative.
Device Alternatives
ALT AALT BALT C
MOSS0.996611
MPNSS0.996611
MASS0.996611
Table 6. Number of dependent systems as a function of the class of criticality (critical, important and normal) on the supply system of medicinal oxygen (MOSS) and medicinal nitrous oxide (MPNSS) and medicinal air (MASS) systems.
Number of Dependent Systems as a Function of the Class of Criticality for the HospitalMOSSMPNSSMASS
Critical systems91414
Important systems2300
Normal systems000
n i × w n i 825656
Table 7. Performance table for alternatives of the supply devices of medicinal oxygen (MOSS), medicinal nitrous oxide (MPNSS), and medicinal air (MASS).
AlternativesOPC (€)INCRIWIUA
Supply device of medicinal oxygen
ALT A0L1L382 × (1 − 0.9966) × 100 = 27.88
ALT B10,000L4L382 × (1 − 1) × 100 = 0
ALT C20,000L4L482 × (1 − 1) × 100 = 0
Supply device of medicinal nitrous oxide and medicinal air
ALT A0L1L356 × (1 − 0.9966) × 100 = 19.04
ALT B10,000L5L356 × (1 − 1) × 100 = 0
ALT C20,000L4L456 × (1 − 1) × 100 = 0
Table 8. Characteristics of the alternative applied in the hospital (left) and alternative proposed by the model (right) in the supply device of medicinal oxygen (MOSS).
DeviceAlternativeCostConsequences for Hospital ActivityMean AvailabilityAlternativeCostConsequences for Hospital ActivityMean Availability
MOSSALT A€0May involve severe consequences for the functioning of medical services over an acceptable period of time. Although, there are emergency racks with sufficient autonomy to address the requirements over a certain period of time.0.9966ALT B€150,000Guarantees the normal working of care services at all times.1

