Article

Biofuel Production and Phosphorus Recovery through an Integrated Treatment of Agro-Industrial Waste

1
Department of Environmental and Chemical Engineering, University of Calabria, Via P. Bucci cubo 44B, 87036 Arcavacata di Rende (CS), Italy
2
Department of Sustainability; Italian National Agency for New Technologies, Energy and Sustainable Economic Development (ENEA), P. Enrico Fermi 1, 80055 Portici (NA), Italy
3
Department of Engineering; University of Campania “Luigi Vanvitelli”, Via Roma 29, 81031 Aversa (CE), Italy
4
Department of Informatics, Modelling, Electronics and Systems Engineering, University of Calabria, Via P. Bucci cubo 39C, 87036 Arcavacata di Rende (CS), Italy
*
Author to whom correspondence should be addressed.
Sustainability 2019, 11(1), 52; https://doi.org/10.3390/su11010052
Submission received: 30 October 2018 / Revised: 16 December 2018 / Accepted: 18 December 2018 / Published: 21 December 2018
(This article belongs to the Special Issue Advances in Biorefining of Biowaste)

Abstract

:
The present study aimed to develop an integrated treatment of agro-industrial waste for biofuel (biogas and syngas) production and for phosphorus recovery. In the first step, an anaerobic digestion (AD) process was carried out on two different mixtures of raw agro-industrial residues. Specifically, a mixture of asparagus and tomato wastes (mixture-1) and a mixture of potatoes and kiwifruit residues (mixture-2) were investigated. The results proved that the properties of mixtures notably affect the evolution of the digestion process. Indeed, despite the lower organic load, the maximum biogas yield, of about 0.44 L/gCODremoved, was obtained for mixture-1. For mixture-2, the digestion process was hindered by the accumulation of acidity due to the lack of alkalinity in respect to the amount of volatile fatty acids. In the second step, the digestates from AD were utilized for syngas production using supercritical water gasification (SCWG) at 450 °C and 250 bar. Both the digestates were rapidly converted into syngas, which was mainly composed of H2, CO2, CH4, and CO. The maximum values of global gasification efficiency, equal to 56.5 g/kgCOD, and gas yield, equal to 1.8 mol/kgTS, were detected for mixture-2. The last step of the integrated treatment aimed to recover the phosphorus content, in the form of MgKPO4ˑ6H2O, from the residual liquid fraction of SCWG. The experimental results proved that at pH = 10 and Mg/P = 1 it is possible to obtain almost complete phosphorus removal. Moreover, by using the scanning electronic microscopy, it was demonstrated that the produced precipitate was effectively composed of magnesium potassium phosphate crystals.

1. Introduction

The identification of novel and suitable approaches for the exploitation of agro-industrial residues is an important environmental and economic issue [1,2,3]. In fact, these wastes are generally not properly disposed of, which causes severe damage to soils and aquatic systems [4,5,6,7]. Therefore, they often constitute a substantial source of pollution. On the other hand, many byproducts of agricultural activities have an enormous potential for energy production and for the recovery of valuable compounds [8,9,10]. Anaerobic digestion (AD) is a sustainable, environmentally friendly technology for organic residue exploitation. In anaerobic processes, the organic substrates are metabolized according to a series of sequential steps carried out by different microorganisms species that operate in the absence of dissolved oxygen at two typical temperature ranges, mesophilic (35–40 °C) or thermophilic (55–60 °C) [11]. As a consequence of these biological reactions, a valuable biogas is produced. AD is suitable to efficiently treat seasonal wastes and it can be applied in large facilities and small agricultural companies [12]. Indeed, many batch and continuous digesters with suspended and attached biomass, such as the completely-stirred tank reactor (CSTR), up-flow anaerobic sludge blanket (UASB), up-flow anaerobic filter, etc., have been used [11]. The processes efficiency, in addition to typical operating parameters (OLR: organic load rate, HRT: hydraulic retention time, etc.), is mainly affected by the characteristics of feedstock [11]. The co-digestion of various types of residues is an advantageous method to improve the performance of treatments [13,14,15,16]. In fact, by properly mixing different matrixes it is possible to obtain a mixture with adequate characteristics in terms of pH, COD/N/P ratio, alkalinity, etc. [13,14,15,16]. Therefore, it is very important to accurately select the type and the amount of waste to be mixed. Specific co-digestion tests must be carried out to verify the anaerobic degradability of the mixture to be treated.
Besides biogas, anaerobic processes produce a wet residue (digestate) with a remarkable pollutant load. Digestates are often used as organic fertilizers; however, this practice can cause soil deterioration due to their properties such as the high salinity and the potential presence of pathogenic microorganisms [17]. Moreover, spreading wet AD residues leads to the accumulation of nutrients in aquatic systems, and, thus, the eutrophication of water bodies [17]. Therefore, there is a need to develop appropriate technologies for the post-treatment of wet residues generated in anaerobic processes. In this regard, the supercritical wet gasification (SCWG) and the recovery of nutrients as struvite type compounds (MAP: magnesium ammonium phosphate; MPP: magnesium potassium phosphate) can be profitable approaches. In particular, SCWG exploits the organic matter content of biomass for biofuel production [18,19,20]. The process is performed at high temperature (300–600 °C) and pressure (210–400 bar) under supercritical water conditions [21,22,23]. The SCWG process could be schematized in two main stages: an early stage where there is the breakdown of macromolecules to smaller molecules and a second stage, similar to hydrocarbon steam reforming, composed of a water gas shift reaction and methanation reaction [24,25]. In SCWG, water becomes a real reagent for gasification reaction and it is also able to solubilize complex organic compounds. Therefore, this technology is particularly suitable for the treatment of wet residues such as digestates, which are characterized by remarkable levels of organic matter [26,27,28,29]. SCWG has significant advantages over traditional methods for the production of biofuels [30,31], such as higher energy, greater separation efficiency, and the possibility to eliminate the need to pre-dry the matrices [32,33]. Indeed, as demonstrated by previous works, the SCWG process, compared to the conventional technologies, has a great potential because it is a cost-effective process for the treatment of humid wastes and it is highly recommended for energy production from digestates [32,33].
Another advantage is that the liquid resulting from hydrothermal processes has a low amount of organic matter and it is completely sterilized, avoiding, in the case of digestates, the presence of pathogenic organisms such as bacteria and viruses [26,27]. After the SCWG stage, dimensioning ad hoc the CO2 removal section, it is possible to obtain a syngas containing only the molecules necessary for the synthesis of biofuels and/or chemicals such as synthetic natural gas (SNG), pure hydrogen, methanol, dimethyl ether etc. [22]. The gas production could notably change in response to the concentration and type of organic matter, as well as the water content of feedstock [34]. Therefore, there is a need to investigate the effects of waste properties on gasification performances.
The residual aqueous phase, depending on the waste type subjected to SCWG, could be characterized by a high level of nutrient compounds. In particular, the amount of phosphate could be much more remarkable than that of nitrogen compounds. Indeed, during the gasification reaction, depending on samples’ pH, the ammonium nitrogen could be converted into gaseous ammonia and recovered by means of neutralization in acid solutions. Instead, the phosphorus content remains both in the solid and liquid phase. Some works investigated the possibility of recovering the phosphorus amount from solid residue [35,36]. However, to the best of our knowledge, there is a lack of studies focused on the removal and recovery of P dissolved into the liquid phase of SCWG. In this regard, the precipitation of magnesium potassium phosphate hexahydrate (MPP, MgKPO4⋅6H2O) [37,38] can be considered a suitable and advantageous option. In fact, this process allows the P recovery in the form of one of the struvite-type compounds that are considered potential fertilizers [39,40,41,42,43,44]. MPP precipitation occurs when Mg2+, K+, and PO43− concentration overcomes the solubility product in an alkaline environment [37,38]. Generally, to promote the MPP formation, the pH correction and the addition of potassium and magnesium reactants is required [37,38], which increases the process costs. Therefore, the reduction of chemical consumption is a significant issue for practical applications [45,46,47,48]. Moreover, the operating conditions for the treatment of the residual liquid phase from SCWG treatment must be totally investigated. Indeed, no previous works were focused on this application.
In the present paper, in order to define a suitable method to efficiently exploit the agro-industrial residues, an integrated treatment based on AD, SCWG, and MPP precipitation has been developed. This treatment represents a new approach because there have not been published works combining all the above techniques. Through conducted experiments, the factors affecting the production of biogas, from co-digestion of agro-wastes, and of syngas, from gasification of digestate, were identified. Moreover, the application modality of MPP precipitation for the treatment of the liquid phase of SCWG was determined. In particular, this process, in comparison to conventional applications, guarantees a reduction of chemicals consumption.
The developed integrated treatment is advantageous because, in addition to biofuel production and recovery of a valuable phosphorus compound, it can obtain a residual effluent characterized by a very low amount of organic matter and nutrient compounds.

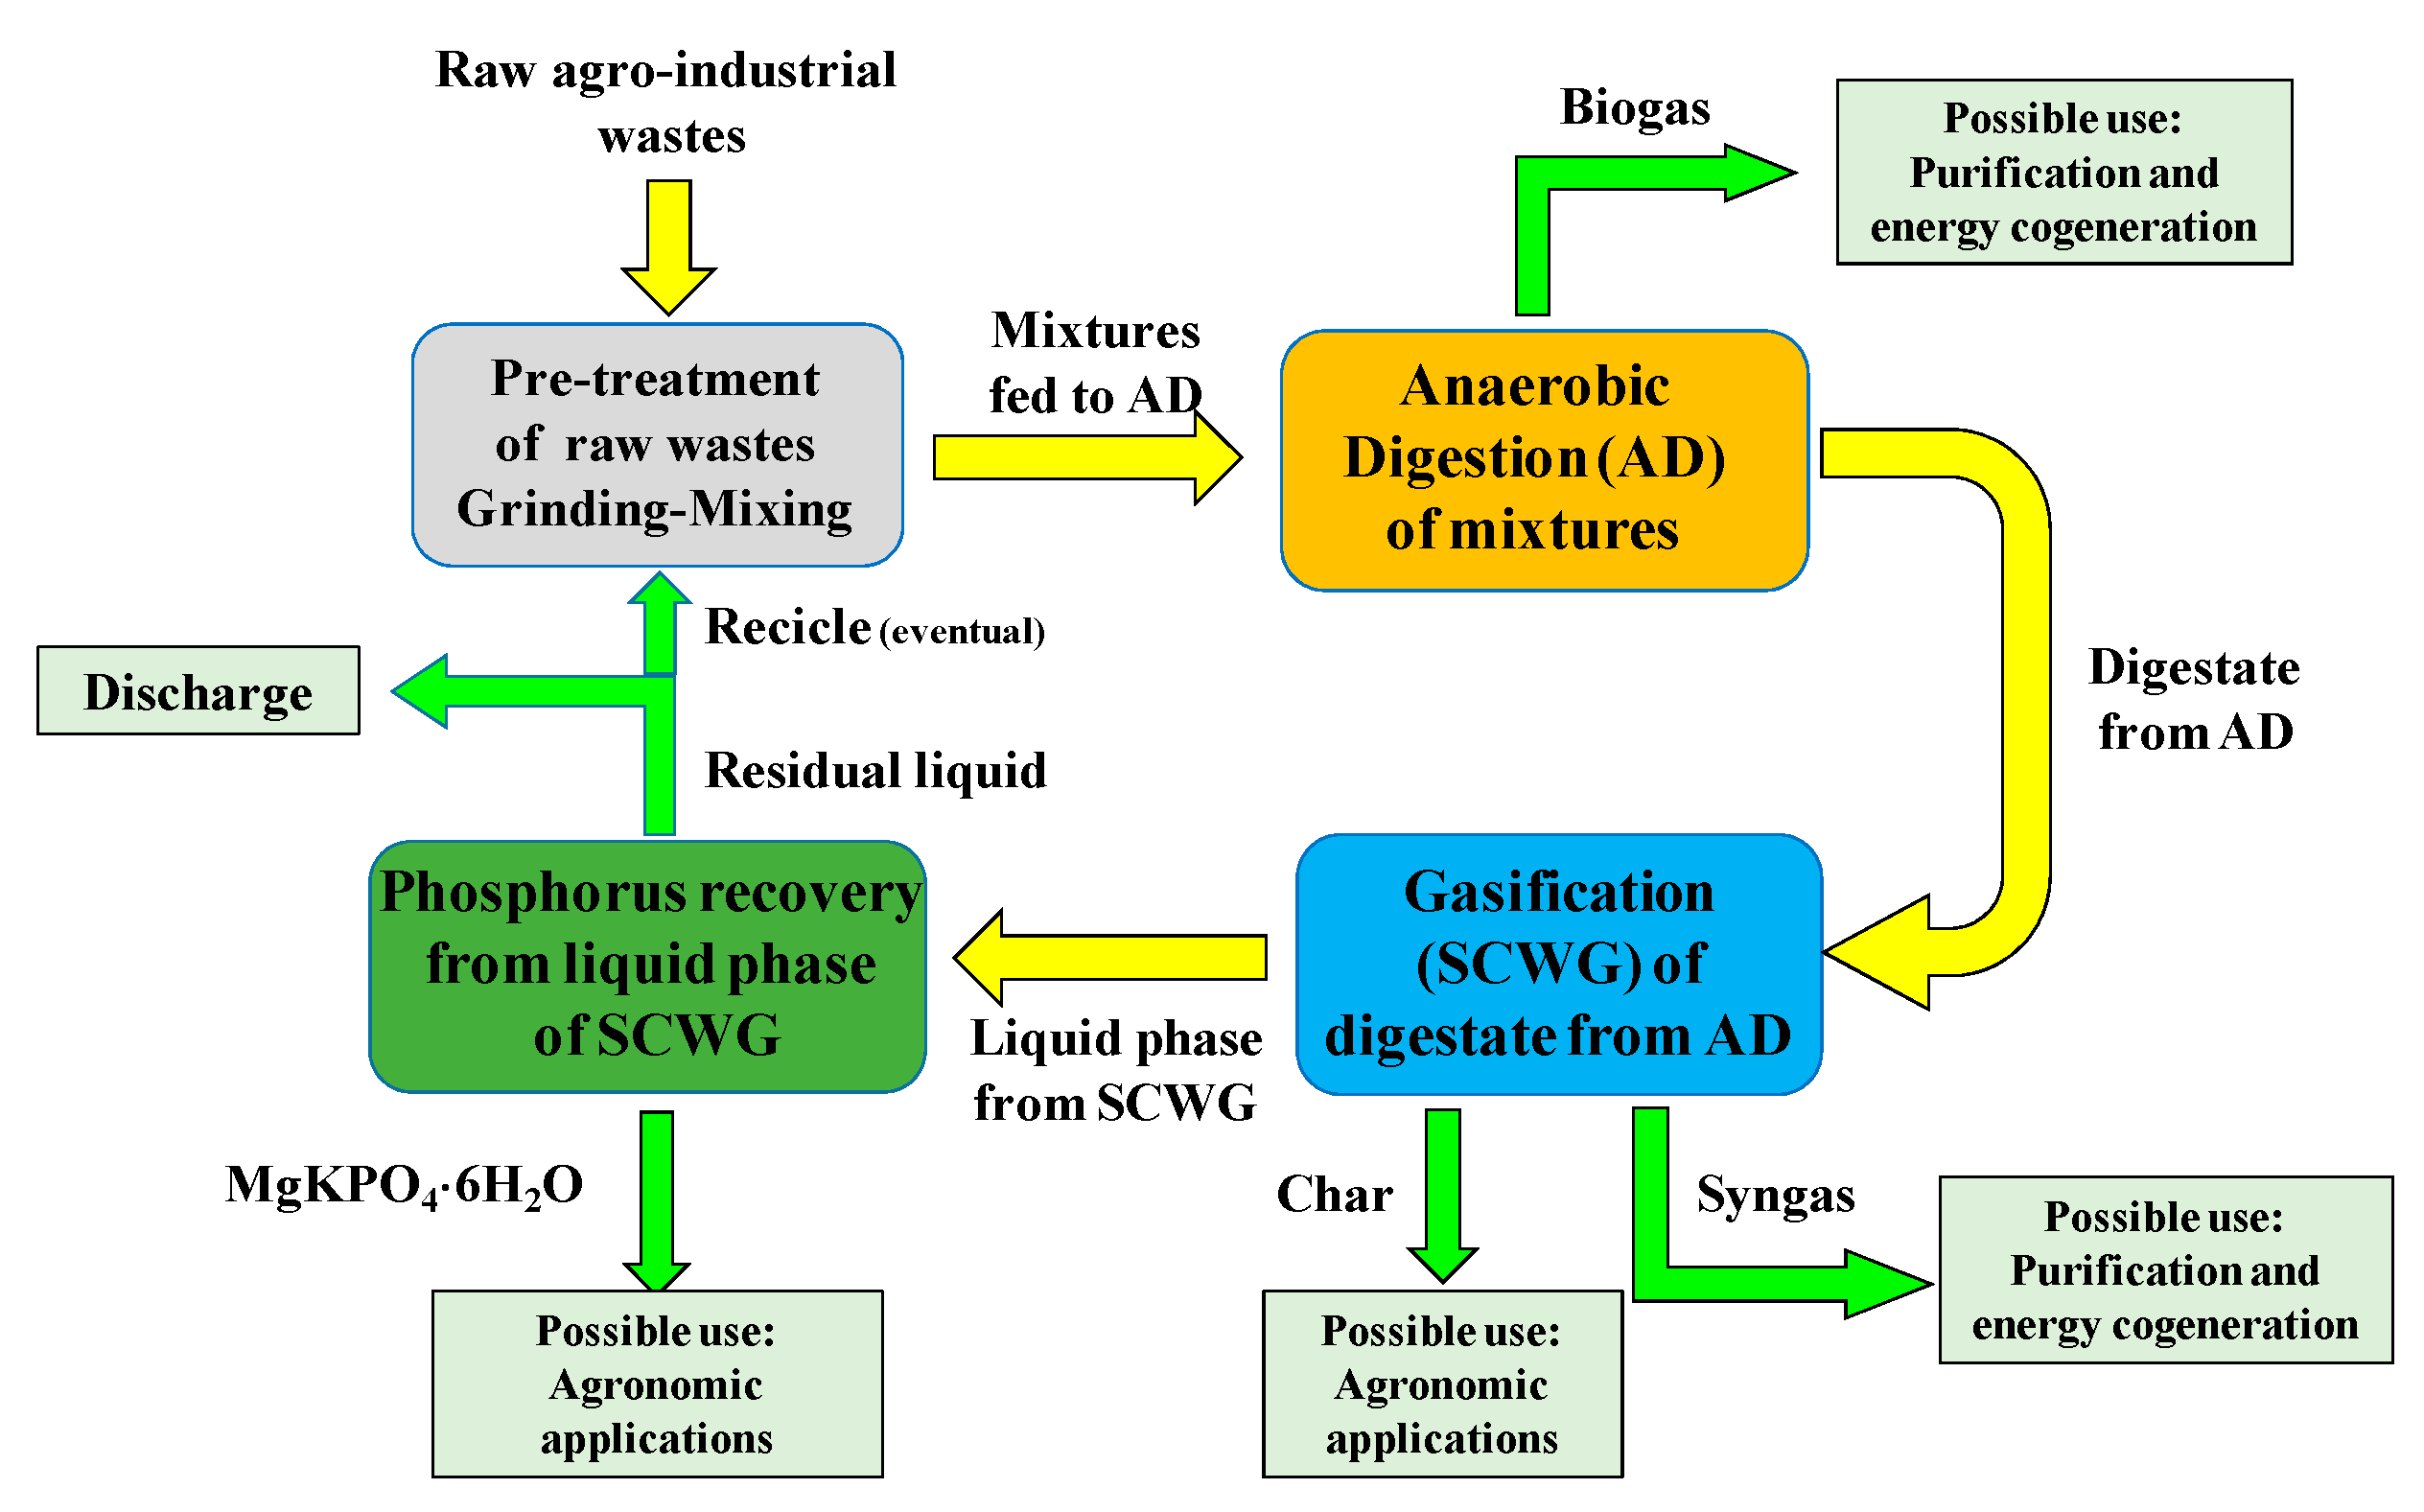
2. Materials and Methods

The first phase of research aimed to define a co-digestion process of agricultural residues of typical cultivations of Southern Italy. Subsequently, the digestates produced from the anaerobic processes have been treated by SCWG for syngas production. Finally, a precipitation process for the recovery of phosphors from SCWG residual liquid phase was developed. Figure 1 shows the scheme of the developed integrated treatment.

2.1. Co-Digestion Tests

The co-digestion tests were carried out by using four types of fruit and vegetable by-products. In particular, residues of tomatoes, potatoes, asparagus and kiwifruit were selected. Moreover, settled cattle manure and centrifuged activated sludge were exploited. The fruit and vegetable by-products were collected from an agro-industrial company located near Castrovillari (Calabria Region, Italy), the cattle manure was withdrawn from the storage tank of a cattle farm sited near Cosenza, while the activated sludge was taken from the recirculation line of the wastewater treatment plant of Lamezia Terme (Calabria Region, Italy). The six samples were stored in 15 L tanks at 4 °C.
Two different co-substrates mixtures were subjected to the digestion process. Specifically, a mixture with by-products of spring–summer vegetables, asparagus (30% w/w) and tomatoes (30% w/w) (mixture-1), and a mix with residues of summer–autumn cultivations, potatoes (30% w/w) and kiwifruit (30% w/w) (mixture-2), were prepared. Settled cattle manure (10% w/w), as an additional co-substrate, was added. The samples were ground with a commercial blender (SINOTECH,350 W) obtaining semi-fluid compounds. Afterward, centrifuged activated sludge (30% w/w), as inoculum, was added (Table 2). For each mixture, an overall amount of about 300 g was prepared to carry out the digestion tests (Table 2). In Figure 2 some aliquots of mixtures are shown. In order to avoid initial acidic conditions, which can block the start of the digestion process, the mixtures’ pH was set to around 7–7.5 using KHCO3. This compound was selected because it can also supply the potassium required for the subsequent treatment for phosphorus recovery. No further external compounds were added to control other operating parameters.
The digestion tests were conducted in batch mode in 1 L dark glass bottles. The containers were insulated with a sheath made of expanded polyethylene and equipped with hermetic closing caps, which were connected to volumetric gasometers by means of HDPE (high-density polyethylene) pipes.The bottles were fed with the prepared digestion test mixtures and flushed with N2 for 5 min to reach anaerobic conditions and then tightly closed and connected to gasometers. The bottles were mixed and temperature controlled at 35 °C using a heating magnetic stirrer (VELP AREX, 650 W), suitable for the mixing of concentrated wastes, provided with a bulb thermostat. The anaerobic digestion was carried out for 90 days for complete digestion of organics. The biogas production was monitored daily by measuring the liquid displacement into gasometers. The CH4 percentage was periodically detected after the neutralization of CO2 and other acid gases by means of NaOH beads. At the end of tests, the digested samples were completely characterized.

2.2. SCWG Reactor and Procedure for SCWG Tests

The SCWG process was carried out in a 450 mL tubular reactor (Parr Instrument Co., Moline, IL, USA) with an internal diameter of 25 mm, an external diameter of 48 mm, and a total length of 1120 mm. 150 mL of digestates from anaerobic digestion were used to carry out SCWG tests at 250 bar and at 450 °C for 50 min. The process parameters were monitored by means a manometer and a thermocouple for the temperature, which, in turn, controls the electrical heater. The autoclave was pressurized using syringe pump (Pump 500D, Teledyne Isco®, Lincoln, NB, USA). The syngas was quantified using a flow meter (GILMONT Instruments, Barrington, IL, USA) and analyzed in terms of composition every 3 min, through an on-line gas chromatograph (Hewlett Packard 6890, Palo Alto, CA, USA) equipped with a thermal conductivity detector. The global gasification efficiency (GGE) and the gas yield were calculated by means of the following equations:
GGE   ( g / kgCOD ) =   mass   of   syngas   ( g ) mass   of   organic   fed   ( kgCOD )
Gas   Yield   ( mol / kgTS ) =   mole   of   syngas   ( mol ) digestate   fed   ( kgTS )
After the SCWG tests, the remaining liquid samples were characterized with respect to their main physical–chemical parameters.

2.3. Precipitation Tests for Phosphorus Recovery

The residual aqueous phases from the SCWG treatment were subjected to a precipitation treatment to recover phosphorus in the form of magnesium potassium phosphate hexahydrate (MPP, MgKPO4⋅6H2O). In these tests, industrial grade MgCl2⋅6H2O was used as a magnesium source to promote the MPP formation. No feeding of potassium compounds was provided. Indeed, the initial KHCO3 addition to the mixtures subjected to digestion tests made the supply of further potassium sources for MPP generation unnecessary. The experiments were conducted to identify the optimal values of pH and reactant amounts. Specifically, Mg/P molar ratio (RMP) of 1, 1.2 and 1.4 and pH values of 9, 10, 11, and 12 were tested. Each test was performed in batch mode at room temperature (20–22 °C).
The reaction mixtures were prepared by adding proper volumes of a magnesium concentrated solution (1M) to 10 mL of liquid samples from SCWG, up to reach the stoichiometric ratios set for the experiments. After the reactant feeding, the pH was adjusted to the planned values by means of NaOH 0.5 N and HCl 0.1 N. The samples, placed in vials of 15 mL capacity, were stirred for 30 min at 150 rpm by using a rotary shaker. After the reaction time, the samples were left to settle for 30 min to allow the separation of the produced solid compounds. The liquid phases were withdrawn and filtered through a 0.45 μm filter before their chemical characterization. The precipitate recovered from the samples treatment was washed with deionized water, filtered, and dried at room temperature.

2.4. Analytical Methods

The salinity and pH were measured by bench instruments; total solids (TS) and volatile solids (VS) by weighing analysis after drying the samples at 105 °C and 550 °C, respectively; the chemical oxygen demand (COD) and alkalinity (ALK) by titrimetric methods; total Kjeldahl nitrogen (TKN) and ammonium nitrogen by Kjeldahl procedures; reactive phosphorus and sulfates by UV spectrophotometry; volatile fatty acids (VFA) by the distillation method, potassium, calcium, and magnesium by means of atomic adsorption spectrophotometry [49].The precipitate recovered from MPP precipitation tests was analyzed by scanning electron microscopy (SEM-EDS).
Measurements were executed three times, and the mean value was considered. The results of the efficiencies reported were representative of the actual removal or production of the compounds. Thus, the values were not affected by dilution because of reactant additions in the various processes.

3. Results and Discussion

The results of co-digestion, supercritical water gasification, and precipitation tests are reported and discussed in the following subsections.

3.1. Characterization of Agro-industrial Waste and Activated Sludge

The characteristics of different agro-industrial wastes and activated sludge are compiled in Table 1. The kiwifruit and tomato wastes showed lower pH values of 3.2 and 4.4, respectively. The potato and kiwifruit wastes had greater values of COD, TS, and VS. Moreover, these two residues, compared to asparagus and tomato wastes, were also characterized by higher values of the COD/N ratio (Table 1). To achieve the co-digestion mixtures, different proportions of agro-industrial wastes were mixed as discussed in the Materials and Methods section.

3.2. Co-Digestion Tests

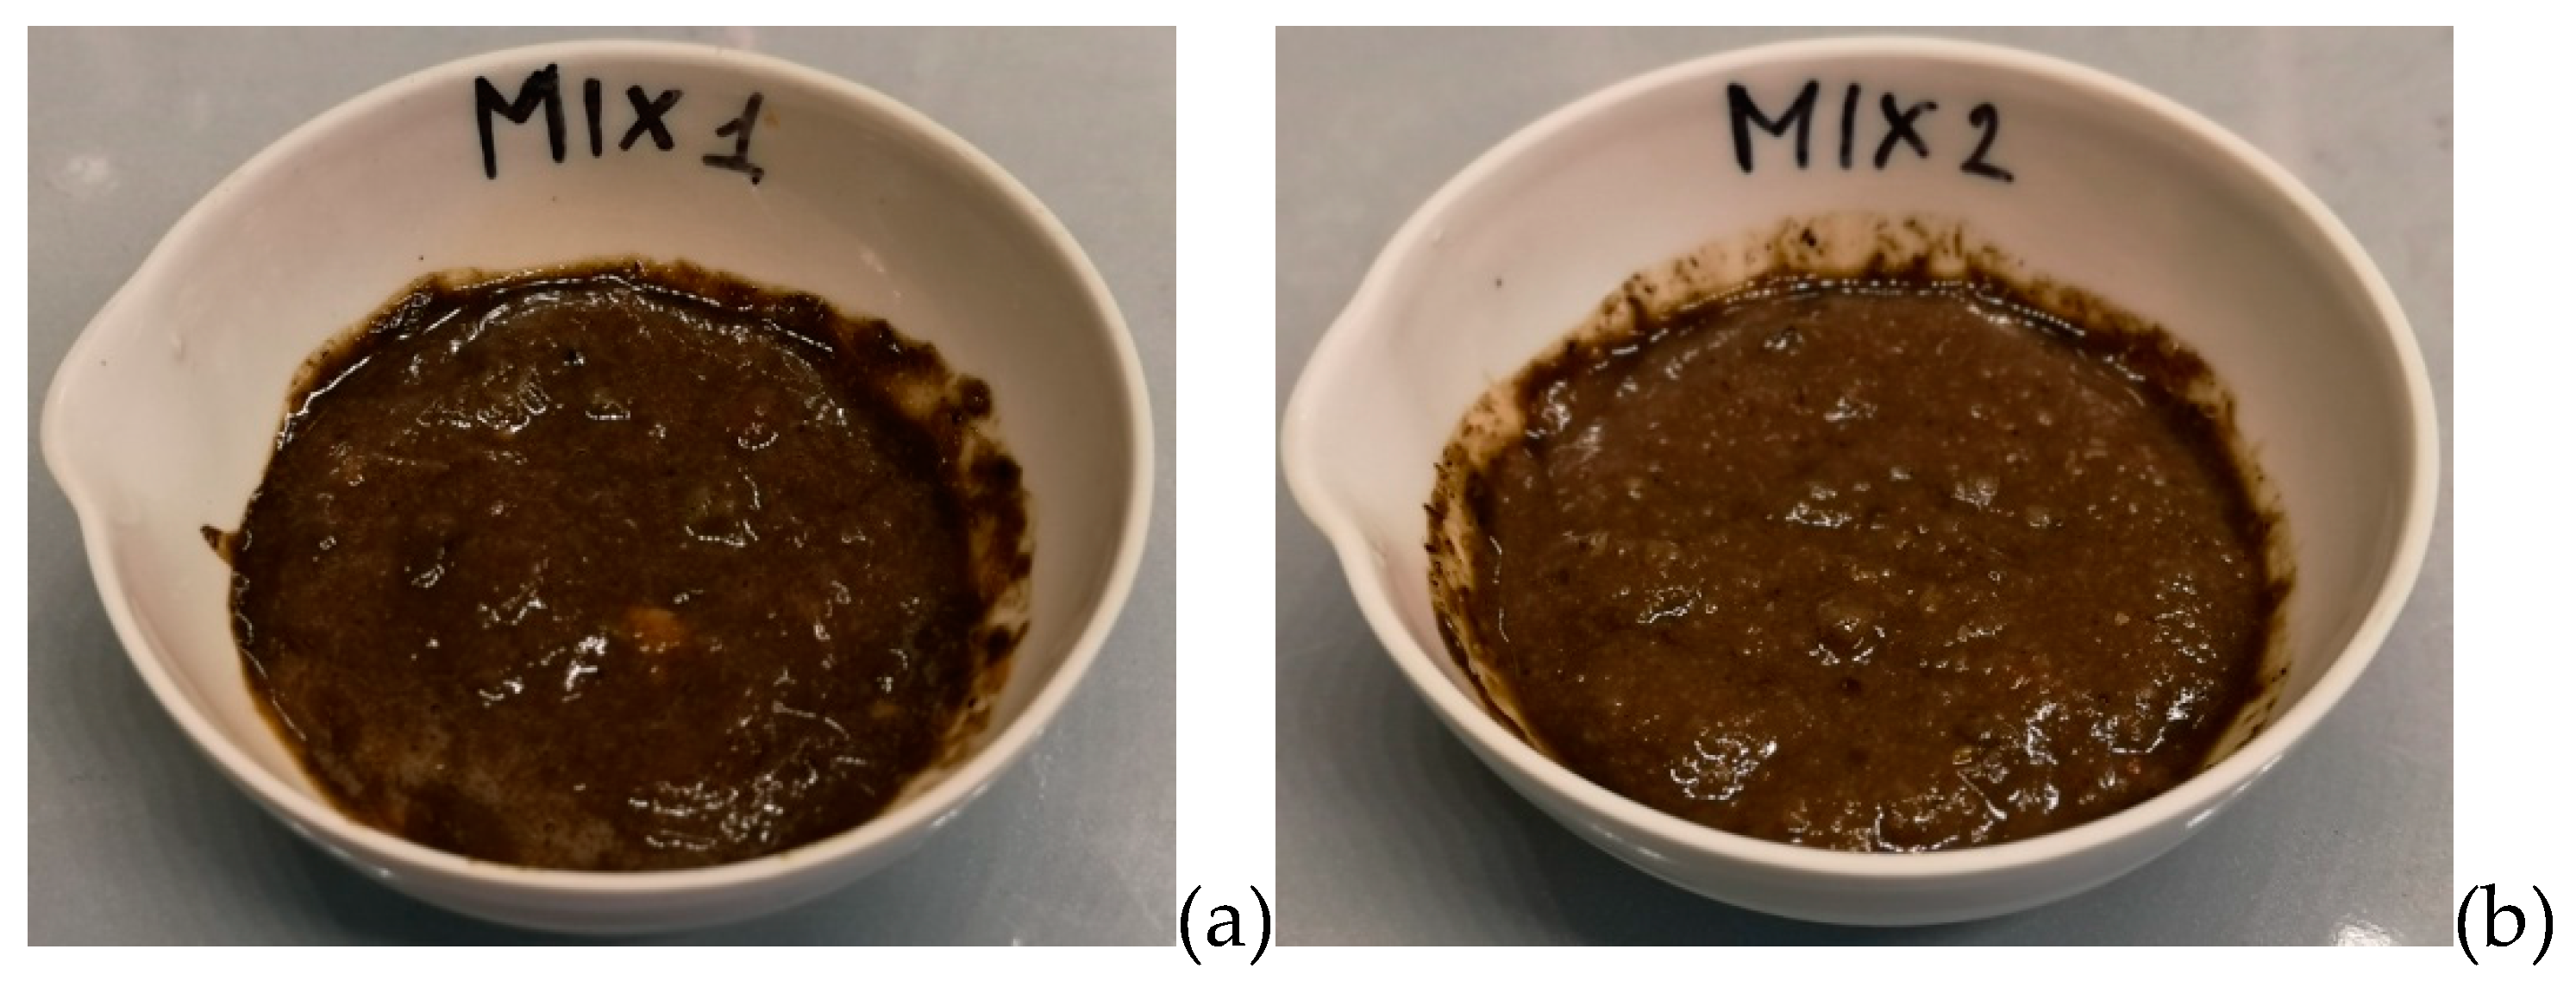
3.2.1 Characterization of Mixtures Prepared for Co-Digestion

The characterization of test mixtures clearly shows a higher organic load for the mixture prepared with potatoes and kiwifruit (mixture-2). Indeed, in this sample, a COD concentration around of 170 g/L was detected, while the value was close to 101g/L for the test mixture prepared with tomatoes and asparagus (mixture-1) (Table 2). Moreover, the total solids content of mixture-2 (151.5 g/L) was 1.7-fold higher compared to the test mixture-1 (89.7 g/L) (Table 2), while the volatile fraction was similar (around to 90% of total solids). The level of volatile fatty acids was also notably higher in the test mixture-2. The total Kjeldahl nitrogen concentrations were between 2.5–2.9 g/L, while the free N-NH4+ amounts were below 0.6 g/L in both test mixtures. The level of phosphates and sulfates was greater for mixture-1 due to the remarkable content of these elements in asparagus. As previously stated, the pH was set to around 7.2–7.5 using KHCO3. After these corrections, the alkalinity accounted for approximately 20.2 gCaCO3/L and 18.5gCaCO3/L for mixture-1 and 2, respectively (Table 2).

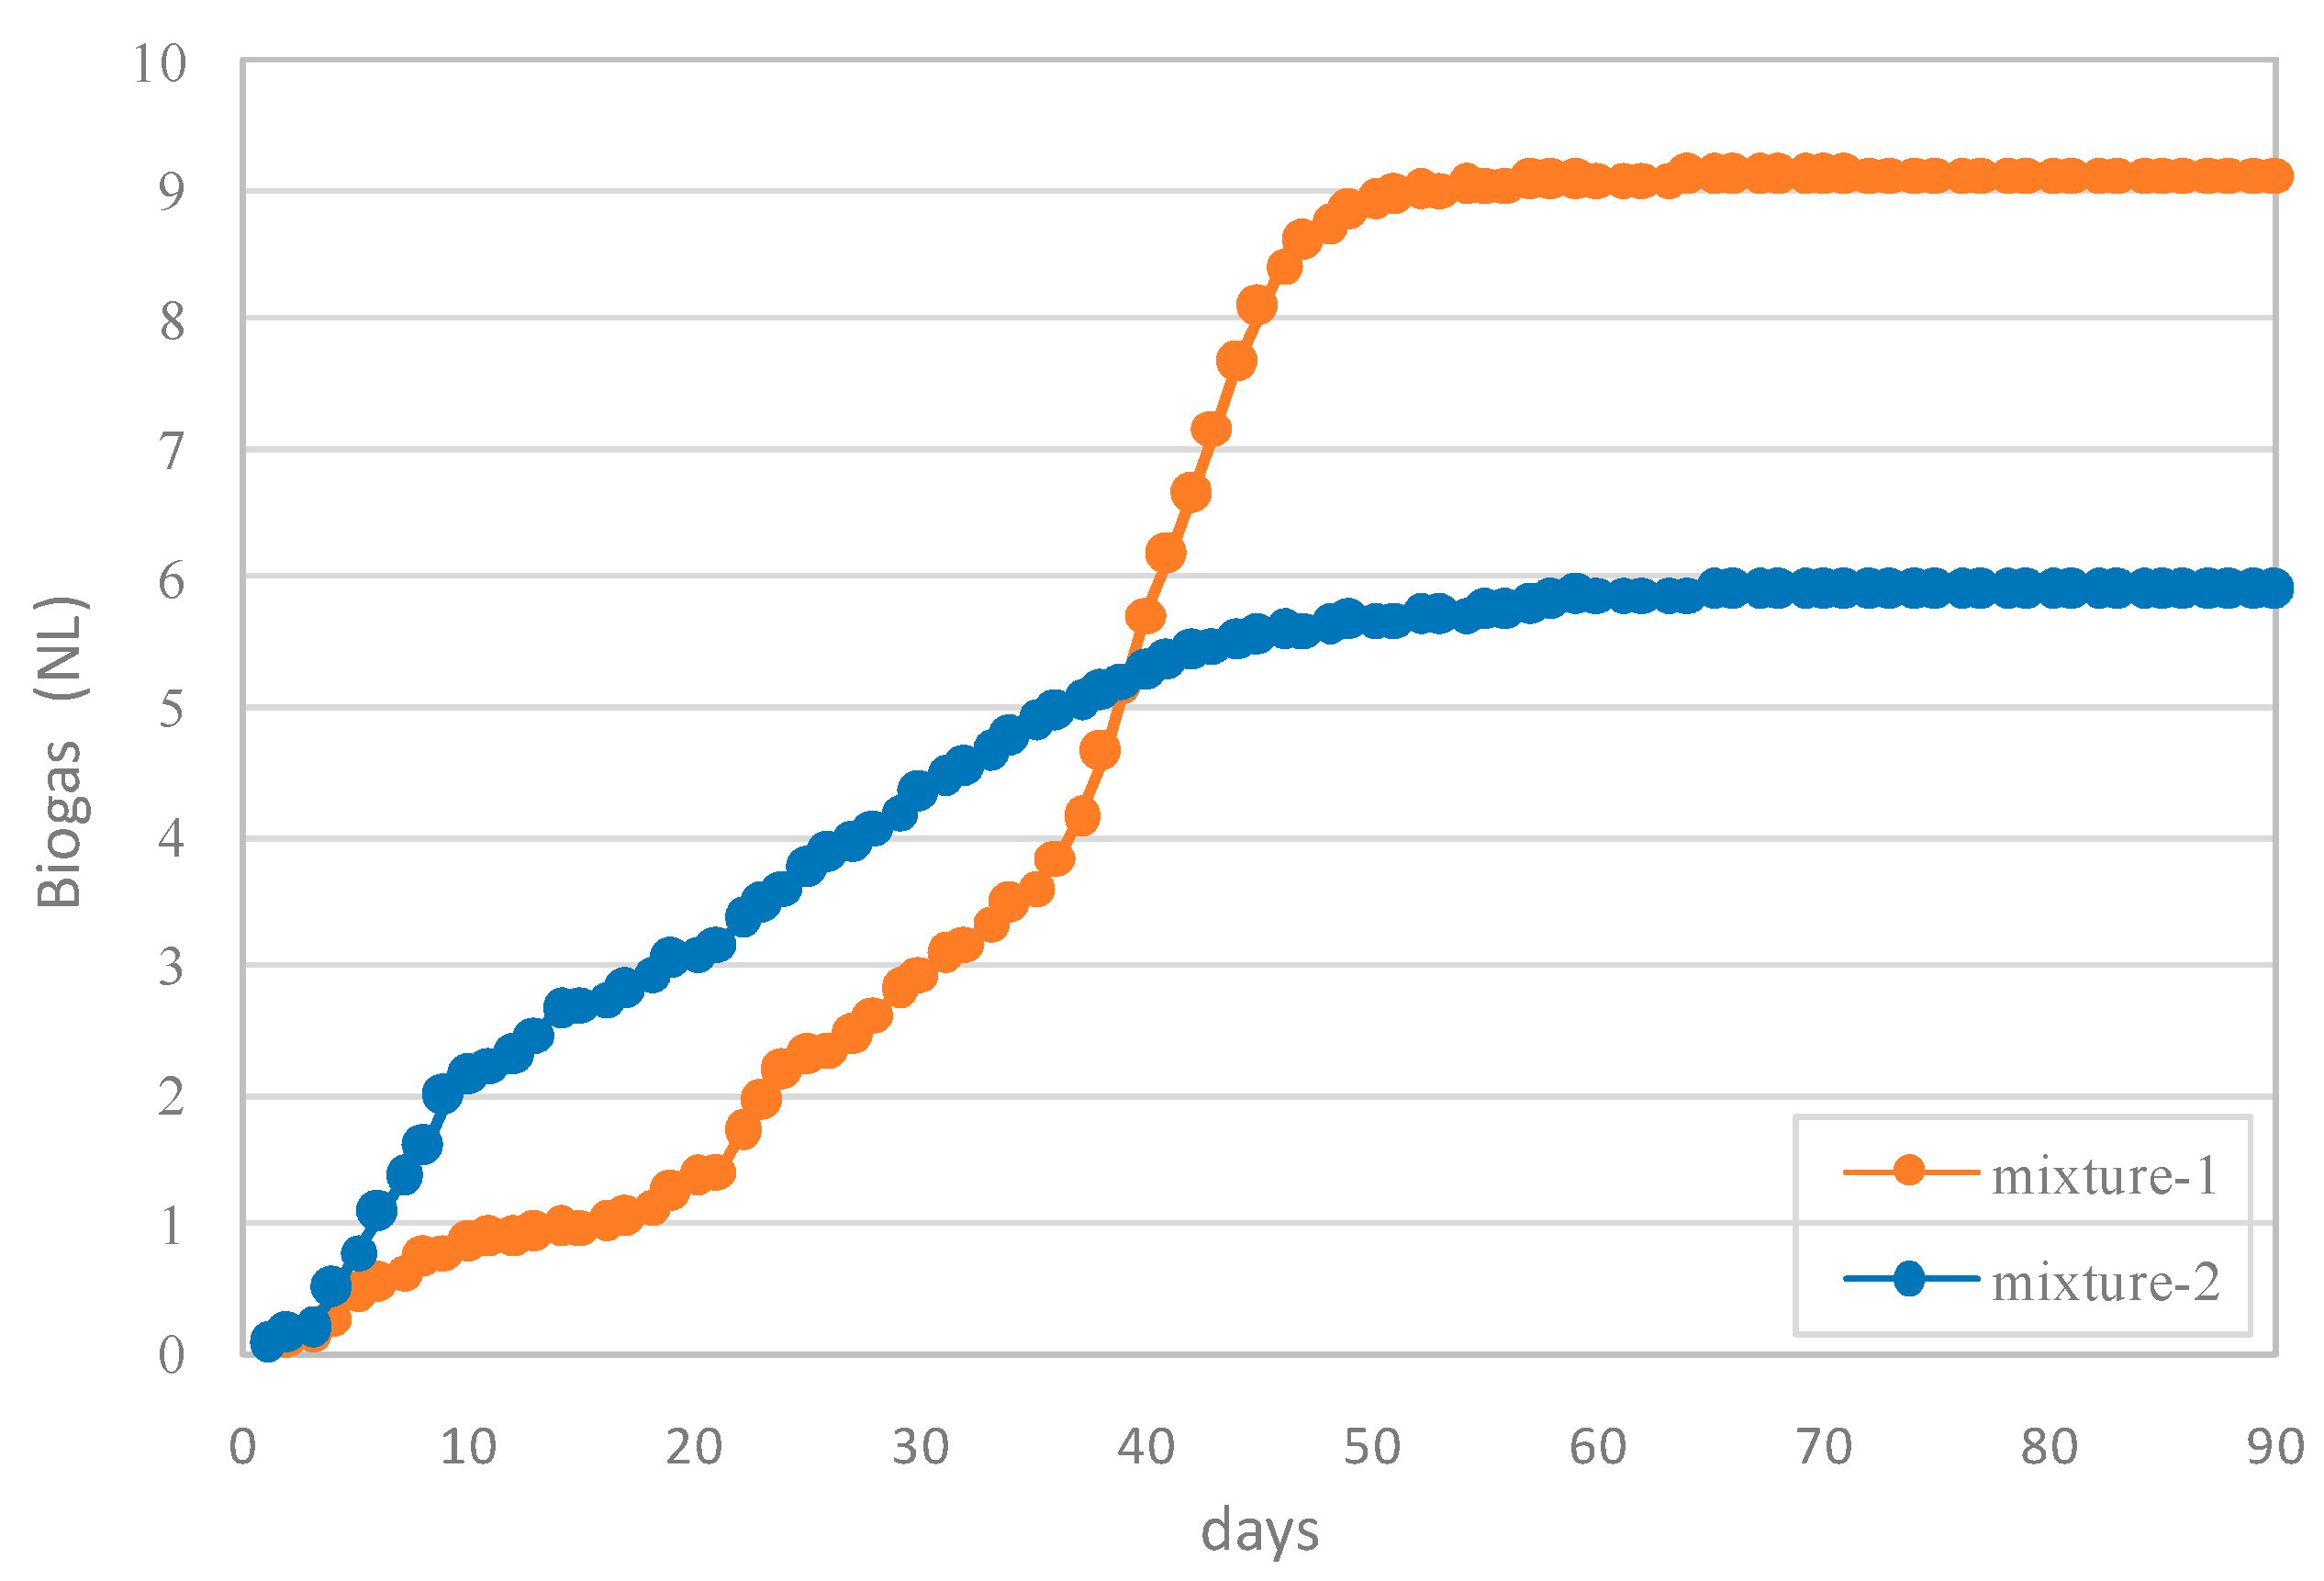
3.2.2 Performance of the Co-Digestion Process

The digestion process efficiently evolved in mixture-1. In particular, a cumulative curve without a lag phase for biomass acclimation was detected (Figure 3). This underlines the biodegradability of substrates and the absence of inhibiting compounds in the mixture. Indeed, the process quickly started with a moderate volume of biogas produced during the first two weeks. However, low methane fractions, between 2–14%, were monitored. In this initial phase, the hydrolysis of complex organic compounds and the formation of VFA probably occurred and, therefore, the biogas was mainly composed of CO2 and H2. The exponential biogas production phase started after 18 days and reached the asymptotic value of 9.16 L within 50 days. During this period, the average CH4 fraction was 74%, which suggests a stable methanation process (Figure 3).
During the overall digestion test, the COD removed was around 70.4 g/L corresponding to efficiencies of 70% (Table 2). The effectiveness of the digestion treatment was marked by the high biogas yield, of about 0.44L/gCODremoved. This value is quite close to the theoretical value of about 0.53L/gCODremoved, which can be estimated by considering that 0.4 L of CH4 are produced per gram of COD removed [50] and by assuming an average percentage of CH4 of 75% (similar to that obtained in this study). The effective process performance is clearly attributable to the properties of mixture-1. Indeed, in this sample, the VFA quantity, advantageous for biogas production, was properly balanced by an adequate alkalinity value. In fact, appropriate VFA/ALK ratios for anaerobic process [11] were detected both in the initial mixture and the final digestate (Table 2). The COD/N ratio was just lower than the values that are generally considered optimal for digestion treatment [11], which underlines the surplus of nitrogenous compounds. This high N availability, however, did not lead to toxic concentrations of ammonium. Indeed, the N-NH4+ detected in the digestate, of about 1.47g/L, is tolerable during anaerobic treatment [11]. Also the remarkable sulfate concentration of the mixture did not hinder the evolution of digestion process. This is attributable to the very high COD/S ratio that, as suggested by many authors, probably limits the sulfate reduction to sulfide [11]. Indeed, only a low abatement of SO42− was monitored at the end of the digestion test (Table 2). By referring to COD of substrates and to the volatile suspended solids of inoculum, the COD/Biomass ratio of the fed mixture was about 2.8 gCOD/gVS, higher than the suggested values for digestion start up [11]. Nevertheless, as previously stated, the anaerobic digestion efficiently evolved without inhibition phenomena. The results enabled the estimation of the volumetric organic load that could be applied in semi-continuous reactor fed with the mixture-1. By assuming that the COD removal occurred mainly during the exponential biogas production phase (Figure 3), an organic loading rate (OLR) of about 4 kgCOD/(m3d) can be estimated. By considering the organic matter conversion and the biogas yield observed, the potential daily biogas production per m3 of digester is determined to be around 1.2 m3biogas/(m3digester⋅d). Furthermore, taking into account the COD value of the inlet mixture and the above value of OLR, the required retention time (RT) for digestion process results is around 25 days. Both the values of RT and OLR are comparable with the ranges considered for the co-digestion of other types of substrates [6,7,9,11]. The above values are theoretical estimates that must be verified by means of semi-continuous tests.
In comparison to the trend observed in mixture-1, the biogas production was even faster in mixture-2 (Figure 3). In this case, indeed, a rapid production phase immediately occurred, with a maximum methane content of 21%. However, despite the higher organic matter availability, the cumulative biogas curve reached an asymptotic value approximately of 6 L, notably lower than that detected in mixture-1. In this case, the COD abatement was equal to only 51%. The poor efficiency is also highlighted by the low biogas yield, of about 0.22 L/gCODremoved. This poorer performance is imputable to an accumulation of acidity during the digestion process, which can completely inhibit the activity of methanogenic bacteria. In fact, the characterization of the digestate showed a low pH value, close to 5, and a very high amount of residual VFA (Table 2). This is a consequence of the lack of alkalinity relative to VFA content; indeed, the VFA/ALK ratio increased from 0.55 to 4.0. These values clearly underline conditions that are not favorable for a stable evolution of the digestion process [11]. The strong VFA production was, probably, promoted by the high initial COD/Biomass value, equal to 5.9 gCOD/VS, that was even higher than in mixture-1.
Therefore, the results of the conducted tests confirmed the importance of properly selecting and mixing the substrates to ensure effective performance of the co-digestion process.

3.3. SCWG Tests

3.3.1 Characteristics of Digestate Fed to SCWG

Supercritical gasification of digestates was carried out after co-digestion experiments. The digestates of mixture-1 and mixture-2 were analyzed for different parameters as reported in Table 2. The results showed much higher concentrations in the digestate from mixture-2. In fact, compared to values of the sample from mixture-1, the TS amount was about double and the COD and VS concentrations were about 2.7-fold greater. This, clearly, is attributable to the major initial load of the raw mixture-2 and to the lower digestion efficiency obtained with this sample. The SCWG tests were carried for both digested samples, fixing the operative conditions (T = 450 °C, P = 250 bar).

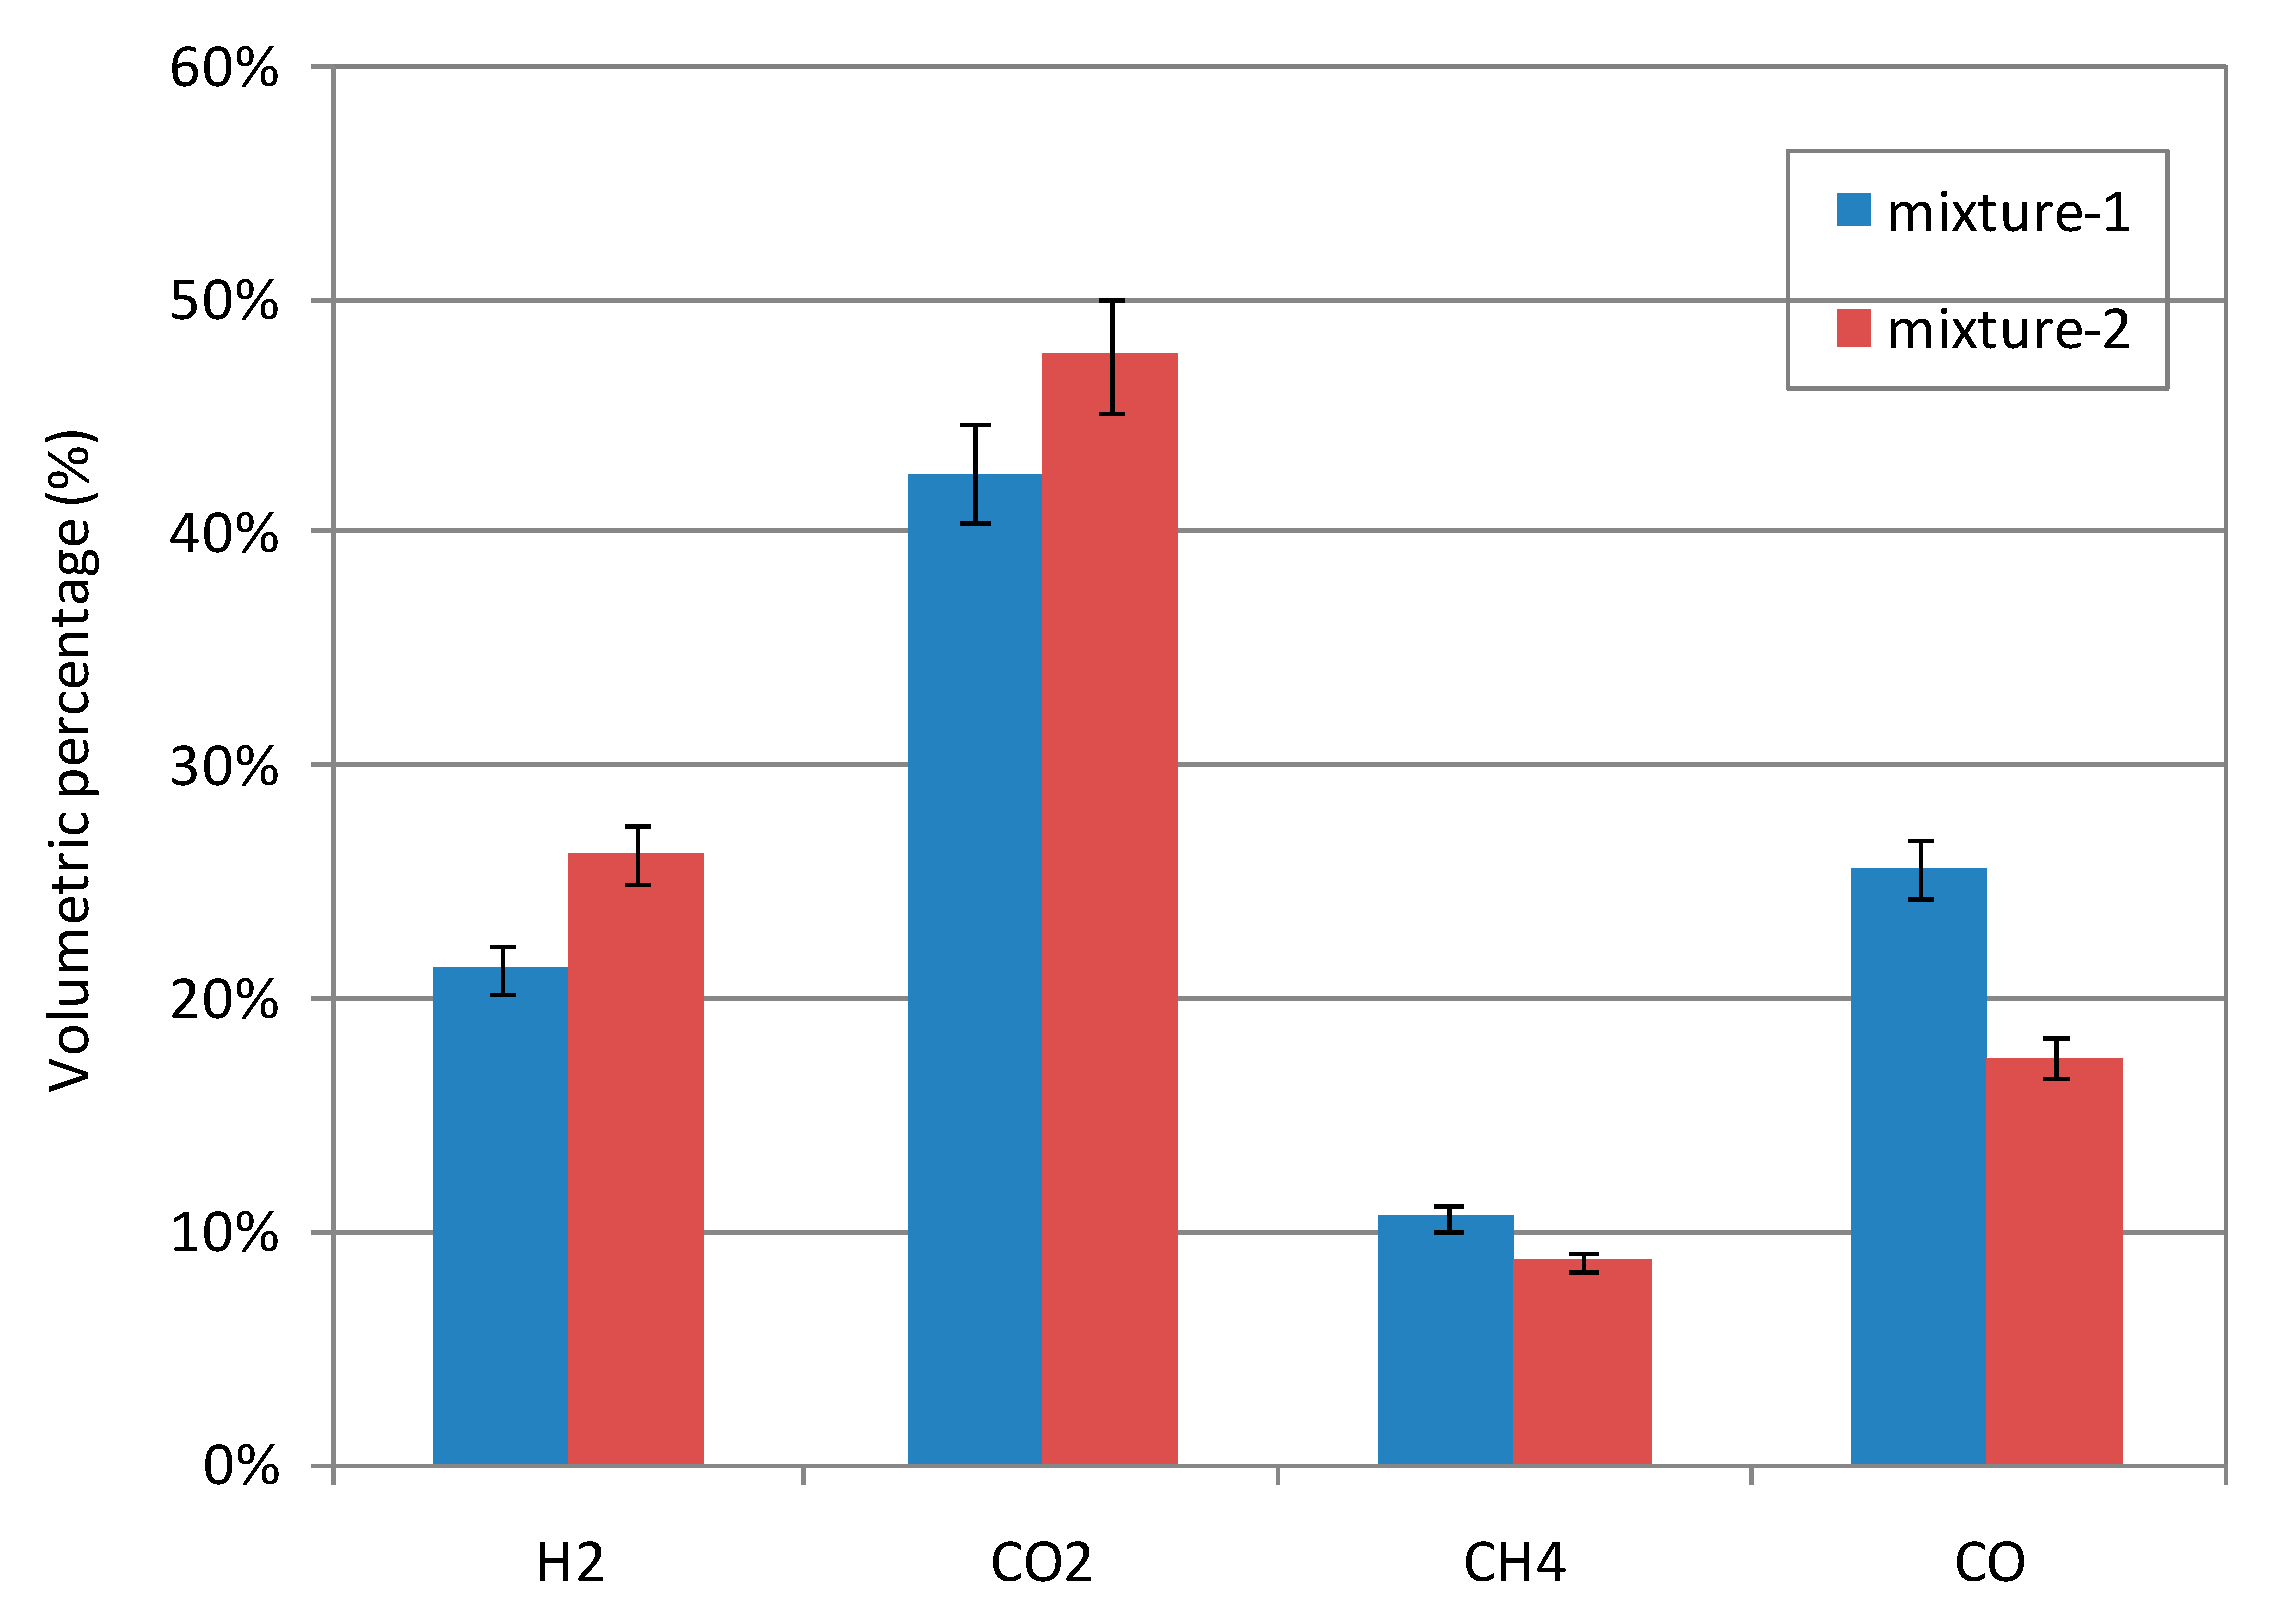
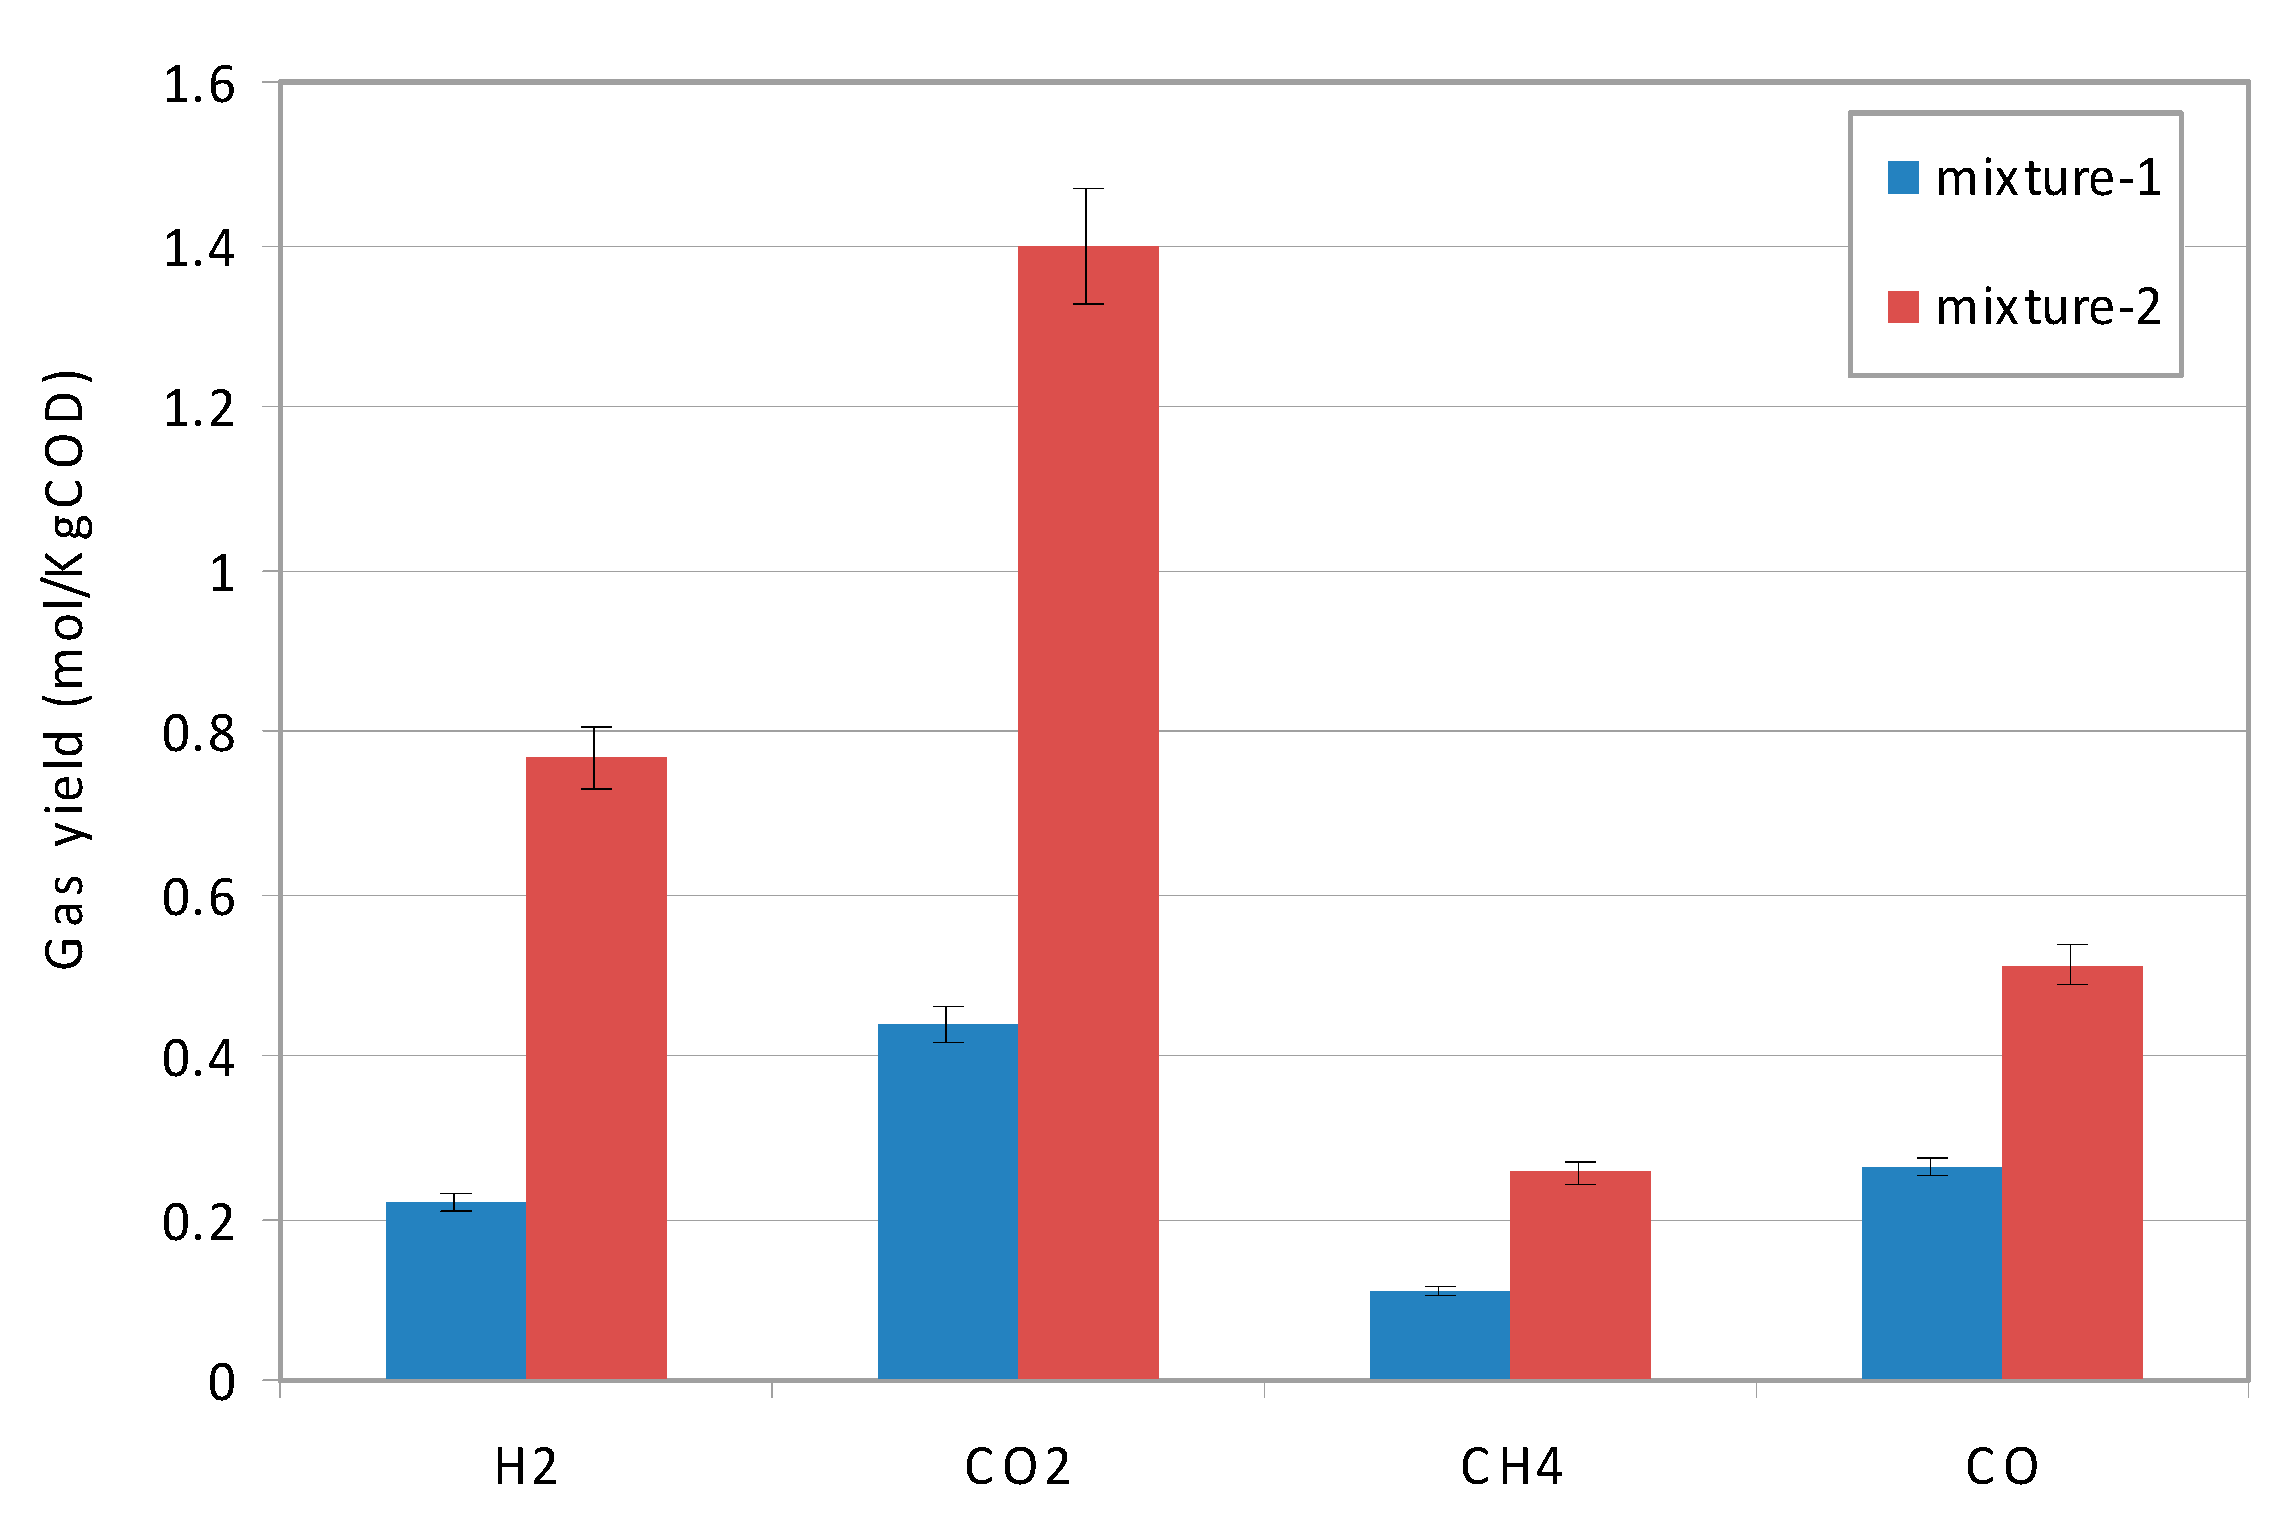
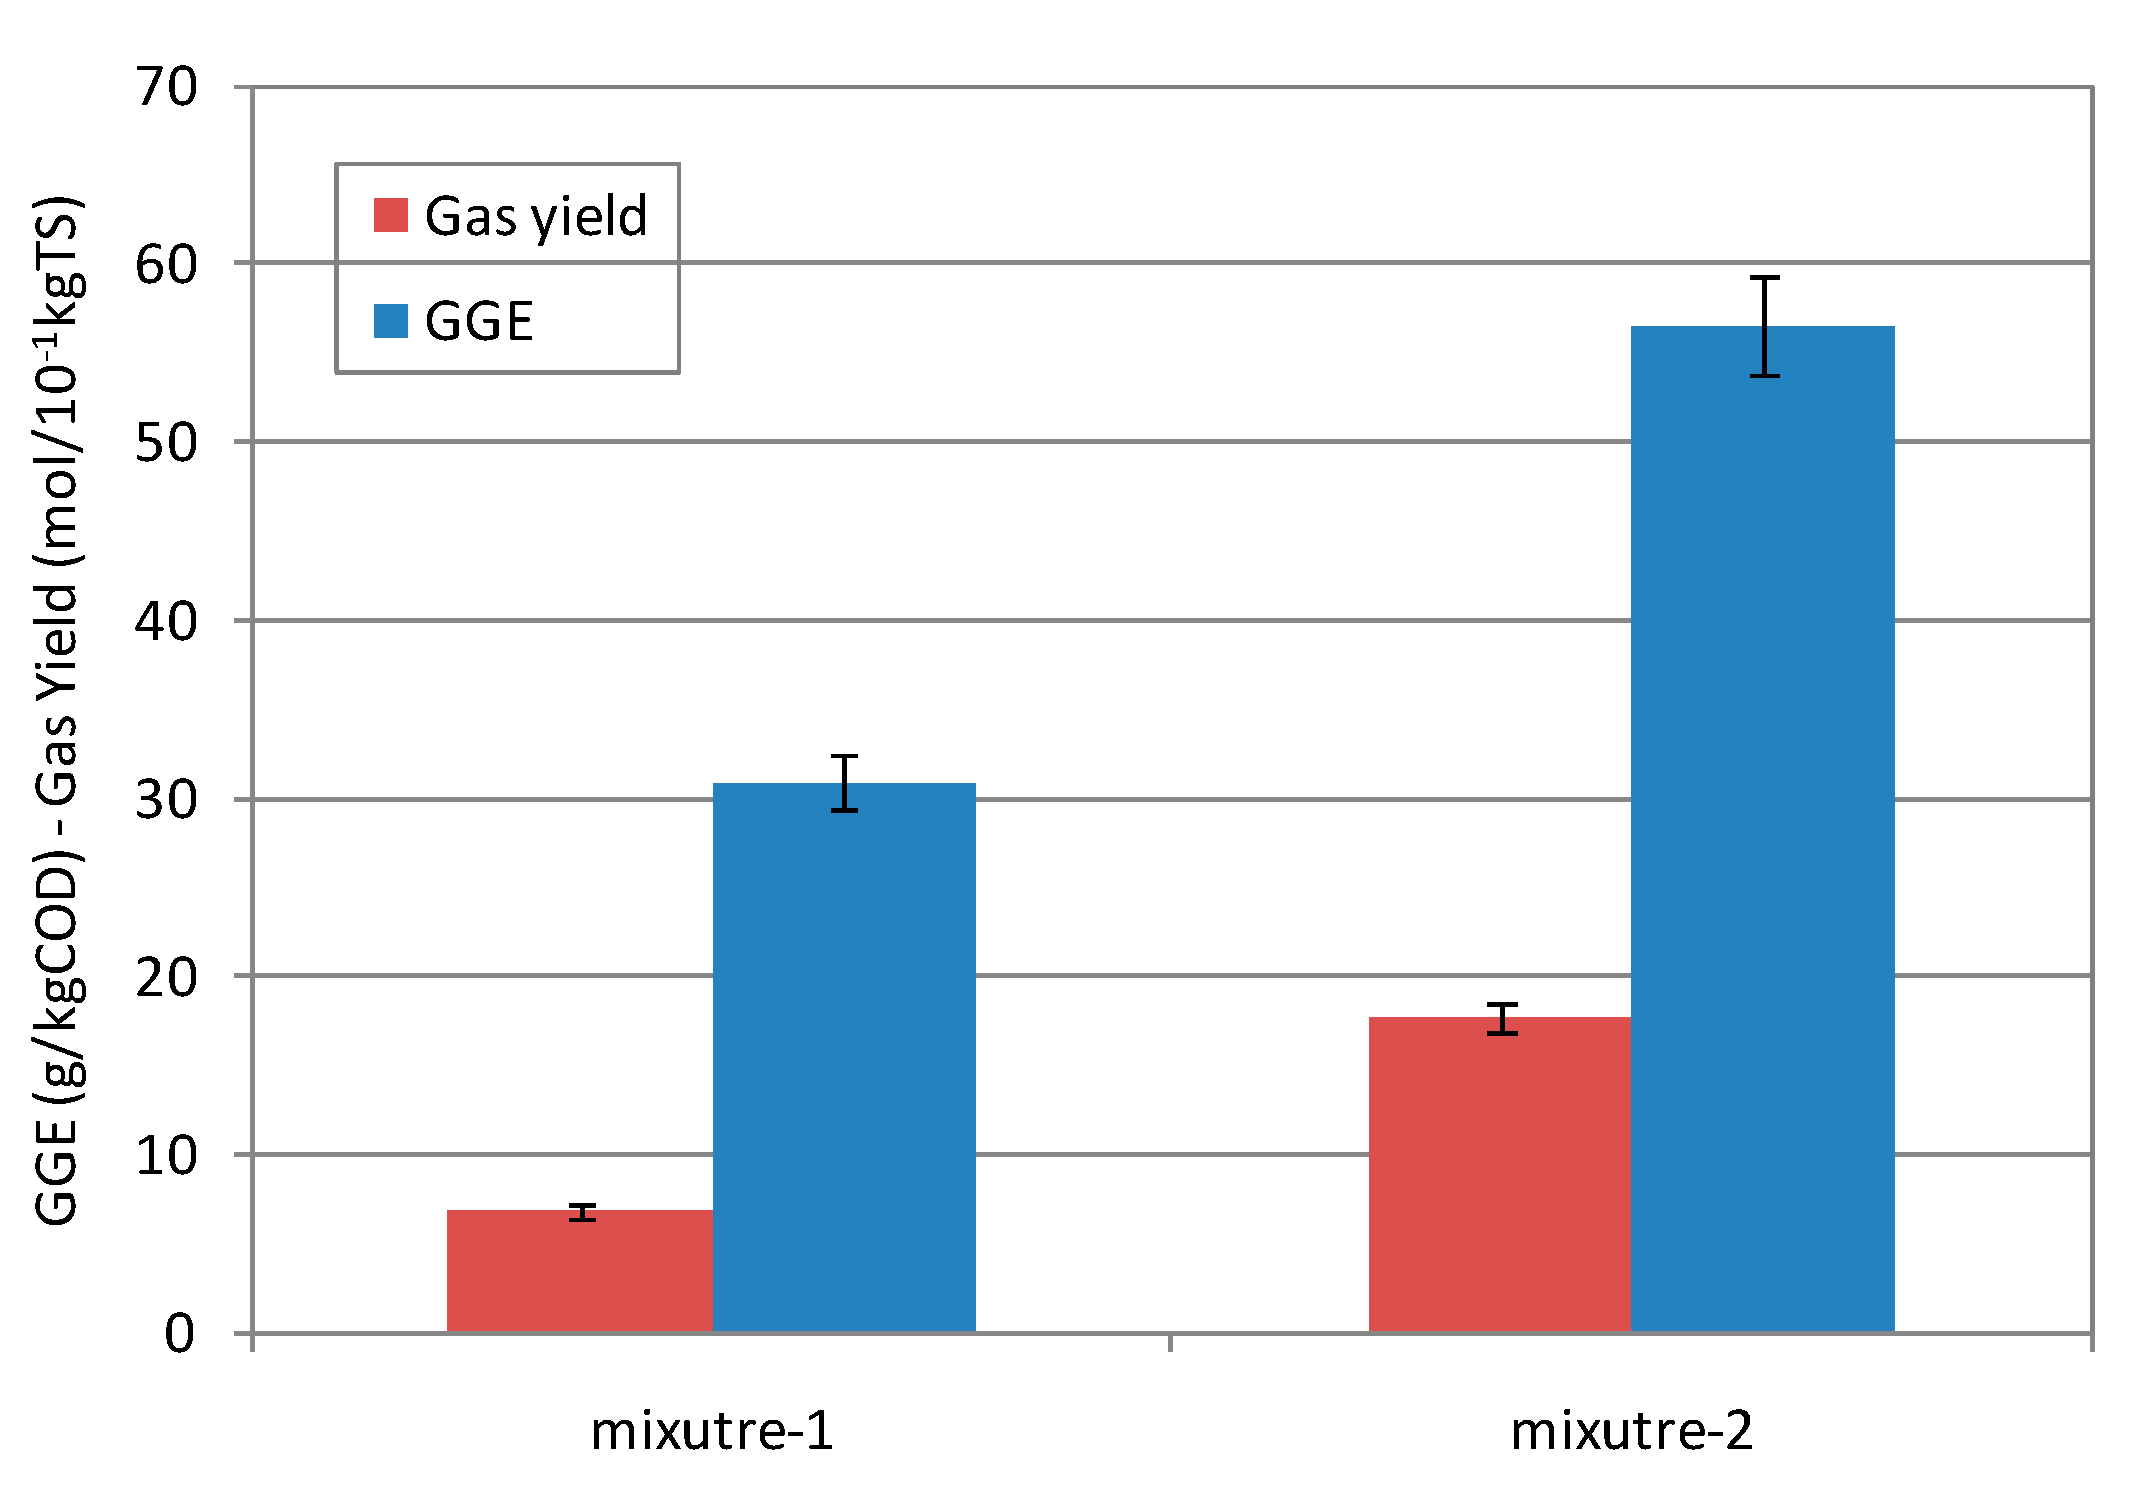
3.3.2 Performance of SCWG

Efforts have been made to investigate the feasibility of the direct gasification of digestates after anaerobic co-digestion and to understand the effects of feedstock load on syngas production.
The several key chemical reactions that take place during SCWG are steam reforming, water–gas shift and methanation [23,36]. However, many other side reactions like cracking, chain rearrangements, condensation, and polymerization reactions occur [32,34,36]. The gas compositions obtained, at reaction temperatures 450 °C and 250 bar, in two samples characterized by different amount of COD and TS and VS are presented in Figure 4. First of all, the experimental results showed that both digestate types can be directly gasified. In fact, the gaseous products were mainly composed of CO2, H2, CO, and CH4 and the percentages of the constituents were similar for the treated samples (Figure 4). A certain aliquot of ammonia gas was also generated due to the NH4+ content of digestates; however, this fraction was not accounted in the gas composition.
In agreement with Gong et al. [34], our tests proved that the feedstock properties have a strong influence on the SCWG performance and gas production. In fact, notably greater yields of gas constituents were detected in mixture-2 (Figure 5). Particularly remarkable is the increase in hydrogen production. In fact, the specific production was almost four times greater in the digestate of mixture-2 relative to the value reached in the sample from mixture-1 (Figure 5). The methane generation also showed an appreciable enhancement that was 2.5-fold higher by treating the digestate of mixture-2. As a consequence of the higher yields of each single gas, a major global gasification efficiency (GGE) was detected in mixture-2. In fact, the GGE (Equation (1)) was around to 56.5 g/kgCOD, while it decreased around to 31.0 g/kgCOD in the sample from mixture-1.
The gas yield (Equation (2)) and solids content of the digestates also demonstrated a good relationship (Figure 6). Indeed, the gas yield in the digestate with TS content of 9.5% (mixture-2) was 2.6-fold higher than that obtained in the sample with TS content of 4.6% (mixture-1).
Based on the experimental results, better SCWG performance was detected in the mixture with the higher COD and solids content. However, high concentrations indicated that low water content was in the reaction process. The steam-reforming and water–gas shift reactions are sensitive to water concentration because water is a reactant. In fact, at supercritical temperatures, supercritical water becomes a more powerful oxidant, and free radical reactions prevail. Water acts as a solvent and promotes solute-solvent reactions such as the decomposition of the organic compounds in the digestate. Therefore, the two previously mentioned reactions could be limited at the condition of high feedstock concentration and lower water content. Some authors found a linear relationship between the water content of the feedstock and the gas yield [34]. However, these works generally investigated a single feedstock typology and, therefore, did not account for the effect of different characteristics of samples. Indeed, as stated by Gong et al. [34], the gas production could be also affected by the different types of organic matter and chemical composition of matrixes fed to SCWG. In fact, in our tests, the digestate of mixture-1, characterized by low concentrations and higher water content, comes from a more efficient digestion process. Therefore, its residual organic matter was mainly composed of complex and refractory compounds. This probably reduced the gasification yield in comparison to that detected in the digestate of mixture-2. The better SCWG performance obtained in the digestate from mixture-2 could be also related to the higher content of some elements, such as K+ ions, able to promote the gas generation [34]. Nonetheless, the gasification can be considered satisfactory in both treated samples. Therefore, the conducted tests indicate that the SCWG is a suitable option for the production of a valuable gas from digestate after anaerobic digestion treatment. Indeed, after the SCWG stage, by means of a proper post-treatment of produced gas, it is possible to obtain a synthetic natural gas (SNG) or pure hydrogen.

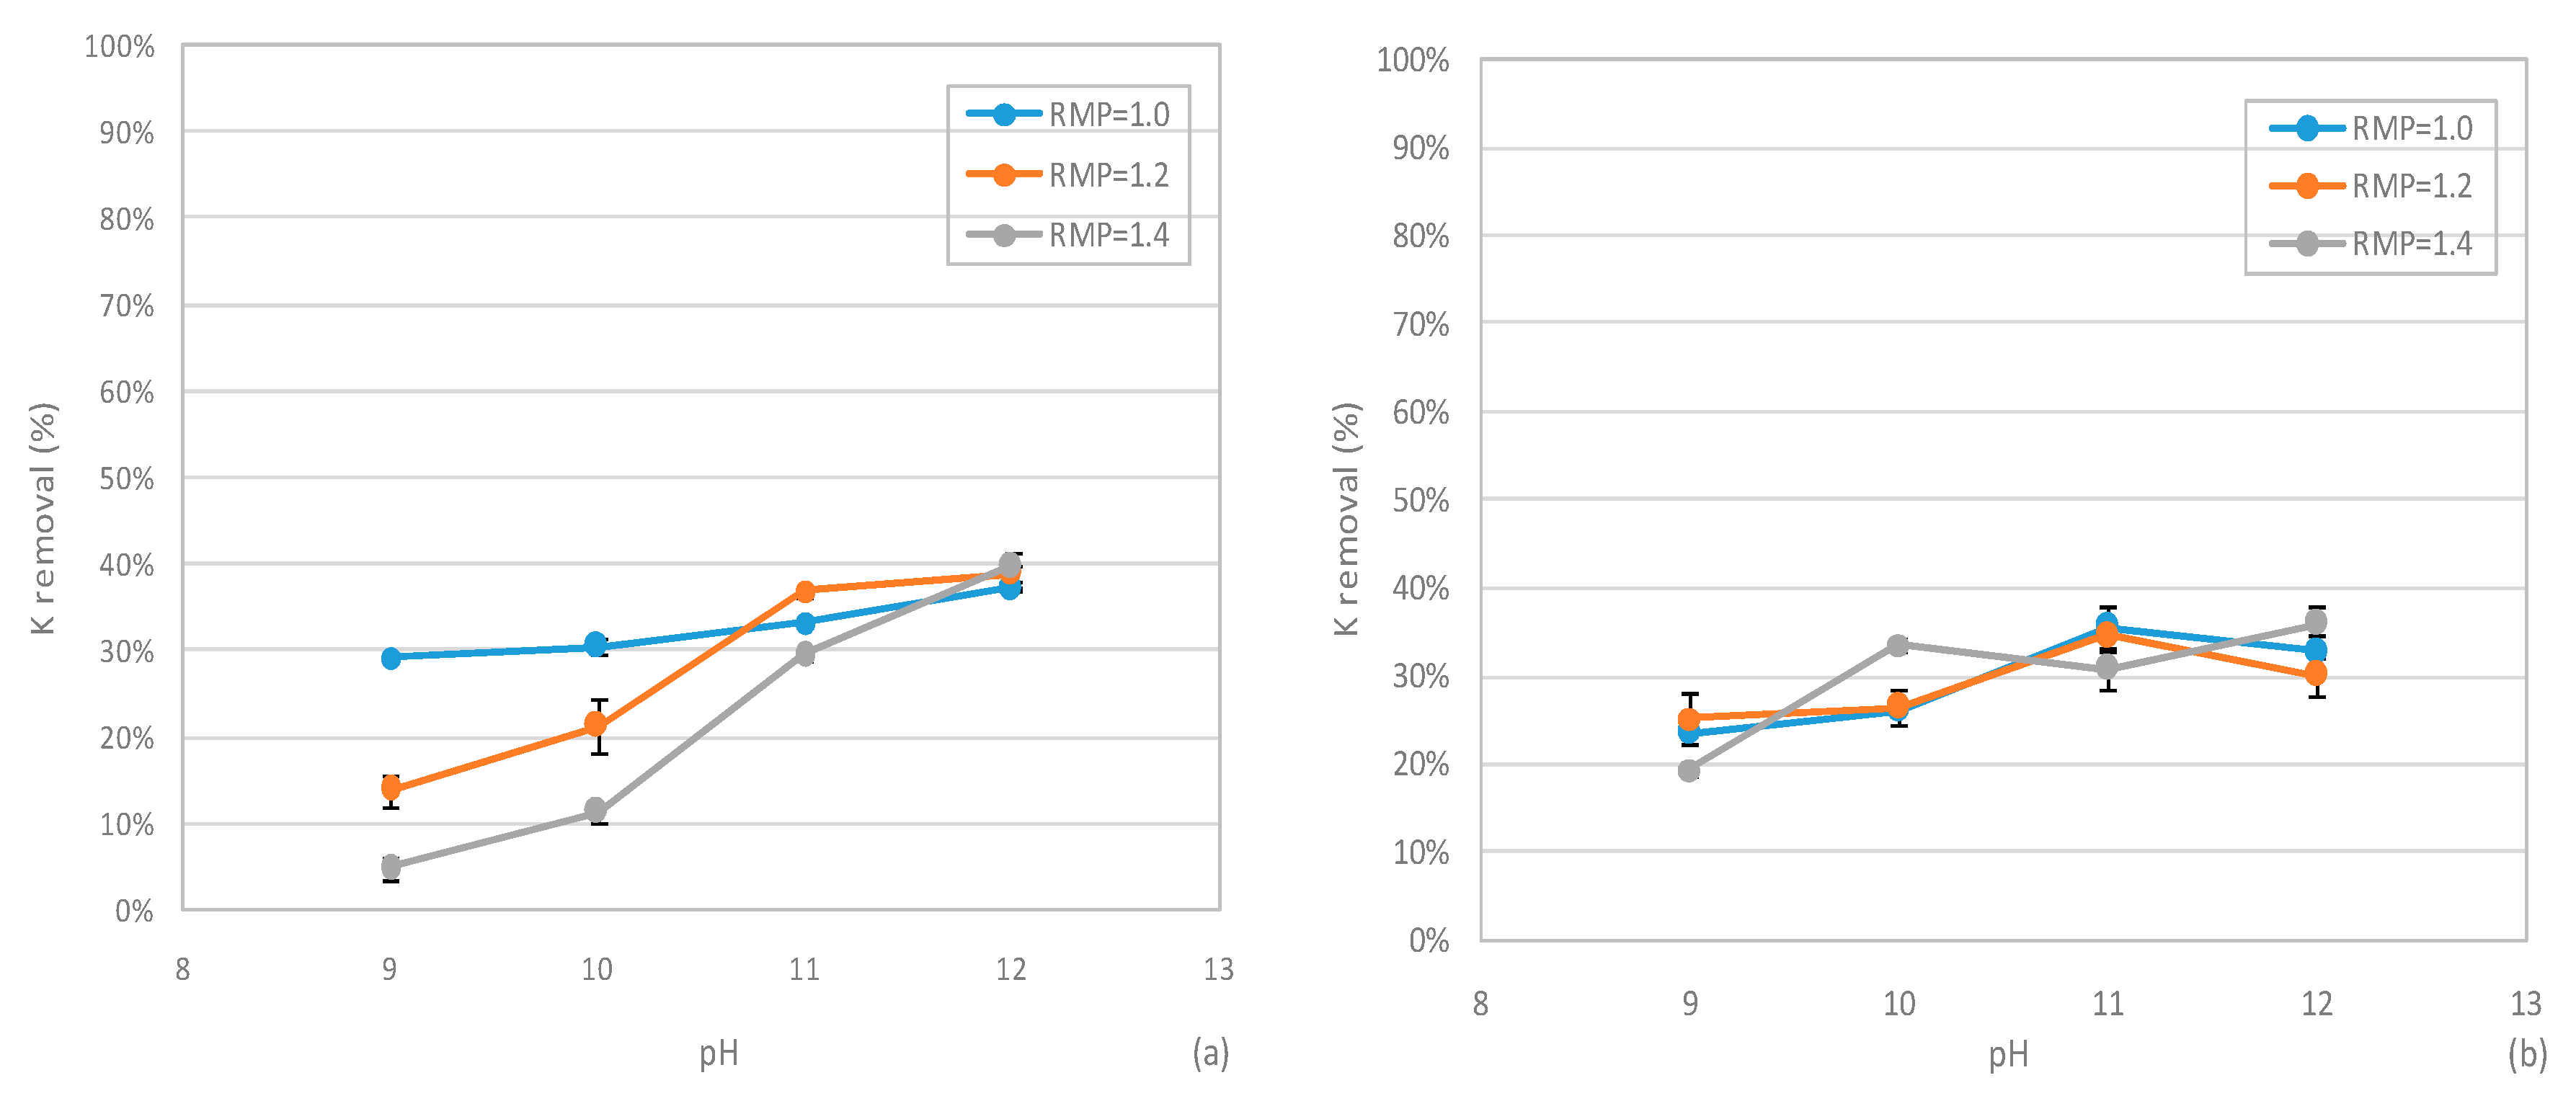
3.4. Phosphorus Recovery from SCWG Liquid Phase

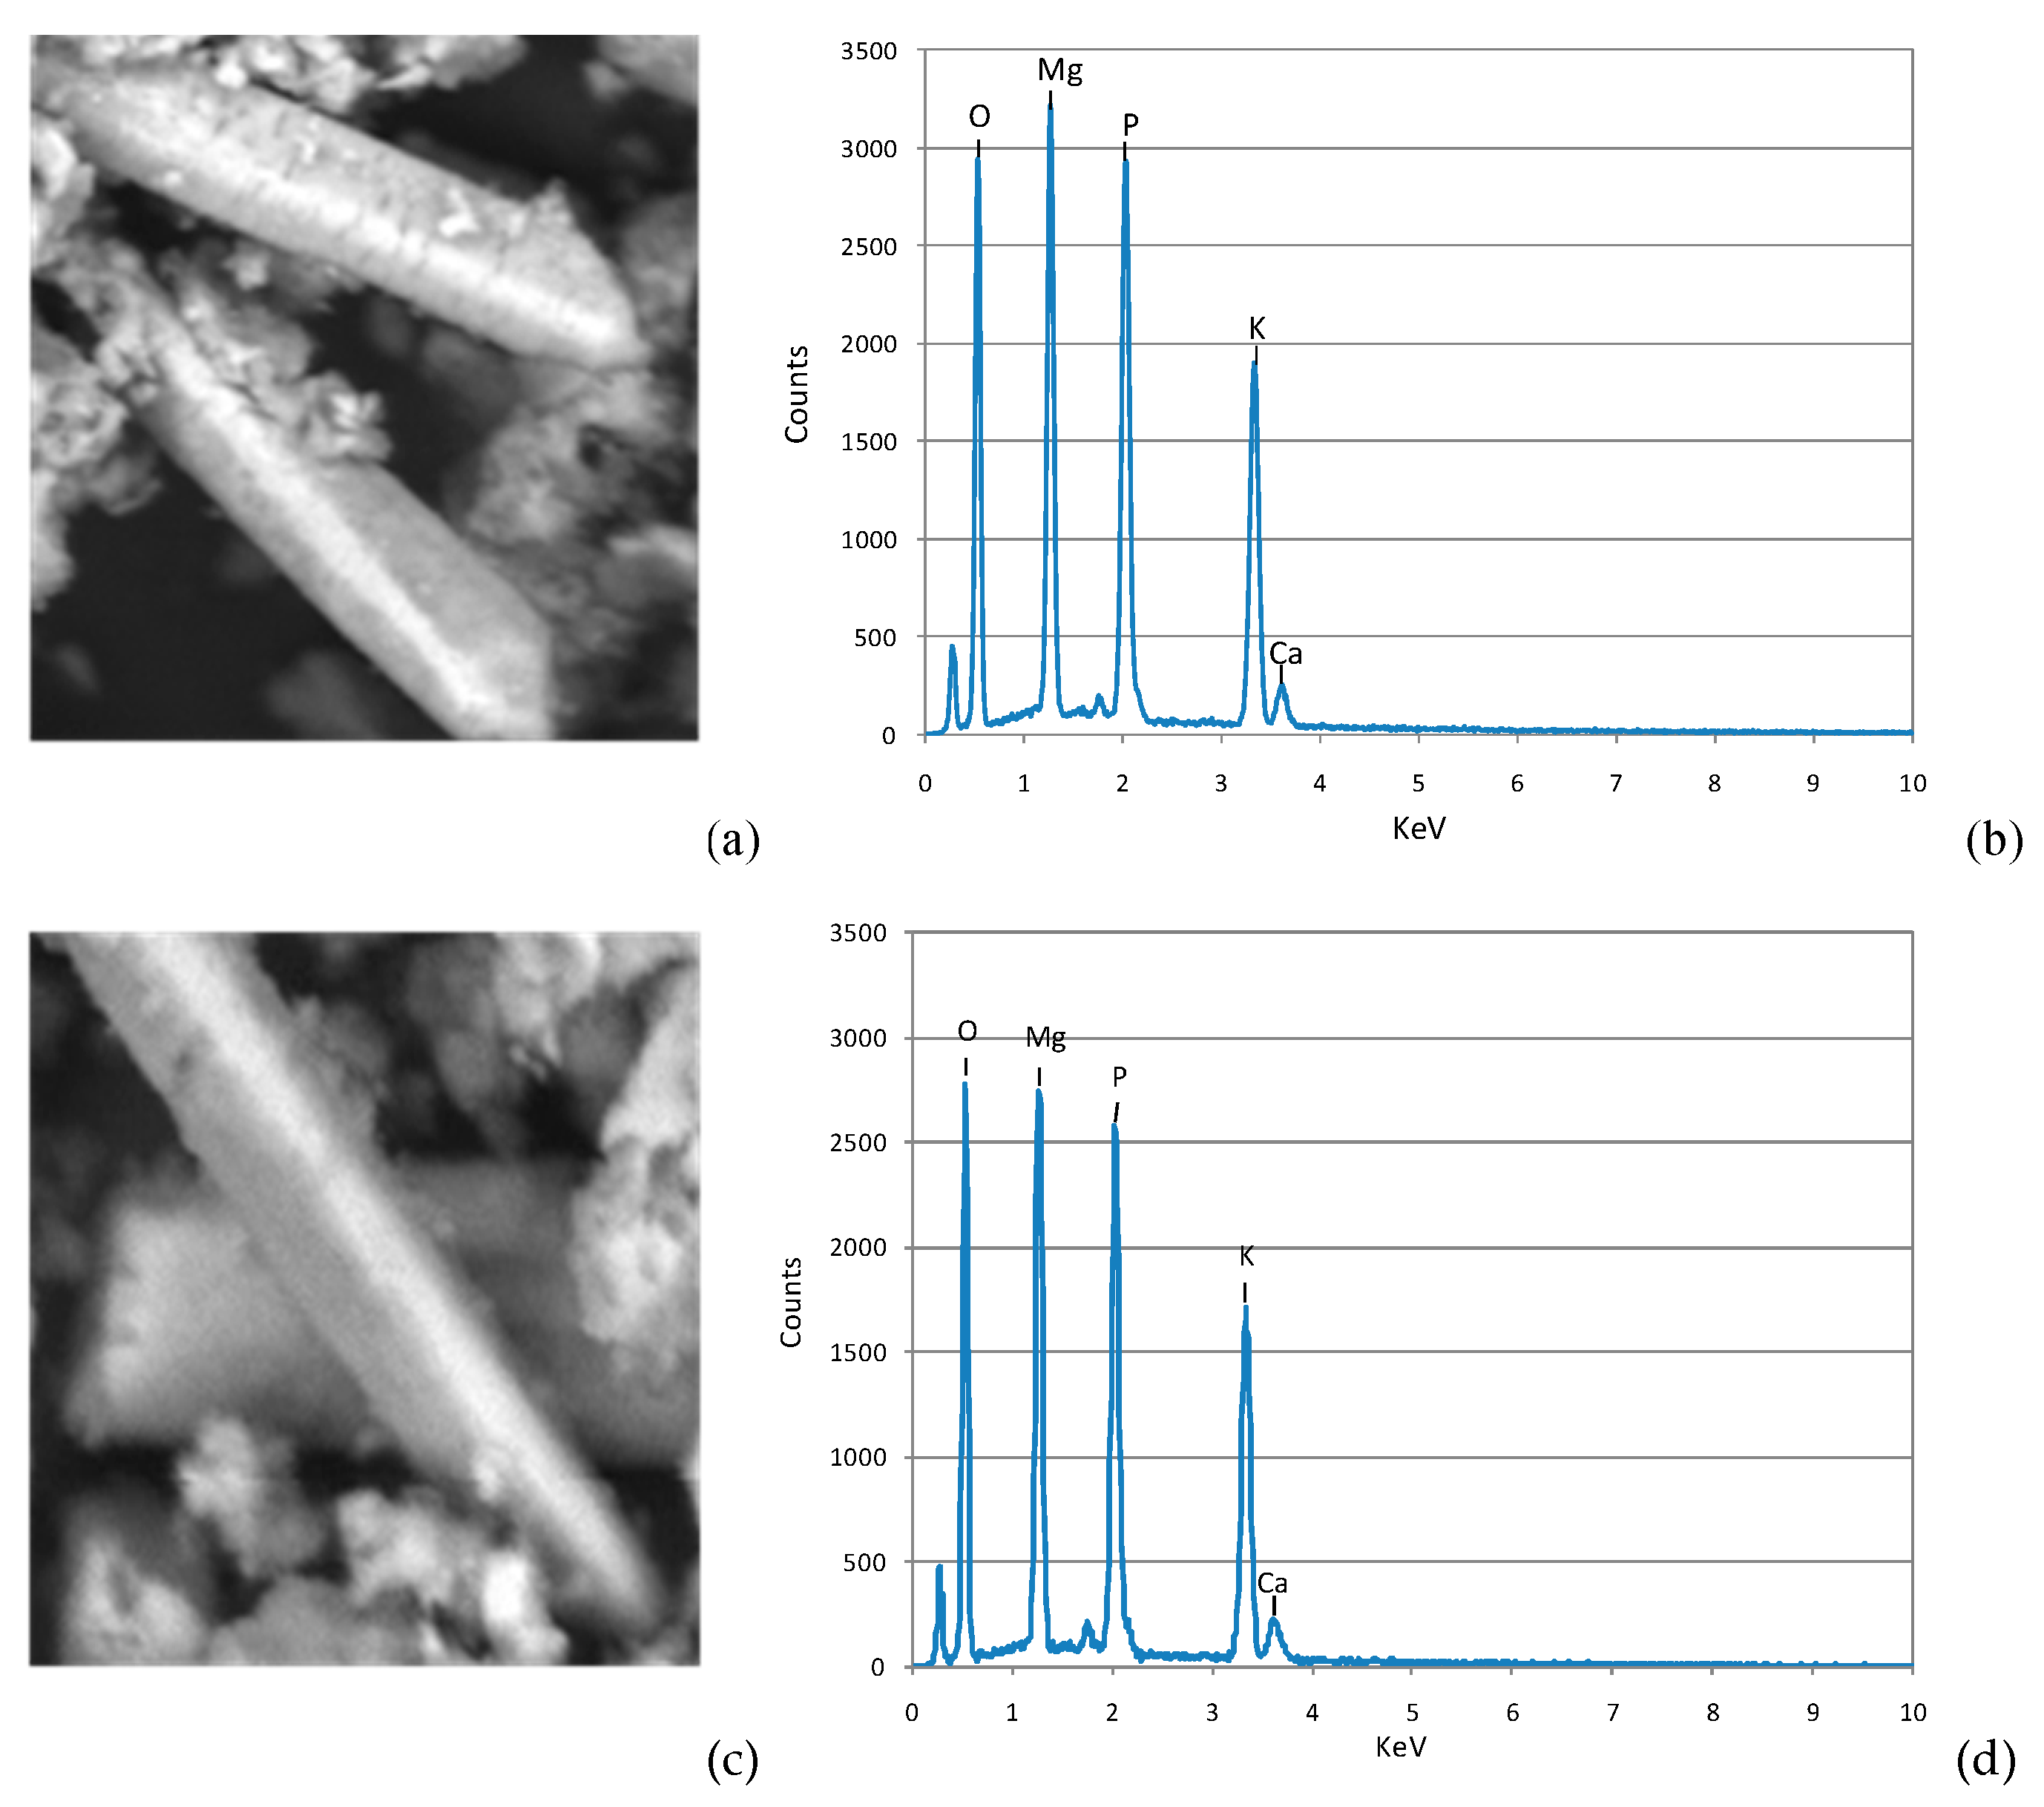
3.4.1 Characteristics of Samples Subjected to Phosphorus Recovery

The liquid samples from SCWG were characterized by very low levels of residual organic matter. Indeed, the COD concentration was about 155 mg/L for mixture-1 and 181 mg/L for mixture 2. These values are just higher than the limit of 125 mg/L fixed by Italian environmental regulatory for the direct discharge of wastewater in superficial water bodies. Such a low organic load could be easily removed in a conventional wastewater treatment plant [51,52]. The solids content was mainly due to dissolved inert compounds and the volatile fraction was extremely low. The ammonium nitrogen was completely negligible due to conversion to ammonia gas during the gasification phase. Indeed, as mentioned, the basic pH of the samples caused total ammonia stripping (Table 2). Instead, remarkable phosphorus concentrations were detected in the residual liquid phase of both mixtures (Table 2). These results agree with the findings of Amrullah et al. [21] that observed a significant presence of phosphorus in the liquid samples from SCWG treatment. The purpose of the last step of the integrated treatment was phosphate removal and recovery, as magnesium potassium phosphate, from the liquid phase of SCWG.

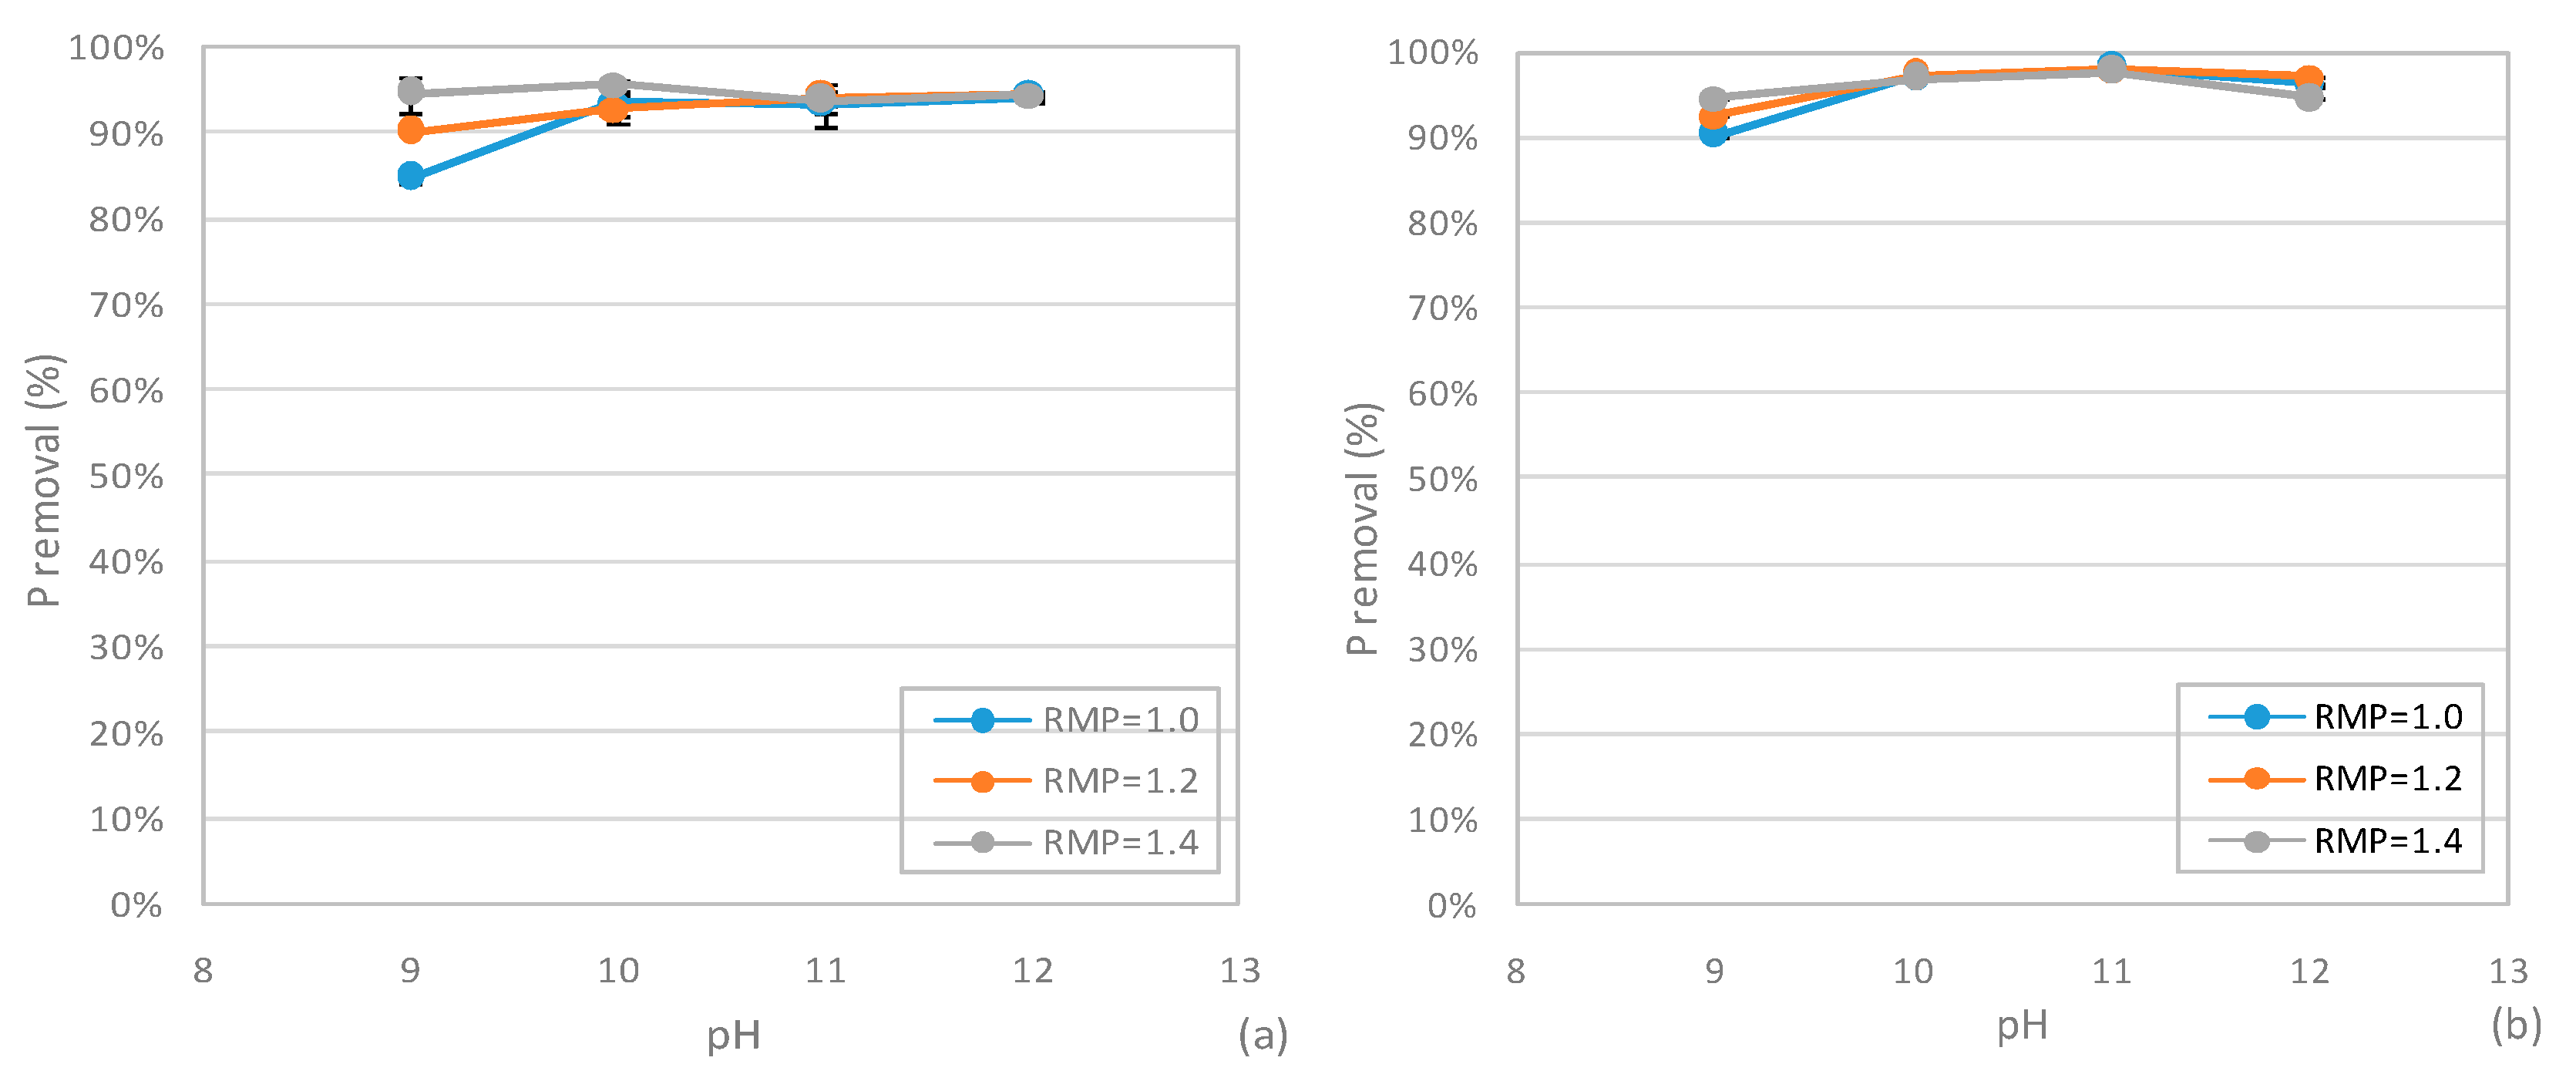
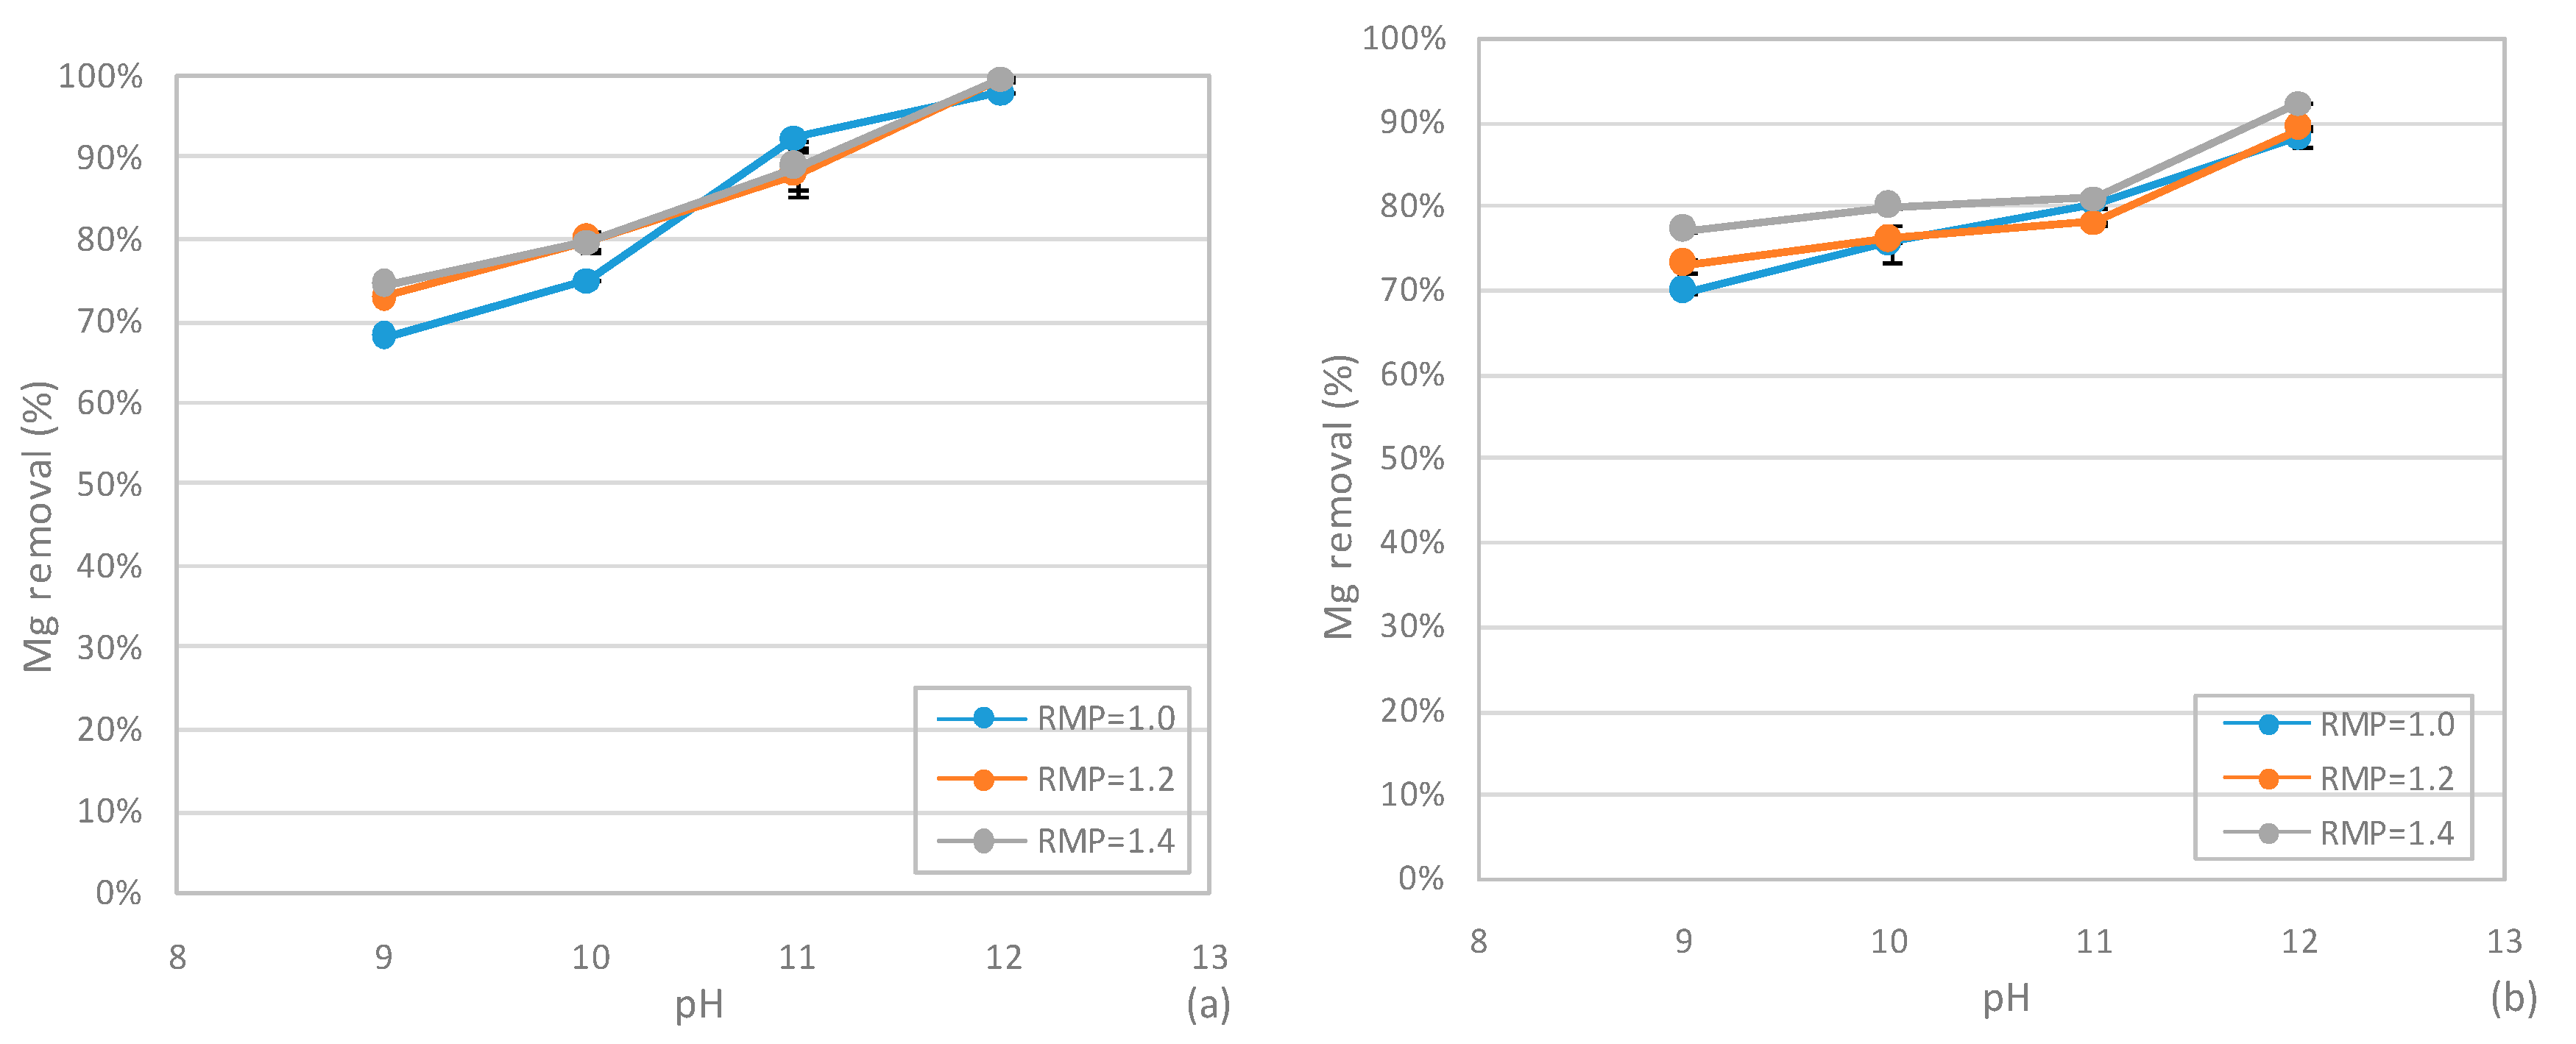
3.4.2 Performances of MPP Precipitation Tests

The experiments were carried out to define the optimal values of pH and Mg/P molar ratio to achieve the MPP precipitation. In this regard, pH between 9 and 12 and Mg/P values of 1, 1.2, and 1.4 were tested. As previously stated, due to the initial feed of KHCO3 into the mixtures subjected to digestion tests, it was unnecessary to add potassium sources for MPP formation. Indeed, after the SCWG treatment, the K/P molar ratio was 3.1 and 4.2 for the samples from mixture-1 and mixture-2, respectively.
In the tests conducted on the liquid phase of mixture-1, with a Mg/P molar ratio of 1, the phosphorus removal increased with the pH from the value of 85%, at pH=9, up to an asymptotic value of about 94%, at pH 10 (Figure 7). The benefit of pH enhancement was less marked in the tests carried out with higher magnesium dosages. By using a Mg/P ratio of 1.2, the P abatement was close to 90% with pH=9 and then it slightly increased at the higher pH values (Figure 7). With a Mg/P value of 1.4, the maximum phosphorus abatement was already detected at the lowest pH tested. Similar trends were observed in the sample from mixture-2, reaching even greater efficiencies compared to those detected in the sample of mixture-1 (Figure 7). Therefore, the experimental results underline how the Mg dose affects the P removal only for pH values lower than 10. Beyond this pH, regardless of Mg/P ratio, the efficiency remains stable at the plateau value. These results are in good agreement with the statements of other authors that considered the pH range 10–11 the most favorable for P removal from synthetic urine [37]. The influence of magnesium dosage detected by Xu et al. [37] was also similar to that observed in our experiments. On the basis of these results, pH = 10 and Mg/P = 1 can be considered as the best conditions for phosphorus removal.
At pH values of 9 and 10, the recovery of Mg was significantly lower than that of phosphorus. For both samples, the efficiencies were always less than 80% (Figure 8). The greater recovery efficiency for phosphorus, compared to that detected for magnesium, suggests the precipitation of some other types of phosphorus compounds such as calcium phosphates [43,45,53]. The magnesium abatement quickly grew by increasing the pH to 11, reaching yields of around 90% (Figure 8). This is attributable to the formation of Mg(OH)2 at pH 11–12 that lead to the enhancement of Mg recovery.
For both mixtures, the removal of potassium slightly increased with the pH values ranging between 31–42%, without a clear effect of Mg/P ratio (Figure 9). The low efficiencies are attributable to the excess of potassium in the treating samples, relative to the amounts of phosphorus and magnesium. However, the residual K concentrations do not represent a drawback because potassium is not a hazardous element. For example, the Italian regulations do not establish any threshold value of K for the discharge of wastewaters.
The precipitate recovered from the tests conducted at pH 10 and Mg/P = 1 was analyzed by means of scanning electron microscopy. For samples from both mixture 1 and 2, the SEM images show the presence of crystals with a shape typical of that of pure magnesium potassium phosphate (Figure 10a,c). The EDS spectrum detected on these crystals proved that they are mainly composed of Mg, K, P, and O, with only trace amounts of Ca and Si (<4%). Moreover, according to EDS analysis (Figure 10b,d), the average mass of the elements was correspondent to a molar ratio of about Mg/K/P = 1/1/1.03, for mixture-1, and Mg/K/P = 1/1/1.06, for mixture-2, reasonably similar to the stoichiometric value of MPP (Mg/K/P = 1/1/1). The slightly greater presence of phosphorus with respect to the presence of magnesium and potassium suggests the formation of a low amount of calcium and phosphorus compounds, most likely as calcium phosphates [43,45,53].
Therefore, the experimental results proved the effectiveness of the proposed treatment in the removal of phosphorus and its recovery as magnesium potassium phosphate. Moreover, the identified operating conditions (pH = 10, Mg/P = 1) are particularly advantageous in the treatment of samples from SCWG, such as those of this study. In fact, after the gasification phase, the pH of the liquid phase reaches values between 10 and 11 (Table 2). This, clearly, avoids the addition of reactants to adjust the pH for MPP precipitation treatment. As highlighted, the addition of potassium sources is unnecessary and, according to the experimental results, the Mg/P ratio can be set to the theoretical value of 1, reducing the addition of magnesium reagents. All these aspects can limit the overall chemicals consumption. Finally, due to the previous SCWG treatment, the samples subjected to the P removal process had a very low content of suspended particles, which makes the liquid–solid separation of the produced MPP extremely easy. In fact, a simple sedimentation phase for 15 min allows the complete separation of the precipitate.

4. Conclusions

In the present work, a new integrated treatment was defined for the production of biofuels and the recovery of phosphorus compounds from agro-industrial residues. First of all, anaerobic co-digestion was carried out to produce biogas by exploiting raw waste mixtures. Afterward, the residual digestates were converted to syngas using SCWG. Finally, the liquid phases from SCWG were treated to recover the phosphorus content as MgKPO4⋅6H2O crystals.
The results of digestion tests proved the importance of properly selecting and mixing the substrates to achieve efficient biogas production. The excessive organic load and VFA/ALK ratio of mixture-2 negatively affected the digestion process. In this mixture, a low biogas yield of about 0.22L/gCODremoved was obtained, with a COD abatement only of 51%. On the contrary, the balanced properties of mixture-1 enable a remarkable level of biogas production, equal to 0.44 L/gCODremoved, with a high methane fraction of 74% and a COD removal of about 70%.
The results of SCWG tests demonstrated the feasibility of the direct gasification of the digestate. The gas composition was similar for both samples and the main gas constituents were H2, CH4, CO2 and CO. The feedstock load had an important role in syngas production. The gasification of the digestate from test mixture-2 showed higher efficiencies with a GGE = 56.5 g/kgCOD and a gas yield of 1.8 mol/kgTS. The complex and refractory organic compounds of the digestate of mixture-1, probably, reduced the SCWG performance. Regardless, satisfactory values of GGE = 31.0 g/kgCOD and a gas yield = 0.7 mol/kgTS were detected in this sample.
The results of precipitation tests defined a suitable process to efficiently recover the phosphorus content from the residual liquid phase of SCWG. With the identified operating conditions (pH = 10, Mg/P = 1), almost complete P removal and recovery were obtained. This process is particularly favorable because the alkaline pH of liquid from SCWG avoids the need for pH correction. Moreover, the addition of potassium sources was also unnecessary. These aspects notably reduce chemicals consumption. Finally, it was proven that the produced precipitate was composed of MgKPO4⋅6H2O crystals, a compound potentially reusable as slow-release fertilizer.
Therefore, the proposed integrated treatment could be a suitable approach to exploit agro-wastes because it can produce biofuels and valuable chemicals and generates a residual effluent with a very low polluting load. Regardless, the applicability of the overall process at full-scale plant and the economic evaluation require further investigations. Indeed, some aspects, such as the benefits that could be derived from the MPP production and from the exploitation of biofuels, must be examined.

Author Contributions

A.S. planned the work and the experiments and wrote the part concerning AD and phosphorus recovery; C.L. carried out the experiments of AD and phosphorus recovery; S.M. carried out the experiments and wrote the part of SCWG; A.M. conceived the experiments and supervised the work; V.C. revised the manuscript.

Funding

This research received no external funding.

Conflicts of Interest

The authors declare no conflicts of interest.

References

  1. Gontard, N.; Sonesson, U.; Birkved, M.; Majone, M.; Bolzonella, D.; Celli, A.; Angellier-Coussy, H.; Jang, G.-W.; Verniquet, A.; Broeze, J.; et al. A research challenge vision regarding management of agricultural waste in a circular bio-based economy. Crit. Rev. Environ. Sci. Technol. 2018, 1–41. [Google Scholar] [CrossRef]
  2. Carlini, M.; Mosconi, E.M.; Castellucci, S.; Villarini, M.; Colantoni, A. An economical evaluation of anaerobic digestion plants fed with organic agro-industrial wastes. Energies 2017, 10, 1165. [Google Scholar] [CrossRef]
  3. Hernández, D.; Riaño, B.; Coca, M.; García-González, M.C. Treatment of agro-industrial wastewater using microalgae–bacteria consortium combined with anaerobic digestion of the produced biomass. Bioresour. Technol. 2013, 135, 598–603. [Google Scholar] [CrossRef] [PubMed]
  4. Siciliano, A.; Stillitano, M.A.; De Rosa, S. Increase of the anaerobic biodegradability of olive mill wastewaters through a pre-treatment with hydrogen peroxide in alkaline conditions. Desal. Water. Treat. 2014, 55, 1735–1746. [Google Scholar] [CrossRef]
  5. Calabrò, P.S.; Fòlino, A.; Tamburino, V.; Zappia, G.; Zema, D.A. Increasing the tolerance of polyphenols of the anaerobic digestion of olive wastewater through microbial adaptation. Biosyst. Eng. 2018, 172, 19–28. [Google Scholar] [CrossRef]
  6. Fezzani, B.; Ben Cheickh, R. Two-phase anaerobic co-digestion of olive mill wastes in semi-continuous digesters at mesophilic temperature. Bioresour. Technol. 2010, 101, 1628–1634. [Google Scholar] [CrossRef] [PubMed]
  7. Siciliano, A.; Stillitano, M.A.; De Rosa, S. Biogas production from wet olive mill wastes pretreated with hydrogen peroxide in alkaline conditions. Renew. Energy 2016, 85, 903–916. [Google Scholar] [CrossRef]
  8. Juneja, A.; Ceballos, R.M.; Murthy, G.S. Effects of Environmental Factors and Nutrient Availability on the Biochemical Composition of Algae for Biofuels Production: A Review. Energies 2013, 6, 4607–4638. [Google Scholar] [CrossRef] [Green Version]
  9. Siciliano, A.; Stillitano, M.A.; Limonti, C. Energetic valorization of wet olive mill wastes through a suitable integrated treatment: H2O2 with lime and anaerobic digestion. Sustainability 2016, 8, 1150. [Google Scholar] [CrossRef]
  10. Zema, D.A.; Fòlino, A.; Zappia, G.; Calabrò, P.S.; Tamburino, V.; Zimbone, S.M. Anaerobic digestion of orange peel in a semi-continuous pilot plant: An environmentally sound way of citrus waste management in agro-ecosystems. Sci. Total Environ. 2018, 630, 401–408. [Google Scholar] [CrossRef]
  11. Khanal, S. Anaerobic Biotechnology for Bioenergy Production: Principles and Applications; Wiley-Blackwell: Ames, IA, USA, 2008. [Google Scholar]
  12. Roubík, H.; Mazancová, J.; Le Dinh, P.; Van Dinh, D.; Banout, J. Biogas quality across small-scale biogas plants: A case of central Vietnam. Energies 2018, 11, 1794. [Google Scholar] [CrossRef]
  13. Mehariya, S.; Patel, A.K.; Obulisamy, P.K.; Punniyakotti, E.; Wong, J.W.C. Co-digestion of food waste and sewage sludge for methane production: Current status and perspective. Bioresour. Technol. 2018. [Google Scholar] [CrossRef] [PubMed]
  14. Álvarez, J.A.; Otero, L.; Lema, J.M. A methodology for optimising feed composition for anaerobic co-digestion of agro-industrial wastes. Bioresour. Technol. 2010, 101, 1153–1158. [Google Scholar] [CrossRef] [PubMed]
  15. Zahan, Z.; Othman, M.Z.; Muster, T.H. Anaerobic digestion/co-digestion kinetic potentials of different agro-industrial wastes: A comparative batch study for C/N optimisation. Waste Manag. 2018, 71, 663–674. [Google Scholar] [CrossRef] [PubMed]
  16. Keucken, A.; Habagil, M.; Batstone, D.; Jeppsson, U.; Arnell, M. Anaerobic Co-Digestion of Sludge and Organic Food Waste—Performance, Inhibition, and Impact on the Microbial Community. Energies 2018, 11, 2325. [Google Scholar] [CrossRef]
  17. Goberna, M.; Podmirseg, S.M.; Waldhuber, S.; Knapp, B.A.; García, C.; Insam, H. Pathogenic bacteria and mineral N in soils following the land spreading of biogas digestates and fresh manure. Appl. Soil Ecol. 2011, 49, 18–25. [Google Scholar] [CrossRef]
  18. Codignole Luz, F.; Volpe, M.; Fiori, L.; Manni, A.; Cordiner, S.; Mulone, V.; Rocco, V. Spent coffee enhanced biomethane potential via an integrated hydrothermal carbonization-anaerobic digestion process. Bioresour. Technol. 2018, 256, 102–109. [Google Scholar] [CrossRef]
  19. Basu, P.; Mettanant, V. Biomass Gasification in Supercritical Water—A Review. Int. J. Chem. React. Eng. 2009, 7. [Google Scholar] [CrossRef]
  20. Nanda, S.; Isen, J.; Dalai, A.K.; Kozinski, J.A. Gasification of fruit wastes and agro-food residues in supercritical water. Energy Convers. Manag. 2016, 110, 296–306. [Google Scholar] [CrossRef]
  21. Amrullah, A.; Matsumura, Y. Supercritical water gasification of sewage sludge in continuous reactor. Bioresour. Technol. 2018, 249, 276–283. [Google Scholar] [CrossRef]
  22. Molino, A.; Larocca, V.; Chianese, S.; Musmarra, D. Biofuels Production by Biomass Gasification: A Review. Energies 2018, 11, 811. [Google Scholar] [CrossRef]
  23. Kruse, A. Supercritical water gasification. Biofuels Bioprod. Biorefining 2008, 2, 415–437. [Google Scholar] [CrossRef]
  24. Yakaboylu, O.; Harinck, J.; Smit, K.G.; de Jong, W. Supercritical Water Gasification of Biomass: A Literature and Technology Overview. Energies 2015, 8, 859–894. [Google Scholar] [CrossRef] [Green Version]
  25. Matsumura, Y.; Minowa, T. Fundamental design of a continuous biomass gasification process using a supercritical water fluidized bed. Int. J. Hydrogen Energy 2004, 29, 701–707. [Google Scholar] [CrossRef]
  26. Molino, A.; Nanna, F.; Villone, A.; Iovane, P.; Tarquini, P.; Migliori, M.; Giordano, G.; Braccio, G. Pressure and time effect over semi-continuous gasification of zootechnical sludge near critical condition of water for green chemicals production. Fuel 2014, 136, 172–176. [Google Scholar] [CrossRef]
  27. Molino, A.; Migliori, M.; Blasi, A.; Davoli, M.; Marino, T.; Chianese, S.; Catizone, E.; Giordano, G. Municipal waste leachate conversion via catalytic supercritical water gasification process. Fuel 2017, 206, 155–161. [Google Scholar] [CrossRef]
  28. Chianese, S.; Loipersböck, J.; Malits, M.; Rauch, R.; Hofbauer, H.; Molino, A.; Musmarra, D. Hydrogen from the high temperature water gas shift reaction with an industrial Fe/Cr catalyst using biomass gasification tar rich synthesis gas. Fuel Process. Technol. 2015, 132, 39–48. [Google Scholar] [CrossRef]
  29. Molino, A.; Larocca, V.; Valerio, V.; Martino, M.; Marino, T.; Rimauro, J.; Casella, P. Biofuels and Bio-based Production via Supercritical Water Gasification of Peach Scraps. Energy Fuels 2016, 30, 10443–10447. [Google Scholar] [CrossRef]
  30. Jahirul, M.I.; Rasul, M.G.; Chowdhury, A.A.; Ashwath, N. Biofuels Production through Biomass Pyrolysis —A Technological Review. Energies 2012, 5, 4952–5001. [Google Scholar] [CrossRef] [Green Version]
  31. Panepinto, D.; Fiore, S.; Genon, G.; Acri, M. Thermal valorization of sewer sludge: Perspectives for large wastewater treatment plants. J. Clean. Prod. 2016, 137, 1323–1329. [Google Scholar] [CrossRef]
  32. Molino, A.; Giordano, G.; Migliori, M.; Lauro, V.; Santarcangelo, G.; Marino, T.; Larocca, V.; Tarquini, P. Process Innovation Via Supercritical Water Gasification to Improve the Conventional Plants Performance in Treating Highly Humid Biomass. Waste Biomass Valorization 2016, 7, 1289–1295. [Google Scholar] [CrossRef]
  33. Gasafi, E.; Reinecke, M.-Y.; Kruse, A.; Schebek, L. Economic analysis of sewage sludge gasification in supercritical water for hydrogen production. Biomass Bioenergy 2008, 32, 1085–1096. [Google Scholar] [CrossRef]
  34. Gong, M.; Zhu, W.; Xu, Z.R.; Zhang, H.W.; Yang, H.P. Influence of sludge properties on the direct gasification of dewatered sewage sludge in supercritical water. Renew. Energy 2014, 66, 605–611. [Google Scholar] [CrossRef]
  35. Gorazda, K.; Tarko, B.; Werle, S.; Wozrek, Z. Sewage sludge as a fuel and raw material for phosphorus recovery: Combined process of gasification and P extraction. Waste Manag. 2018, 73, 404–415. [Google Scholar] [CrossRef] [PubMed]
  36. Acelas, N.Y.; López, D.P.; Brilman, D.W.F.; Kersten, S.R.A.; Kootstra, A.M.J. Supercritical water gasification of sewage sludge: Gas production and phosphorus recovery. Bioresour. Technol. 2014, 174, 167–175. [Google Scholar] [CrossRef] [PubMed]
  37. Xu, K.; Wang, C.; Liu, H.; Qian, Y. Simultaneous removal of phosphorus and potassium from synthetic urine through the precipitation of magnesium potassium phosphate hexahydrate. Chemosphere 2011, 84, 207–212. [Google Scholar] [CrossRef]
  38. Wilsenach, J.A.; Schuurbiers, C.A.H.; van Loosdrecht, M.C.M. Phosphate and potassium recovery from source separated urine through struvite precipitation. Water Res. 2007, 41, 458–466. [Google Scholar] [CrossRef]
  39. Siciliano, A.; De Rosa, S. Recovery of ammonia in digestates of calf manure through a struvite precipitation process using unconventional reagents. Environ. Technol. 2014, 35, 841–850. [Google Scholar] [CrossRef]
  40. Karabegovic, L.; Uldal, M.; Werker, A.; Morgan-Sagastume, F. Phosphorus recovery potential from a waste stream with high organic and nutrient contents via struvite precipitation. Environ. Technol. 2013, 34, 871–883. [Google Scholar] [CrossRef]
  41. Kabdaşli, I.; Tünay, O.; Özcan, P. Application of struvite precipitation coupled with biological treatment to slaughterhouse wastewaters. Environ. Technol. 2009, 30, 1095–1101. [Google Scholar] [CrossRef] [Green Version]
  42. Battistoni, P.; Boccadoro, R.; Fatone, F.; Pavan, P. Auto-Nucleation and Crystal Growth of Struvite in a Demonstrative Fluidized Bed Reactor (FBR). Environ. Technol. 2010, 26, 975–982. [Google Scholar] [CrossRef] [PubMed]
  43. Siciliano, A. Assessment of fertilizer potential of the struvite produced from the treatment of methanogenic landfill leachate using low-cost reagents. Environ. Sci. Pollut. Res. 2016, 23, 5949–5959. [Google Scholar] [CrossRef] [PubMed]
  44. Korchef, A.; Saidou, H.; Ben Amor, M. Phosphate recovery through struvite precipitation by CO2 removal: Effect of magnesium, phosphate and ammonium concentrations. J. Hazard. Mater. 2011, 186, 602–613. [Google Scholar] [CrossRef] [PubMed]
  45. Siciliano, A.; Stillitano, M.A.; Limonti, C.; Marchio, F. Ammonium removal from landfill leachate by means of multiple recycling of struvite residues obtained through acid decomposition. Appl. Sci. 2016, 6, 345. [Google Scholar] [CrossRef]
  46. Quintana, M.; Colmenarejo, M.F.; Barrera, J.; García, G.; García, E.; Bustos, A. Use of a byproduct of magnesium oxide production to precipitate phosphorus and nitrogen as struvite from wastewater treatment liquors. J. Agric. Food Chem. 2004, 52, 294–299. [Google Scholar] [CrossRef] [PubMed]
  47. Siciliano, A.; Ruggiero, C.; De Rosa, S. A new integrated treatment for the reduction of organic and nitrogen loads in methanogenic landfill leachates. Process Saf. Environ. Prot. 2013, 91, 311–320. [Google Scholar] [CrossRef]
  48. Gunay, A.; Karadag, D.; Tosun, I.; Ozturk, M. Use of magnesit as a magnesium source for ammonium removal from leachate. J. Hazard. Mater. 2008, 156, 619–623. [Google Scholar] [CrossRef]
  49. APHA. Standard Methods for the Examination of Water and Wastewater, 20th ed.; APHA: Washington, DC, USA, 1998. [Google Scholar]
  50. Metcalf & Eddy. Wastewater Engineering: Treatment and Reuse, 4th ed.; McGraw-Hill: New York, NY, USA, 2003. [Google Scholar]
  51. Siciliano, A.; De Rosa, S. Experimental formulation of a kinetic model describing the nitrification process in biological aerated filters filled with plastic elements. Environ. Technol. 2015, 36, 293–301. [Google Scholar] [CrossRef]
  52. Siciliano, A.; De Rosa, S. An experimental model of COD abatement in MBBR based on biofilm growth dynamic and on substrates’ removal kinetics. Environ. Technol. 2016, 37, 2058–2071. [Google Scholar] [CrossRef]
  53. Le Corre, K.S.; Valsami-Jones, E.; Hobbs, P.; Parsons, S.A. Impact of calcium on struvite crystal size, shape and purity. J. Cryst. Growth. 2005, 283, 514–522. [Google Scholar] [CrossRef] [Green Version]
Figure 1. Scheme of the developed integrated treatment.
Sustainability 11 00052 g001
Figure 2. Aliquots of mixture-1 (a) and mixture-2 (b) subjected to digestion test.
Sustainability 11 00052 g002
Figure 3. Biogas production during co-digestion tests.
Sustainability 11 00052 g003
Figure 4. Composition of gas produced from the digestates of mixture-1 and mixture-2.
Sustainability 11 00052 g004
Figure 5. Yields of primary gas products detected in the digestates from mixture-1 and mixture-2.
Sustainability 11 00052 g005
Figure 6. Global gasification efficiency and total gas yield detected in digestates of mixture-1 and mixture-2.
Sustainability 11 00052 g006
Figure 7. Phosphorus removal in the liquid phase of SCWG from mixture-1 (a) and from mixture-2 (b).
Sustainability 11 00052 g007
Figure 8. Magnesium removal in the liquid phase of SCWG from mixture-1 (a) and from mixture-2 (b).
Sustainability 11 00052 g008
Figure 9. Potassium removal in the liquid phase of SCWG from mixture-1 (a) and from mixture-2 (b).
Sustainability 11 00052 g009
Figure 10. SEM images of precipitate from mixture-1 (a) and mixture-2 (c); EDS spectrum of precipitate from mixture-1 (b) and mixture-2 (d).
Sustainability 11 00052 g010
Table 1. Characteristics of agro-industrial wastes and activated sludge used in this study.
ParameterType and Characteristics of Agro-Industrial Wastes
Tomato WasteKiwifruit WasteAsparagus WastePotato WasteCattle ManureActivated Sludge
pH4.43.26.46.07.26.7
Conductivity [mS/cm]8.414.417.813.834.12.2
COD [g/L]88.0236.9105.9208.9104.8115.4
TS [g/L]87.5222.981.4180.893.198.9
VS [g/L]78.0204.574.3170.173.981.3
TS [%TQ]8.7522.38.118.19.39.9
VS [%TQ]7.820.47.417.07.48.1
VS [%TS]89.191.791.39479.382.2
TKN [g/L]1.673.104.513.544.921.63
N-NH4+ [g/L]0.3420.3600.4240.5881.2590.693
P-PO43− [g/L]0.5740.6971.1740.3800.9080.702
SO42− [g/L]0.4800.3171.5750.2543.1351.207
Alkalinity [gCaCO3/L]6.2055.1609.29214.77728.0551.506
VFA [g CH3COOH/L]4.0554.0497.44216.80617.8142.962
VFA/Alkalinity0.650.780.81.130.0.631.97
COD/N52.776.423.559.021.370.67
N/P2.94.43.89.35.42.3
Note: Measurements were executed three times, and the mean value was considered. The relative standard deviation was less than 5% in all measurements.
Table 2. Initial and final chemical composition of test mixtures subjected to anaerobic digestion (AD) and supercritical wet gasification (SCWG).
ParameterMixture 1 Mixture 2
Mixture fed to ADDigestate from ADLiquid from SCWGMixture fed to ADDigestate from ADLiquid from SCWG
pH7.28.211.97.55.011.88
Conductivity [mS/cm]11.516.331.712.418.234.5
COD [g/L]100.830.40.150170.182.50.181
TS [g/L]89.745.928.5151.595.130.7
VS [g/L]81.420.50.14135.157.30.17
TS [%TQ]8.94.62.8515.159.53.07
VS [%TQ]8.142.00.01413.55.70.017
VS [%TS]90.744.50.589.260.250.55
TKN [g/L]2.542.25-2.8762.68-
N-NH4+ [g/L]0.581.468-0.5761.196-
P-PO43− [g/L]0.8261.1280.4620.6040.9880.503
SO42− [g/L]1.3731.3100.5920.7670.6020.534
K+ [g/L]1.641.711.812.582.612.82
Mg2+ [g/L]0.390.320.0360.380.410.028
Ca2+ [g/L]0.440.370.070.490.550.08
Alkalinity [gCaCO3/L]20.17117.69318.4814.84315.13019.33
VFA [gCH3COOH/L]6.1443.489-8.26061.461-
VFA/ALK0.300.19-0.554.06-
COD/N39.8713.51-59.130.8-
N/P3.072.0-4.762.71-
Note Measurements were executed three times, and the mean value was considered. The relative standard deviation was less than 5% in all measurements.

