Article

Assessment of the Spatial Dynamics and Interactions among Multiple Ecosystem Services to Promote Effective Policy Making across Mediterranean Island Landscapes

by
Roxanne Suzette Lorilla
1,*,
Konstantinos Poirazidis
2,
Stamatis Kalogirou
1,
Vassilis Detsis
3 and
Aristotelis Martinis
2
1
Department of Geography, Harokopio University, El. Venizelou 70, 176 76 Kallithea, Greece
2
Department of Environmental Technology, Technological Educational Institute of Ionian Islands, Panagoula, 29 100 Zakynthos, Greece
3
Department of Home Economics and Ecology, Harokopio University, El. Venizelou 70, 176 76 Kallithea, Greece
*
Author to whom correspondence should be addressed.
Sustainability 2018, 10(9), 3285; https://doi.org/10.3390/su10093285
Submission received: 26 August 2018 / Revised: 8 September 2018 / Accepted: 11 September 2018 / Published: 14 September 2018

Abstract

:
To manage multiple ecosystem services (ES) effectively, it is essential to understand how the dynamics of ES maintain healthy ecosystems to avoid potential negative impacts on human well-being in the context of sustainable development. In particular, the Ionian Islands in the central Mediterranean are characterized by high natural, ecological, and recreational value; however, the intensification of human activities over time has resulted in the loss of natural ecosystems, which might have negatively impacted ES. Here, we aimed to assess and understand the spatiotemporal dynamics of ES supply and how these components interact across the Ionian Islands to optimize future ES provision and mitigate current trade-offs. We quantified multiple ecosystem services and analyzed their interactions at a temporal scale across the four prefectures of the Ionian Islands. Seven ES were quantified covering all three ES sections (provisioning, regulating and maintenance, and cultural) of the Common International Classification of Ecosystem Services (CICES). ES interactions were investigated by analyzing ES relationships, identifying ES bundles (sets of ES that repeatedly occur together across space and time), and specifying ES occurrence within bundles. The three ES groups exhibited similar patterns on some islands, but differed on islands with areas of high recreation in parallel to low provisioning and regulating ES. Temporal variations showed both stability and changes to the supply of ES, as well as in the interactions among them. Different patterns among the islands were caused by the degree of mixing between natural vegetation and olive orchards. This study identified seven ES bundles that had distinct compositions and magnitudes, with both unique and common bundles being found among the islands. The olive grove bundle delivered the most ES, while the non-vegetated bundle delivered negligible amounts of ES. Spatial and temporal variation in ES appear to be determined by agriculture, land abandonment, and increasing tourism, as well as the occurrence of fires. Knowledge about the spatial dynamics and interactions among ES could provide information for stakeholders and decision-making processes to develop appropriate sustainable management of the ecosystems on the Ionian Islands to secure ecological, social, and economic resilience.

1. Introduction

The sustainability of economic growth strongly depends on maintaining ecosystem services (ES), a healthy environment, and cohesive societies [1]. Human well-being and sustainable development are dependent on improving the management of natural ecosystems, which secure their long-term sustainable use through conserving them [2,3]. Mapping and assessing ES represent important approaches towards understanding the link between ecosystems and human society, which, in turn, facilitate decision-making and management based on sustainable development strategies [4,5,6]. A key challenge for ecosystem management is handling multiple ES across landscapes [7], as certain actions enhance the supply of some ES, while inhibiting others [8]. Addressing this challenge requires the identification of synergies and tradeoffs that exist among ES at different scales to promote sustainability in landscape management [9,10]. However, ES interactions are not constant over time, resulting in temporal changes being overlooked in ES-based approaches, which might lead to the misrepresentation of their synergies, leading to future trade-offs [11,12].
Raudsepp-Hearne et al. [10] first introduced the concept of identifying interactions among ES by analyzing the spatial pattern of ES bundles, with this concept being subsequently implemented by many researchers [9,13,14]. An ES bundle refers to a set of interacting (positively or negatively) ES that repeatedly occur across a spatial and temporal scale [8]. Renard [11] used the ES bundle approach to explore the importance of historical dynamics (35-year dataset) in a mixed-use landscape to identify processes and drivers behind the changing relationships among ES. Tomscha and Gergel [12] also demonstrated the importance of monitoring long-term interactions among ES to manage heterogeneous landscapes. In order to avoid future impacts on the provision of benefits to society, it is inevitable to identify possible conflicts among ecosystem services across space and time [11,12,15]. For example, Sutherland et al. [16] showed the utility of monitoring the long-term recovery of ES from timber harvest to maintain multifunctional forests. Furthermore, Koch et al. [17] showed that a lack of information on the temporal and spatial variability of coastal characteristics generates additional management problems when protecting coastal areas. Despite there being a wealth of literature mapping and quantifying the interactions of ES, a recent literature review [18] showed that few studies have investigated the ES bundles of island ecosystems, which is important to identify management practices optimizing or negatively affecting the potential of island landscapes to supply ES.
Mediterranean ecosystems deliver a diverse flow of ES due to the complex relationship between socio-cultural and ecological processes [19,20]. The high diversity of ecosystems in the Mediterranean region is the result of a long history of human activity [21]. However, human populations, along with high consumption levels, have increased rapidly over the last century, resulting in the depletion in the availability of ES [22]. In addition, changes to land use have been recognized as a primary driver affecting ecosystems and their services [23]. These changes are driven by various socio-economic and environmental factors, such as population growth, urban and tourism development, land abandonment or intensification, grazing intensity, and the occurrence of wildfires [22,24,25,26,27,28,29]; thus, extreme changes could lead to severe losses in the provision of ES.
Especially for Mediterranean islands, which are the number one tourism destination in the world, tourism itself has been one of the most important sectors of the local economies [30,31,32]. However, space- and time-concentrated tourism may show adverse effects on the environment [33]. In particular, mass-tourism often has severe consequences, due to high demand on accommodation and entertainment facilities [32], resulting in urban and infrastructure development [34]. Consequently, while tourism depends on high natural and cultural values, it is also the main threat to natural ecosystems and to the social wellbeing they support [32,33,35,36]. The islands of the Mediterranean region are also characterized by high natural, ecological, and recreational value, while supporting hotspots of global biodiversity; however the limited resources, area size and remoteness from mainland areas (isolation) are some of the main disadvantages of their physical environment [37]. Given the vulnerability of islands, sustainable management must enhance the ability of ecosystems to recover from either human or environmental disturbance [38]. Through understanding why it is important to sustain healthy ecosystems, with such high dynamic nature and where increasing tourism and intense land use changes occur, stakeholders and managers might be willing to secure ES provisions that ultimately benefit human wellbeing. This approach might allow stakeholders and managers to maintain or re-design spatial management policies and to meet several important EU initiatives. Such policies include the objectives of Action 5 of the European Union’s Biodiversity Strategy to 2020 and the Sustainable Development Goals (SDGs) of the 2030 Agenda, to halt biodiversity loss and maintain healthy ecosystems under the principals of sustainable development.
In this context, this study focuses on assessing the spatial and temporal dynamics of ES supply and their interactions across the Ionian Islands to optimize future ES provision and to mitigate current trade-offs. Further, we suggest possible implications of our results in policy-making processes that aim to sustain well-functioning ecosystems through providing a diverse set of ES.

2. Materials and Methods
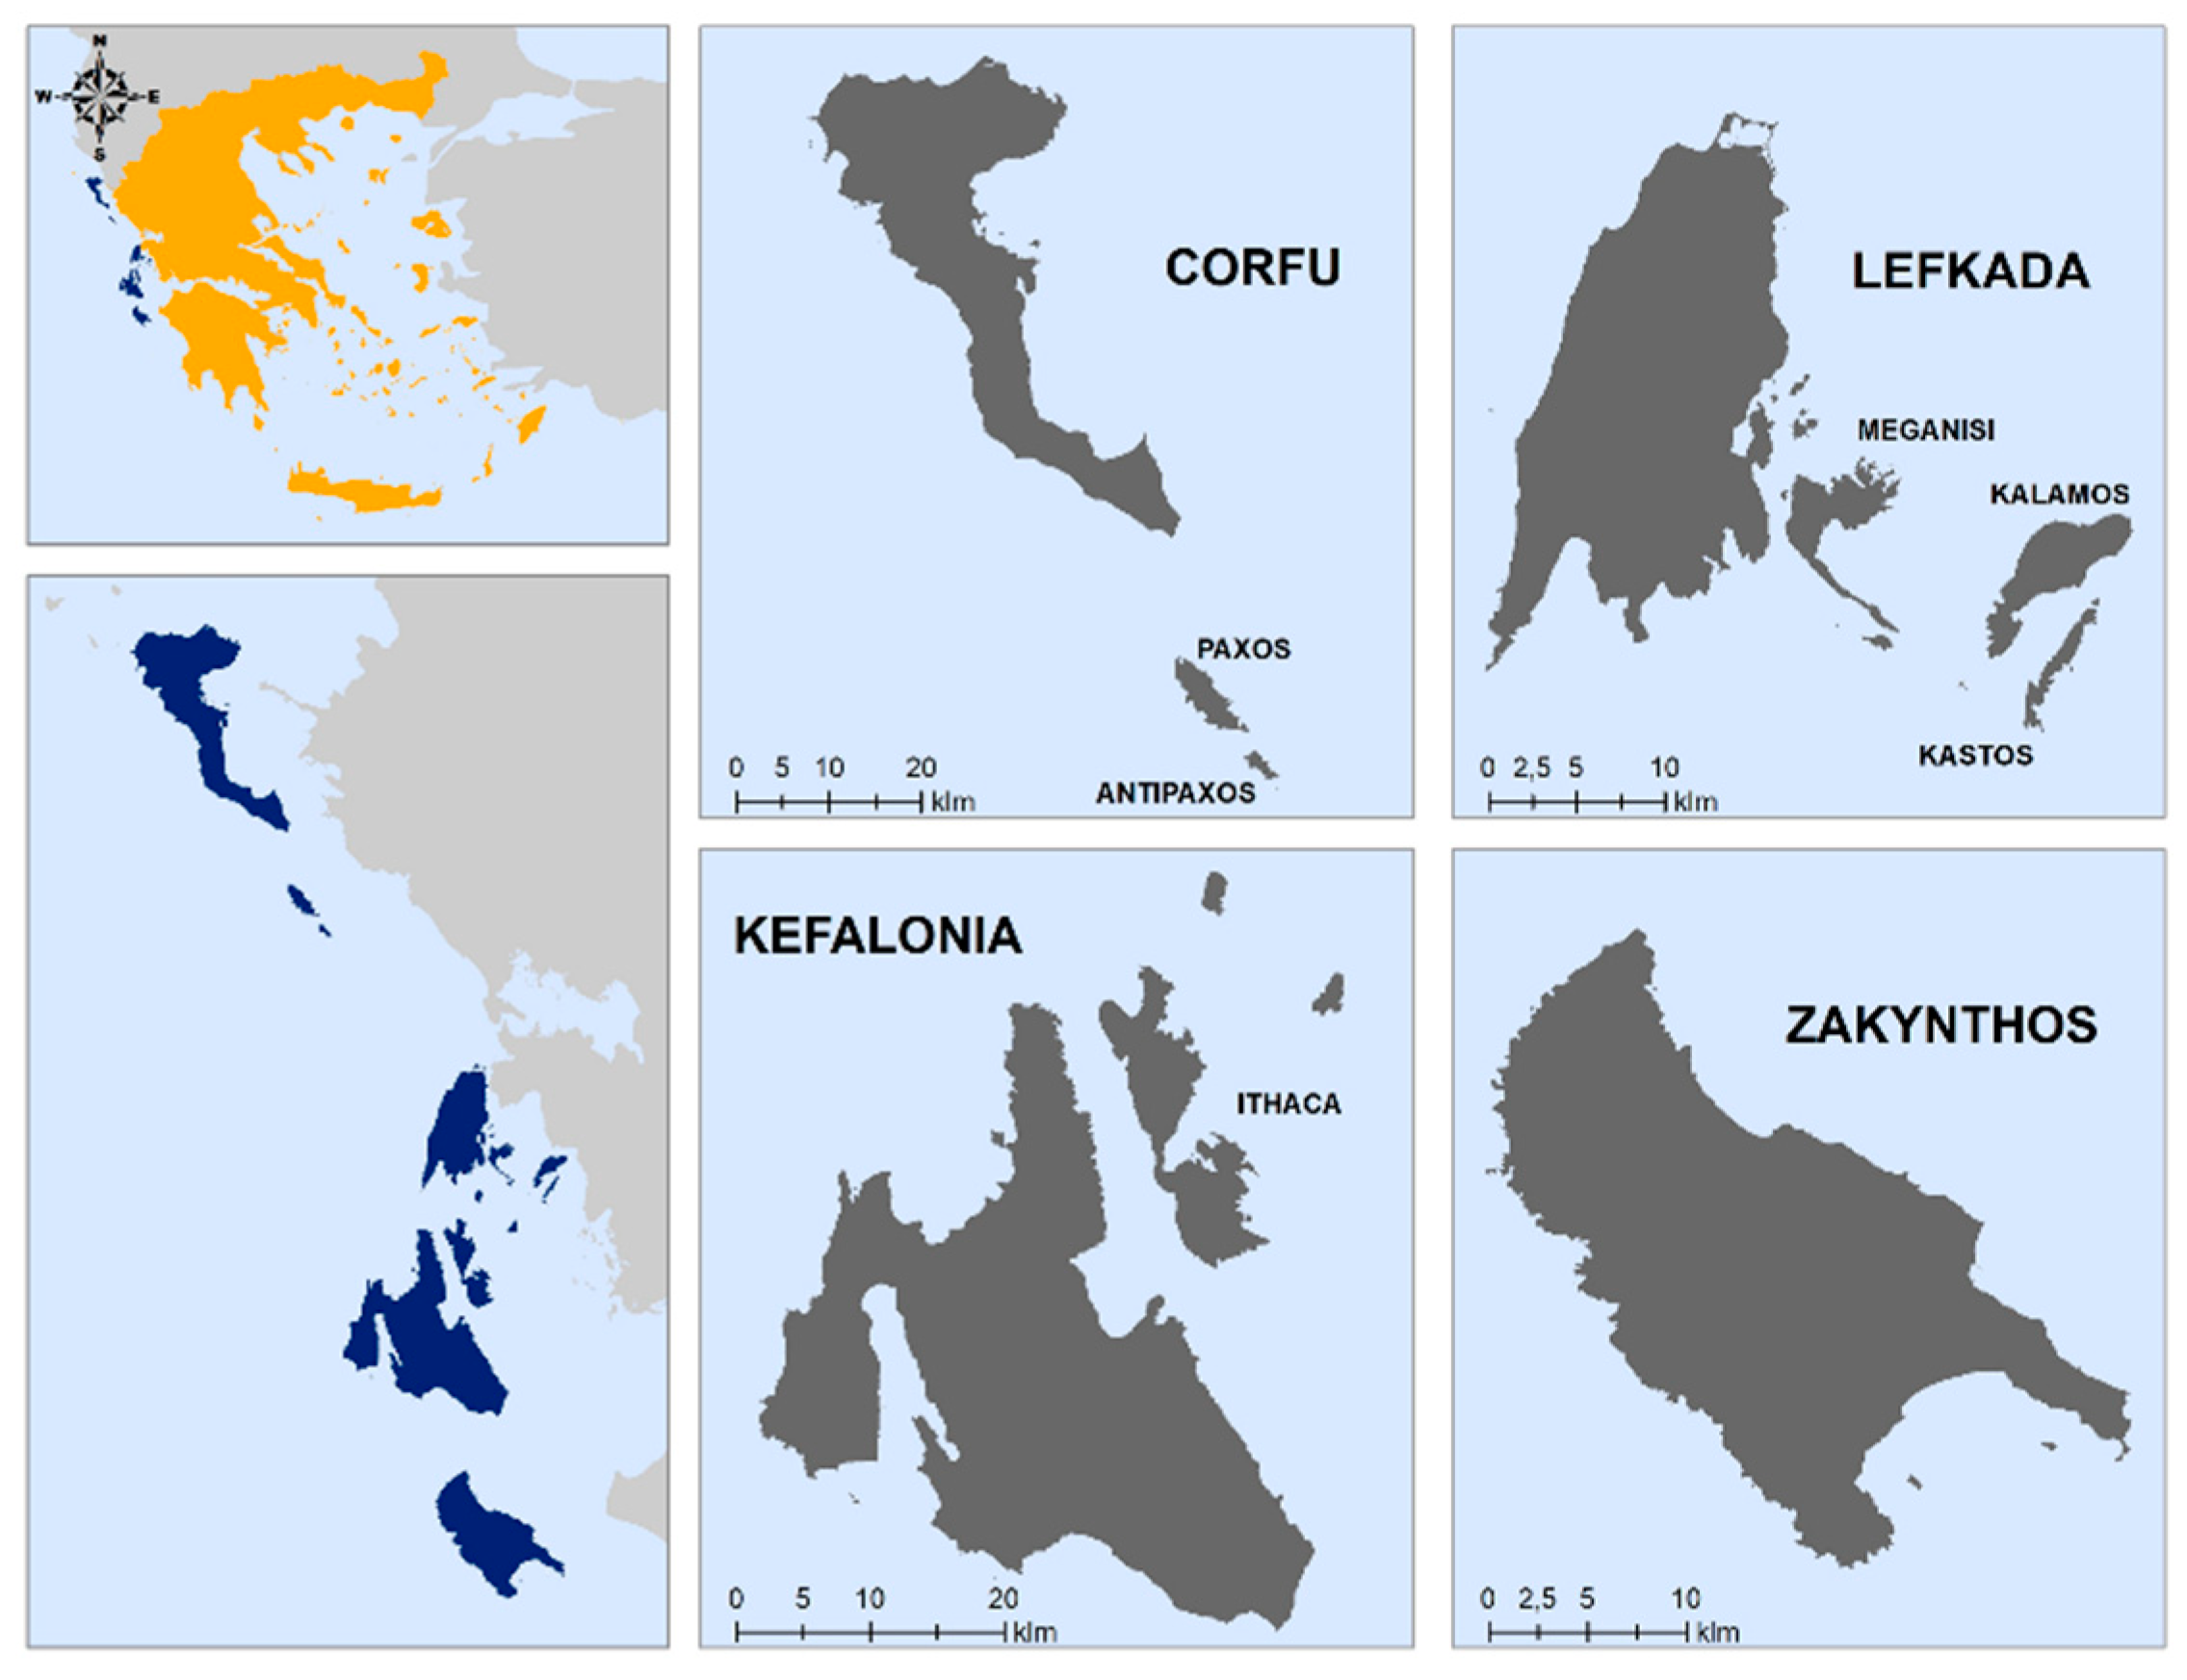
2.1. Study Area

The study area encompassed the region of the Ionian Islands, which is located in Western Greece (Figure 1). In terms of administrative boundaries, the region consists of four prefectures each of which contain a main Island and some islets. The region covers an area of 2278 km2, wherein Corfu, Lefkada, Kefalonia, and Zakynthos cover 640, 355, 878, and 405 km2, respectively. These Islands are characterized by high relief landscapes, with elevations reaching up to 1630 m. The local climate is Mediterranean, consisting of mild–humid winters and warm–dry summers. The geology mainly consists of limestone, except for Corfu, which is dominated by Neogene formations and Quaternary deposits [39]. The primary vegetation is characterized by pine forests, olive groves, and other vegetation types, such as transitional and sparse vegetation [40]. The Ionian Islands encompass 14 protected areas under the Natura 2000 Network with natural characteristics and ecological features, such as the presence of nesting habitat for the loggerhead sea turtle Caretta caretta [41]. Tourism is one of the most important sectors sustaining the economy of this region [42,43,44,45].

2.2. Mapping Ecosystem Services

A set of ecosystem services was selected from the Common International Classification of Ecosystem Services—CICES [46,47], based on the value of estimated ES in regional policy-making processes of the Ionian Islands, as well as data available throughout the entire study region. The list consisted of seven ES and covered all ES sections/groups. Specifically, three ES were selected for Provisioning ES, three for Regulating and Maintenance ES, and one for Cultural ES (Table 1). The CICES framework has been widely adopted by the ES community, as it provides a flexible and hierarchical tool that may be adapted to the specific needs of the different regions [47]. The mapping and quantification of ES was implemented for the 1985–2015 period, with a 10-year time step.

2.2.1. Provisioning Services

Provisioning ES are all nutritional, material, and energetic outputs from living systems [46]. Cultivated crops (CC) represent the production of cultivated plants or agricultural produce for human or animal consumption as food, fiber, or a source of energy [10,54]. Materials from timber (MT) represent the products from trees harvested from natural forests and plantations [54]. Plant-based resources (PR) represent the capacity of ecosystems for energy production, which was estimated using the enhanced vegetation index (EVI) (Equation (1)) from Landsat satellite images. The EVI is used as an indicator of productivity and for vegetation monitoring due to its sensitivity to high biomass [55,56,57].
EVI = G × NIR R NIR + C 1 × R C 2 × B + L
where NIR/R/B are atmospherically corrected, or partially atmosphere corrected, surface reflectance in near-infrared, red, and blue bands, respectively. L is the canopy background adjustment. G is a gain factor. C1 and C2 are the coefficients of the aerosol resistance term, which uses the blue band to correct for aerosol influences in the red band.

2.2.2. Regulating and Maintenance Services

Regulating and Maintenance ES include the ways in which ecosystems control or modify the biotic and abiotic parameters of the environment to improve human well-being [46,58,59]. Erosion prevention (EP) represents the capacity of ecosystems to prevent erosion, and is calculated using the soil erosion prevention framework (Equation (2)) by Guerra et al. [60].
Es = Y β e
where Es represents the actual ecosystem service provision (tons of soil not eroded), Y represents the structural impact (Y = R * LS * K), βe represents the mitigated impact (βe = Y * a, where a = C and Es = 1 − a), R represents the rainfall erosivity, LS represents the topographic factor, K represents the soil erodibility, and C represents the vegetation cover factor.
Climate regulation (CR) represents the carbon storage values [61], which are assigned to each land cover category and are used as a proxy to estimate the capacity of vegetation to contribute towards mitigating climate change. Maintenance of Nursery Population and Habitats (NS) represents the suitable habitats for plant and animal nurseries and reproduction [46,62], which can be estimated with the landscape metric Shannon’s diversity index (SHDI) [63], using land cover data and the FRAGSTATS software. FRAGSTATS is a computer software program designed to compute a wide variety of landscape metrics for categorical map patterns.

2.2.3. Cultural Services

Recreation (RC) represents the combination of recreation-related indicators that are used to estimate recreation potential. Nature attractiveness for outdoor recreation is mainly affected by naturalness [64,65], relief differencing [66,67], landscape diversity [68,69], and the existence of protected areas [54,70].
Specifically, naturalness is calculated using the naturalness evaluation index (NEI) (Equation (3)) [71,72], in which the land cover data were reclassified into four categories (high natural systems, semi-natural systems, agricultural systems, and artificial systems):
NEI = C 1 + 2 × C 2 + 3 × C 3 3 × ( C 0 + C 1 + C 2 + C 3 )
where C0 is the area covered by artificial systems, C1 is the area covered by agricultural systems, C2 is the area covered by semi-natural systems, and C3 is the area covered by high naturalness systems. NEI ranges from 0 (the landscape reaches a maximum artificial status) to 1 (where the landscape reaches the highest naturalness condition).
Relief differencing was calculated using the geodiversity index (diversity of geomorphological features) proposed by Benito-Calvo et al. [73]. First, 10 different geomorphological features were calculated with an unsupervised classification (ISODATA) based on multi-layer surface variables (elevation, slope, curvature, and roughness) of an ASTER (advanced space-borne thermal emission and reflection radiometer) Global Digital Elevation Model (30 m). The ISODATA classification algorithm refers to an iterative self-organizing data analysis technique and was used to cluster the data elements into different classes [74]. Second, geomorphological features were used to estimate SHDI with FRAGSTATS for measuring the geodiversity index.
These four indicators were normalized and assimilated to estimate the recreation supply. The importance of each indicator was specified using the analytical hierarchy process [75], to estimate specific weights, where naturalness had the highest weight, followed by geodiversity, landscape diversity, and the presence of protected areas.

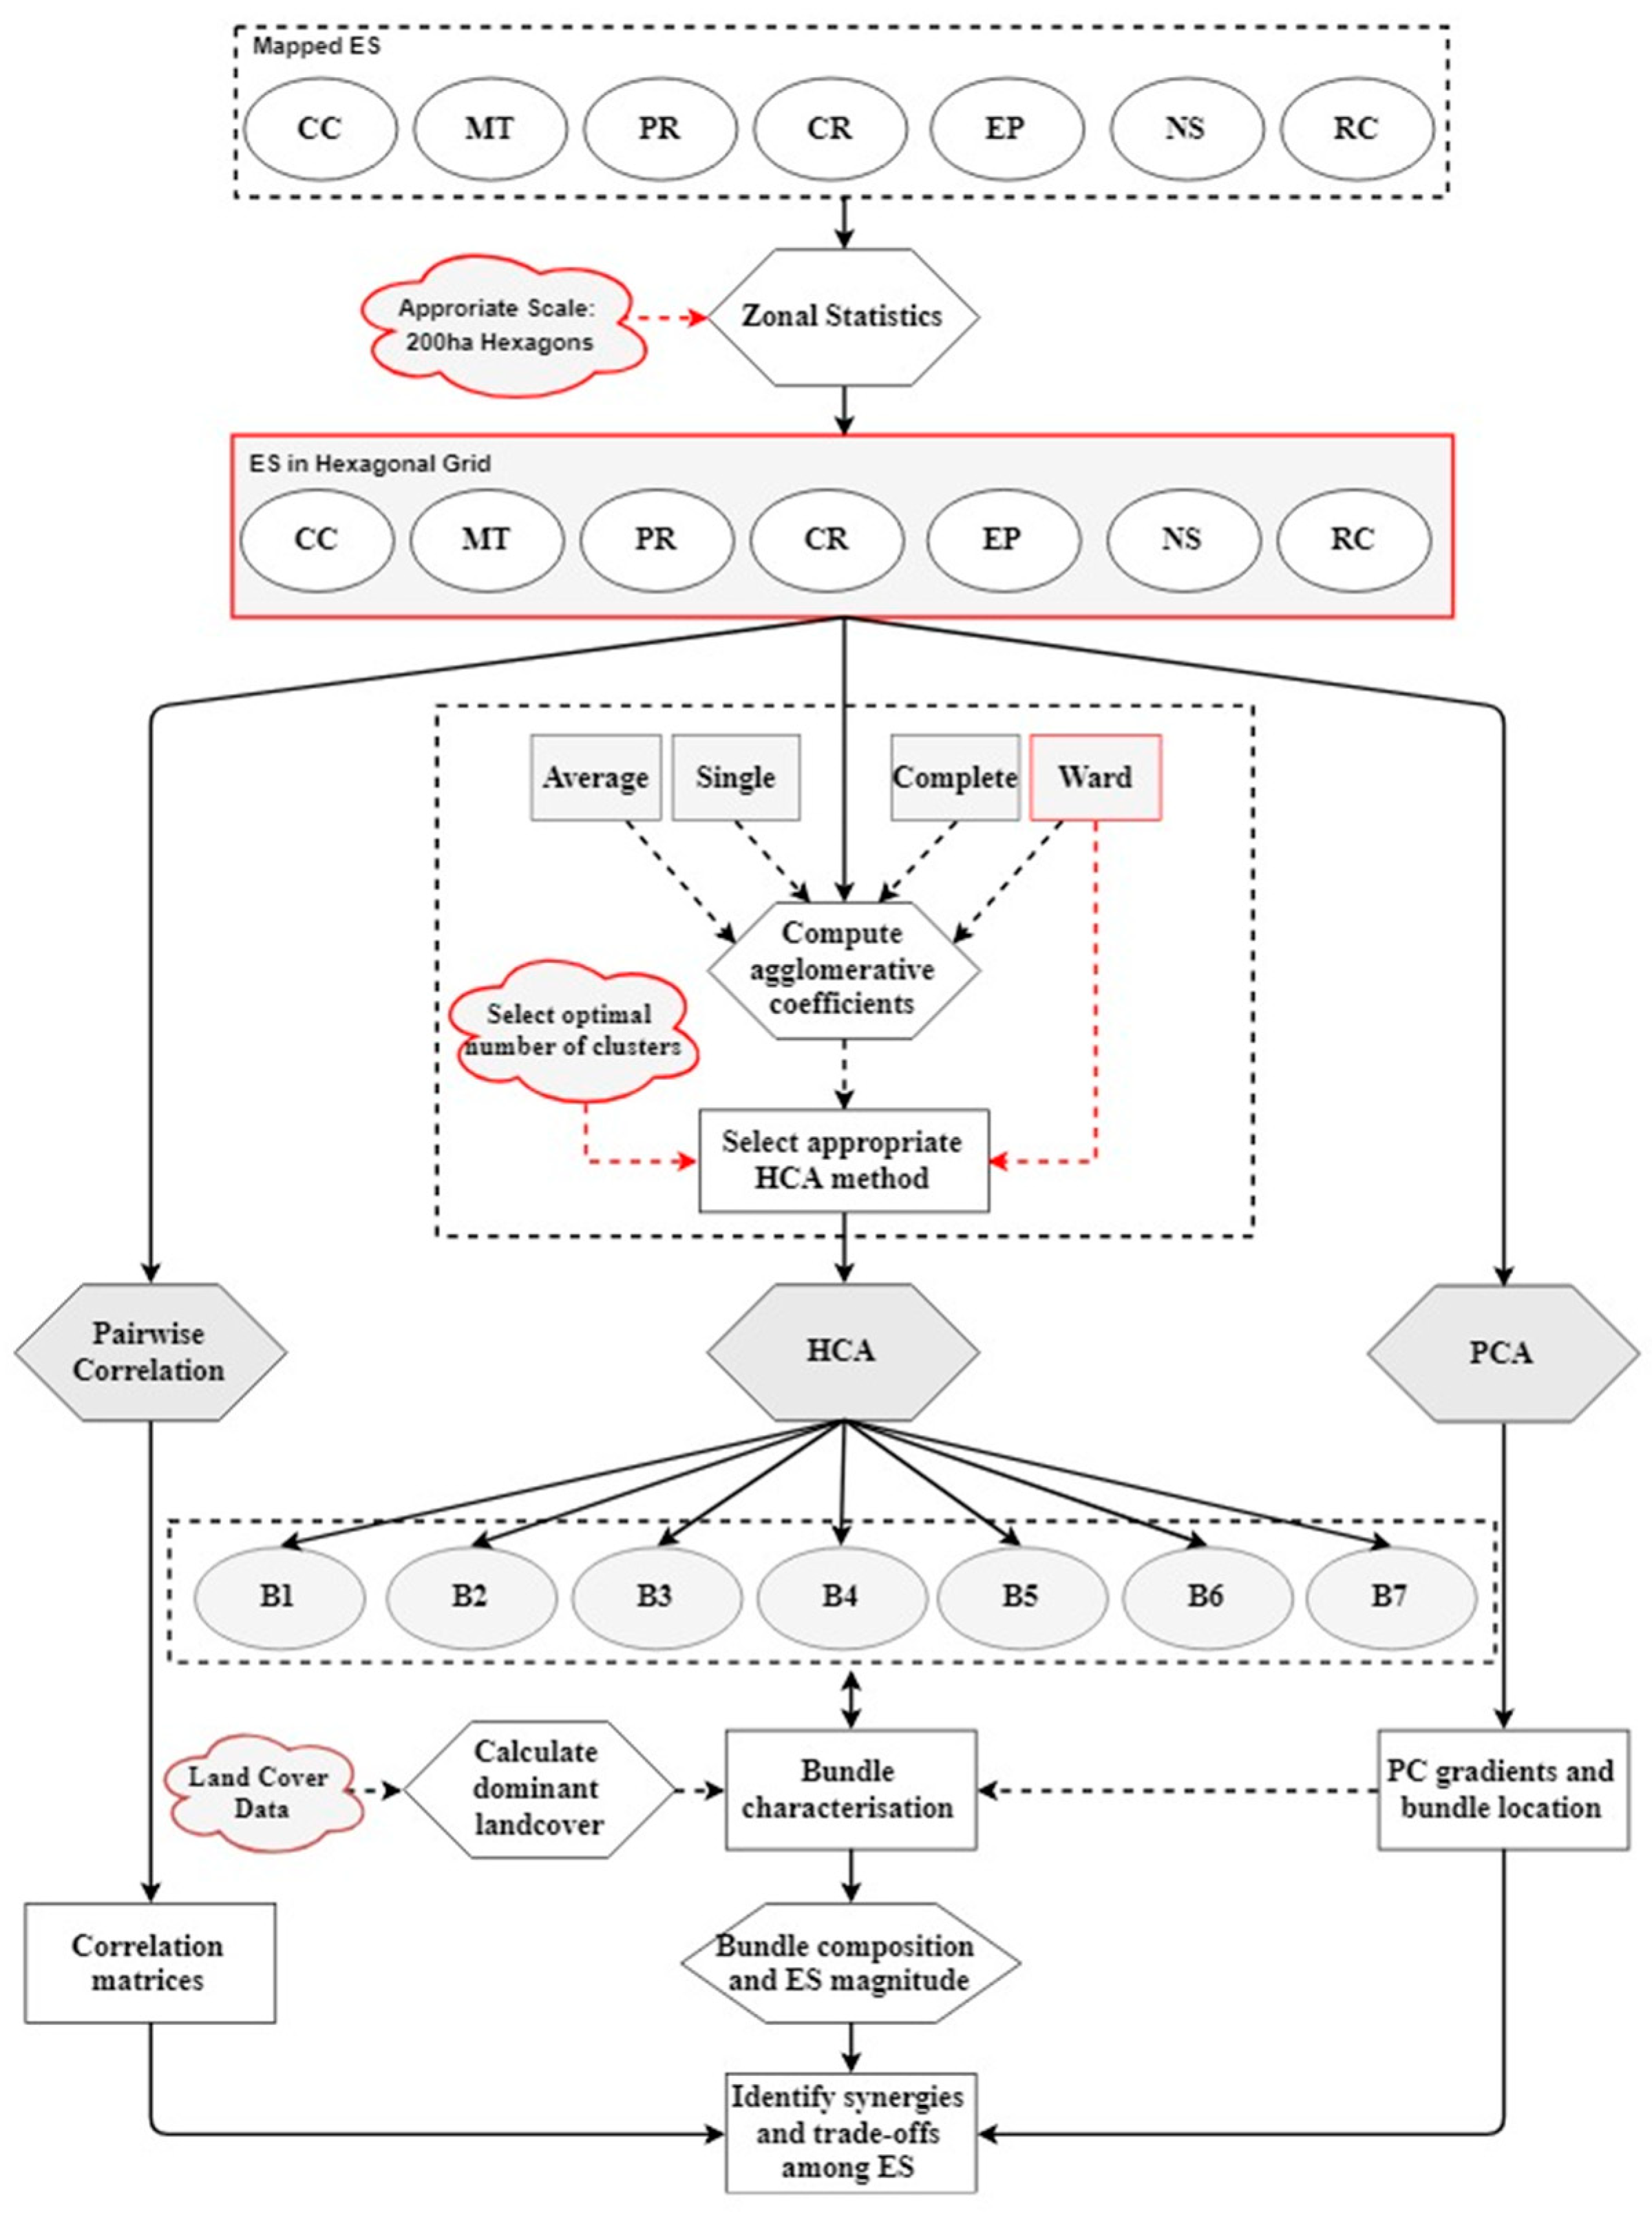
2.3. Quantification of ES Supply and ES Bundles

The values obtained from each ecosystem service were normalized to a scale between 0 and 1, based on the minimum and maximum values (Equation (4)), where 0 indicates low ES supply and 1 high ES supply [76].
ES = ES ES min ES max ES min
where ES’ is the normalized ES, ESmax is the maximum value of ES, and ESmin is the minimum value of ES.
Ecosystem services were averaged to create the Total ES and the three ES sections/groups. Comparison of the supply of ecosystem services over time was displayed with boxplots. In addition, one-way ANOVA along with Games-Howell post hoc tests were used to identify any significant differences between the studied years.
To identify interactions among ecosystem services, an appropriate scale of analysis is required [77,78,79]. In this study, we tested three different spatial grids (two grids consisting hexagons of 100 ha and 200 ha, and one grid consisting 267 municipal districts) to select an appropriate scale for assessing ES (Figure 2). The small grid 100 ha represents a local scale where few management practices may occur. The mid-scale grid 200 ha integrates the influence of a diverse landscape in the supply of ecosystem services. The large administrative scale refers to land boundaries where planning and management decisions are likely to be made. A hexagonal grid was preferred over a rectangular grid, because it provided a better representation of spatial connectivity in a complex landscape [80,81]. For each of the three grids, the average values were estimated using zonal statistics. These values were used to calculate Moran’s I for measuring the spatial clustering and selecting the best scale. Moran’s I is one of the oldest and most common statistics used to examine spatial autocorrelation in spatial data [82] and has been previously used in the ES literature [11,83,84,85]. Moran’s I was used to determine whether ecosystem services are misrepresented as the scale of observation becomes larger [78,86]. It ranges from −1 to 1, where positive values indicate a highly clustered pattern of similar values and negative indicates clustering of dissimilar values.
The framework for analyzing interactions among ecosystem services consisted of three main processes (Figure 2).
1. Pairwise correlation test for analyzing ecosystem service relationships
The spearman correlation coefficients were calculated for all pairs of variables to investigate the direction (negative or positive) and the strength (weak: 0.10–0.29; moderate: 0.30–0.49; strong: 0.50–1.00; adapted from Renard et al. [11]) of relationships among ecosystem services.
2. Cluster analysis for identifying ecosystem service bundles
A method used to create groups with similar characteristics is the agglomerative method hierarchical cluster analysis (HCA) [87]. A variety of agglomerative clustering methods exists from which the single linkage, complete linkage, average linkage, and Ward’s hierarchical clustering method are commonly used. Before applying any hierarchical clustering, it is necessary to evaluate the dissimilarity values to specify the agglomeration technique to be used [88]. One objective criterion to compare the clustering structure found by each technique is the agglomeration coefficients, which measure the amount of clustering structure of the ES values; the closer to 1, the stronger the clustering structure [89]. Therefore, we estimated the agglomerative coefficients of the single, complete, average, and Ward method. The most appropriate method was applied to assess the existence of ecosystem services bundles. The cluster dendrogram generated from HCA was classified into a number of classes (bundles) based on the elbow method for selecting the optimal number of classes [90].
3. Ordination analysis for specifying ES relationships within bundles
To investigate the relationship among ecosystem services within bundles, a principal component analysis (PCA) was performed to identify the proportions explaining ES variability by the two first axes [82]. PCA also helped to visualize the location of each ES bundle in the PC gradients. Bundles were characterized by examining the dominant land cover of each formed bundle and its position in the gradients of the PCA axes. The composition of each ES bundle was presented using starplots and the magnitude was estimated using the mean value of each ES. Each petal in the starplot is associated with a single ES, where a longer length indicates higher ES supply.
Of note, most processes and data visualization were implemented using the open source software R version 3.5.0 and R Studio Version 1.1.453 and the R packages: cluster [91], corrplot [92], factoextra [93], raster [94], rgdal [95], spatialEco [96], and userfriendlyscience [97]. The hexagonal grids were generated using patch analyst for ArcGIS [98]. Moran’s I was calculated with Queen Contiguity using the free and open-source software program GeoDa. The Free and Open Source Geographic Information System ‘QGIS’ was also used to create maps of the ES supply.

3. Results

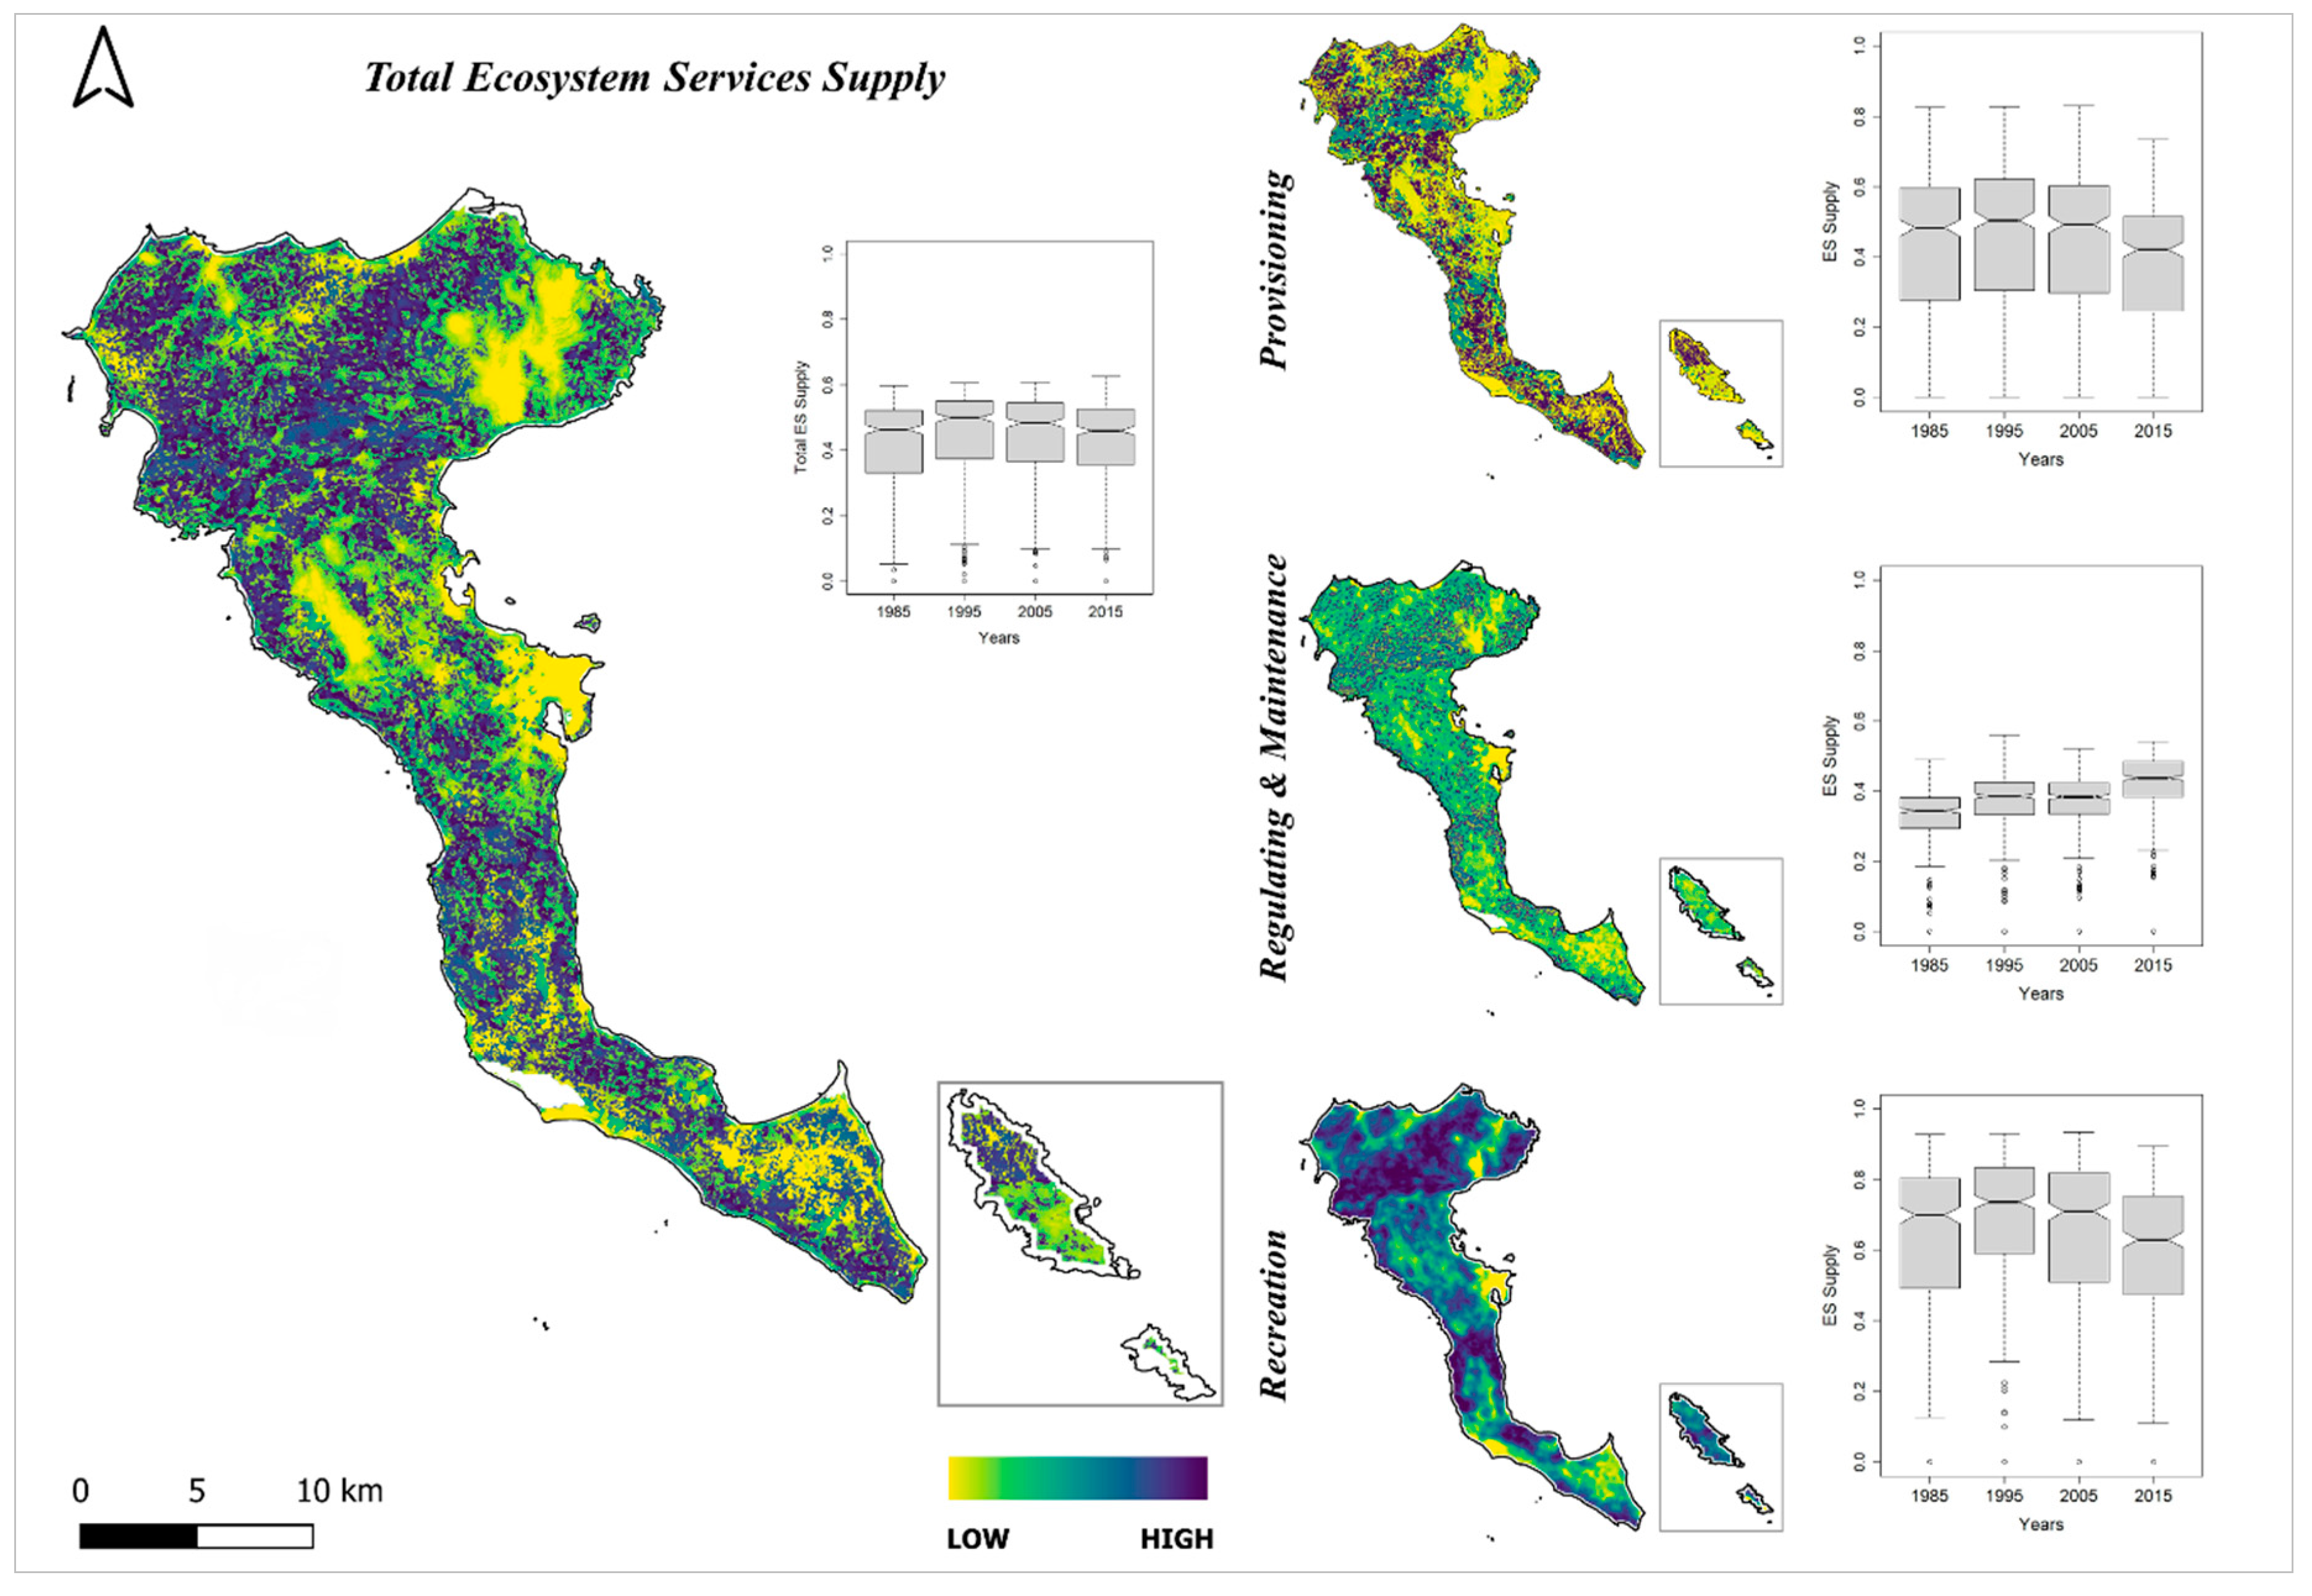
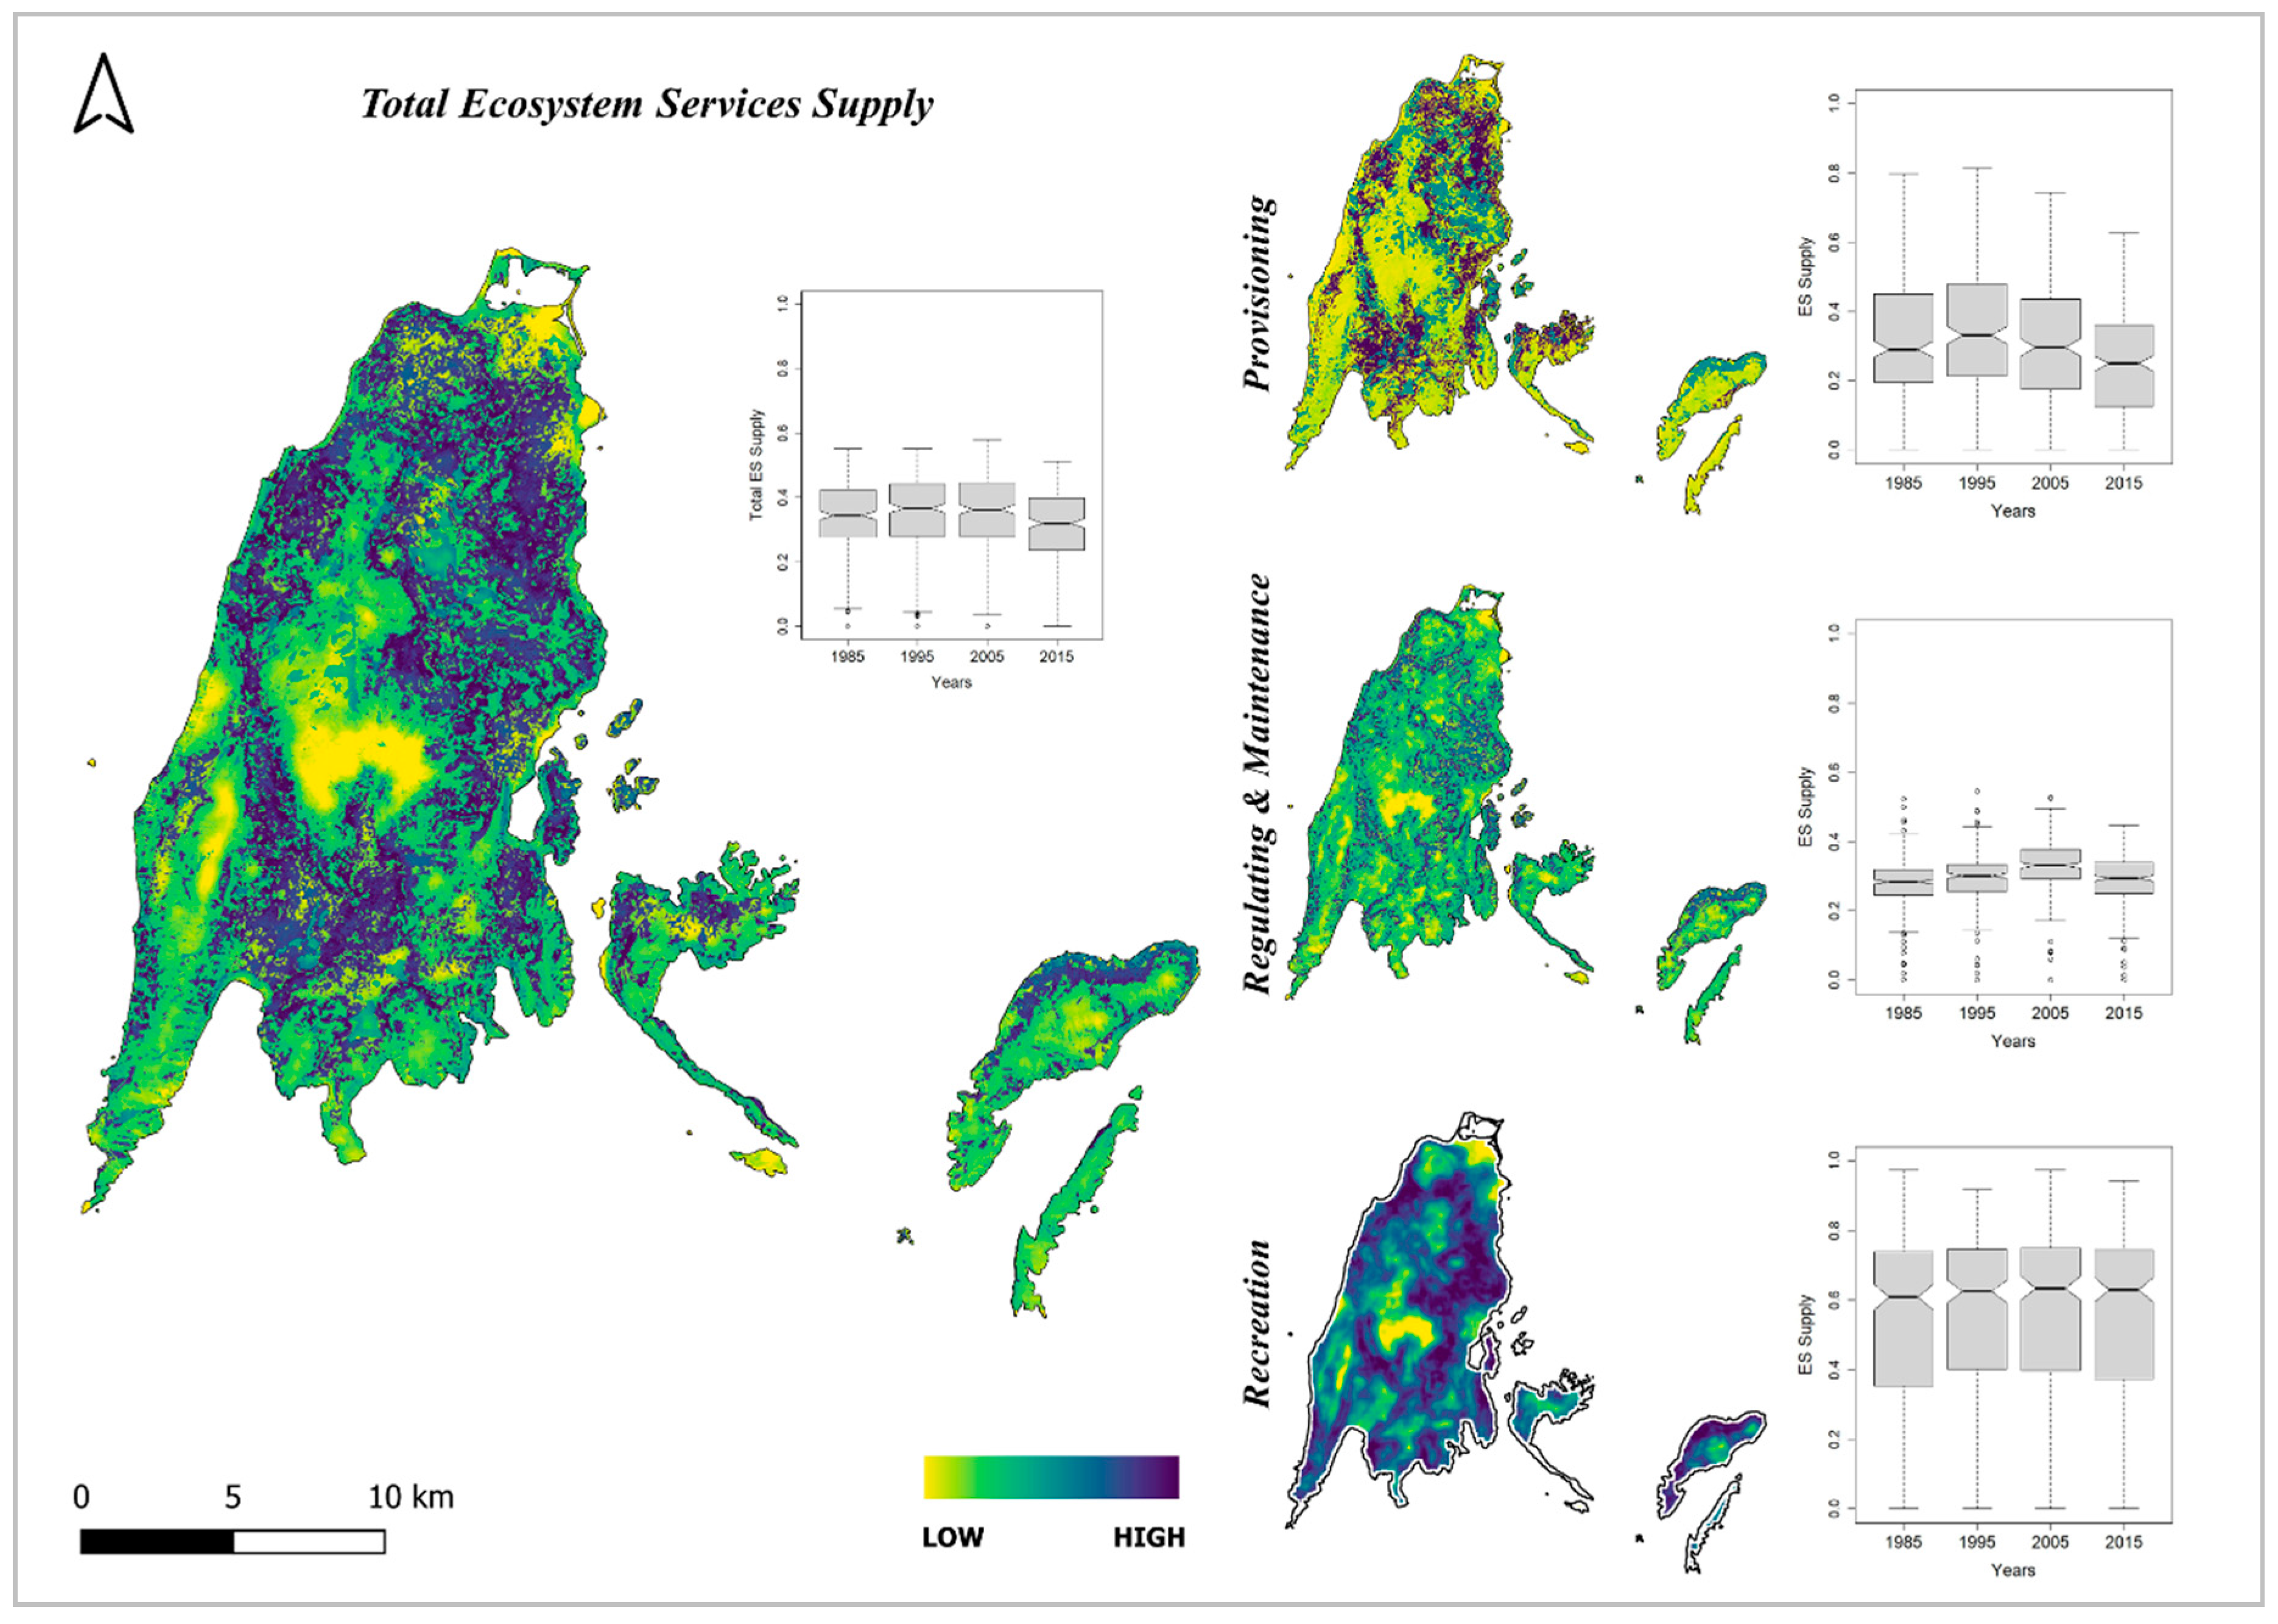
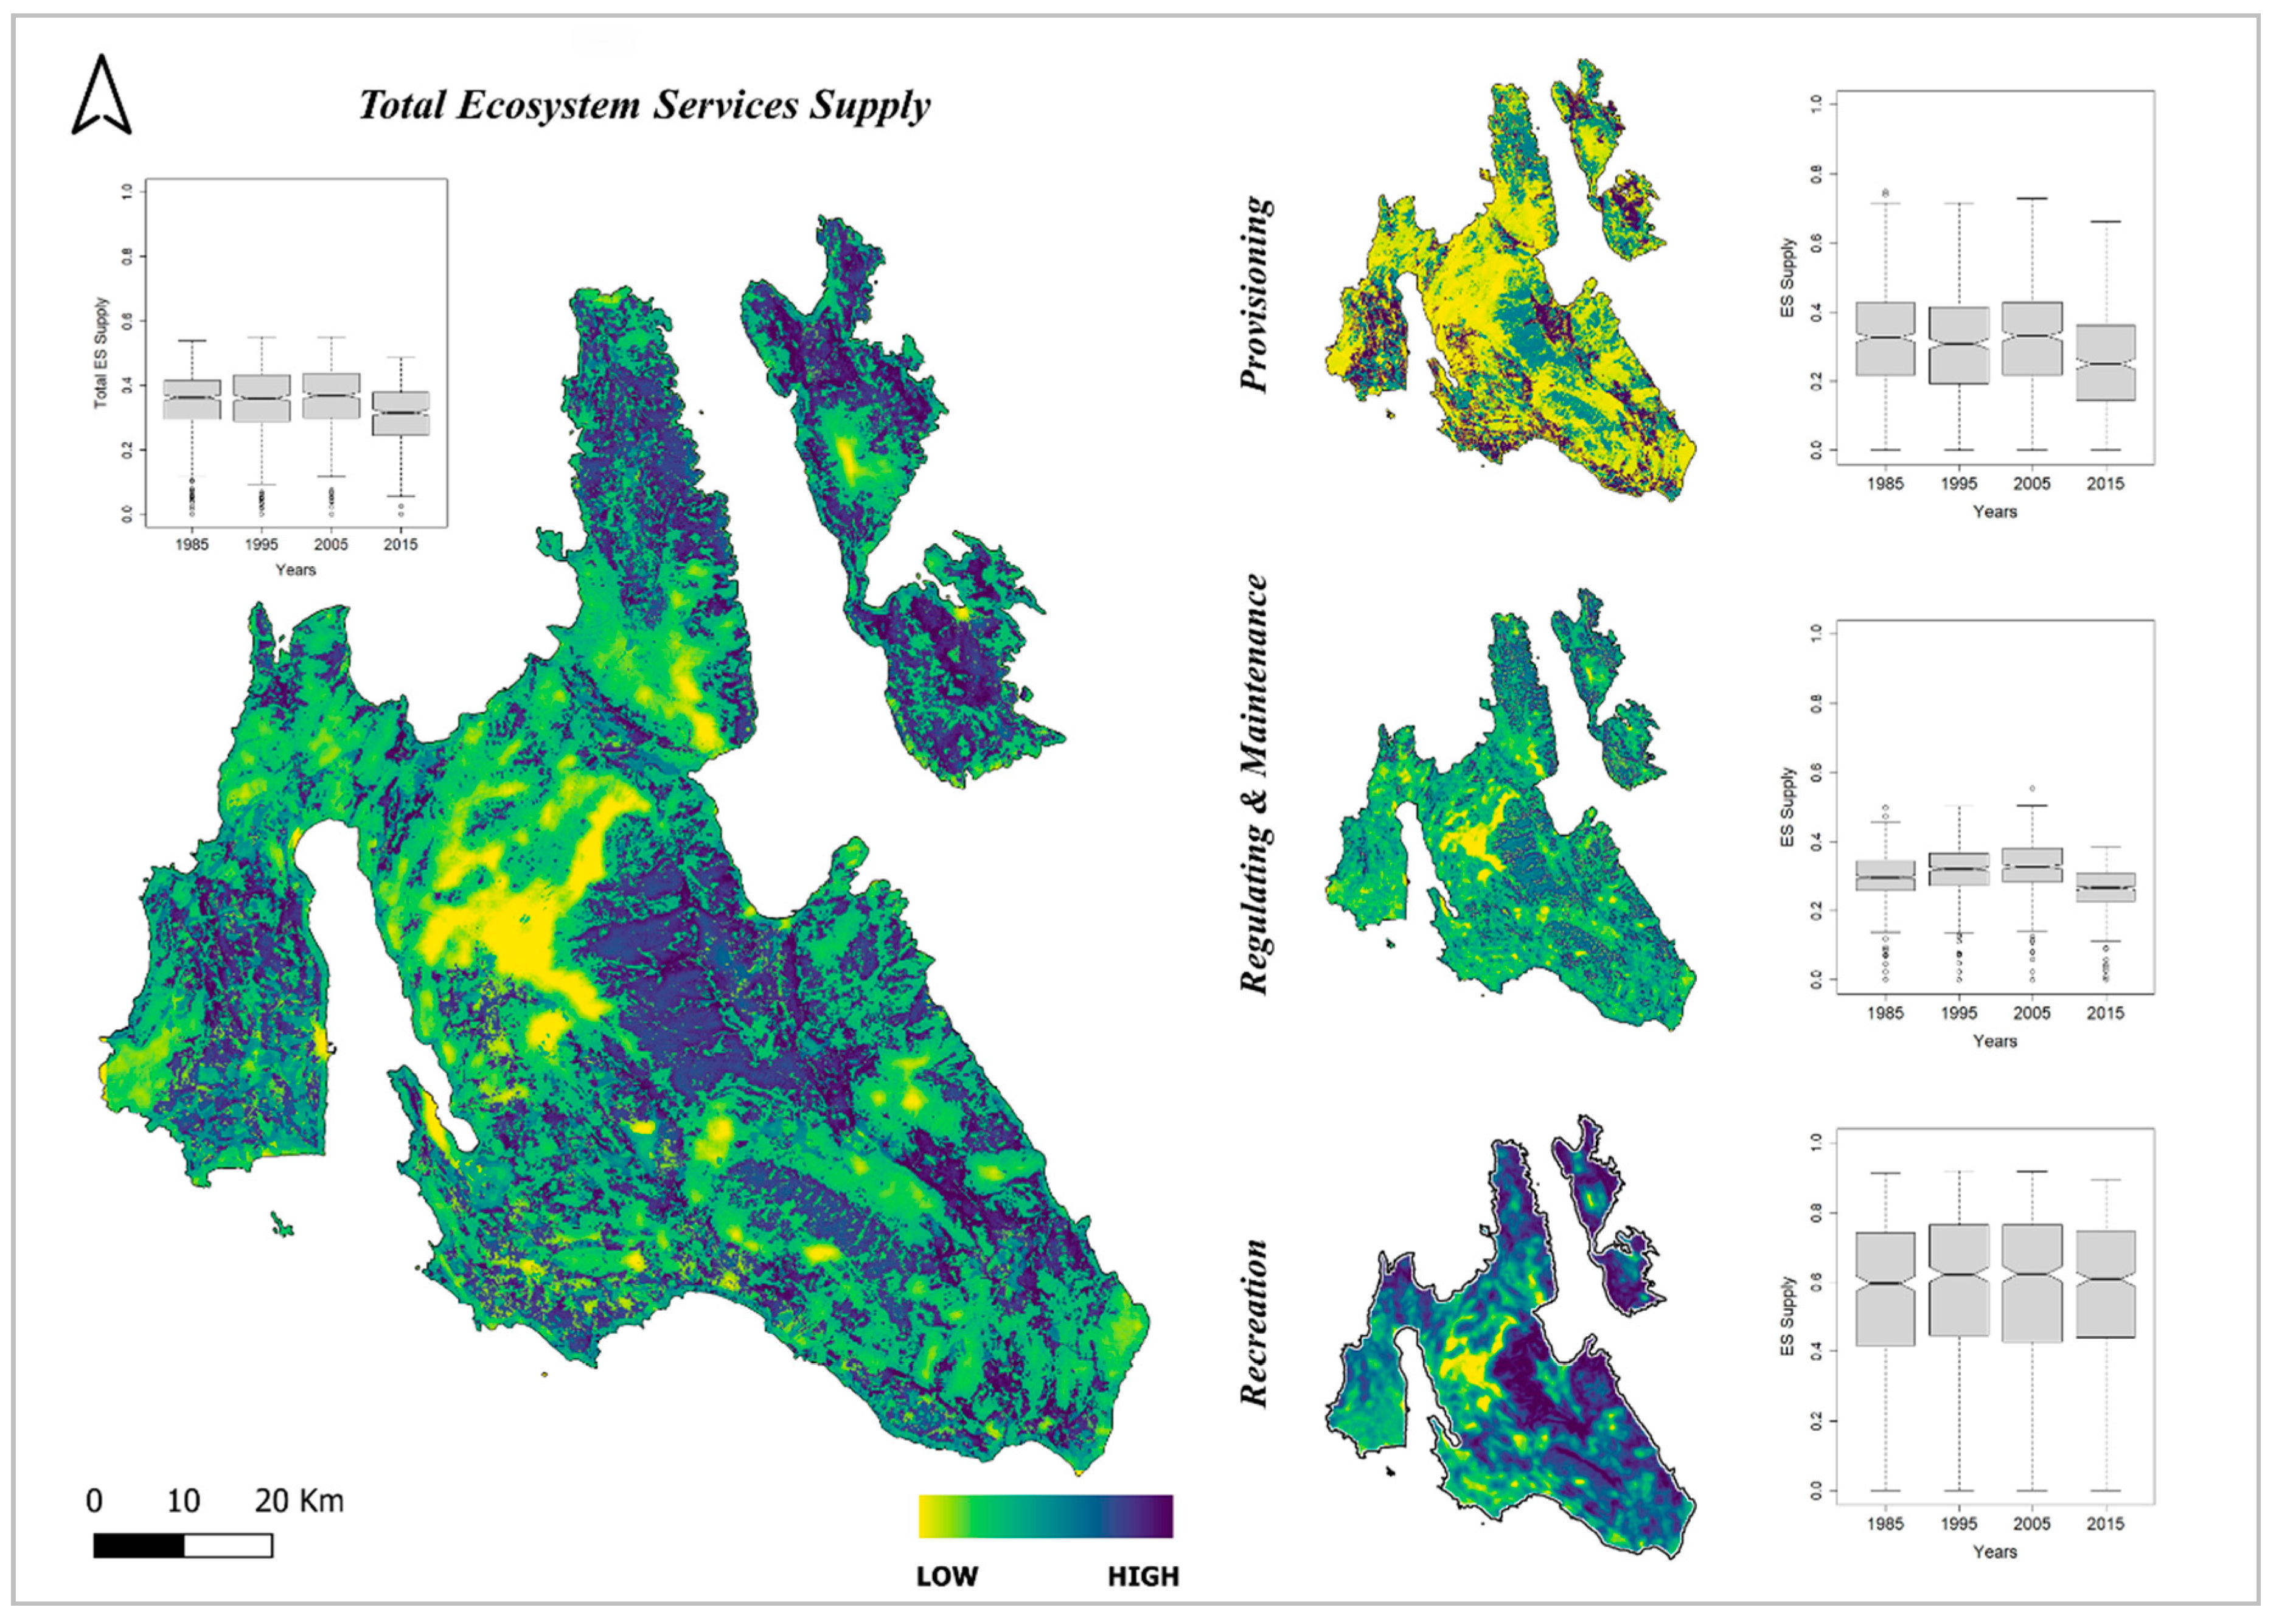
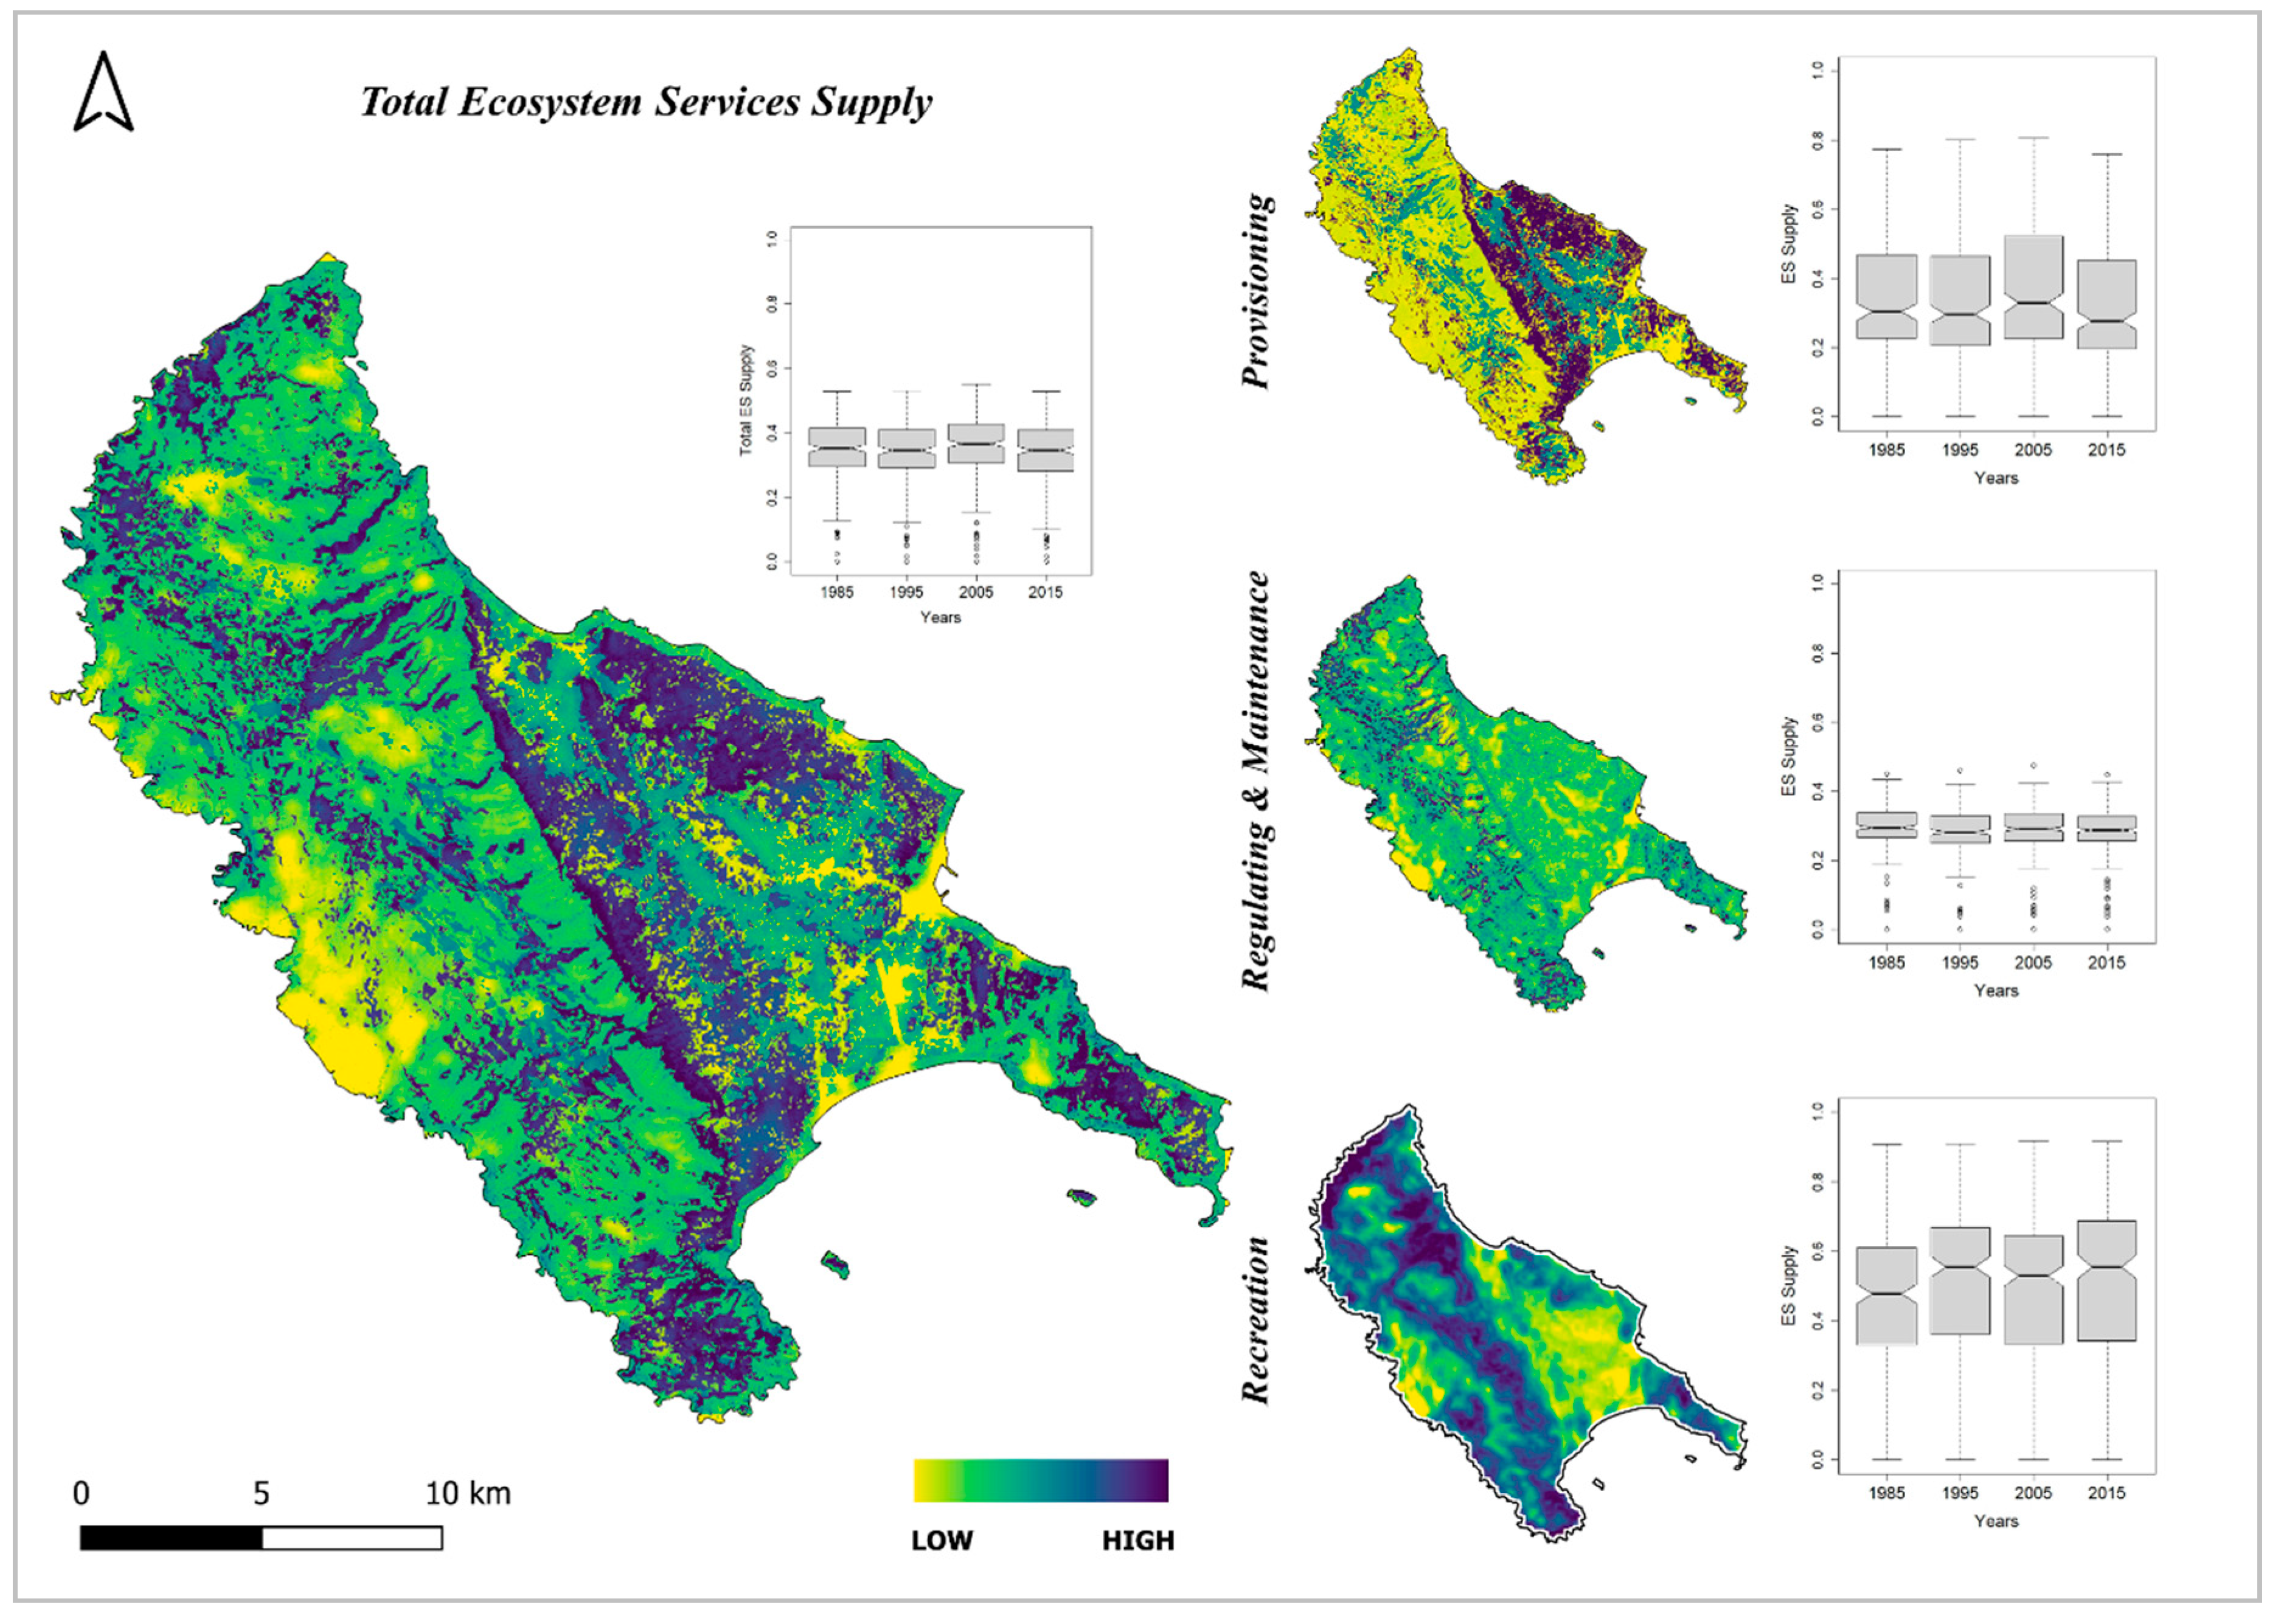
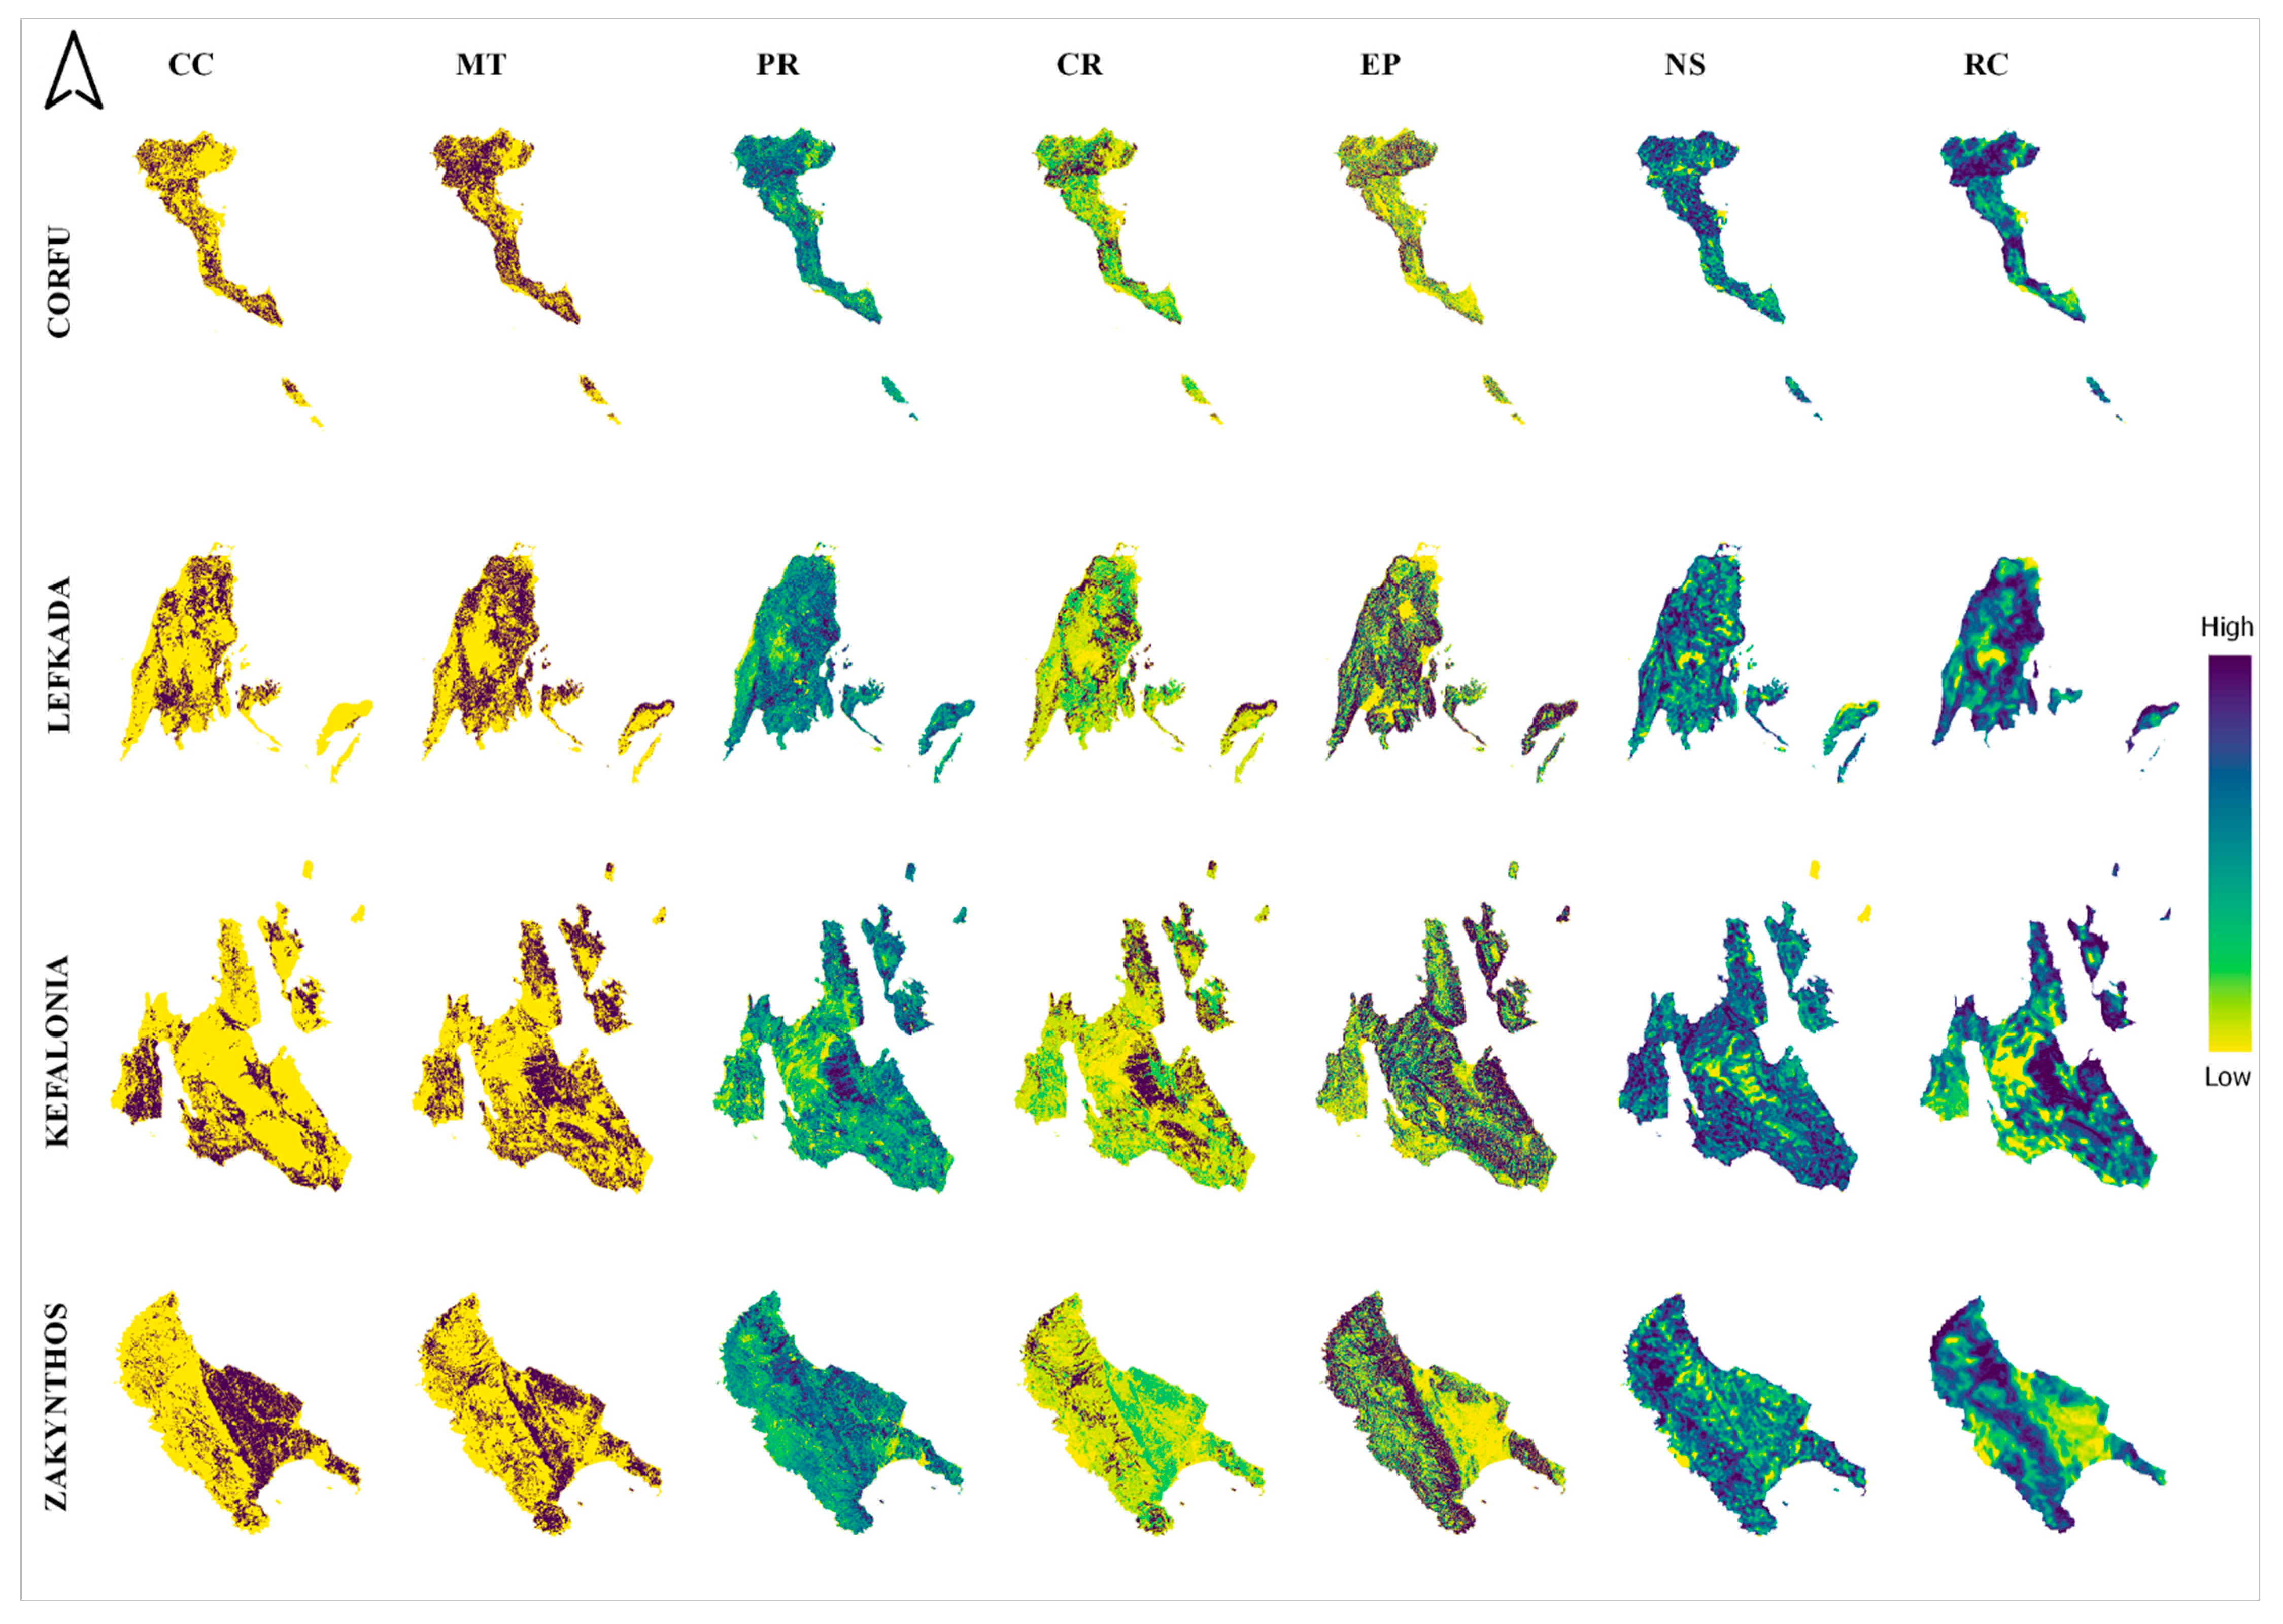
3.1. Mapping and Temporal Changes in ES Sypply

The results revealed different intensities and spatial patterns among the individual ecosystem services, as well as among the islands (Table 2 and Figure A1). The cultural service of RC presented the higher intensities across the Ionian Islands, followed by MT, PR, and NS with moderate values, while CC, CR, and EP showed the lower intensities. The higher ES supply was found for RC in Corfu (0.70), while EP in Lefkada and CR in Zakynthos exhibited the lower values (0.19). The low values of CR and EP along with the moderate values of NS resulted in the overall lower intensity of Regulating and Maintenance ES (Table 2). Similarly, the low value of CC and moderate values of MT and PR led to the moderate supply of provisioning supply, resulting in the value of Total ES not exceeding 0.44 in the case of Corfu (<0.38 in the other islands).
Cultivated crops were mostly located in low land areas, showing both dispersed (Corfu and Lefkada) and clustered (Kefalonia and Zakynthos) patterns (Figure A1). Materials from timber and plant-based resources followed a similar pattern where higher values covered areas across the extent of all islands. Climate regulation and erosion prevention were the least intensive services, and mainly covered mountainous and forested regions. Nursery did not show any specific spatial pattern, as this service had higher values throughout the studied areas. Recreation had different patterns of intensity, with this service being highly evident in the mountainous areas of some islands, while the mountainous areas of other islands had lower recreation supply.
The three ES groups had similar spatial patterns within the extent of each Island. In Corfu, areas with higher values of provisioning and total ES supply were mainly located in the north and south parts, while lower supply was found in the north mountainous and the central regions (Figure 3). In contrast, recreation followed a more evenly distributed pattern, as opposed to the patchier distribution of regulating ES. On Lefkada, provisioning ES was dominant in the lowland areas, while higher regulating and maintenance ES supply was detected in regions where intermediate conditions of provisioning ES occurred. Recreation primarily occurred in the east, north, and south part of Lefkada Island and north of Kalamos Island. As for Total ES, higher values covered mostly the north, northeast, and south part of Lefkada and the north parts of Meganisi and Kalamos (Figure 4). In contrast, lower Total ES supply was found in the central and southwest of Lefkada dominated by mountainous areas. Total ES was evenly distributed across Kefalonia, except in the central part, where lower total ES supply occurred and was divided into two distinct homogeneous regions, with both higher and lower supplies of all ES groups (Figure 5). Most of the areas in this Island with lower provisioning ES supply, had a moderate to high supply of regulating and recreation ES. In addition, higher values of total ES were located in the north and south parts of Ithaca Island. Zakynthos was the only island where provisioning ES had a different spatial distribution to that of regulating and maintenance ES and recreation (Figure 6). Specifically, higher provisioning ES supply occurred in lowland areas, while lower values were located in the mountainous regions. Higher regulating and maintenance ES and recreation were mainly located in mountainous areas, while higher total ES supply occurred both in mountainous and lowland regions. The lowland areas of Zakynthos had a homogeneous distribution of ES, while mountainous areas were characterized by a patchier pattern.
Concerning the temporal variations of ES groups, provisioning ES showed significant differences through the years across the region based on one way ANOVA (Corfu: [F(3,1668) = 14.19, p < 0.001], Lefkada: [F(3,1092) = 15.77, p < 0.001], Kefalonia: [F(3,2280) = 31.34, p < 0.001], Zakynthos: [F(3,1036) = 3.37, p = 0.018]). In general, provisioning ES in 2015 significantly decreased from the previous years throughout all Islands. Regulating ES followed two different trends; an overall significant increase over time in Corfu [F(3,1668) = 80.41, p < 0.001] and in Kefalonia [F(3,2280) = 75.06, p < 0.001], and an increase from 1985 to 2005 (p < 0.001) followed by a depletion in 2015 (p < 0.001) in Lefkada. Significant temporal differences of recreation was found in Corfu Island [F(3,1668) = 5.08, p < 0.01], which exhibited higher supply in 1995 compared to 2015 (p < 0.01), while there was no significant difference on the other three Islands (p > 0.05). Total ES supply showed a significant increase between 1985 and 1995 in Corfu (p < 0.01) and a significant overall decrease between 1995 and 2015 in Lefkada and Kefalonia (p < 0.001).

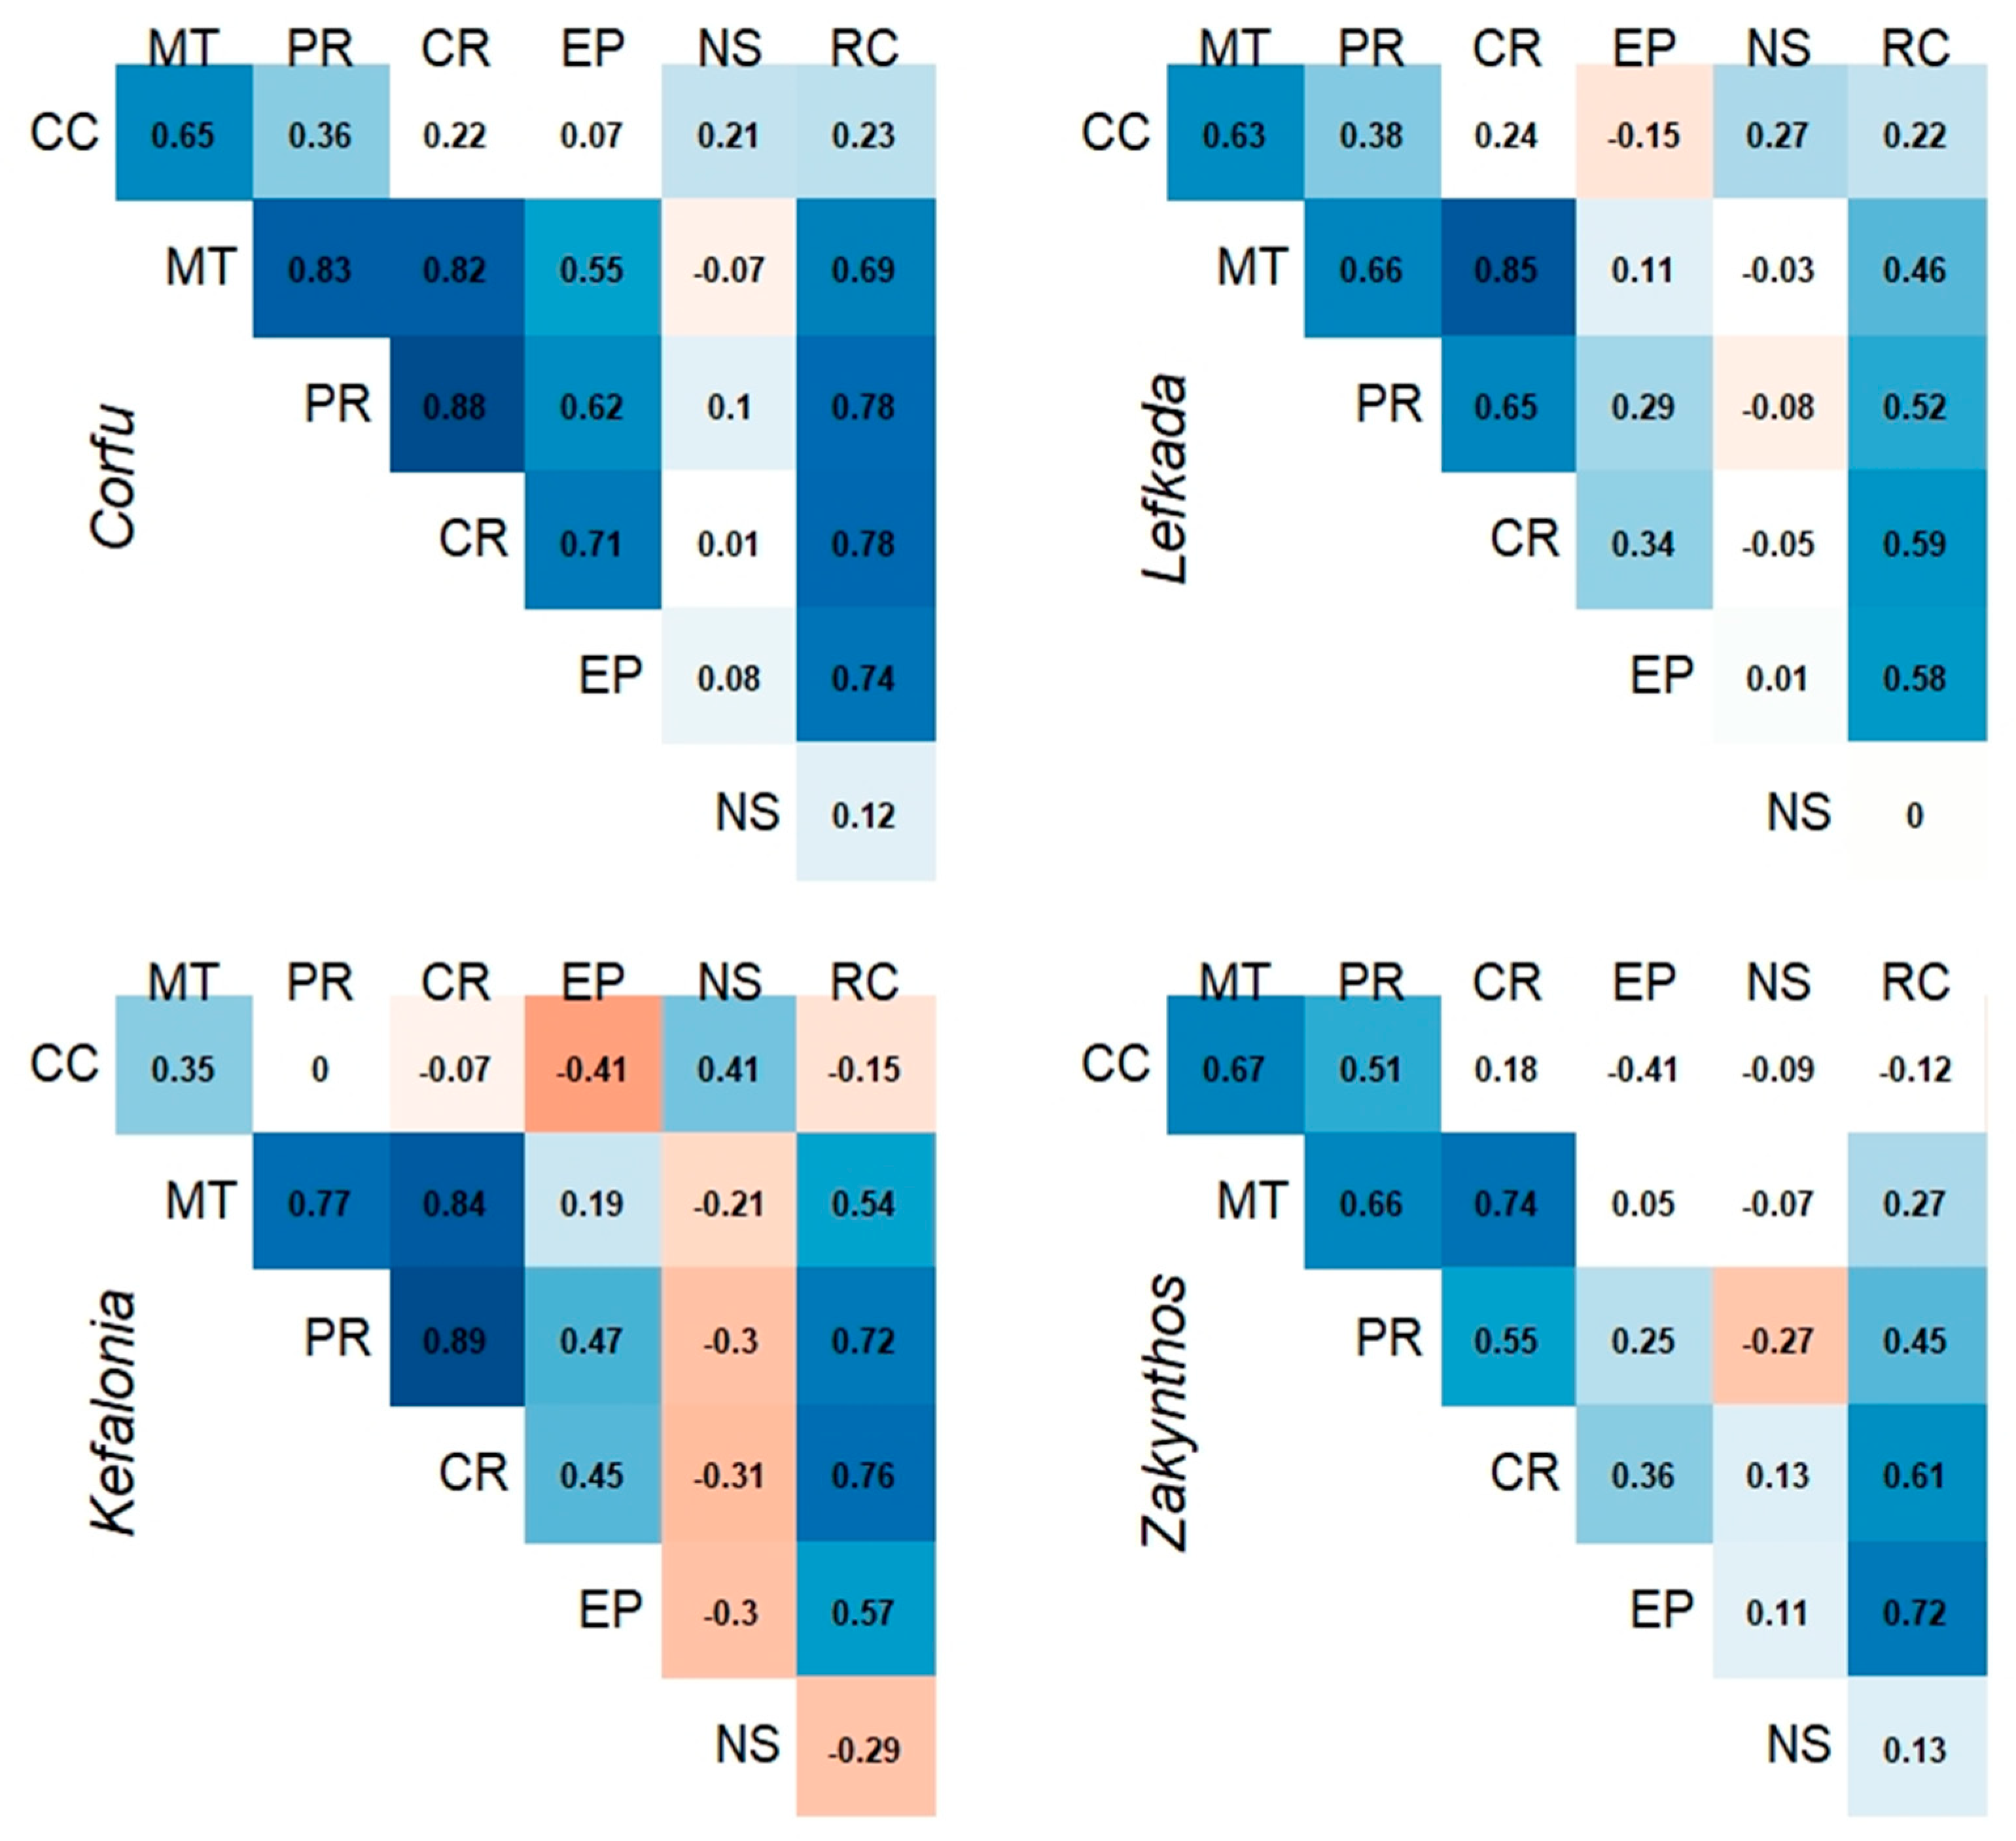
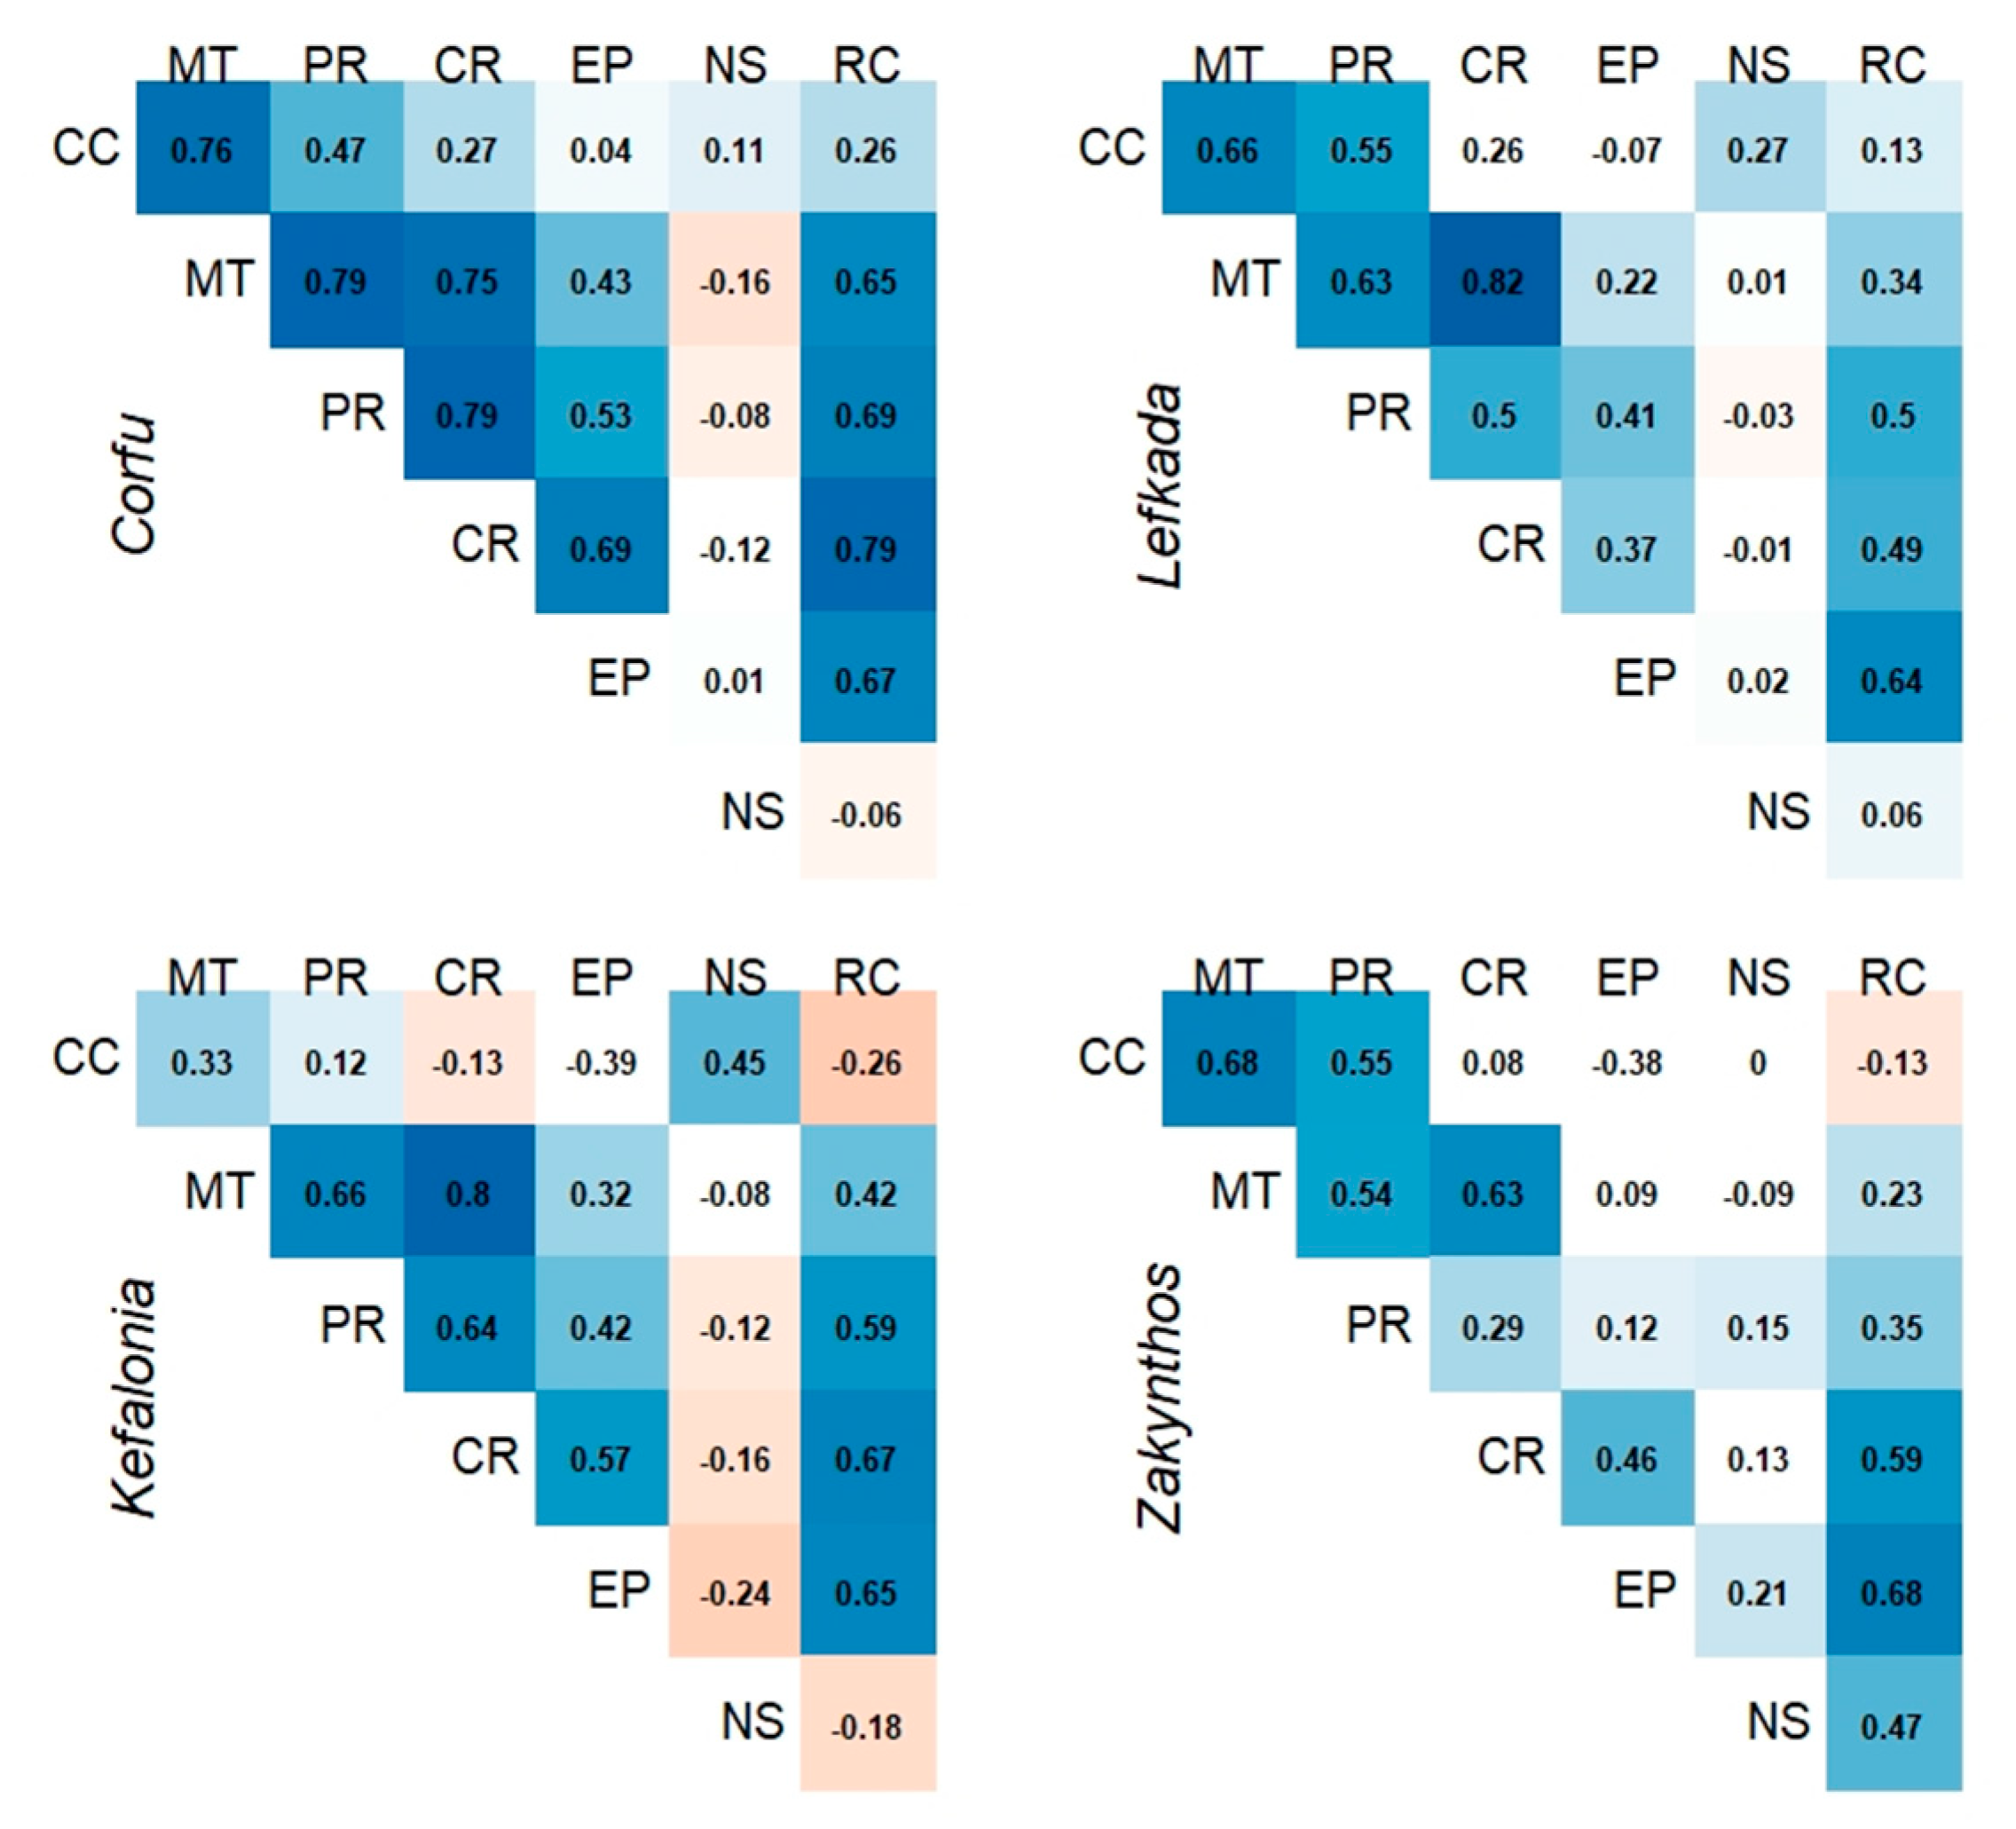
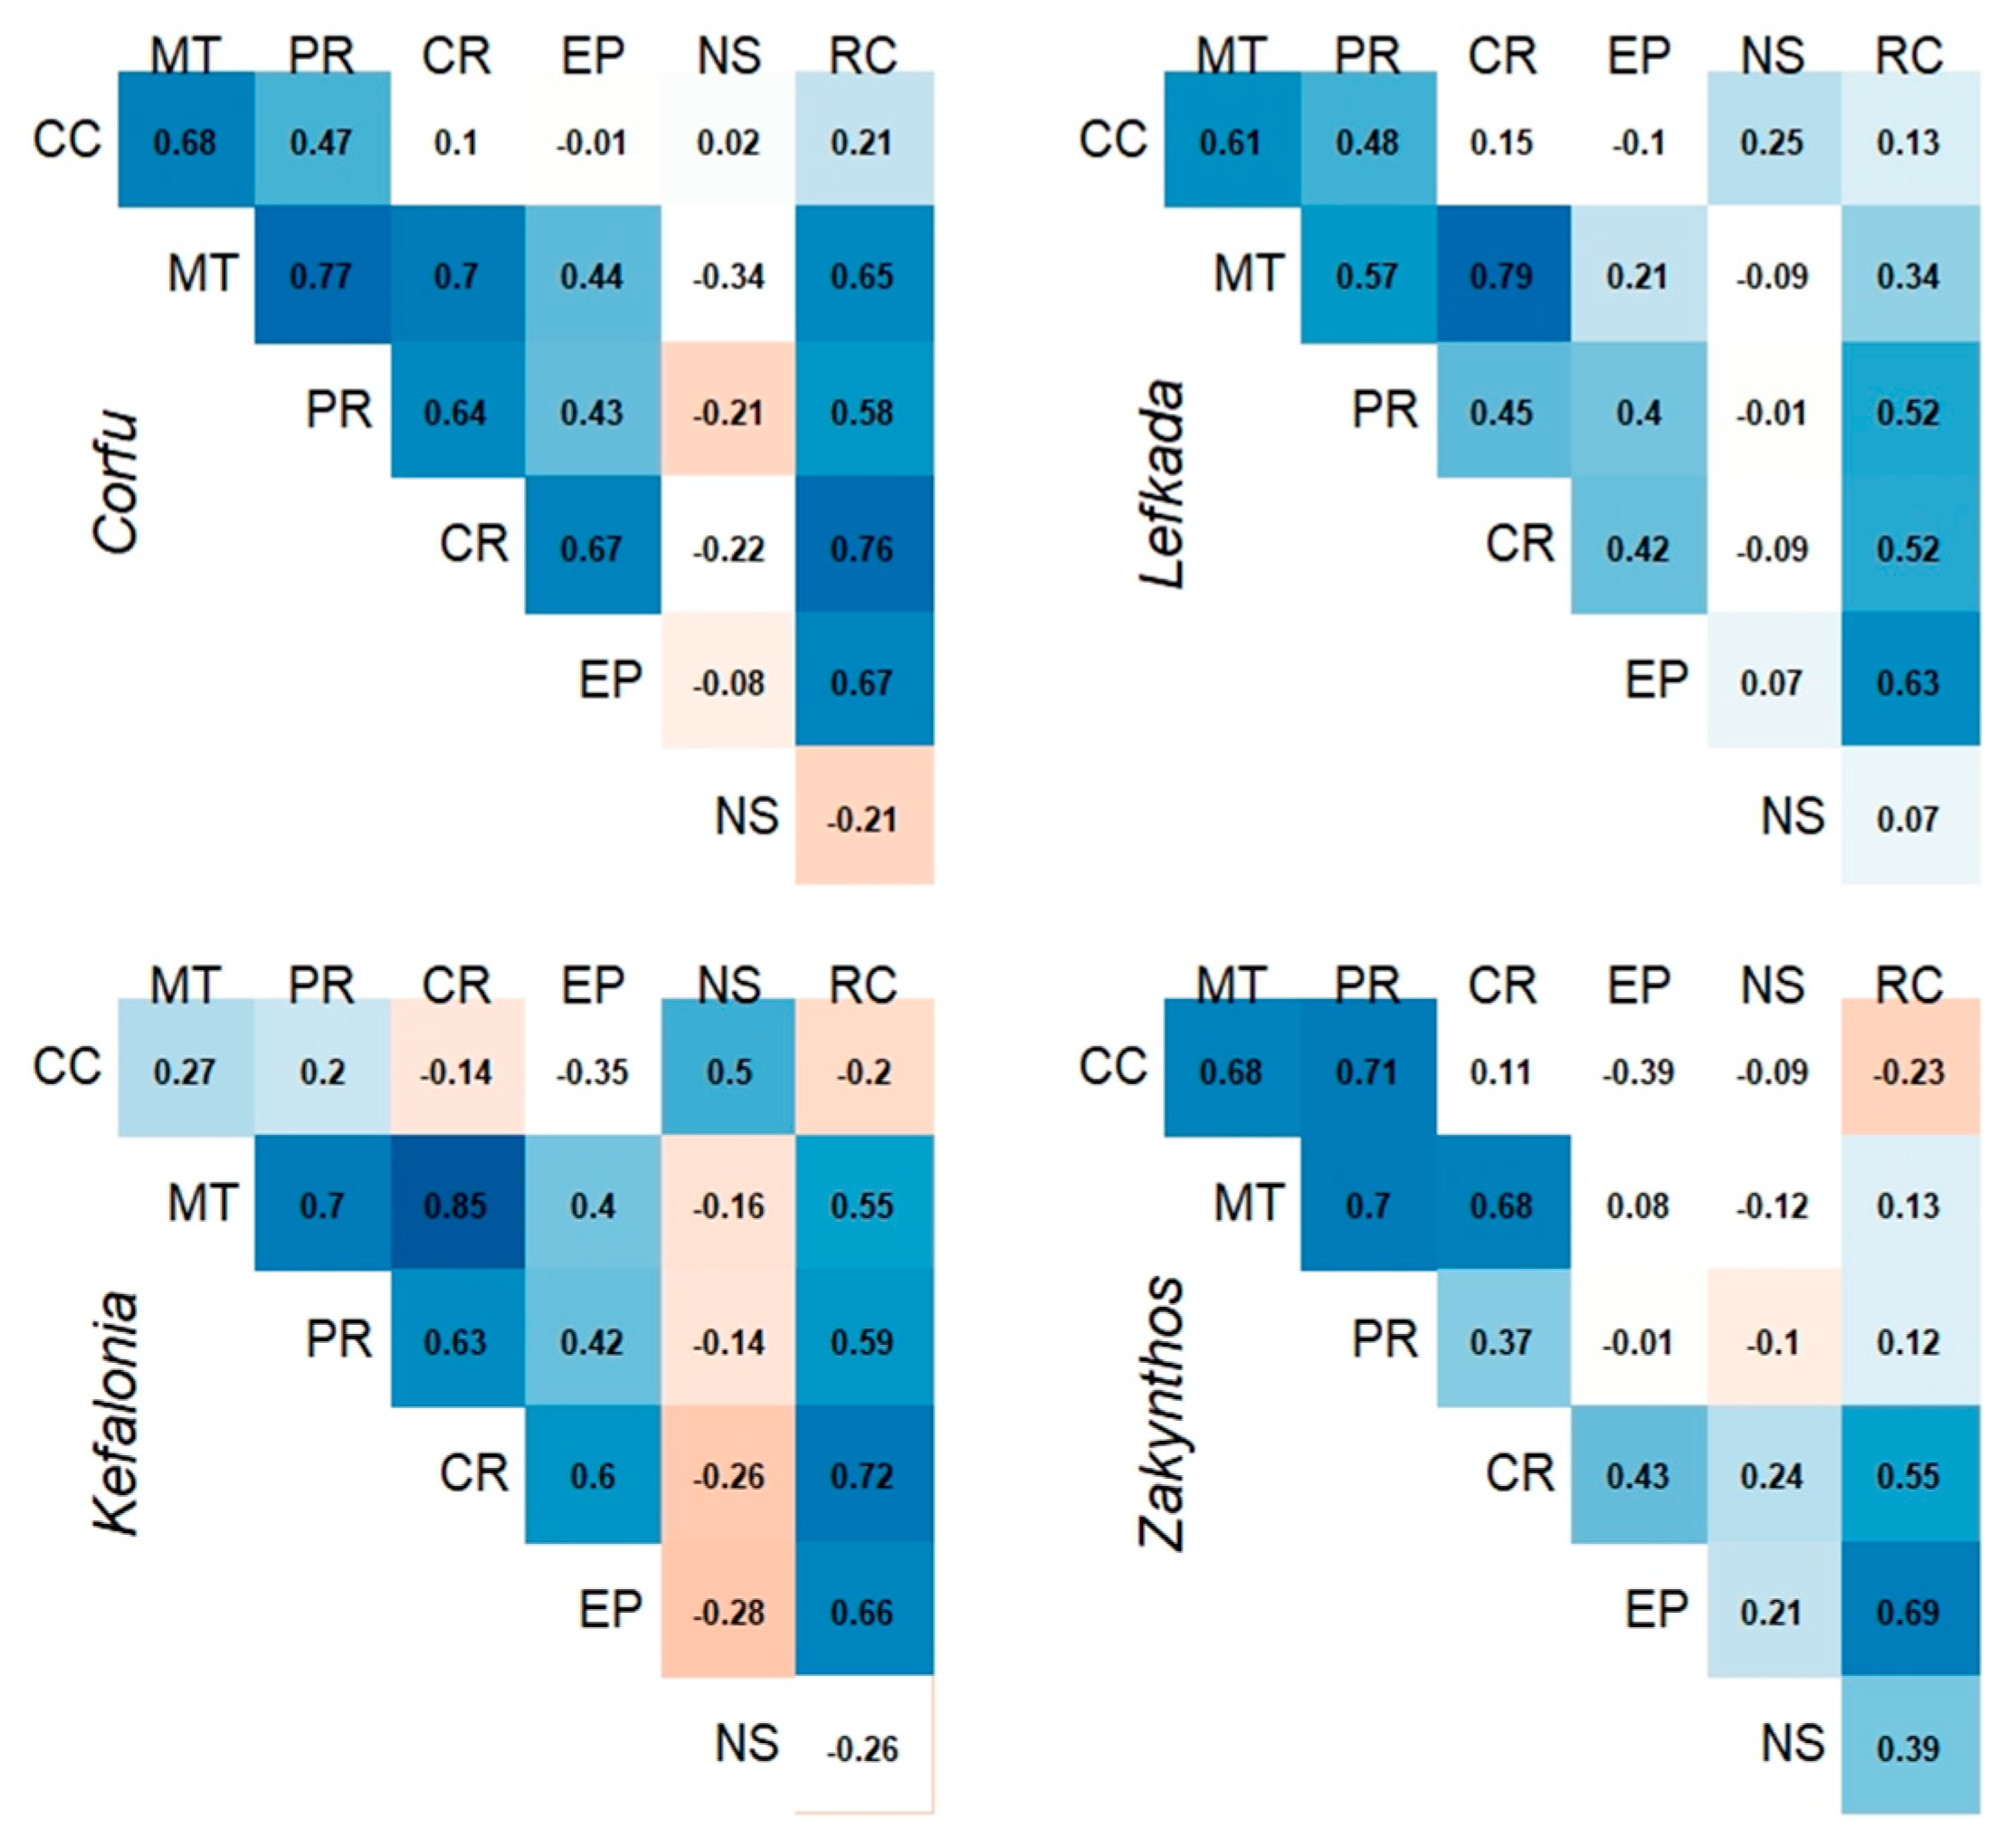
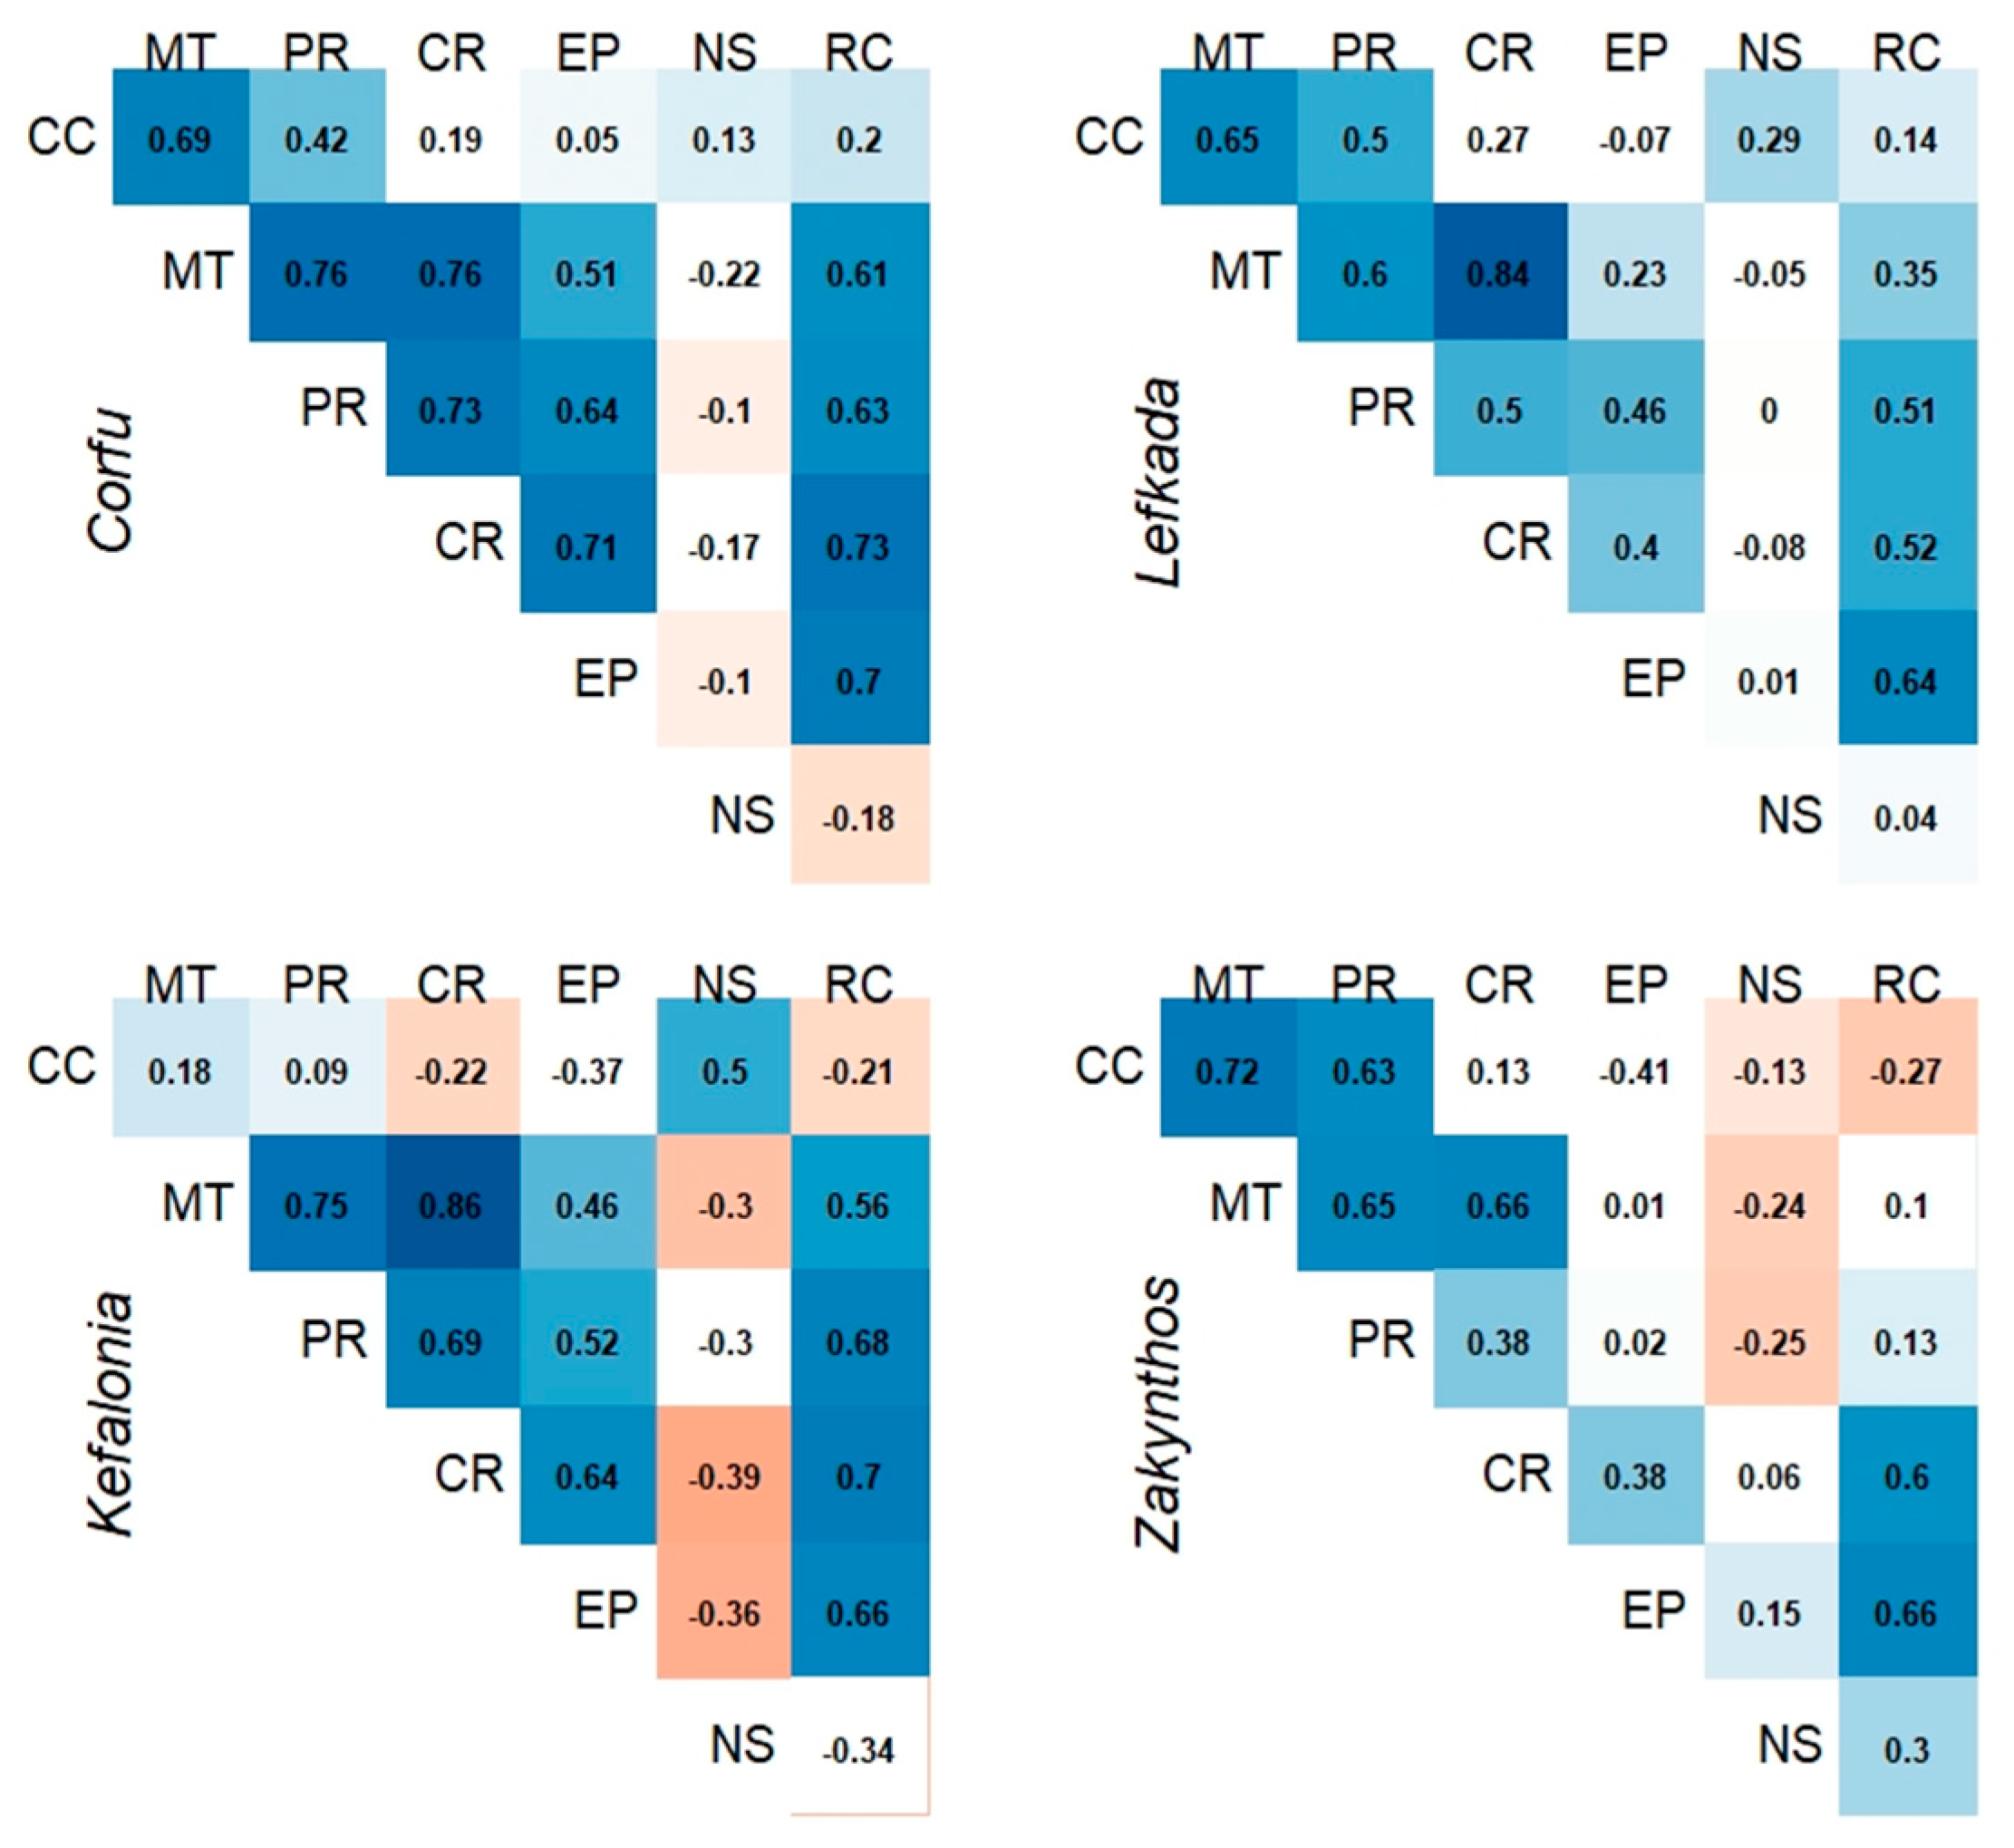
3.2. Temporal Changes in the Correlation among Ecosystem Services

Regarding spatial autocorrelation, our results showed that Moran’s I was higher both for the 200 ha hexagonal and the administrative grids (Appendix B). In contrast, the 100 ha hexagonal grid had the lowest Moran’s I values. Although, the grid of municipal districts in Kefalonia presented higher spatial clustering in comparison with the other two grids, in Lefkada, the same grid reached an average of 0.19, indicating a low spatial clustering. On the other hand, the 200 ha hexagonal grid in Corfu, Lefkada, and Zakynthos reached the higher values. The latter grid was used as the scale of observation to identify ES interactions.
The pattern of correlations for all islands was relatively similar in all four years (Figure 7 and Appendix C); however, some ES pairs changed through time based on the direction and strength of their relationship. Overall, most ES had a synergistic relationship over time in Corfu, Lefkada, and Zakynthos, while Kefalonia had the most tradeoffs. Kefalonia had the most statistically significant correlations, contrary to Zakynthos, where the most non-significant (p > 0.05) relationships were found. The most synergies among regulating ES occurred in Zakynthos, whereas the most tradeoffs occurred in Kefalonia.
Among provisioning ES (CC, MT, and PR), there were mainly strong and moderate positive correlations, especially in Zakynthos where all correlations were higher than 0.50. Only in Kefalonia, certain ES pairs (CC-MT and CC-PR) presented moderate and weak synergies (r < 0.35).
The correlations among the regulating and maintenance ES (EP, CR, and NS) showed various results. Specifically, CR and EP demonstrated consistent positive correlations across islands and time, while weak correlations were found between EP and NS. The Nursery service exhibited the most trade-off relationships amongst all ES.
The relationship of provisioning ES with regulating and maintenance ES presented mostly positive correlations across the region, with Kefalonia and Zakynthos exhibiting some trade-offs. The provisioning service of CC with the regulating services of CR and EP showed non-significant correlations through the years; however, a moderate negative correlation between CC and EP was observed in the last period on Kefalonia (r = −0.41). Positively strong relationships were identified between MT and CR across all Islands, while between MT and EP, strong synergies were found only in Corfu. The provisioning service of PR was positively correlated with all ES, except NS, where the stronger correlations occurred between PR and CR. The direction of the correlation for PR and NS varied among the islands (Figure 7 and Appendix C). For example, in Corfu, a negative correlation became positive (−0.21 in 1995 to 0.10 in 2015), whereas a synergy between PR and NS led to a trade-off relationship in Zakynthos (from 0.15 to −0.27).
The recreation service showed a strong and moderate synergistic relationship with provisioning ES (MT and PR), as well as with regulating ES (EP and CR) across the Ionian Islands. Particularly in Corfu, RC was significantly positively correlated over time with MT, PR, EP, and CR, reaching coefficient values greater than 0.61, 0.58, 0.67, and 0.73, respectively. Among all islands, RC and CC presented both weak synergistic and trade-off relationships. Regarding RC and NS, different correlation patterns were found among the islands. In Corfu, the direction of correlation changed from negative (in 1995) to positive (in 2015). The tradeoff relationship between RC and NS in Kefalonia became stronger, as opposed to Zakynthos, where the synergistic relationship tended to be weaker.

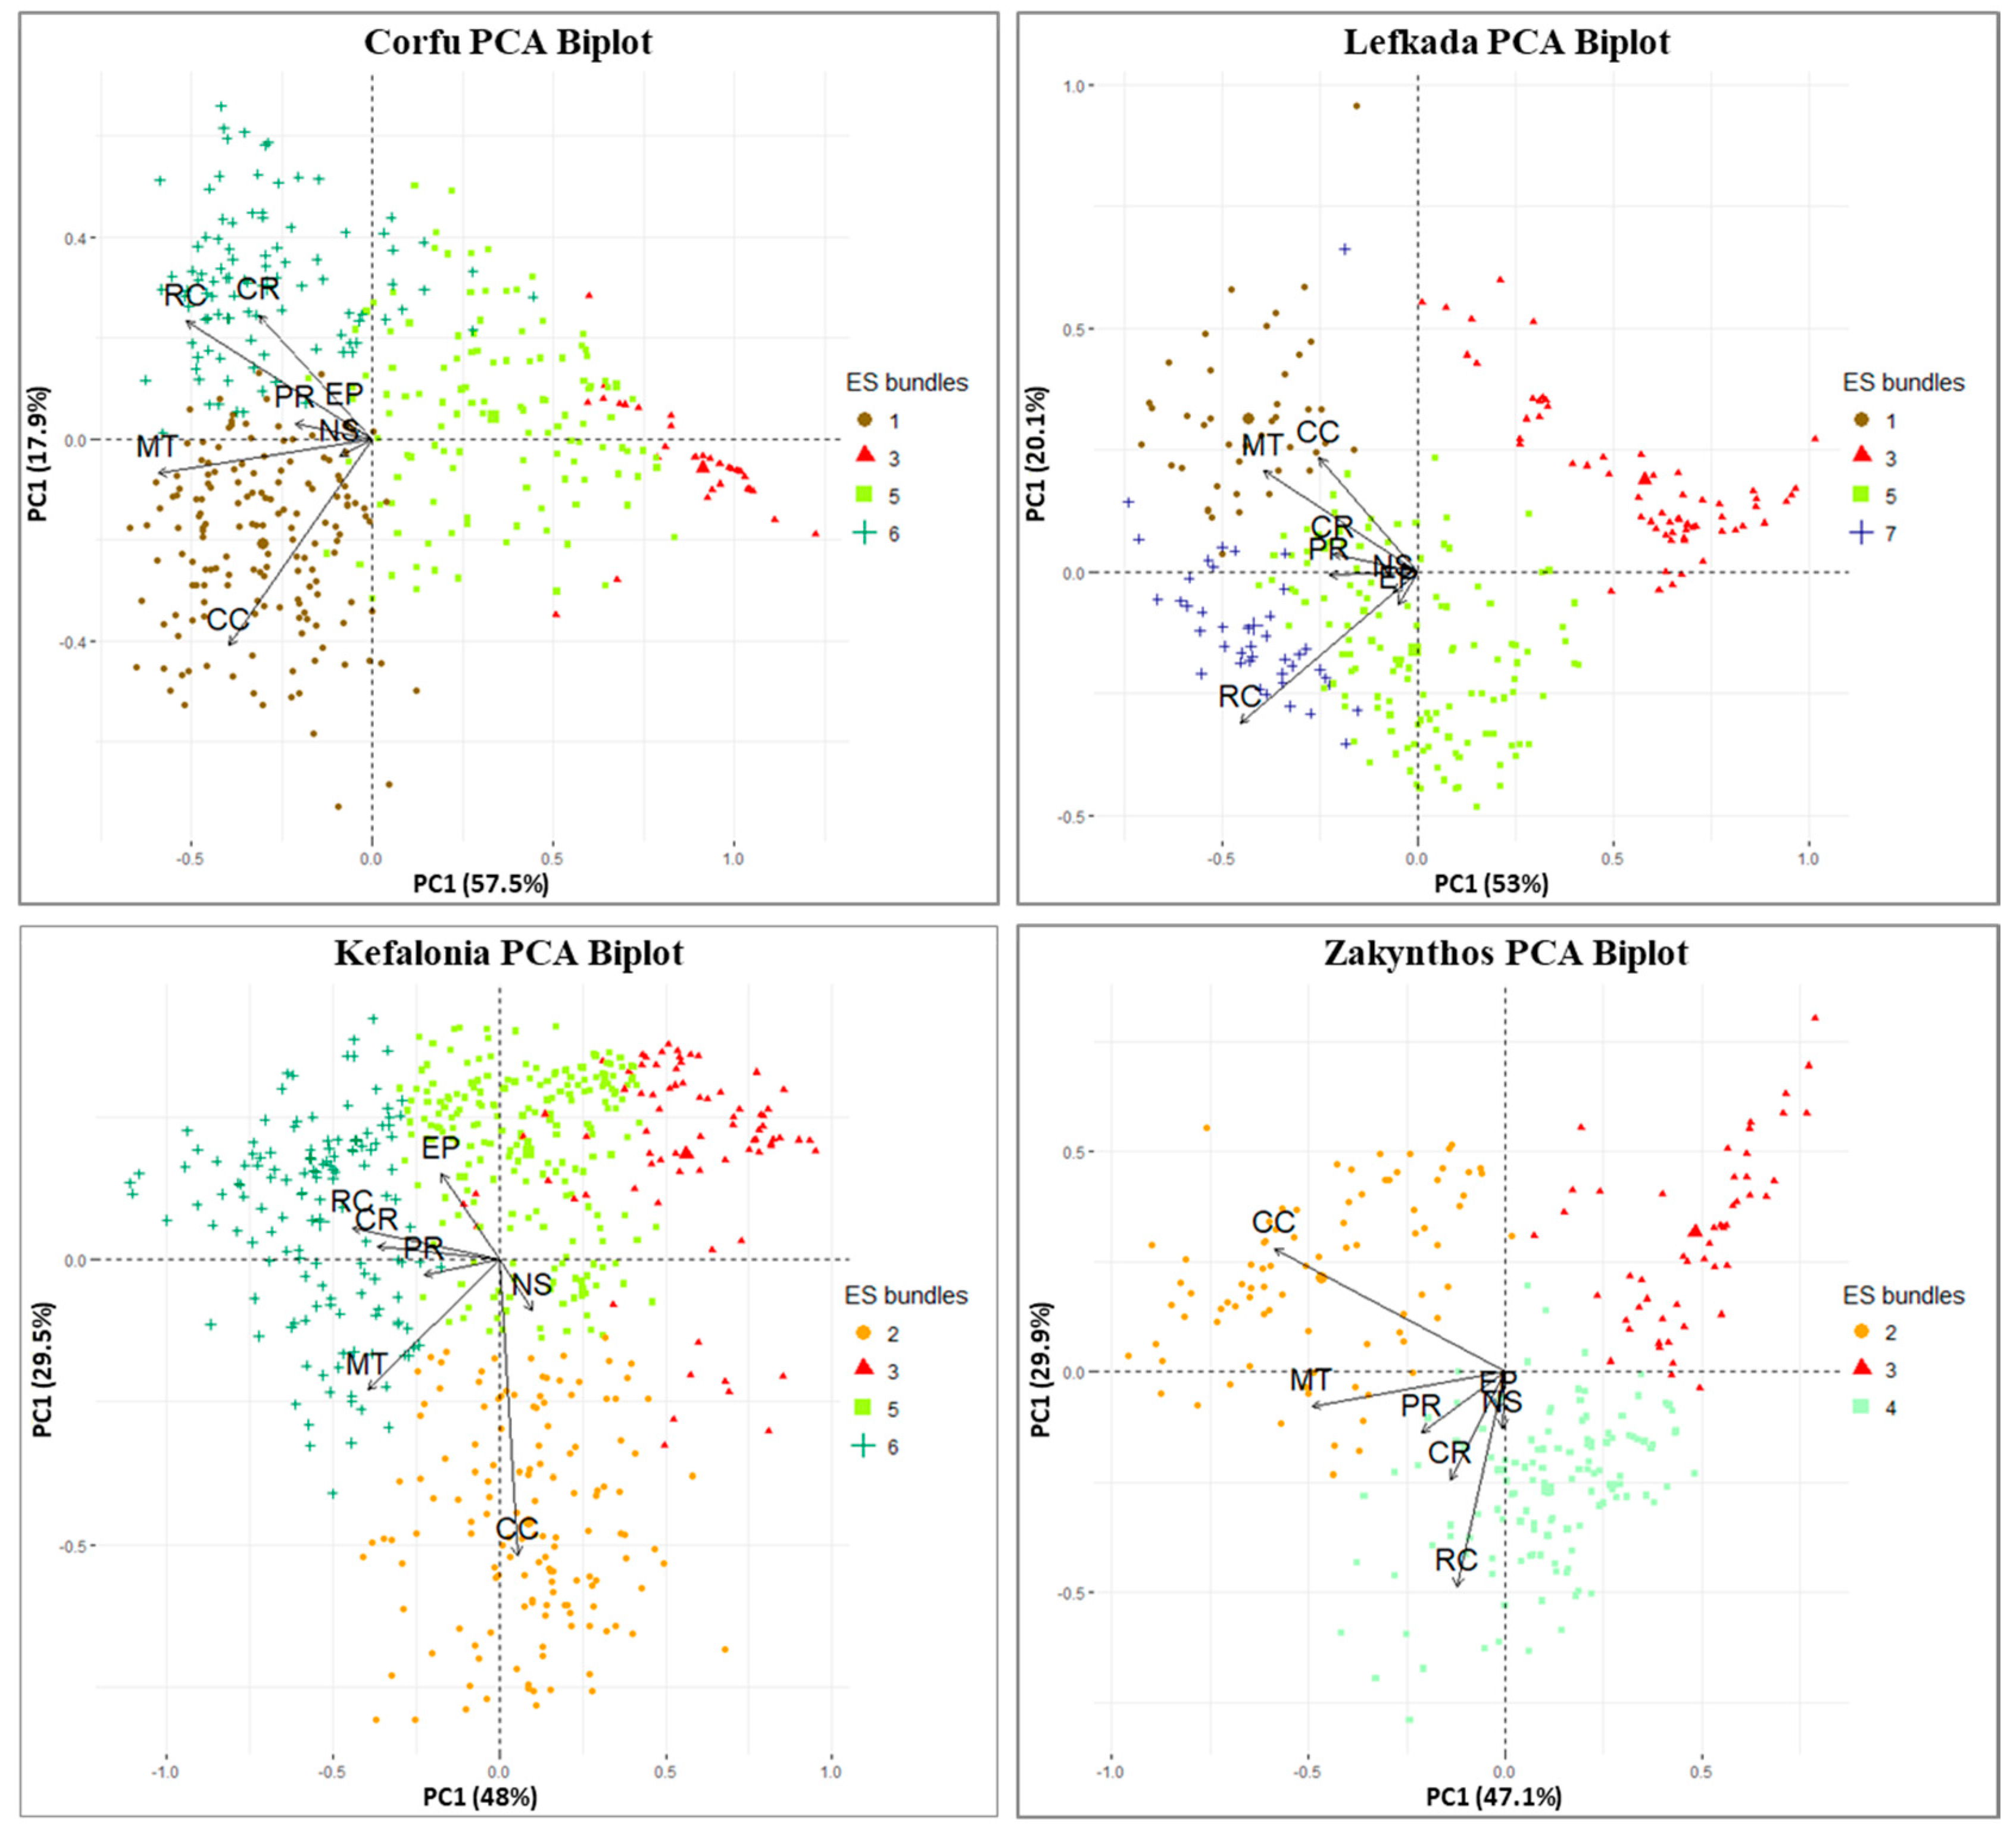
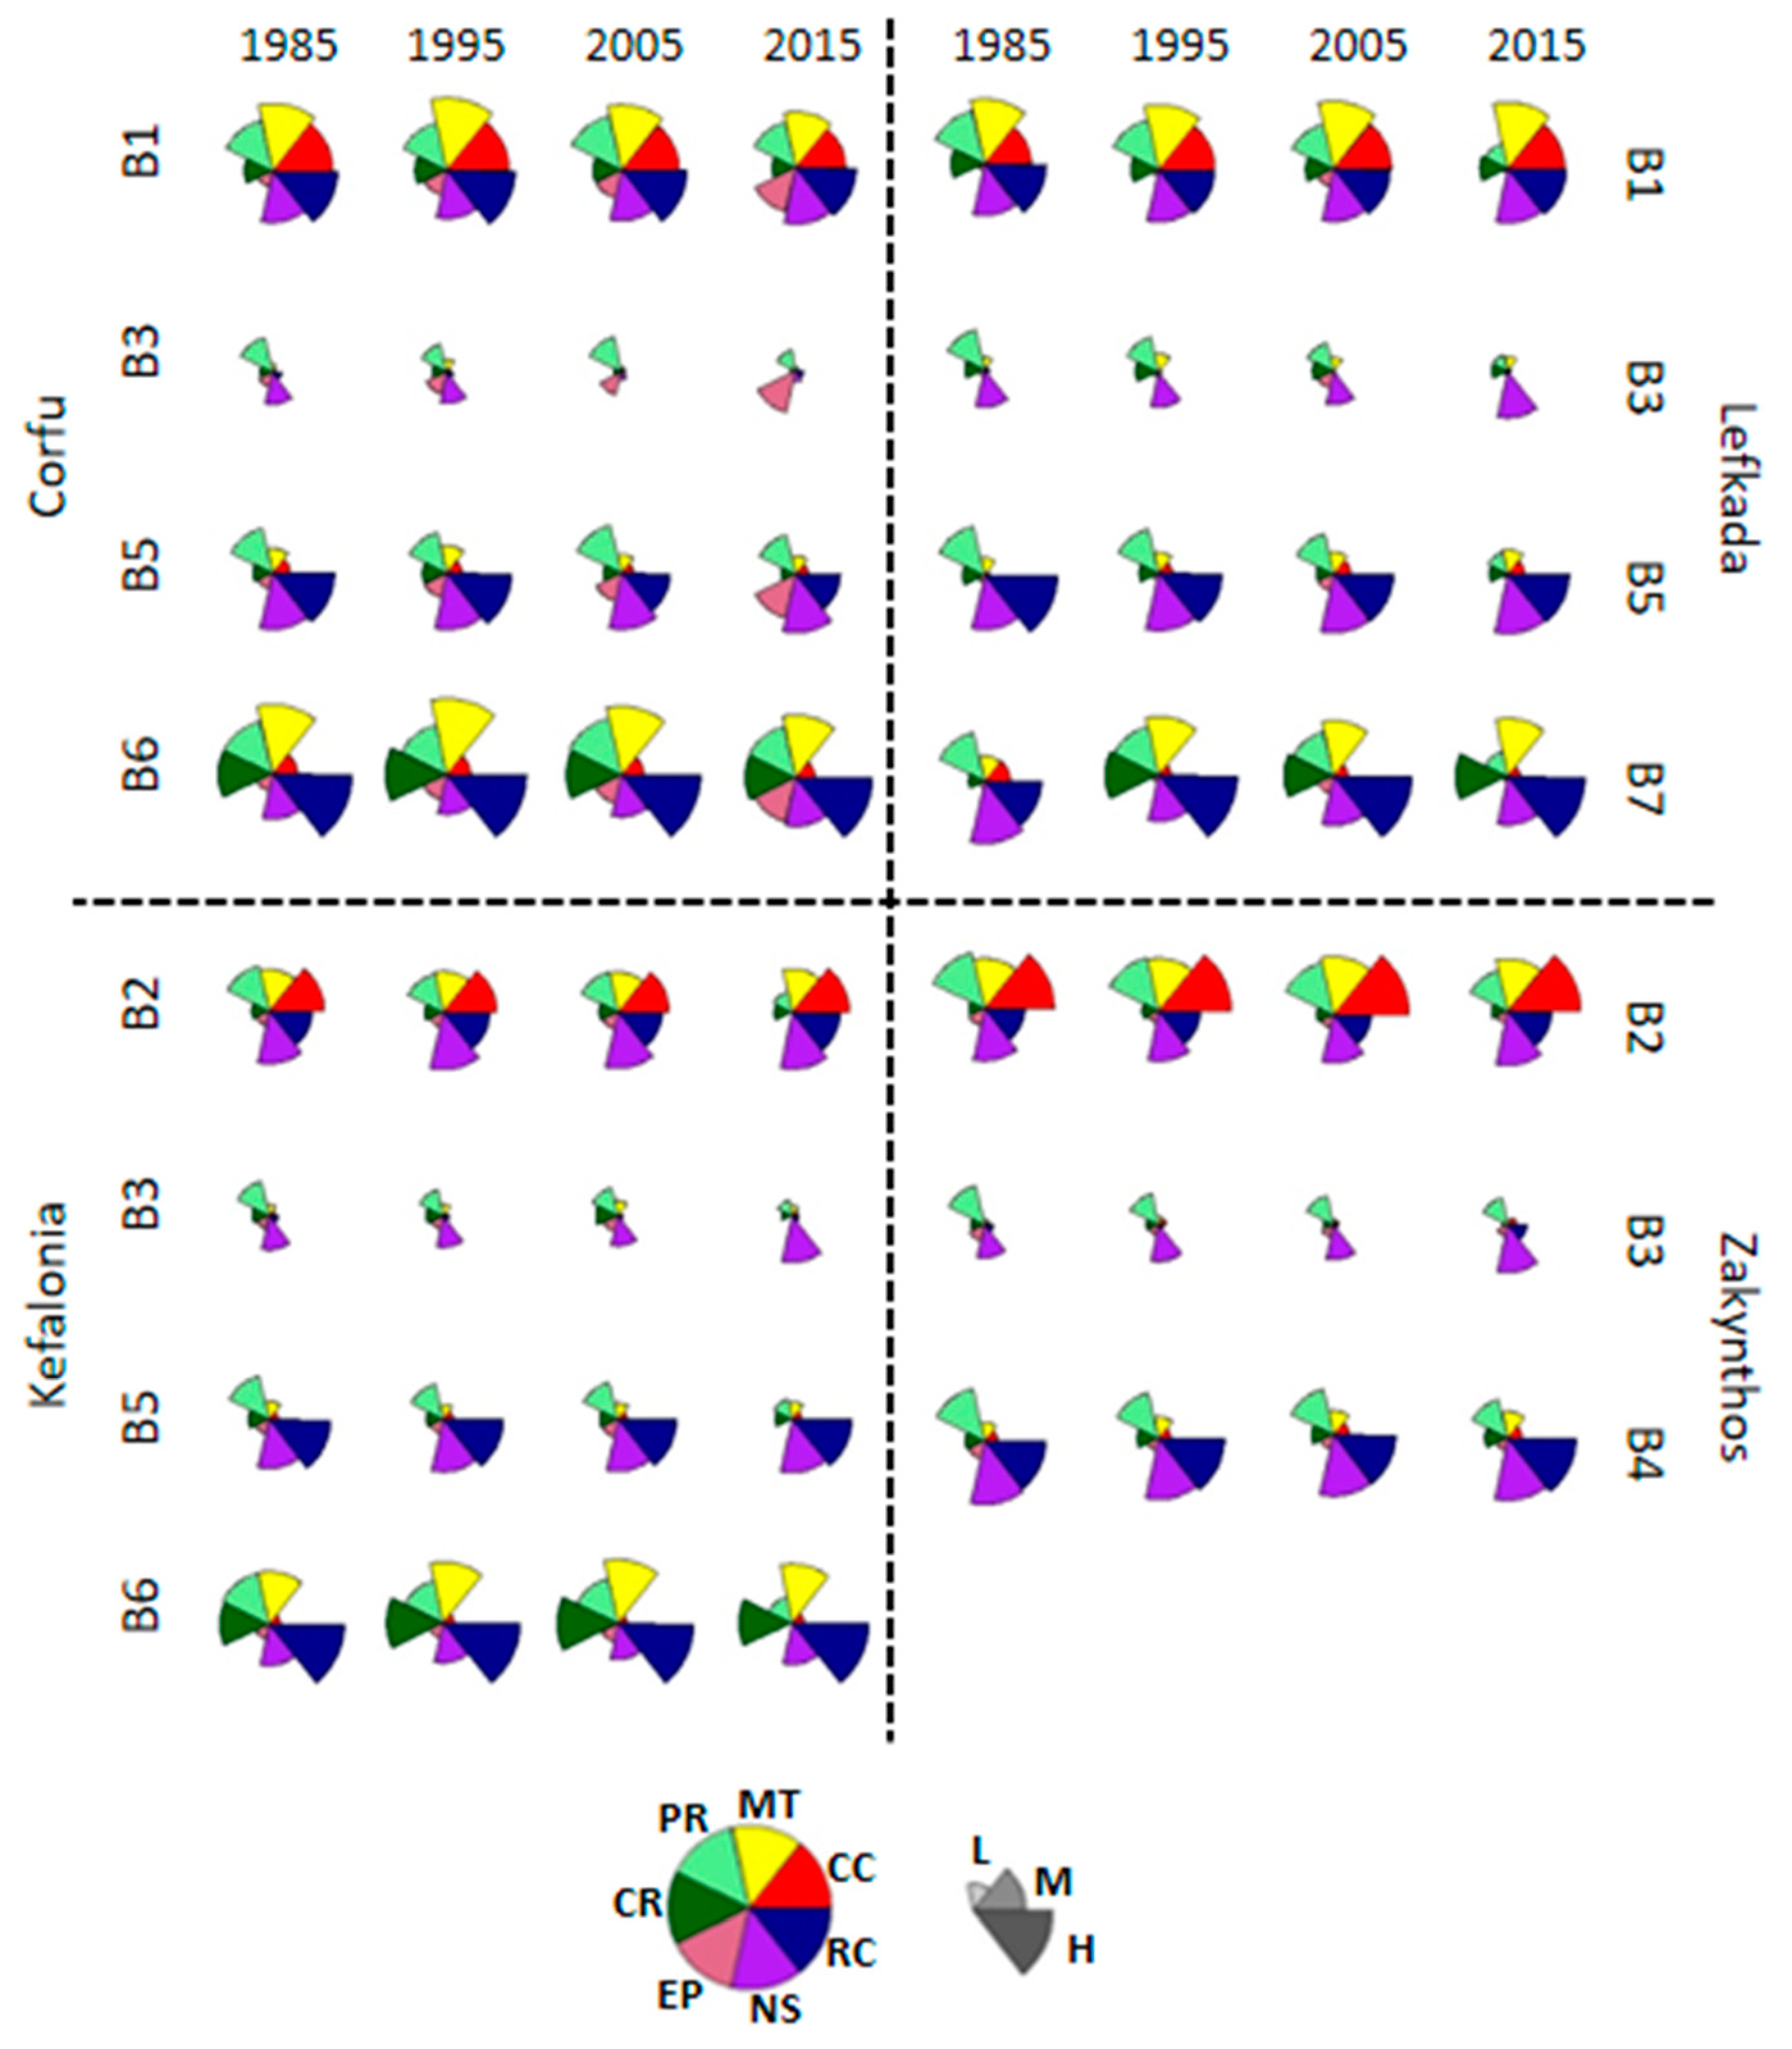
3.3. ES Bundle Characterization

Regarding the four agglomerative methods, Ward’s method presented the minimum cluster variance for all islands, because it overcame a 0.98 agglomerative coefficient followed by the complete method (0.94), average method (0.91), and single method (0.84). Hierarchical cluster analysis formed a total of seven ecosystem service bundles, from which four were identified in Corfu, four in Lefkada, four in Kefalonia, and three in Zakynthos.
The first two PCA axes explained 75.4% of the ES variability for Corfu, 73.1% for Lefkada, 77.5% for Kefalonia, and 77% for Zakynthos, respectively. The first gradient in Corfu corresponded to an axis that ranged from olives with high recreation supply to low ES supply. The second gradient was identified an axis from cultivated crops to areas with high recreation (Figure 8). The first gradient on Lefkada ranged from mixed olives with high recreation to low ES supply, while the second gradient presented a variation from diverse landscapes of high recreation to olive crop provision. The first axis, identified in Kefalonia, represented a forest recreation to low ES supply gradient, while the second gradient showed an agricultural to erosion prevention gradient. Finally, the gradients identified on Zakynthos were associated with an agricultural to low ES supply (PC axis 1) and recreation to cultivated crops (PC axis 2).
According to their location along the gradients in Figure 8, ES bundles were characterized as olive groves (B1), high agricultural provision (B2), non-vegetated-low supply (B3), mountainous areas (B4), naturally vegetated areas (B5), forest recreation (B6), and high naturalness (B7). Specifically, B1 found in Corfu and Lefkada was located on the gradients where high provision of MT and CC occurs (PCA axis 1) and the dominant land cover was olive crops. The other agricultural bundle (B2) was found on the second axis of Kefalonia and on the first axis of Zakynthos, where areas with various crop provision dominated this bundle. The bundle dominated with urban and open areas (B3) was found on all islands, and was located on the part of PCA axis 1 where ES were not correlated. In Zakynthos, B4 was characterized by a habitat mosaic (forests, transitional vegetation, shrubs, sparse vegetation, and open areas) that occurred in mountainous areas where recreation was evident. Shrubwoods, transitional vegetation, high-density olives, and forests dominated B5, where, in Corfu, no specific ES occurred. In comparison, in Lefkada and Kefalonia mostly regulating ES took place in B5. The dominant land cover of B6 consisted of forested areas and were located along gradients with high recreation. Finally, B7 was only found in Lefkada, and was placed on the high recreation part of PCA axis 1, where forest, high-density olives, and shrubbery cover were dominant.
In Table 3, the spatial changes of ES bundles over time are presented with the area percentage for each studied year. B1 and B2 (crop related bundles) remained stable over time except in Lefkada where the areas covered with olive groves declined 10% with a subsequent increase of B5. B3 decreased in Corfu and Lefkada and increased in Zakynthos, while in Kefalonia remained relatively similar. B4 had a depletion of 5% from its original state in 2015. B6 in Corfu increased throughout all of the studied years, as well as in Kefalonia between 1985–2005. However, in 2015, B6 in Kefalonia decreased by almost 4%. The last bundle (B7) represented areas with high naturalness, due to the existence of forest, shrubbery, and high-density olives, which decreased by 13% between 1985 and 1995, but then increased to 17% in 2015.

3.4. Magnitude and Composition of ES Bundles

Overall, Zakynthos appeared to have the most stable bundle composition and magnitude through time, followed by Kefalonia (Table 3 and Figure 9). Within all ES bundles, there were small variations among years, with the magnitude of few ES changing.
In the olive grove bundle (B1), MT, CC, NS, and RC had high provisioning, indicating synergies among them. Within B1 in Corfu, the magnitude of MT decreased over time, while EP increased. In comparison, in Lefkada, PR tended to decline (Figure 9). Agricultural areas (B2) in Kefalonia mainly provided CC and NS with other services also occurring (RC and MT). The high presence of provisioning ES were evident in the agricultural bundle of Zakynthos. In both Zakynthos and Kefalonia, PR in B2 decreased by 2015. As for non-vegetated areas (B3), they presented low ES supply on all islands. The mountainous bundle (B4) was only found in Zakynthos, and had a similar pattern with the naturally vegetated areas (B5) of Lefkada and Kefalonia, where NS and RC were the dominant, while PR decreased through the years. In the B5 of Corfu, the initial intensity and dominance of NS was retained, whereas EP increased and RC decreased. Corfu’s forest recreation bundle (B6) presented an increasing magnitude of NS and EP, resulting in the provision of multiple ES in 2015. In the forested areas (B6) of Kefalonia and in the high naturalness bundle (B7) of Lefkada, the supply of PR changed (from high in 1985 to low in 2015) and EP was almost absent. In both B6 and B7, RC had the highest supply, while CC was low or non-existent.

4. Discussion

4.1. Mapping Ecosystem Services

The spatial distribution of ES in three islands (Corfu, Lefkada, and Kefalonia) followed a similar spatial pattern, where provisioning ES, regulating and maintenance ES, and recreation were spatially co-occurring. This finding contrasted with that of Queiroz et al. [13], who found substantial differences in the distribution of provisioning, regulating, and cultural ES. On Zakynthos only, provisioning ES was distributed differently in relation to the other two ES groups, supporting a study conducted to an Alpine-wide level [99], in which provisioning ES was found to be clustered in different areas to those where regulating and cultural ES occur. All three ES groups exhibited significant differences in their temporal variation over time in Corfu only, whereas provisioning ES and recreation followed a similar decreasing trend and regulating services increased. These results might be due to the loss of forests and high-density olives [40]. As expected, areas of high naturalness provided high ES supply, supporting the results of previous studies [100,101,102,103], and contrasted with the lower values obtained in rocky and poorly vegetated areas.
In addition to tourism, agriculture is an important sector of the economy in the Ionian region, which explains the high presence of provisioning ES. Across the study area, olive groves cover most of the agricultural regions, with other crop types (vineyards, arable, and mixed crops) also contributing to the supply of provisioning ES. In addition, areas with a high supply of provisioning ES are characterized by low elevation and flat topography [10,14,99,104], which was more prominent in Zakynthos, as higher elevated areas had a lower supply of provisioning services as opposed to the higher provision of lowland areas.
Regulating and maintenance ES were higher in naturally vegetated and heterogeneous areas. Specifically, forested regions had a higher provision of regulating ES across the Ionian Islands (CR and EP), as shown by other case studies [13,99]. As expected the nursery service (maintenance ES) was found in more diverse landscapes regardless of the type of vegetation. In Kefalonia, damage caused by forest fires 2007 [105], along with a decline in landscape diversity, might have caused the observed decline in regulating and maintenance ES from 2005 to 2015.
The spatial pattern of recreation supply in each of the Islands was dependent on the amount of high-quality vegetation due to the higher weight value given to the degree of naturalness for mapping recreation. In Ionian Islands, a distinct mosaic of forest and olive yards is a characteristic landscape, mainly in Corfu and Lefkada, giving an extra value in the recreational service. Lower values of recreation were found in Zakynthos, due the low coverage of forests and less diverse landscape. These results were consistent with the findings of De Valck et al. [106], where in a mixed landscape including farmlands and forests, diversity was highly appreciated from recreationists.

4.2. Interactions among Ecosystem Services

This study demonstrated that ES relationships may change over time. Similar results were obtained by Renard et al. [11], who showed clear evidence of the ES dynamics. However, the general pattern for the type and strength of the ES relationships was similar among the islands, with some exceptions. Mostly positive correlations were found across the region, with Corfu having the strongest synergies and Kefalonia being subject to the most trade-off interactions. Among provisioning ES there were positive correlations, suggesting a synergistic relationship, such as the one discussed by Turner et al. [14]. Regarding the relationships between provisioning and regulating ES on a diverse landscape, Kong et al. [84] found that crop production had a significantly strong negative correlation with soil retention. However, a similar finding was only evident in Lefkada for one year (2015), where cultivated crops showed a moderate trade-off relationship with erosion prevention. In another study, Swallow et al. [107] found no significant relationship between sediment yield and agricultural production. As for the relationship between provisioning and cultural ES, cultivated crops and recreation presented consistently positive correlations, as in the case of Corfu and Lefkada. This phenomenon might be explained by agricultural land abandonment, since Queiroz et al. [13] connected the absence of strong negative trade-offs between agricultural and cultural services with low intensity agricultural practices. In contrast, in Kefalonia and Zakynthos, cultivated crops and recreation showed an antagonistic relationship, which has also been detected by other studies [10,11,14,54], possibly due to the intensification of agricultural practices. These patterns further enhance the association of mixed olives and forests with the high supply of ES [108,109].
The ES assessment followed in this study, presented various correlations and facilitated the formation of ES bundles. In total, seven ES bundles were formed in the Ionian Islands, from which agricultural and forested bundles were also identified in most studies, indicating that there is a general pattern in the formation of ES bundles. Each Ionian Island formed one bundle of agricultural use (B1 in Corfu and Lefkada, and B2 in Kefalonia and Zakynthos), supporting the results of other studies [14,104,110]. In comparison, other studies identified two crop-related bundles in a single study area [10,11,13]. Most of these existing studies recognized agricultural cover as the dominant bundle, which was only the case for the olive grove bundle (B1) in Corfu. However, the agricultural bundles still covered a large amount of land in the Mediterranean ecosystems of the Ionian Islands. In addition, this bundle in Corfu provided a set of multiple ES (incl. all ES groups) through the years, which contrasted with other agricultural bundles [10,11,84]. In Zakynthos, despite the increase in the tourism industry and population density [40], the agricultural bundle varied across years, but retained a stable extent and supply of Provisioning ES. However, in the case of another Greek Mediterranean Island, declines in the agricultural sector were linked to increasing tourism [111]. Kefalonia presented an interesting result, not found in other studies, where the agricultural bundle provided a similar and higher magnitude of recreation than provisioning ES. Seasonal variations might occur in the agricultural bundles, since different crop types are harvested in specific times of the year (i.e., vineyards are harvested in the summer season, while olive groves in the fall or winter season).
The developed bundle covered mainly by rocky, open, and urban areas (B3) occupied the smallest extent in all islands and provided a negligible amount of ES over the studied years, with similar results being obtained for other urban bundles [112]. However, these findings also contrasted with other studies, in which urban bundles provided a set of ES related to provisioning and regulating ES and, in some cases, cultural ES [10,13]. The stable composition and magnitude of the B3 bundle in Zakynthos and Kefalonia might be due to their supporting similar livestock densities, as discussed by Kefalas et al. [40].
The mountainous bundle found only in Zakynthos was characterized by a diversity of forest, transitional vegetation, shrubs, sparse vegetation, and, even, rocky and open areas, explaining the high supply of nursery and recreation. This result was obtained because the diversity of landscapes was a key indicator for these two services. Similarly, in the mountainous bundle obtained by Yang et al. [113], forest recreation had a high supply. However, in this previous study, regulating services were also highly evident in mountainous areas, as opposed to the low regulating ES supply in Zakynthos. Similar to B3 in Zakynthos, the maintenance of livestock densities resulted in the stable composition and ES magnitude of the mountainous bundle.
It is clear that, within a region, and especially an Island complex, different ES patterns occur, both among islands and at a temporal scale. For example, in Kefalonia, between 1985 and 1995, the agricultural bundle and the naturally vegetated bundle decreased in size, while forest areas increased, suggesting a lack of disturbance. In comparison, a different profile appeared between 2005 and 2015, where a depletion of forest ecosystems (decrease of B6) and gain in rocky and open areas might have been caused by forest fires [105]. Also, on Zakynthos, transitions between the non-vegetated bundles and the mountainous ecosystems might be explained by impacts from forest fires [114]. The progressive decrease in the non-vegetated bundle in Corfu with a subsequent increase in the olive grove bundle and the forest bundle might be explained by land abandonment in some areas and agricultural transition in others. Renard et al. [11] found similar contrasting trajectories in a single study area (field abandonment and agricultural specialization), contributing to the changes to ecosystem service bundles. Fire regeneration could also be suggested as a driver in the observed patterns of Corfu; however, fire events were concentrated in the north mountainous areas, where only low density vegetation was evident [40].

4.3. Implications for Policy Making

Decision makers and land managers often question how to implement ES assessments into current and future strategies [115,116].
For example, abandoning all agricultural practices, instead of maintaining a well-balanced agricultural and natural landscape, might fail to support nursery populations, in parallel to losing traditional Mediterranean landscapes [117,118,119,120]. In our case, we found that while the ‘forest recreation’ and ‘high naturalness’ bundles provide highly supplied ES, ‘olive groves’ seem to supply a variety of provisioning, regulating and cultural ES over the years. This pattern indicates that a mixed-use landscape has higher potential to provide multiple ES, as opposed to a fully abandoned and homogeneous landscape.
On the other hand, agricultural intensification might alter natural characteristics and could create more intense trade-offs with other services, such as water quality, erosion prevention, and recreation opportunity [11,121,122,123]. Conflicts between provisioning and other ES found in lowland areas of Zakynthos, suggest that there might be potential for more regulating and cultural services in these areas to avoid further increase in trade-offs among ES. By incorporating various crop types mixed with natural zones, instead of specializing on specific types, throughout an agricultural–natural ecosystem can create a more diverse landscape and other services could be enhanced without decreasing essential ES [124].
The increase in tourism requires more space for facilities and activities, with a subsequent loss of natural ecosystems and their services, which is the case for Corfu and Zakynthos [30]. While investing in more accommodation and entertainment facilities seems profitable, it is a temporary decision leading to long-term consequences, as tourism depends on the highly natural and cultural value of the Ionian Islands. If decisions on land modification are not properly managed or not carefully planned, severe impacts both on the environment and tourism might occur in the near future. Despite the negative impact of mass-tourism on natural ecosystems, the preservation of cultural landscapes providing local products and touristic opportunities could contribute to a more sustainable tourism [30,40].
Regarding recreation, which is of high importance in the Ionian Islands, attention is needed due to an increasing focus on nature tourism (also known as eco-tourism). Lacitignola et al. [32] define eco-tourism as “responsible travel to areas with relatively high degree of natural values”. However, like any other resource exploitation activity, nature-based tourism requires management and control [33]. Specifically, recreation and nature tourism consist of activities that have both economic and environmental implications, such as disturbance frequency, development of facilities, unorganized visits, and a lack of knowledge and information [33,125]. Therefore, detailed information is required on the possible impacts of all activities, even those dependent on the quality of the environment more than any other form of tourism. Nonetheless, the synergistic relationship of recreation with other ES revealed the potential of Mediterranean ecosystems to support multiple ES.
Such management actions, which aim to increase specific ES rather than multiple ES, should be well planned, designed, and implemented to maintain equilibrium between human-wellbeing and healthy ecosystems. Knowledge on the interactions among ES might prevent future impacts from resource management policies [126,127], especially when managing heterogeneous landscapes [128], such as those in the Ionian Islands.

5. Conclusions

To manage ecosystems sustainably, knowledge about how ES vary at spatial and temporal scales is required. This study showed the similarities and differences in the distribution and interactions of ES among the Ionian Islands. Provisioning, regulating, and recreation ES present spatial congruence in some islands, as opposed to others, where provisioning ES followed different pattern in relation to regulating ES and recreation. In addition, the mountainous areas of Lefkada were occupied by lower Total ES supply due to the absence of natural vegetation, whereas the mountainous regions of Kefalonia had moderate to higher Total ES values. The contribution of mixed olive trees with natural vegetation played a key role in these patterns. Overall, recreation was dominant in relation to provisioning and regulating ES, as the islands are characterized by high natural and diverse ecosystems. This study also demonstrated that interactions among ecosystem services were not static and changed over time, probably as a result of changing spatial policies directly affecting land cover. Agricultural production, land abandonment, increasing tourism, and forest fires might represent the main factors driving trajectories in ES relationships and among ES bundles. The formed ES bundles had distinct compositions and magnitudes, but these were highly dependent on the selected ES and mapping methods. However, similar results were observed in other study areas, indicating the formation of key ES bundles across different landscapes. Areas dominated by olive groves delivered the most ES with high magnitude, showing high synergies within these regions, due to the complex ecological processes that are needed to maintain such ecosystems. This study’s findings provide useful information on the dynamic nature of ES in Mediterranean island ecosystems, which can be used by stakeholders, decision- and policy-makers for promoting sustainable resource management and planning. Knowledge on the spatial and temporal changes of ES supply and interactions can improve the understanding of underlying processes affecting these changes and optimize the provisioning of multiple ES.
Further research could focus on how socioeconomic factors influence the provisioning of ES and ES bundles, as well as the impacts of possible management policies (for example, with the Common Agricultural Policy) on ES. This approach would facilitate the adjustment of current management plans and the design future strategies to ensure a constant supply of ecosystem services is maintained.

Author Contributions

Conceptualization and methodology: R.S.L. and K.P.; Data analysis: R.S.L.; Writing—original draft manuscript: R.S.L. and K.P.; and Writing—review and editing: K.P., S.K., V.D., and A.M.

Funding

This research was supported by the General Secretariat for Research and Technology (GSRT) and the Hellenic Foundation for Research and Innovation (HFRI).

Acknowledgments

The authors acknowledge the use of the software GeoDa version 1.12.1.137 for spatial autocorrelation and the software R version 3.5.0 and R Studio Version 1.1.453 for the ES assessment processes. We thank Inforest Research O.C. for providing the ENVI (version 5.5) software. Special thanks to Gail Schofield for the review and linguistic editing of the text. Anonymous reviewers are gratefully acknowledged for their comments and suggestions to improve the initial version of this paper.

Conflicts of Interest

The authors declare no conflict of interest.

Appendix A

Figure A1. Maps of individual ES for 2015. CC: cultivated crops; MT: materials from timber; PR: plant-based resources; CR: climate regulation; EP: erosion prevention; NS: nursery; RC: recreation.
Sustainability 10 03285 g0a1

Appendix B

Table A1. Moran’s I (M.I.) spatial autocorrelation results for Corfu
CorfuHexagonal 100 haHexagonal Grid 200 haMunicipal. Grid
M.I.z-Valuep-ValueM.I.z-Valuep-ValueM.I.z-Valuep-Value
19850.351715.11910.0010.501016.40850.0010.43536.62890.001
19950.300913.11780.0010.473015.67840.0010.41326.30220.001
20050.322713.93480.0010.516716.79240.0010.43676.51280.001
20150.309713.54810.0010.488615.89710.0010.40375.95020.001
Randomization: 999 Permutations.
Table A2. Moran’s I (M.I.) spatial autocorrelation results for Lefkada
LefkadaHexagonal 100 haHexagonal Grid 200 haMunicipal. Grid
M.I.z-Valuep-ValueM.I.z-Valuep-ValueM.I.z-Valuep-Value
19850.380912.90640.0010.439410.30410.0010.26152.63960.006
19950.379812.79790.0010.444210.46010.0010.20992.17990.024
20050.414213.64650.0010.448310.61740.0010.18911.96800.036
20150.395513.14850.0010.500511.75090.0010.11761.31830.112
Randomization: 999 Permutations.
Table A3. Moran’s I (M.I.) spatial autocorrelation results for Kefalonia
KefaloniaHexagonal 100 haHexagonal Grid 200 haMunicipal. Grid
M.I.z-Valuep-ValueM.I.z-Valuep-ValueM.I.z-Valuep-Value
19850.198310.01530.0010.342912.52410.0010.42956.71340.001
19950.240612.07750.0010.406914.82250.0010.49827.80210.001
20050.216910.84010.0010.408315.00740.0010.50638.01890.001
20150.267513.10310.0010.422215.48190.0010.45317.19610.001
Randomization: 999 Permutations.
Table A4. Moran’s I (M.I.) spatial autocorrelation results for Zakynthos
ZakynthosHexagonal 100 haHexagonal Grid 200 haMunicipal. Grid
M.I.z-Valuep-ValueM.I.z-Valuep-ValueM.I.z-Valuep-Value
19850.319311.65420.0010.36818.83110.0010.30863.48950.003
19950.324611.83950.0010.37239.13760.0010.36254.10150.001
20050.300010.70040.0010.32678.05600.0010.33683.73790.001
20150.317511.36670.0010.423510.18690.0010.33043.70960.001
Randomization: 999 Permutations.

Appendix C

Figure A2. Pairwise correlations among ES for 1985. Dark blue indicates strongly positive correlations defined as synergies and dark red indicates strongly negative correlations defined as trade-offs. White squares represent non-significant correlations (p > 0.05); CC: cultivated crops; MT: materials from timber; PR: plant-based resources; CR: climate regulation; EP: erosion prevention; NS: nursery; RC: recreation.
Sustainability 10 03285 g0a2
Figure A3. Pairwise correlations among ES for 1995. Dark blue indicates strongly positive correlations defined as synergies and dark red indicates strongly negative correlations defined as trade-offs. White squares represent non-significant correlations (p > 0.05); CC: cultivated crops; MT: materials from timber; PR: plant-based resources; CR: climate regulation; EP: erosion prevention; NS: nursery; RC: recreation.
Sustainability 10 03285 g0a3
Figure A4. Pairwise correlations among ES for 2005. Dark blue indicates strongly positive correlations defined as synergies and dark red indicates strongly negative correlations defined as trade-offs. White squares represent non-significant correlations (p > 0.05); CC: cultivated crops; MT: materials from timber; PR: plant-based resources; CR: climate regulation; EP: erosion prevention; NS: nursery; RC: recreation.
Sustainability 10 03285 g0a4

References

  1. Carabine, E.; Venton, C.C.; Tanner, T.; Bahadur, A. The Contribution of Ecosystem Services to Human Resilience: A Rapid Review; Oversease Development Institute: London, UK, 2015; Available online: https://www.odi.org/publications/9150-contribution-ecosystem-services-human-resilience-rapid-review (accessed on 15 March 2018).
  2. De Groot, R.S.; Alkemade, R.; Braat, L.; Hein, L.; Willemen, L. Challenges in integrating the concept of ecosystem services and values in landscape planning, management and decision making. Ecol. Complex. 2010, 7, 260–272. [Google Scholar] [CrossRef]
  3. Millennium Ecosystem Assessment. Ecosystems and Human Well-Being; Island Press: Washington, DC, USA, 2003; ISBN 1559634022. [Google Scholar]
  4. Crossman, N.D.; Burkhard, B.; Nedkov, S.; Willemen, L.; Petz, K.; Palomo, I.; Drakou, E.G.; Martín-Lopez, B.; McPhearson, T.; Boyanova, K.; et al. A blueprint for mapping and modelling ecosystem services. Ecosyst. Serv. 2013, 4, 4–14. [Google Scholar] [CrossRef]
  5. Tallis, H.; Kareiva, P.; Marvier, M.; Chang, A. An ecosystem services framework to support both practical conservation and economic development. Proc. Natl. Acad. Sci. USA 2008, 105, 9457–9464. [Google Scholar] [CrossRef] [PubMed] [Green Version]
  6. Egoh, B.; Reyers, B.; Rouget, M.; Richardson, D.M.; Le Maitre, D.C.; van Jaarsveld, A.S. Mapping ecosystem services for planning and management. Agric. Ecosyst. Environ. 2008, 127, 135–140. [Google Scholar] [CrossRef]
  7. Termorshuizen, J.W.; Opdam, P. Landscape services as a bridge between landscape ecology and sustainable development. Landsc. Ecol. 2009, 24, 1037–1052. [Google Scholar] [CrossRef]
  8. Bennett, E.M.; Peterson, G.D.; Gordon, L.J. Understanding relationships among multiple ecosystem services. Ecol. Lett. 2009, 12, 1394–1404. [Google Scholar] [CrossRef] [PubMed] [Green Version]
  9. Plieninger, T.; Dijks, S.; Oteros-Rozas, E.; Bieling, C. Assessing, mapping, and quantifying cultural ecosystem services at community level. Land Use Policy 2013, 33, 118–129. [Google Scholar] [CrossRef] [Green Version]
  10. Raudsepp-Hearne, C.; Peterson, G.D.; Bennett, E.M. Ecosystem service bundles for analyzing tradeoffs in diverse landscapes. Proc. Natl. Acad. Sci. USA 2010, 107, 5242–5247. [Google Scholar] [CrossRef] [PubMed] [Green Version]
  11. Renard, D.; Rhemtulla, J.M.; Bennett, E.M. Historical dynamics in ecosystem service bundles. Proc. Natl. Acad. Sci. USA 2015, 112, 13411–13416. [Google Scholar] [CrossRef] [PubMed] [Green Version]
  12. Tomscha, S.A.; Gergel, S.E. Ecosystem service trade-offs and synergies misunderstood without landscape history. Ecol. Soc. 2016, 21. [Google Scholar] [CrossRef] [Green Version]
  13. Queiroz, C.; Meacham, M.; Richter, K.; Norstro, A.V.; Andersson, E.; Norberg, J.; Peterson, G. Mapping bundles of ecosystem services reveals distinct types of multifunctionality within a Swedish landscape. AMBIO 2015, 44, 89–101. [Google Scholar] [CrossRef] [PubMed] [Green Version]
  14. Turner, K.G.; Odgaard, M.V.; Bøcher, P.K.; Dalgaard, T.; Svenning, J.C. Bundling ecosystem services in Denmark: Trade-offs and synergies in a cultural landscape. Landsc. Urban Plan. 2014, 125, 89–104. [Google Scholar] [CrossRef]
  15. Rau, A.-L.; von Wehrden, H.; Abson, D.J. Temporal Dynamics of Ecosystem Services. Ecol. Econ. 2018, 151, 122–130. [Google Scholar] [CrossRef]
  16. Sutherland, I.J.; Bennett, E.M.; Gergel, S.E. Recovery trends for multiple ecosystem services reveal non-linear responses and long-term tradeoffs from temperate forest harvesting. For. Ecol. Manag. 2016, 374, 61–70. [Google Scholar] [CrossRef]
  17. Koch, E.W.; Barbier, E.B.; Silliman, B.R.; Reed, D.J.; Perillo, G.M.E.; Hacker, S.D.; Granek, E.F.; Primavera, J.H.; Muthiga, N.; Polasky, S.; et al. Non-linearity in ecosystem services: Temporal and spatial variability in coastal protection. Front. Ecol. Environ. 2009, 7, 29–37. [Google Scholar] [CrossRef]
  18. Balzan, M.V.; Potschin-Young, M.; Haines-Young, R. Island ecosystem services: Insights from a literature review on case-study island ecosystem services and future prospects. Int. J. Biodivers. Sci. Ecosyst. Serv. Manag. 2018, 14, 71–90. [Google Scholar] [CrossRef]
  19. Martín-López, B.; Iniesta-Arandia, I.; García-Llorente, M.; Palomo, I.; Casado-Arzuaga, I.; Del Amo, D.G.; Gómez-Baggethun, E.; Oteros-Rozas, E.; Palacios-Agundez, I.; Willaarts, B.; et al. Uncovering ecosystem service bundles through social preferences. PLoS ONE 2012, 7. [Google Scholar] [CrossRef] [PubMed]
  20. Balzan, M.V.; Caruana, J.; Zammit, A. Assessing the capacity and flow of ecosystem services in multifunctional landscapes: Evidence of a rural-urban gradient in a Mediterranean small island state. Land Use Policy 2018. [Google Scholar] [CrossRef]
  21. Blondel, J.; Aronson, J.; Bodiou, J.-Y.; Boeuf, G. The Mediterranean Region: Biological Diversity in Space and Time; Oxford University Press: Oxford, UK, 2010; ISBN 978-0-19-955798-1. [Google Scholar]
  22. Koniak, G.; Noy-Meir, I.; Perevolotsky, A. Modelling dynamics of ecosystem services basket in Mediterranean landscapes: A tool for rational management. Landsc. Ecol. 2011, 26, 109–124. [Google Scholar] [CrossRef]
  23. Metzger, M.J.; Rounsevell, M.D.A.; Acosta-Michlik, L.; Leemans, R.; Schröter, D. The vulnerability of ecosystem services to land use change. Agric. Ecosyst. Environ. 2006, 114, 69–85. [Google Scholar] [CrossRef]
  24. Caraveli, H. A comparative analysis on intensification and extensification in mediterranean agriculture: Dilemmas for LFAs policy. J. Rural Stud. 2000, 16, 231–242. [Google Scholar] [CrossRef]
  25. Giourga, H.; Margaris, N.S.; Vokou, D. Effects of grazing pressure on succession process and productivity of old fields on Mediterranean islands. Environ. Manag. 1998, 22, 589–596. [Google Scholar] [CrossRef]
  26. Hoballah, A. Sustainable development in the Mediterranean region. Nat. Resour. Forum 2006, 30, 157–167. [Google Scholar] [CrossRef]
  27. Keeley, J.E.; Bond, W.J.; Bradstock, R.A.; Pausas, J.G.; Rundel, P.W. Fire in Mediterranean Ecosystems: Ecology, Evolution and Management; Cambridge University Press: Cambridge, UK, 2011; ISBN 9780521824910. [Google Scholar]
  28. Novara, A.; Gristina, L.; Sala, G.; Galati, A.; Crescimanno, M.; Cerdà, A.; Badalamenti, E.; La Mantia, T. Agricultural land abandonment in Mediterranean environment provides ecosystem services via soil carbon sequestration. Sci. Total Environ. 2017, 576, 420–429. [Google Scholar] [CrossRef] [PubMed] [Green Version]
  29. Perevolotsky, A.; Seligman, N.G. Role of Grazing in Mediterranean Rangeland Ecosystems. Bioscience 1998, 48, 1007–1017. [Google Scholar] [CrossRef] [Green Version]
  30. Vogiatzakis, I.; Mannion, A.M.; Pungetti, G. Mediterranean Island Landscapes: Natural and Cultural Approaches; Springer: Cham, Switzerland, 2008; p. 9. ISBN 978-1-4020-5063-3. [Google Scholar]
  31. Sundseth, K. Natura 2000 in the Mediterranean Region; European Commission: Luxembourg, 2009; p. 12. [Google Scholar] [CrossRef]
  32. Lacitignola, D.; Petrosillo, I.; Cataldi, M.; Zurlini, G. Modelling socio-ecological tourism-based systems for sustainability. Ecol. Model. 2007, 206, 191–204. [Google Scholar] [CrossRef]
  33. Petrosillo, I.; Zurlini, G.; Grato, E.; Zaccarelli, N. Indicating fragility of socio-ecological tourism-based systems. Ecol. Indic. 2006, 6, 104–113. [Google Scholar] [CrossRef]
  34. Plieninger, T.; Fagerholm, N.; Bieling, C.; Kuemmerle, T.; Verburg, P.H. The driving forces of landscape change in Europe: A systematic review of the evidence. Land Use Policy 2016, 57, 204–214. [Google Scholar] [CrossRef]
  35. Petrosillo, I.; Costanza, R.; Aretano, R.; Zaccarelli, N.; Zurlini, G. The use of subjective indicators to assess how natural and social capital support residents’ quality of life in a small volcanic island. Ecol. Indic. 2013, 24, 609–620. [Google Scholar] [CrossRef]
  36. Lacitignola, D.; Petrosillo, I.; Zurlini, G. Time-dependent regimes of a tourism-based social-ecological system: Period-doubling route to chaos. Ecol. Complex. 2010, 7, 44–54. [Google Scholar] [CrossRef]
  37. Vogiatzakis, I.N.; Mannion, A.M.; Sarris, D. Mediterranean island biodiversity and climate change: The last 10,000 years and the future. Biodivers. Conserv. 2016, 25, 2597–2627. [Google Scholar] [CrossRef]
  38. Balzan, M.V.; Potschin, M.; Haines-Young, R. Place-Based Assessment of Small Islands’ Ecosystem Services. In Routledge Handbook of Ecosystem Services; Haines-Young, R., Potschin, M., Fish, R., Turner, R.K., Eds.; Routledge Handbook Series; Routledge: London, UK, 2016; pp. 140–143. ISBN 978-1-138-02508-0. [Google Scholar]
  39. Evelpidou, N. Modelling of erosional processes in the Ionian Islands (Greece). Geomatics Nat. Hazards Risk 2012, 3, 293–310. [Google Scholar] [CrossRef] [Green Version]
  40. Kefalas, G.; Poirazidis, K.; Xofis, P.; Kalogirou, S. Mapping and Understanding the Dynamics of Landscape Changes on Heterogeneous Mediterranean Islands with the Use of OBIA: The Case of Ionian Region, Greece. Sustainability 2018, 10, 2986. [Google Scholar] [CrossRef]
  41. Schofield, G.; Scott, R.; Katselidis, K.A.; Mazaris, A.D.; Hays, G.C. Quantifying wildlife-watching ecotourism intensity on an endangered marine vertebrate. Anim. Conserv. 2015, 18, 517–528. [Google Scholar] [CrossRef]
  42. Courtis, P.; Mylonakis, J. A holistic approach of assessing and improving competitiveness in tourism: The case of Ionian Islands (Greece). Probl. Perspect. Manag. 2008, 6, 31–37. [Google Scholar]
  43. Gauci, J.B.; Attard, C.; Camilleri, S.P.; Cauchi, M.; Gatt, A. Collective accommodation establishments in Corfu, Cyprus, and Malta: A comparative study of online prices. Anatolia 2013, 24, 319–336. [Google Scholar] [CrossRef]
  44. Prokopiou, D.G.; Tselentis, B.S.; Bousbouras, D. Tourist development and the environment: The case of Cephalonia and Ithaca. WIT Trans. Ecol. Environ. 2008, 115, 187–196. [Google Scholar] [CrossRef]
  45. Prunier, E.K.; Sweeney, A.E.; Geen, A.G. Tourism and the environment: The case of Zakynthos. Tour. Manag. 1993, 14, 137–141. [Google Scholar] [CrossRef]
  46. Haines-Young, R.; Potschin, M.B. Common International Classification of Ecosystem Services (CICES) V5.1 and Guidance on the Application of the Revised Structure. 2017. Available online: www.cices.eu (accessed on 10 October 2017).
  47. Haines-Young, R.; Potschin, M.B. Common International Classification of Ecosystem Services (CICES) V5.1 and Guidance on the Application of the Revised Structure. 2018. Available online: www.cices.eu (accessed on 15 February 2018).
  48. United States Geological Servey. EarthExplorer. Available online: https://earthexplorer.usgs.gov (accessed on 5 March 2018).
  49. Joint Research Center. European Soil Data Centre. Available online: https://esdac.jrc.ec.europa.eu (accessed on 5 March 2018).
  50. WorldClim. Global Climate Date. Available online: http://www.worldclim.org (accessed on 7 March 2018).
  51. National Aeronautics and Space Administration. Earthdata Search. Available online: https://search.earthdata.nasa.gov (accessed on 5 March 2018).
  52. Carbon Dioxide Information Analysis Center. Major World Ecosystem Complexes Ranked by Carbon in Live Vegetation: A Database (NDP-017). Available online: http://cdiac.ess-dive.lbl.gov/epubs/ndp/ndp017/table_b.html#table4 (accessed on 6 March 2018).
  53. Cadastre and Mapping Organization of Greece. National Infrastructure of Geospatial Information. Available online: http://www.inspire.okxe.gr (accessed on 8 March 2018).
  54. Maes, J.; Paracchini, M.L.; Zulian, G.; Dunbar, M.B.; Alkemade, R. Synergies and trade-offs between ecosystem service supply, biodiversity, and habitat conservation status in Europe. Biol. Conserv. 2012, 155, 1–12. [Google Scholar] [CrossRef]
  55. De Araujo Barbosa, C.C.; Atkinson, P.M.; Dearing, J.A. Remote sensing of ecosystem services: A systematic review. Ecol. Indic. 2015, 52, 430–443. [Google Scholar] [CrossRef]
  56. Feng, X.; Fu, B.; Yang, X.; Lü, Y. Remote sensing of ecosystem services: An opportunity for spatially explicit assessment. Chin. Geogr. Sci. 2010, 20, 522–535. [Google Scholar] [CrossRef] [Green Version]
  57. Jiang, Z.; Huete, A.R.; Didan, K.; Miura, T. Development of a two-band enhanced vegetation index without a blue band. Remote Sens. Environ. 2008, 112, 3833–3845. [Google Scholar] [CrossRef]
  58. Maes, J.; Teller, A.; Erhard, M.; Liquete, C.; Braat, L.; Berry, P.; Egoh, B.; Puydarrieux, P.; Fiorina, C.; Santos-Martín, F.; et al. Mapping and Assessment of Ecosystems and their Services: An analytical framework for ecosystem assessments under Action 5 of the EU Biodiversity Strategy to 2020. Publ. Off. Eur. Union Luxemb. 2013. [Google Scholar] [CrossRef]
  59. OpenNESS Glossary [edited by Potschin, M.; Haines-Young, R.; Heink, U.; Jax, K. OpenNESS Glossary 2016, 3, Grant Agreement No 308428. Available online: http://www.openness-project.eu/glossary (accessed on 15 May 2018).
  60. Guerra, C.A.; Maes, J.; Geijzendorffer, I.; Metzger, M.J. An assessment of soil erosion prevention by vegetation in Mediterranean Europe: Current trends of ecosystem service provision. Ecol. Indic. 2016, 60, 213–222. [Google Scholar] [CrossRef]
  61. Gibbs, H.K.; Olsen, L.; Boden, T. Major world ecosystem complexes ranked by carbon in live vegetation: An updated database using the GLC2000 land cover product. Oak Ridge Natl. Lab. Oak Ridge USA 2006. [Google Scholar] [CrossRef]
  62. Liquete, C.; Cid, N.; Lanzanova, D.; Grizzetti, B.; Reynaud, A. Perspectives on the link between ecosystem services and biodiversity: The assessment of the nursery function. Ecol. Indic. 2016, 63, 249–257. [Google Scholar] [CrossRef]
  63. Maes, J.; Teller, A.; Erhard, M.; Murphy, P.; Paracchini, M.; José, B.; Grizzetti, B. Mapping and assessment of ecosystems and their services: Indicators for ecosystem assessments under Action 5 of the EU Biodiversity Strategy to 2020. Publ. Off. Eur. Union Luxemb. 2014, 81. [Google Scholar] [CrossRef]
  64. Casado-Arzuaga, I.; Onaindia, M.; Madariaga, I.; Verburg, P.H. Mapping recreation and aesthetic value of ecosystems in the Bilbao Metropolitan Greenbelt (northern Spain) to support landscape planning. Landsc. Ecol. 2013, 29, 1393–1405. [Google Scholar] [CrossRef]
  65. Peña, L.; Casado-Arzuaga, I.; Onaindia, M. Mapping recreation supply and demand using an ecological and a social evaluation approach. Ecosyst. Serv. 2015, 13, 108–118. [Google Scholar] [CrossRef]
  66. De Vries, S.; Klein-Lankhorst, J.R.; Buijs, A.E. Mapping the attractiveness of the Dutch countryside: A GIS-based landscape appreciation model. For. Snow Landsc. Res. 2007, 81, 43–58. [Google Scholar]
  67. Norton, L.R.; Inwood, H.; Crowe, A.; Baker, A. Land Use Policy Trialling a method to quantify the ‘cultural services’ of the English landscape using Countryside Survey data. Land Use Policy 2012, 29, 449–455. [Google Scholar] [CrossRef] [Green Version]
  68. Frank, S.; Fürst, C.; Koschke, L.; Witt, A.; Makeschin, F. Assessment of landscape aesthetics—Validation of a landscape metrics-based assessment by visual estimation of the scenic beauty. Ecol. Indic. 2013, 32, 222–231. [Google Scholar] [CrossRef]
  69. Ridding, L.E.; Redhead, J.W.; Oliver, T.H.; Schmucki, R.; McGinlay, J.; Graves, A.R.; Morris, J.; Bradbury, R.B.; King, H.; Bullock, J.M. The importance of landscape characteristics for the delivery of cultural ecosystem services. J. Environ. Manag. 2018, 206, 1145–1154. [Google Scholar] [CrossRef] [PubMed]
  70. Paracchini, M.L.; Zulian, G.; Kopperoinen, L.; Maes, J.; Schägner, J.P.; Termansen, M.; Zandersen, M.; Perez-Soba, M.; Scholefield, P.A.; Bidoglio, G. Mapping cultural ecosystem services: A framework to assess the potential for outdoor recreation across the EU. Ecol. Indic. 2014, 45, 371–385. [Google Scholar] [CrossRef] [Green Version]
  71. Baiamonte, G.; Giuseppe, B.; Giuseppe, B.; Raimondo, F.M. Land mosaic naturalness evaluation: A proposal for European landscapes landscapes. In Proceedings of the European IALE Conference 2009—70 Years of Landscape Ecology in Europe—European Landscapee in Trasformation Challenges for Landscape Ecology and Management, Salzburg, Austria, 12–16 July 2009. [Google Scholar] [CrossRef]
  72. Baiamonte, G.; Domina, G.; Raimondo, F.M.; Bazan, G. Agricultural landscapes and biodiversity conservation: A case study in Sicily (Italy). Biodivers. Conserv. 2015, 24, 3201–3216. [Google Scholar] [CrossRef]
  73. Benito-Calvo, A.; Perez-Gonzalez, A.; Magri, O.; Meza, P. Assessing regional geodiversity: The Iberian Peninsula. Earth Surf. Process. Landf. 2009, 34, 1433–1445. [Google Scholar] [CrossRef]
  74. Dhodhi, M.K.; Saghri, J.A.; Ahmad, I.; Ul-Mustafa, R. D-ISODATA: A Distributed Algorithm for Unsupervised Classification of Remotely Sensed Data on Network of Workstations. J. Parallel Distrib. Comput. 1999, 59, 280–301. [Google Scholar] [CrossRef]
  75. Saaty, T.L. Deriving the AHP 1-9 scale from first principles. In Proceedings of the Sixth International Symposium on the Analytic Hierarchy Process, Bern, Switzerland, 2–4 August 2001; p. 245. [Google Scholar]
  76. Liquete, C.; Kleeschulte, S.; Dige, G.; Maes, J.; Grizzetti, B.; Olah, B.; Zulian, G. Mapping green infrastructure based on ecosystem services and ecological networks: A Pan-European case study. Environ. Sci. Policy 2015, 54, 268–280. [Google Scholar] [CrossRef]
  77. Grêt-Regamey, A.; Weibel, B.; Bagstad, K.J.; Ferrari, M.; Geneletti, D.; Klug, H.; Schirpke, U.; Tappeiner, U. On the effects of scale for ecosystem services mapping. PLoS ONE 2014, 9. [Google Scholar] [CrossRef] [PubMed]
  78. Raudsepp-Hearne, C.; Peterson, G.D. Scale and ecosystem services: How do observation, management, and analysis shift with scale—Lessons from Québec. Ecol. Soc. 2016, 21. [Google Scholar] [CrossRef]
  79. Xu, S.; Liu, Y.; Wang, X.; Zhang, G. Scale effect on spatial patterns of ecosystem services and associations among them in semi-arid area: A case study in Ningxia Hui Autonomous Region, China. Sci. Total Environ. 2017, 598, 297–306. [Google Scholar] [CrossRef] [PubMed]
  80. Schindler, S.; Poirazidis, K.; Wrbka, T. Towards a core set of landscape metrics for biodiversity assessments: A case study from Dadia National Park, Greece. Ecol. Indic. 2008, 8, 502–514. [Google Scholar] [CrossRef]
  81. Tammi, I.; Mustajärvi, K.; Rasinmäki, J. Integrating spatial valuation of ecosystem services into regional planning and development. Ecosyst. Serv. 2017, 26, 329–344. [Google Scholar] [CrossRef]
  82. Kalogirou, S. The Statistical Analysis and Modelling of Internal Migration Flows within England and Wales. Newcastle University eTheses, 2003. Available online: https://theses.ncl.ac.uk/ (accessed on 15 May 2018).
  83. Hamann, M.; Biggs, R.; Reyers, B. Mapping social-ecological systems: Identifying “green-loop” and “red-loop” dynamics based on characteristic bundles of ecosystem service use. Glob. Environ. Chang. 2015, 34, 218–226. [Google Scholar] [CrossRef]
  84. Kong, L.; Zheng, H.; Xiao, Y.; Ouyang, Z.; Li, C.; Zhang, J.; Huang, B. Mapping ecosystem service bundles to detect distinct types of multifunctionality within the diverse landscape of the yangtze river basin, China. Sustainability 2018, 10, 857. [Google Scholar] [CrossRef]
  85. Qiu, J.; Turner, M.G. Spatial interactions among ecosystem services in an urbanizing agricultural watershed. Proc. Natl. Acad. Sci. USA 2013, 110, 12149–12154. [Google Scholar] [CrossRef] [PubMed] [Green Version]
  86. Moran, P.A. Notes on continuous stochastic phenomena. Biometrika 1950, 37, 17–23. [Google Scholar] [CrossRef] [PubMed]
  87. Clarke, K.R.; Warwick, R.M. Change in Marine Communities: An Approach to Statistical Analysis and Interpretation, 2nd ed.; PRIMER-E Ltd.: Plymouth, UK, 2001; ISBN 8003098955. [Google Scholar]
  88. Kaufman, L.; Rousseeuw, P.J. Introduction. In Finding Groups in Data: An Introduction to Cluster Analysis; Wiley Online Library: Hoboken, NJ, USA, 2008; pp. 1–67. ISBN 9780470316801. [Google Scholar]
  89. Mojena, R. Hierarchical grouping methods and stopping rules: An evaluation. Comput. J. 1977, 20, 359–363. [Google Scholar] [CrossRef]
  90. Kodinariya, T.M.; Makwana, P.R. Review on determining number of Cluster in K-Means Clustering. Int. J. Adv. Res. Comput. Sci. Manag. Stud. 2013, 1, 2321–7782. [Google Scholar]
  91. Maechler, M.; Struyf, A.; Hubert, M.; Hornik, K.; Studer, M.; Roudier, P. Finding Groups in Data: Cluster Analysis Extended Rousseeuw et. Package ‘cluster’. R CRAN 2015, 79. Available online: https://cran.r-project.org/web/packages/cluster/ (accessed on 20 March 2018).
  92. Wei, T.; Simko, V. Visualization of a Correlation Matrix. Package ‘corrplot’. R CRAN 2016. Available online: https://cran.r-project.org/web/packages/corrplot/ (accessed on 20 March 2018).
  93. Kassambara, A.; Mundt, F. Extract and Visualize the Results of Multivariate Data Analyses. Package ‘factoextra’. R CRAN 2016. Available online: https://cran.r-project.org/web/packages/factoextra/ (accessed on 20 March 2018).
  94. Hijmans, R.J.; van Etten, J.; Mattiuzzi, M.; Sumner, M.; Greenberg, J.A.; Lamigueiro, O.P.; Bevan, A.; Racine, E.B.; Shortridge, A. Geographic data analysis and modeling. Package ‘corrplot’. R CRAN 2013. Available online: https://cran.r-project.org/web/packages/raster/ (accessed on 20 March 2018).
  95. Bivand, R.; Keitt, T.; Rowlingson, B.; Pebesma, E.; Sumner, M.; Hijmans, R.J.; Rouault, E. Bindings for the Geospatial Data Abstraction Library. Package ‘rgdal’. R CRAN 2015. Available online: https://cran.r-project.org/web/packages/rgdal/ (accessed on 20 March 2018).
  96. Evans, J.S.; Ram, K. Spatial Analysis and Modelling Utilities. Package ‘spatialEco’. R CRAN 2018. Available online: https://cran.r-project.org/web/packages/spatialEco/ (accessed on 20 March 2018).
  97. Peters, G.-J. Quantitative analysis made accessible. Package ‘userfriendlyscience’. R CRAN 2018. Available online: https://userfriendlyscience.com/ (accessed on 20 March 2018).
  98. Rempel, R.S.; Kaukinen, D.; Carr, A.; Elkie, P.; Kushneriuk, R.; Elliott, J.; Robinson, J. Patch Analyst for ArcGIS; Centre for Northern Forest Ecosystem Research, Ontario Ministry of Natural Resources. Lakehead University, 2008. Available online: http://flash.lakeheadu.ca/rrempel/patch/ (accessed on 15 March 2018).
  99. Egarter Vigl, L.; Tasser, E.; Schirpke, U.; Tappeiner, U. Using land use/land cover trajectories to uncover ecosystem service patterns across the Alps. Reg. Environ. Chang. 2017, 17, 2237–2250. [Google Scholar] [CrossRef]
  100. Bai, Y.; Zhuang, C.; Ouyang, Z.; Zheng, H.; Jiang, B. Spatial characteristics between biodiversity and ecosystem services in a human-dominated watershed. Ecol. Complex. 2011, 8, 177–183. [Google Scholar] [CrossRef] [Green Version]
  101. Barrios, E.; Valencia, V.; Jonsson, M.; Brauman, A.; Hairiah, K.; Mortimer, P.E.; Okubo, S. Contribution of trees to the conservation of biodiversity and ecosystem services in agricultural landscapes. Int. J. Biodivers. Sci. Ecosyst. Serv. Manag. 2018, 14, 1–16. [Google Scholar] [CrossRef]
  102. Leh, M.D.K.; Matlock, M.D.; Cummings, E.C.; Nalley, L.L. Quantifying and mapping multiple ecosystem services change in West Africa. Agric. Ecosyst. Environ. 2013, 165, 6–18. [Google Scholar] [CrossRef]
  103. Mouchet, M.A.; Paracchini, M.L.; Schulp, C.J.E.; Stürck, J.; Verkerk, P.J.; Verburg, P.H.; Lavorel, S. Bundles of ecosystem (dis)services and multifunctionality across European landscapes. Ecol. Indic. 2017, 73, 23–28. [Google Scholar] [CrossRef]
  104. Lin, S.; Wu, R.; Yang, F.; Wang, J.; Wu, W. Spatial trade-offs and synergies among ecosystem services within a global biodiversity hotspot. Ecol. Indic. 2018, 84, 371–381. [Google Scholar] [CrossRef]
  105. Iliadis, L.S.; Vangeloudh, M.; Spartalis, S. An intelligent system employing an enhanced fuzzy c-means clustering model: Application in the case of forest fires. Comput. Electron. Agric. 2010, 70, 276–284. [Google Scholar] [CrossRef]
  106. De Valck, J.; Landuyt, D.; Broekx, S.; Liekens, I.; Nocker, L. De Outdoor recreation in various hypothetical landscapes: Which site characteristics really matter? Land Use Policy 2017, 65, 1–35. [Google Scholar] [CrossRef]
  107. Swallow, B.M.; Sang, J.K.; Nyabenge, M.; Bundotich, D.K.; Duraiappah, A.K.; Yatich, T.B. Tradeoffs, synergies and traps among ecosystem services in the Lake Victoria basin of East Africa. Environ. Sci. Policy 2009, 12, 504–519. [Google Scholar] [CrossRef]
  108. Jose, S. Agroforestry for ecosystem services and environmental benefits: An overview. Agrofor. Syst. 2009, 76, 1–10. [Google Scholar] [CrossRef]
  109. Brunori, E.; Salvati, L.; Antogiovanni, A.; Biasi, R. Worrying about “vertical landscapes”: Terraced olive groves and ecosystem services in marginal land in central Italy. Sustainability 2018, 10, 1164. [Google Scholar] [CrossRef]
  110. Crouzat, E.; Mouchet, M.; Turkelboom, F.; Byczek, C.; Meersmans, J.; Berger, F.; Verkerk, P.J.; Lavorel, S. Assessing bundles of ecosystem services from regional to landscape scale: Insights from the French Alps. J. Appl. Ecol. 2015, 52, 1145–1155. [Google Scholar] [CrossRef] [Green Version]
  111. Tzanopoulos, J.; Vogiatzakis, I.N. Processes and patterns of landscape change on a small Aegean island: The case of Sifnos, Greece. Landsc. Urban Plan. 2011, 99, 58–64. [Google Scholar] [CrossRef]
  112. Baró, F.; Gómez-Baggethun, E.; Haase, D. Ecosystem service bundles along the urban- rural gradient: Insights for landscape planning and management. Ecosyst. Serv. 2017, 24, 147–159. [Google Scholar] [CrossRef]
  113. Yang, G.; Ge, Y.; Xue, H.; Yang, W.; Shi, Y.; Peng, C.; Du, Y.; Fan, X.; Ren, Y.; Chang, J. Using ecosystem service bundles to detect trade-offs and synergies across urban-rural complexes. Landsc. Urban Plan. 2015, 136, 110–121. [Google Scholar] [CrossRef]
  114. Poirazidis, K.; Chaideftou, E.; Martinis, A.; Bontzorlos, V.; Galani, P.; Kalivas, D. Temporal shifts in floristic and avian diversity in Mediterranean pine forest ecosystems under differ-ent fire pressures: The island of Zakynthos as a case study. Ann. For. Sci. 2018. [Google Scholar] [CrossRef]
  115. Bennett, E.M.; Chaplin-Kramer, R. Science for the sustainable use of ecosystem services. F1000Research 2016, 5, 2622. [Google Scholar] [CrossRef] [PubMed] [Green Version]
  116. Maes, J.; Liekens, I.; Brown, C. Which questions drive the Mapping and Assessment of Ecosystems and their Services under Action 5 of the EU Biodiversity Strategy? ONE Ecosyst. 2018, 3, e25309. [Google Scholar] [CrossRef] [Green Version]
  117. Otero, I.; Marull, J.; Tello, E.; Diana, G.L.; Pons, M.; Coll, F.; Boada, M. Land abandonment, landscape, and biodiversity: Questioning the restorative character of the forest transition in the Mediterranean. Ecol. Soc. 2015, 20. [Google Scholar] [CrossRef]
  118. Van Der Sluis, T.; Kizos, T.; Pedroli, B. Landscape change in Mediterranean farmlands: Impacts of land abandonment on cultivation terraces in Portofino (Italy) and Lesvos (Greece). J. Landsc. Ecol. Repub. 2014, 7, 23–44. [Google Scholar] [CrossRef]
  119. Sokos, C.K.; Mamolos, A.P.; Kalburtji, K.L.; Birtsas, P.K. Farming and wildlife in Mediterranean agroecosystems. J. Nat. Conserv. 2013, 21, 81–92. [Google Scholar] [CrossRef]
  120. Rühl, J.; Caruso, T.; Giucastro, M.; la Mantia, T. Olive agroforestry systems in Sicily: Cultivated typologies and secondary succession processes after abandonment. Plant Biosyst. 2011, 145, 120–130. [Google Scholar] [CrossRef]
  121. Bommarco, R.; Kleijn, D.; Potts, S.G. Ecological intensification: Harnessing ecosystem services for food security. Trends Ecol. Evol. 2013, 28, 230–238. [Google Scholar] [CrossRef] [PubMed]
  122. Power, A.G. Ecosystem services and agriculture: Tradeoffs and synergies. Philos. Trans. R. Soc. B Biol. Sci. 2010, 365, 2959–2971. [Google Scholar] [CrossRef] [PubMed]
  123. Tscharntke, T.; Klein, A.M.; Kruess, A.; Steffan-Dewenter, I.; Thies, C. Landscape perspectives on agricultural intensification and biodiversity—Ecosystem service management. Ecol. Lett. 2005, 8, 857–874. [Google Scholar] [CrossRef]
  124. Tolessa, T.; Senbeta, F.; Kidane, M. The impacts of land use/land cover change on ecosystem services in the central highlands of Ethiopia. Ecosyst. Serv. 2017, 23, 47–54. [Google Scholar] [CrossRef]
  125. Bell, S.; Tyrv Äinen, L.; Siev Änen, T.; Öbstl, U.; Simpson, M. Outdoor Recreation and Nature Tourism: A European Perspective. Living Rev. Landsc. Res. 2007, 1, 2. [Google Scholar] [CrossRef]
  126. Lee, H.; Lautenbach, S. A quantitative review of relationships between ecosystem services. Ecol. Indic. 2016, 66, 340–351. [Google Scholar] [CrossRef] [Green Version]
  127. Willemen, L.; Veldkamp, A.; Verburg, P.H.; Hein, L.; Leemans, R. A multi-scale modelling approach for analysing landscape service dynamics. J. Environ. Manag. 2012, 100, 86–95. [Google Scholar] [CrossRef] [PubMed]
  128. Spake, R.; Lasseur, R.; Crouzat, E.; Bullock, J.M.; Lavorel, S.; Parks, K.E.; Schaafsma, M.; Bennett, E.M.; Maes, J.; Mulligan, M.; et al. Unpacking ecosystem service bundles: Towards predictive mapping of synergies and trade-offs between ecosystem services. Glob. Environ. Chang. 2017, 47, 37–50. [Google Scholar] [CrossRef]
Figure 1. Location of the study area.
Sustainability 10 03285 g001
Figure 2. Methodological flow chart used to identify interactions among ecosystem services (CC: cultivated crops; MT: materials from timber; PR: plant-based resources, CR: climate regulation, EP: erosion prevention; NS: Nursery; RC: recreation; HCA: hierarchical cluster analysis; PCA: principal component analysis; B1–7: ES bundles).
Sustainability 10 03285 g002
Figure 3. Temporal variation in ecosystem service supply and its spatial distribution in 2015 for Corfu.
Sustainability 10 03285 g003
Figure 4. Temporal variation in ecosystem service supply and its spatial distribution in 2015 for Lefkada.
Sustainability 10 03285 g004
Figure 5. Temporal variation in ecosystem service supply and its spatial distribution in 2015 for Kefalonia (including Ithaka).
Sustainability 10 03285 g005
Figure 6. Temporal variation in ecosystem service supply and its spatial distribution in 2015 for Zakynthos.
Sustainability 10 03285 g006
Figure 7. Spearman pairwise correlations between ES in 2015 (Dark blue indicates strongly positive correlations defined as synergies and dark red indicates strongly negative correlations defined as trade-offs. White squares represent non-significant correlations (p > 0.05). CC: cultivated crops; MT: materials from timber; PR: plant-based resources; EP: erosion prevention; CR: climate regulation; NS: nursery; RC: recreation).
Sustainability 10 03285 g007
Figure 8. PCA gradients and bundle location (each point represents a hexagonal unit). CC: cultivated crops; MT: materials from timber; PR: plant-based resources; CR: climate regulation; EP: erosion prevention; NS: nursery; RC: recreation.
Sustainability 10 03285 g008
Figure 9. Dynamic magnitude of ES bundles. B1: olive groves; B2: high agricultural provision; B3: non-vegetated-low supply; B4: mountainous areas; B5: naturally vegetated areas; B6: forest recreation; B7: high naturalness; CC: cultivated crops; MT: materials from timber; PR: plant-based resources; CR: climate regulation; EP: erosion prevention; NS: nursery; RC: recreation.
Sustainability 10 03285 g009
Table 1. List of the estimated ecosystem services and their relevant indicators/proxies
ES Section/GroupEcosystem ServicesIndicator/ProxyData Sources
ProvisioningCultivated crops (CC)Percentage of crop production1
Materials from timber (MT)Presence of forest and agroforest land1
Plant-based resources (PR)Enhanced Vegetation Index (EVI)2, 3
Regulating and MaintenanceErosion protection (EP)Soil Erosion Prevention (SEP)1, 4, 5, 6
Climate regulation (CR)Below and above ground carbon storage1, 7
Maintenance of Nursery Populations and Habitats (NS)Shannon Diversity Index (SHDI)1
CulturalRecreation (RC)Recreation potential1, 6, 8, 9
Data sources code: (1) Land cover data with spatial resolution 30 m based on Landsat Satellite images [40], (2) Landsat 5 TM satellite images for the years 1985, 1995, and 2005 [48], (3) Landsat 8 OLI satellite image for the year 2015 [48], (4) European Soil Data Center—ESDAC [49], (5) Worldclim—global climate data [50], (6) ASTER GDEM 30 m [51], (7) Carbon Dioxide Information Analysis Center [52], (8) European Ecological Network Natura 2000 [53], (9) Protected area management bodies [53].
Table 2. Average values of ES supply for the 1985–2015 period
ES Supply (Mean of 1985–2015)CorfuLefkadaKefaloniaZakynthos
CC0.380.270.220.35
MT0.550.390.350.32
PR0.520.430.380.48
CR0.330.260.290.19
EP0.300.190.230.24
NS0.520.570.490.57
Provisioning0.500.390.360.39
Regulating & Maintenance0.290.290.280.26
Cultural (RC)0.700.640.620.53
Total0.440.380.350.35
CC: cultivated crops; MT: materials from timber; PR: plant-based resources; CR: climate regulation; EP: erosion prevention; NS: nursery; RC: recreation.
Table 3. Changes in the percentage area covered by each ES bundle over time
CorfuLefkadaKefaloniaZakynthos
1985199520052015198519952005201519851995200520151985199520052015
B145.448.147.945.831.732.822.721.7
B2 27.425.826.426.435.834.136.735.7
B37.33.51.92.67.23.93.34.63.53.13.65.25.62.62.011.0
B4 58.663.361.453.3
B523.723.526.125.734.949.957.256.641.740.540.342.2
B623.624.924.225.9 23.730.030.226.3
B7 26.213.416.817.0
B1: olive groves; B2: high agricultural provision; B3: non-vegetated-low supply; B4: mountainous areas; B5: naturally vegetated areas; B6: forest recreation; B7: high naturalness.

