Reliability–Resiliency–Vulnerability Approach for Drought Analysis in South Korea Using 28 GCMs


Abstract
:1. Introduction
2. Data and Methodology
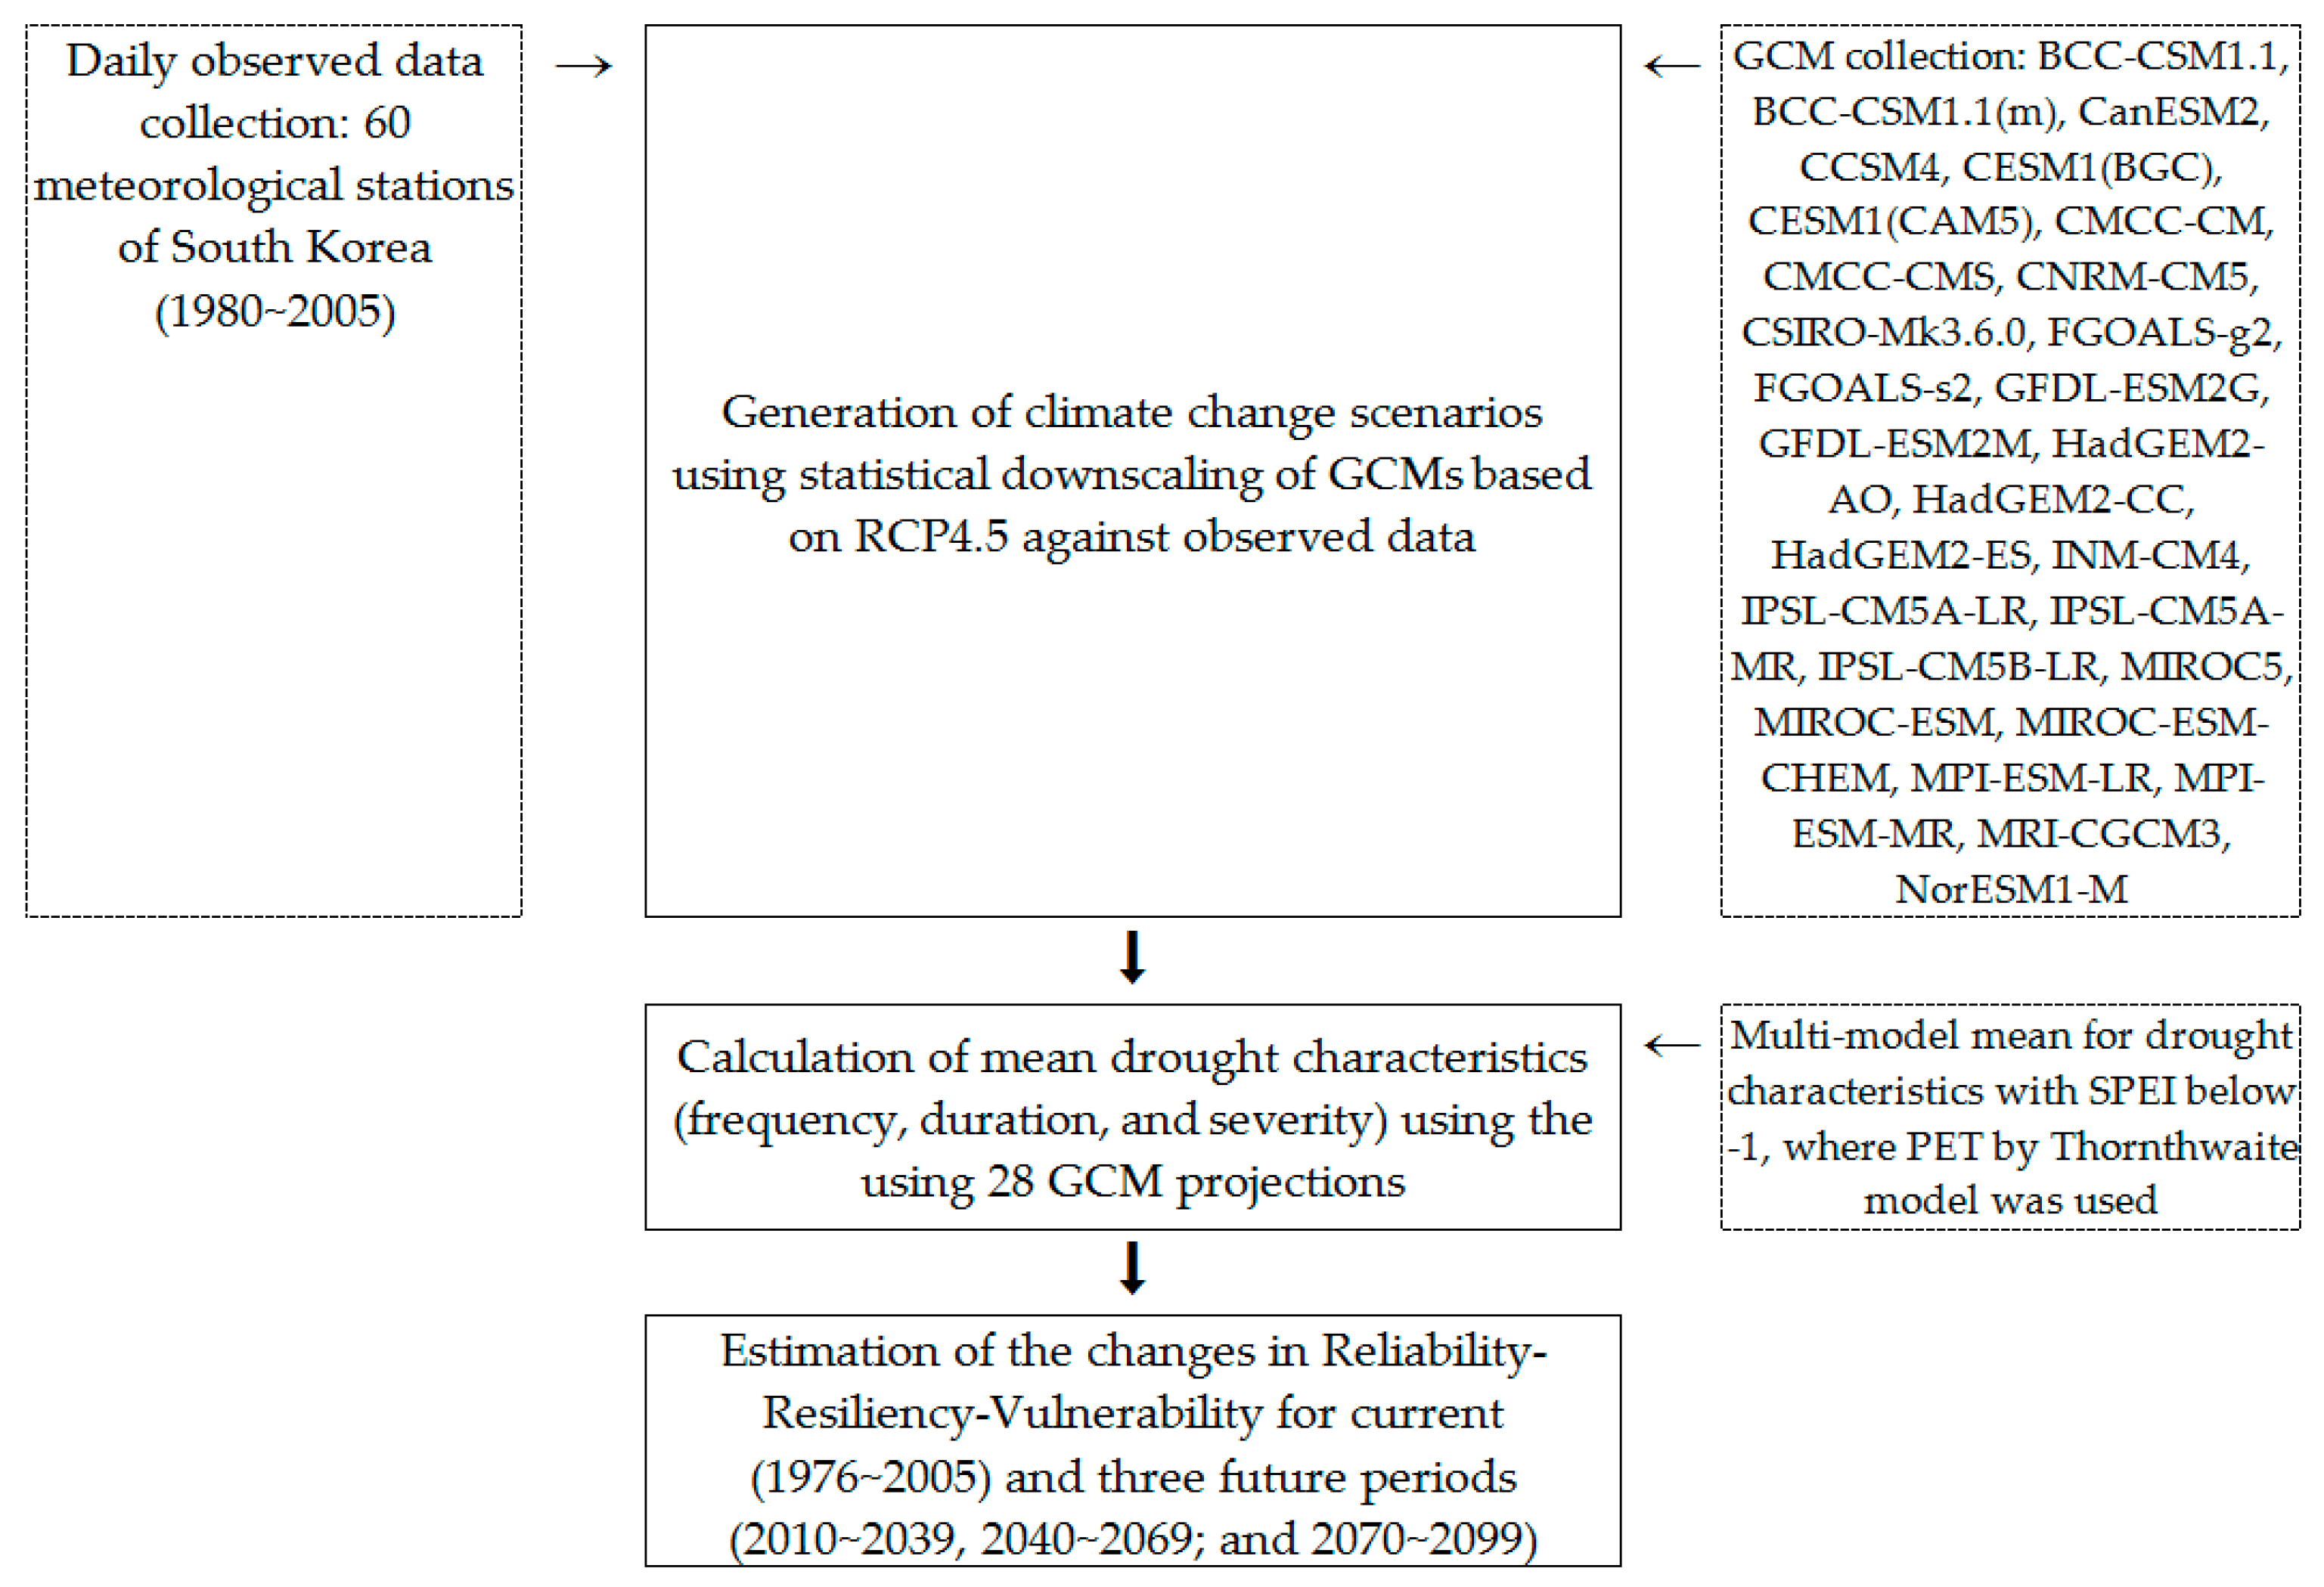
2.1. Procedure
2.2. Statistical Downscaling of GCM Simulations
2.3. Standardized Precipitation Evapotranspiration Index
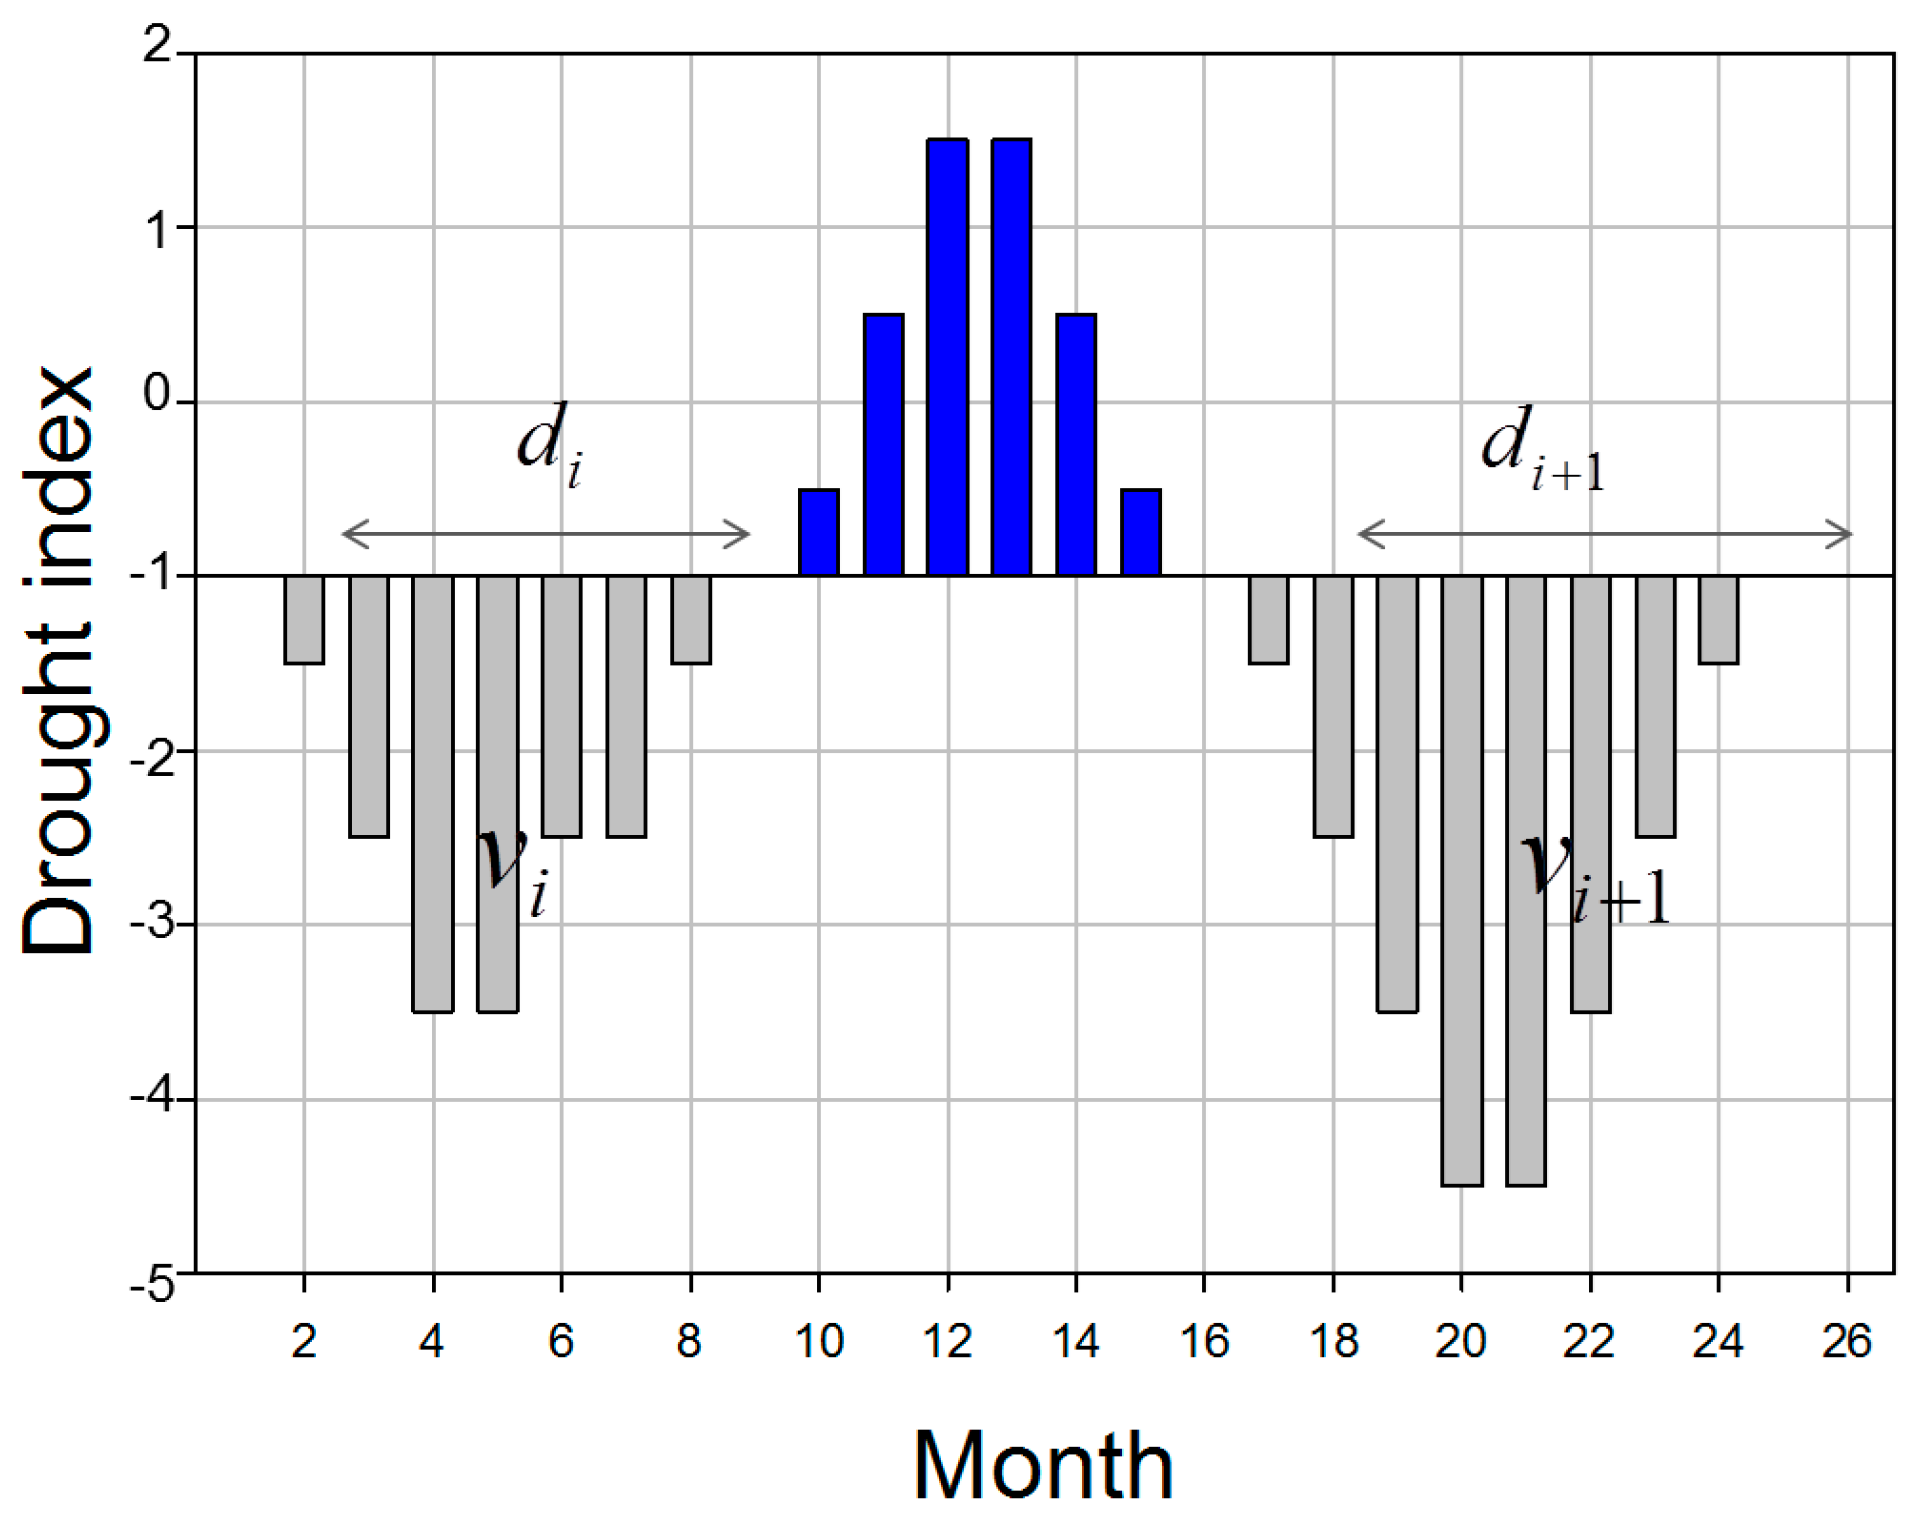
2.4. Aggregation Index
3. Result
3.1. Drought Indices for Future Drought
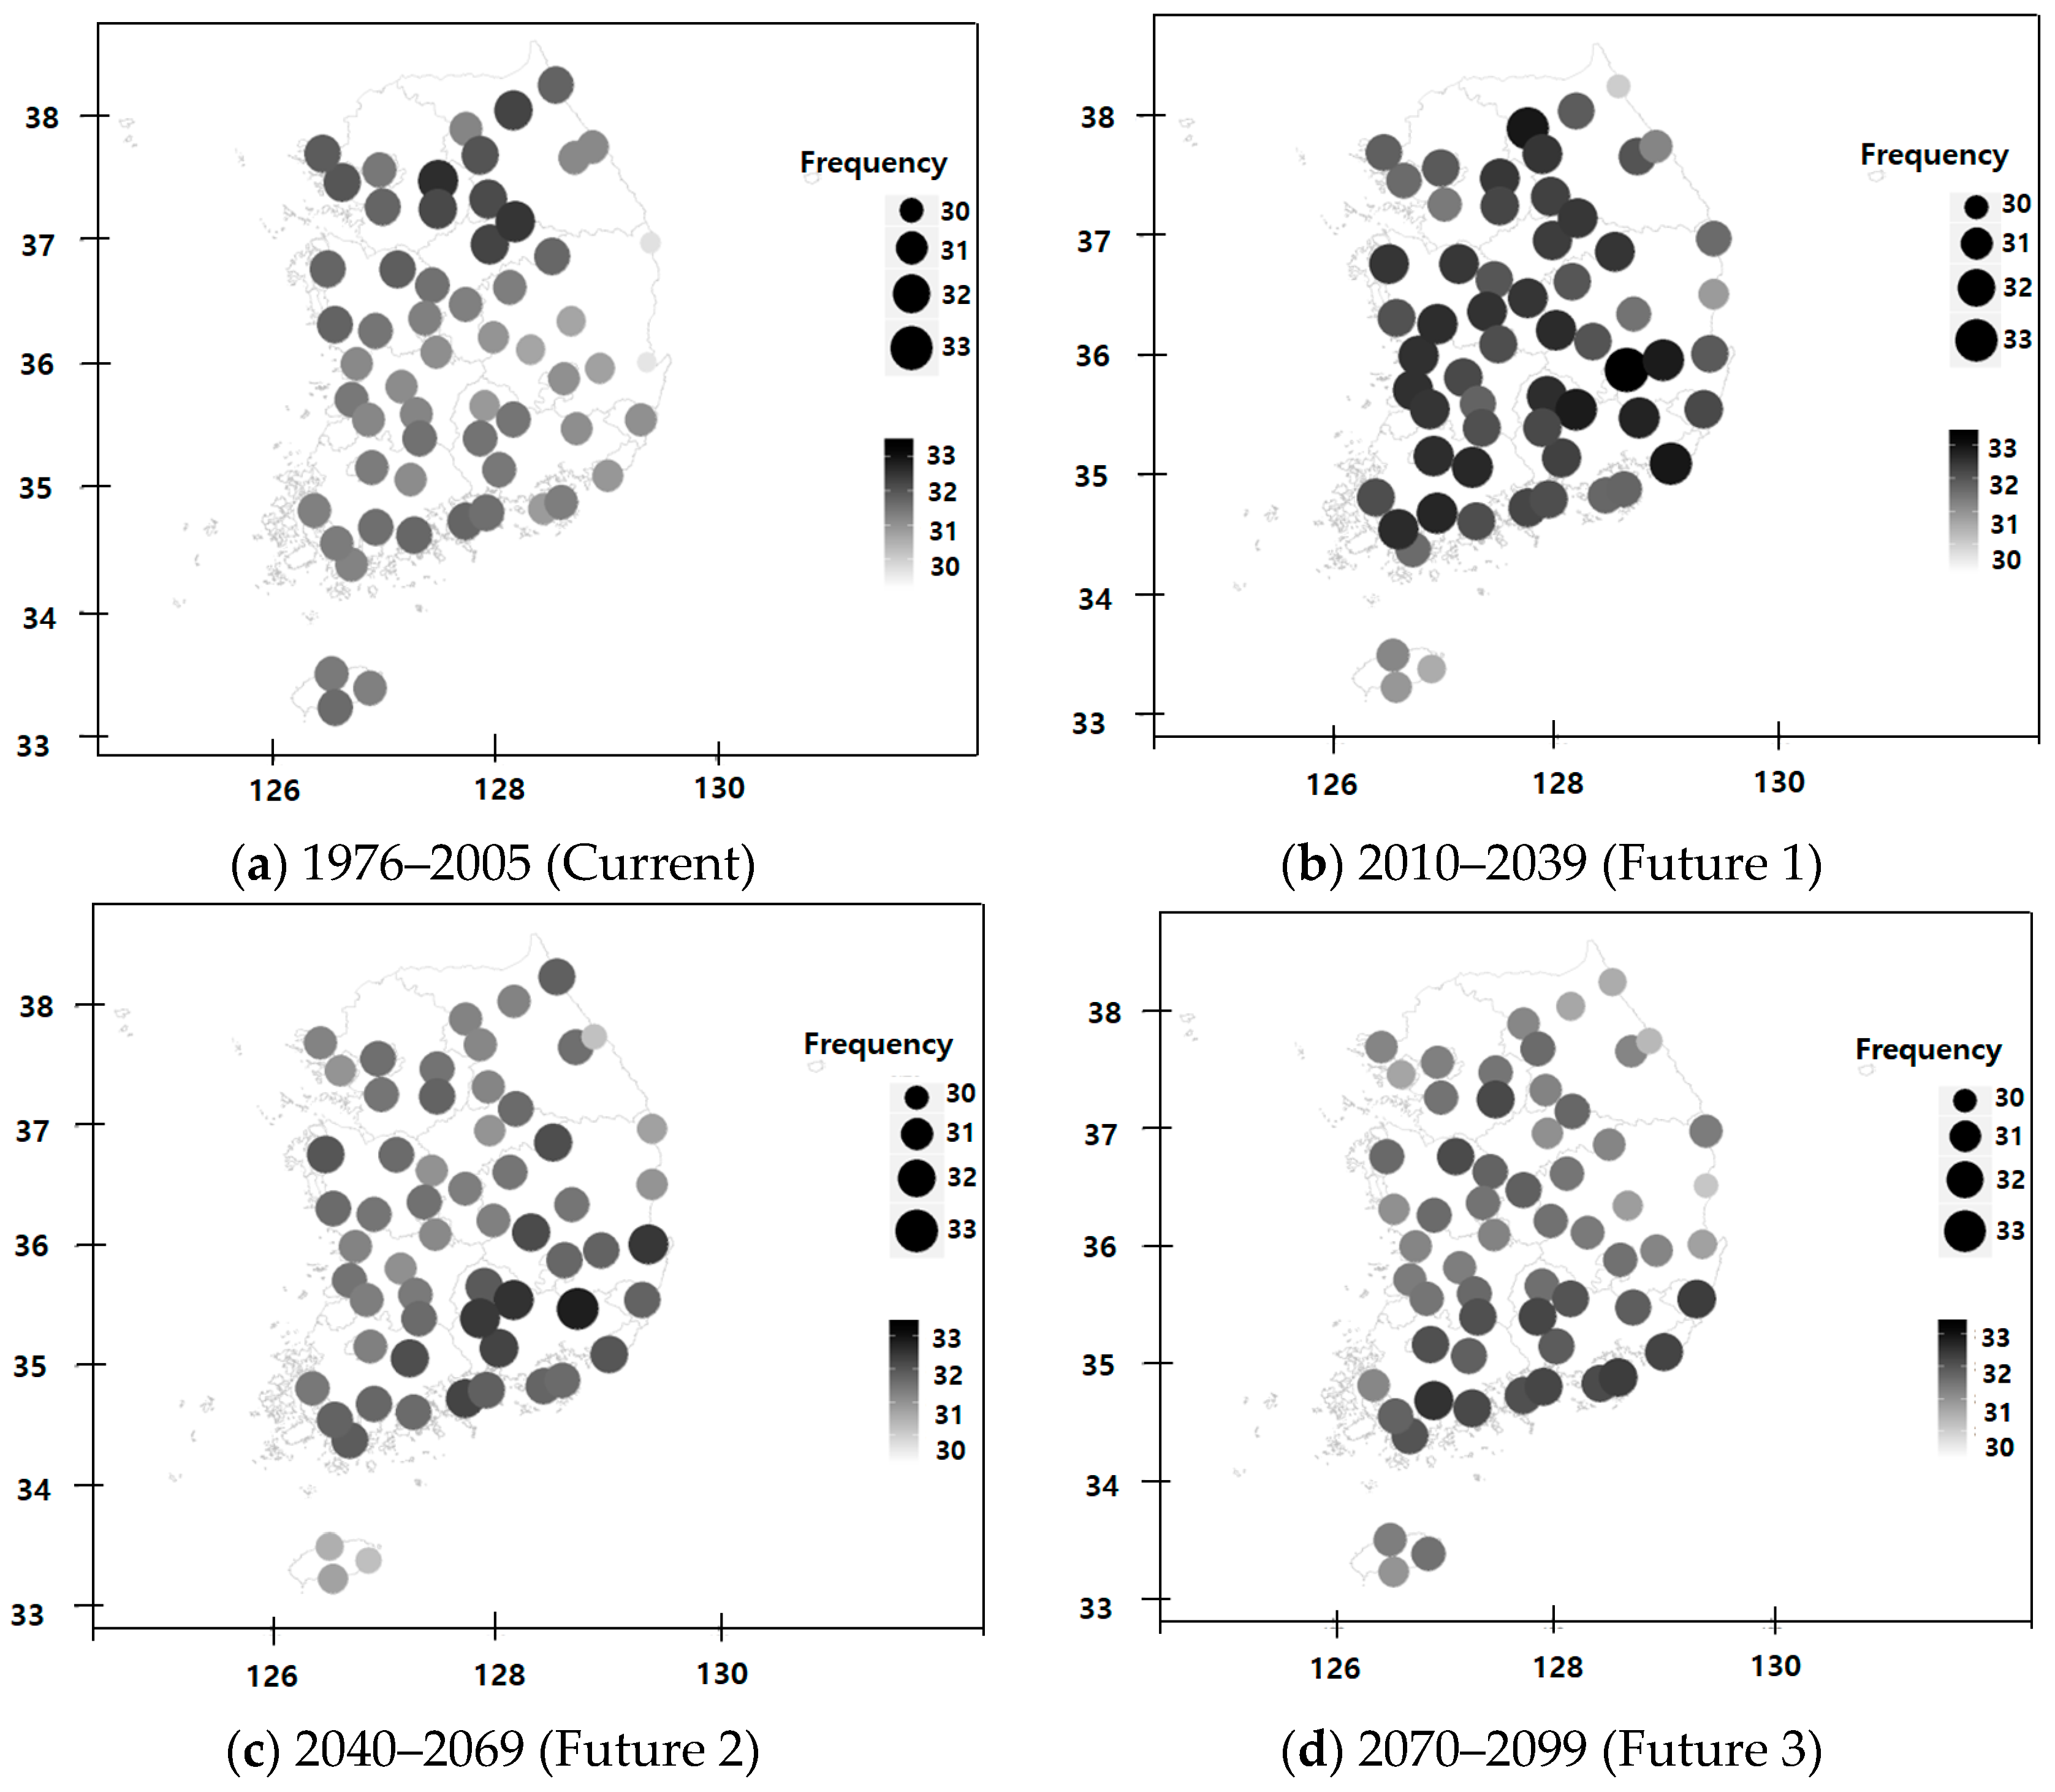
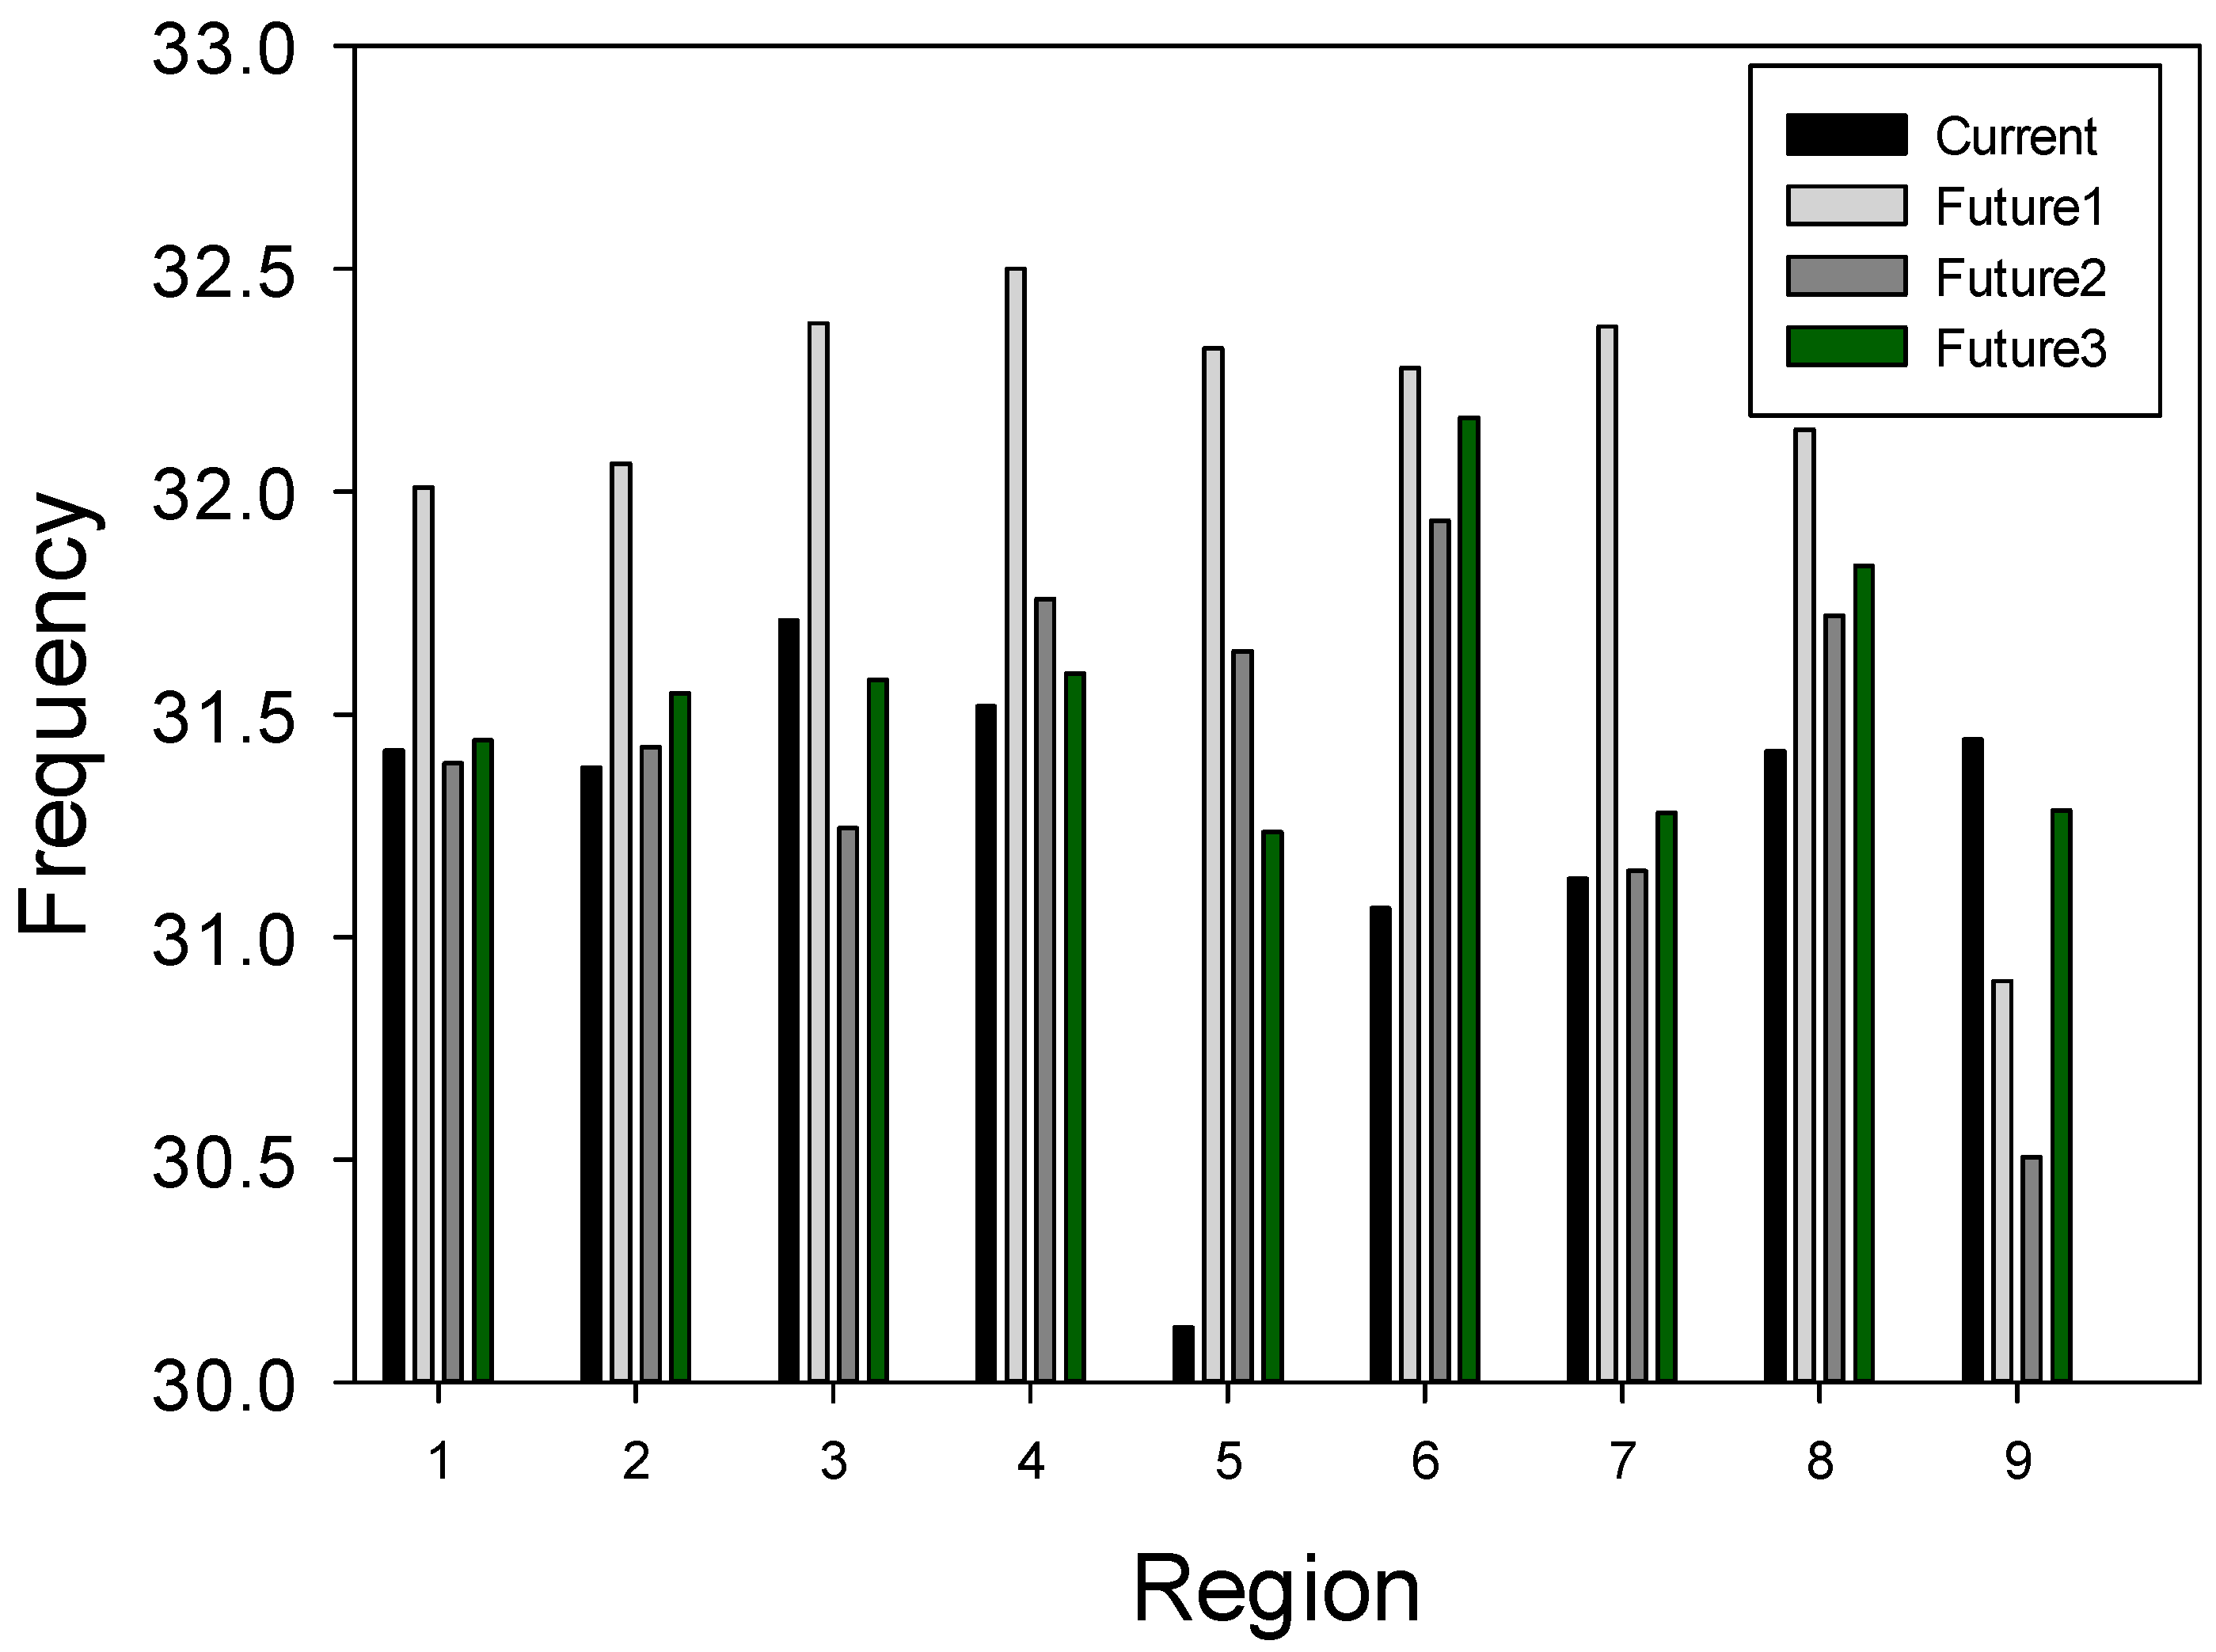
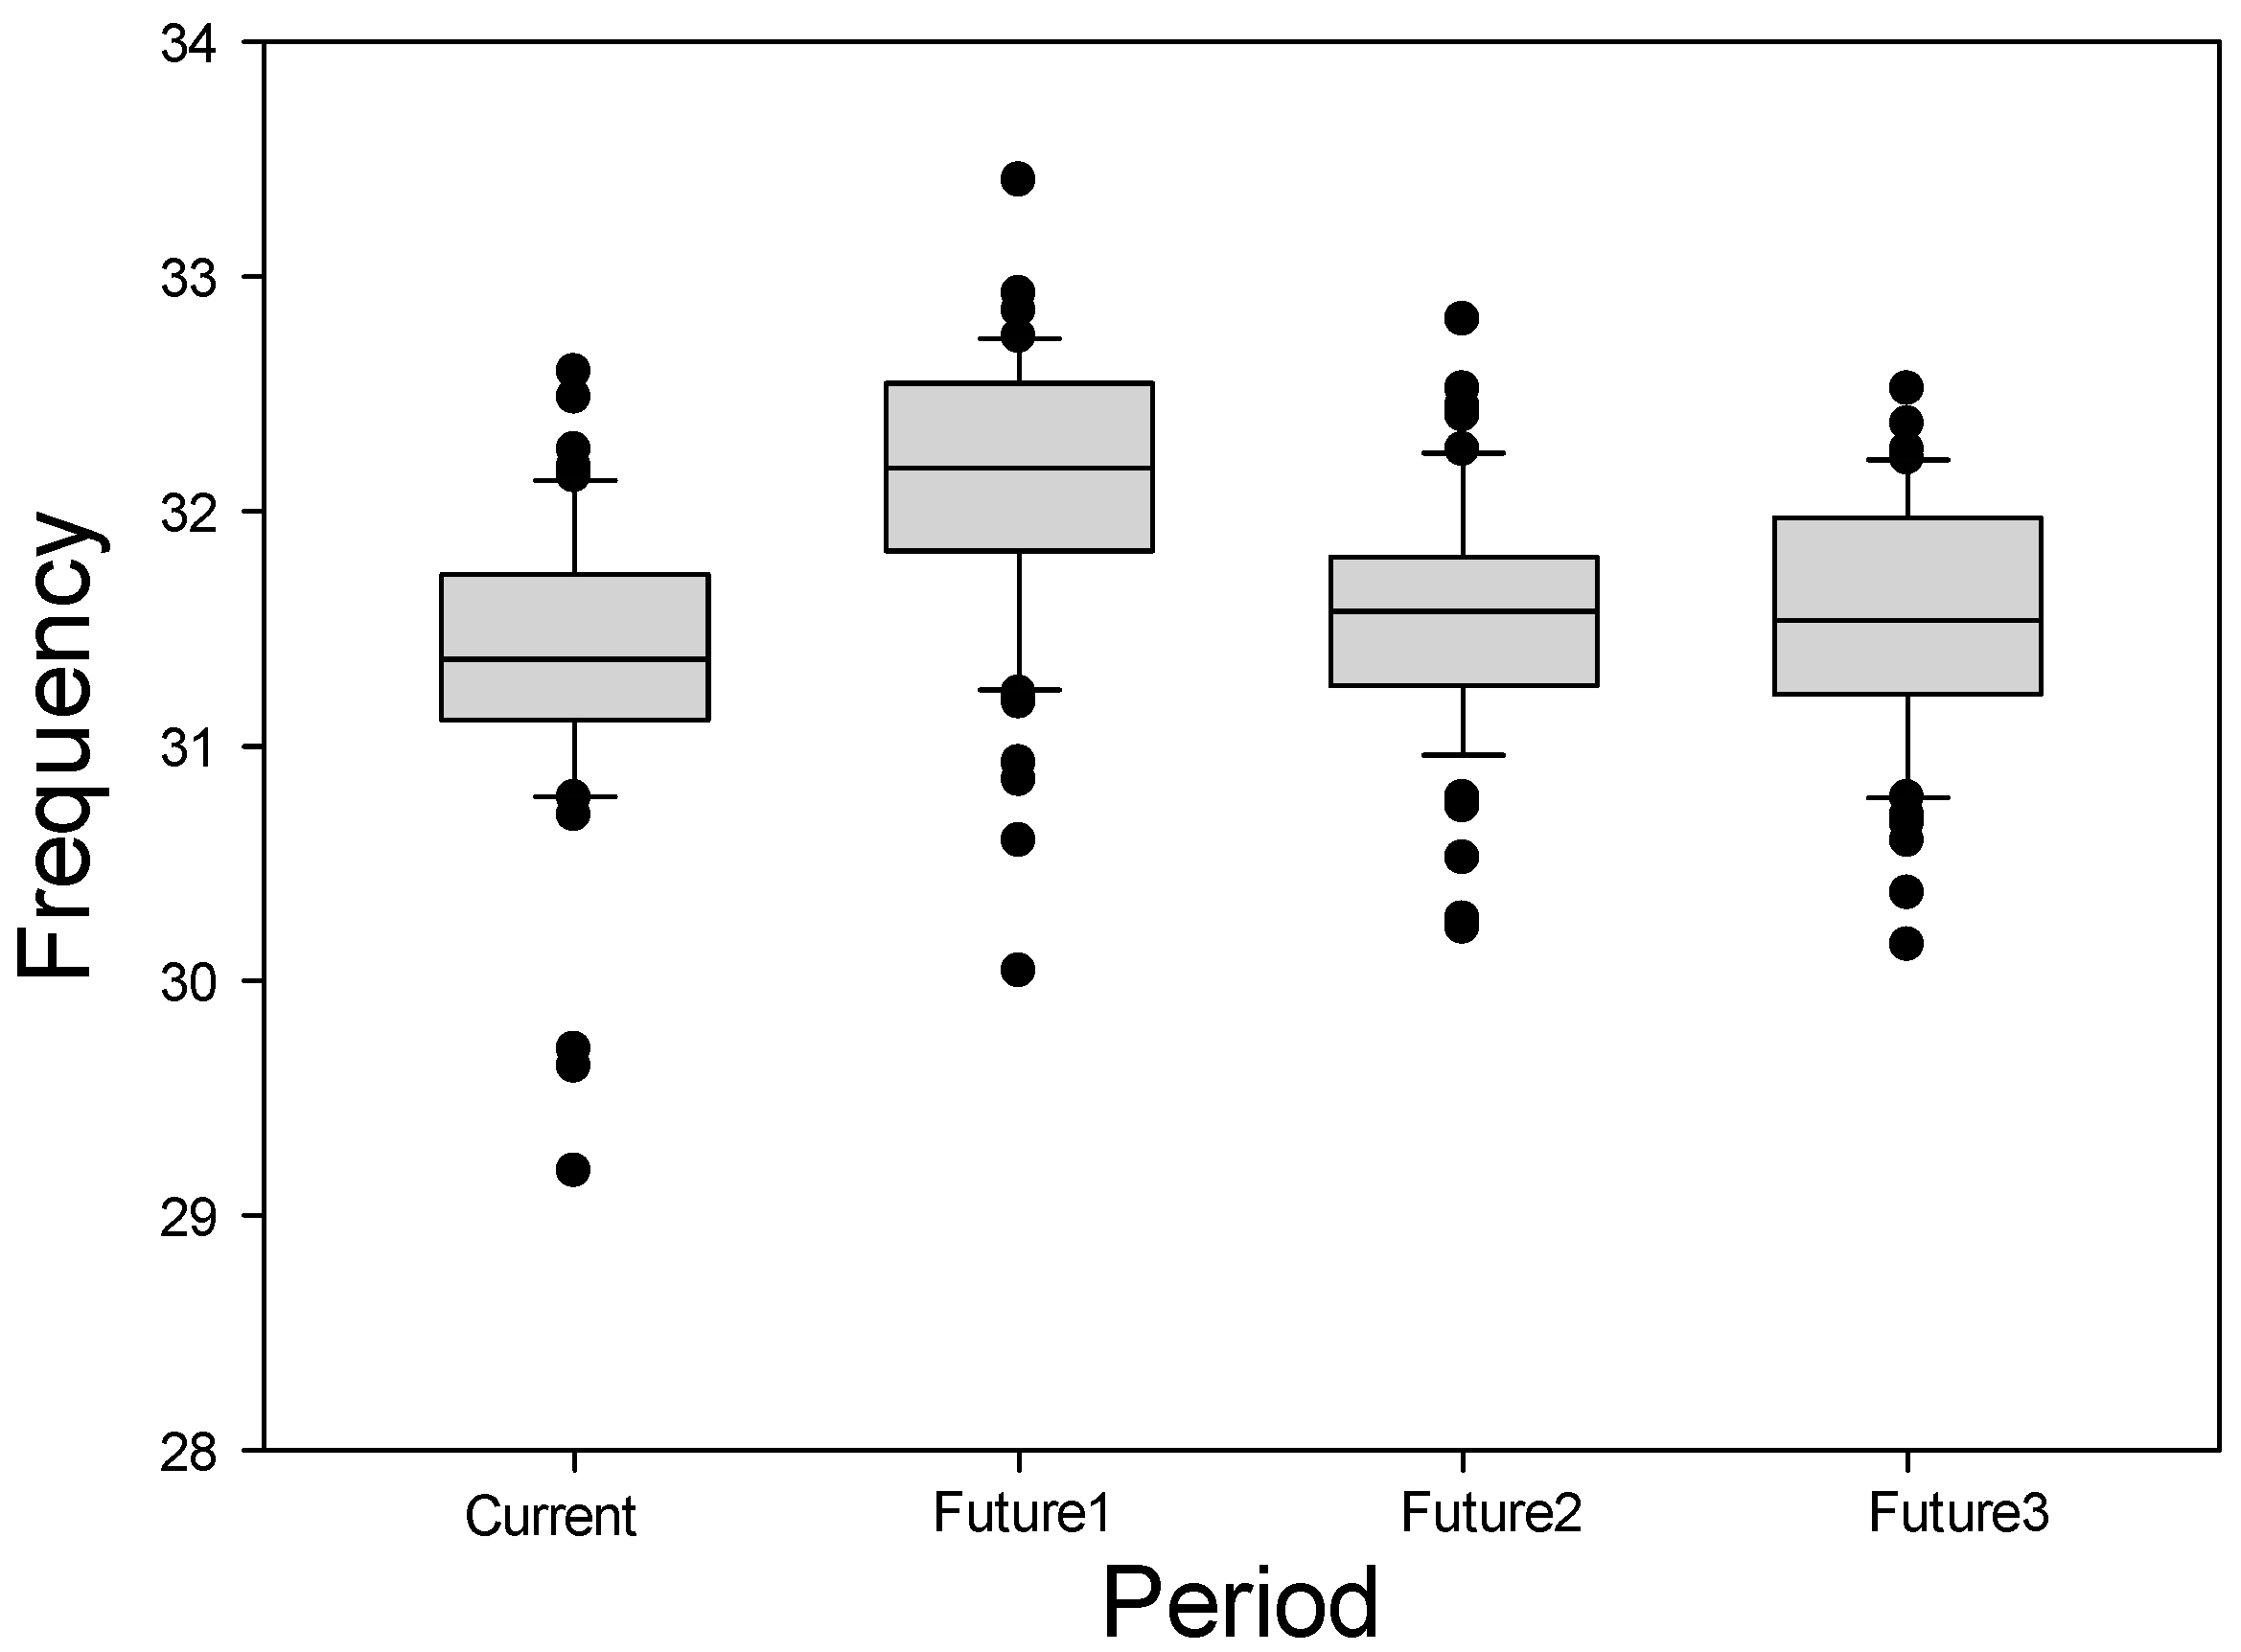
3.1.1. Frequency
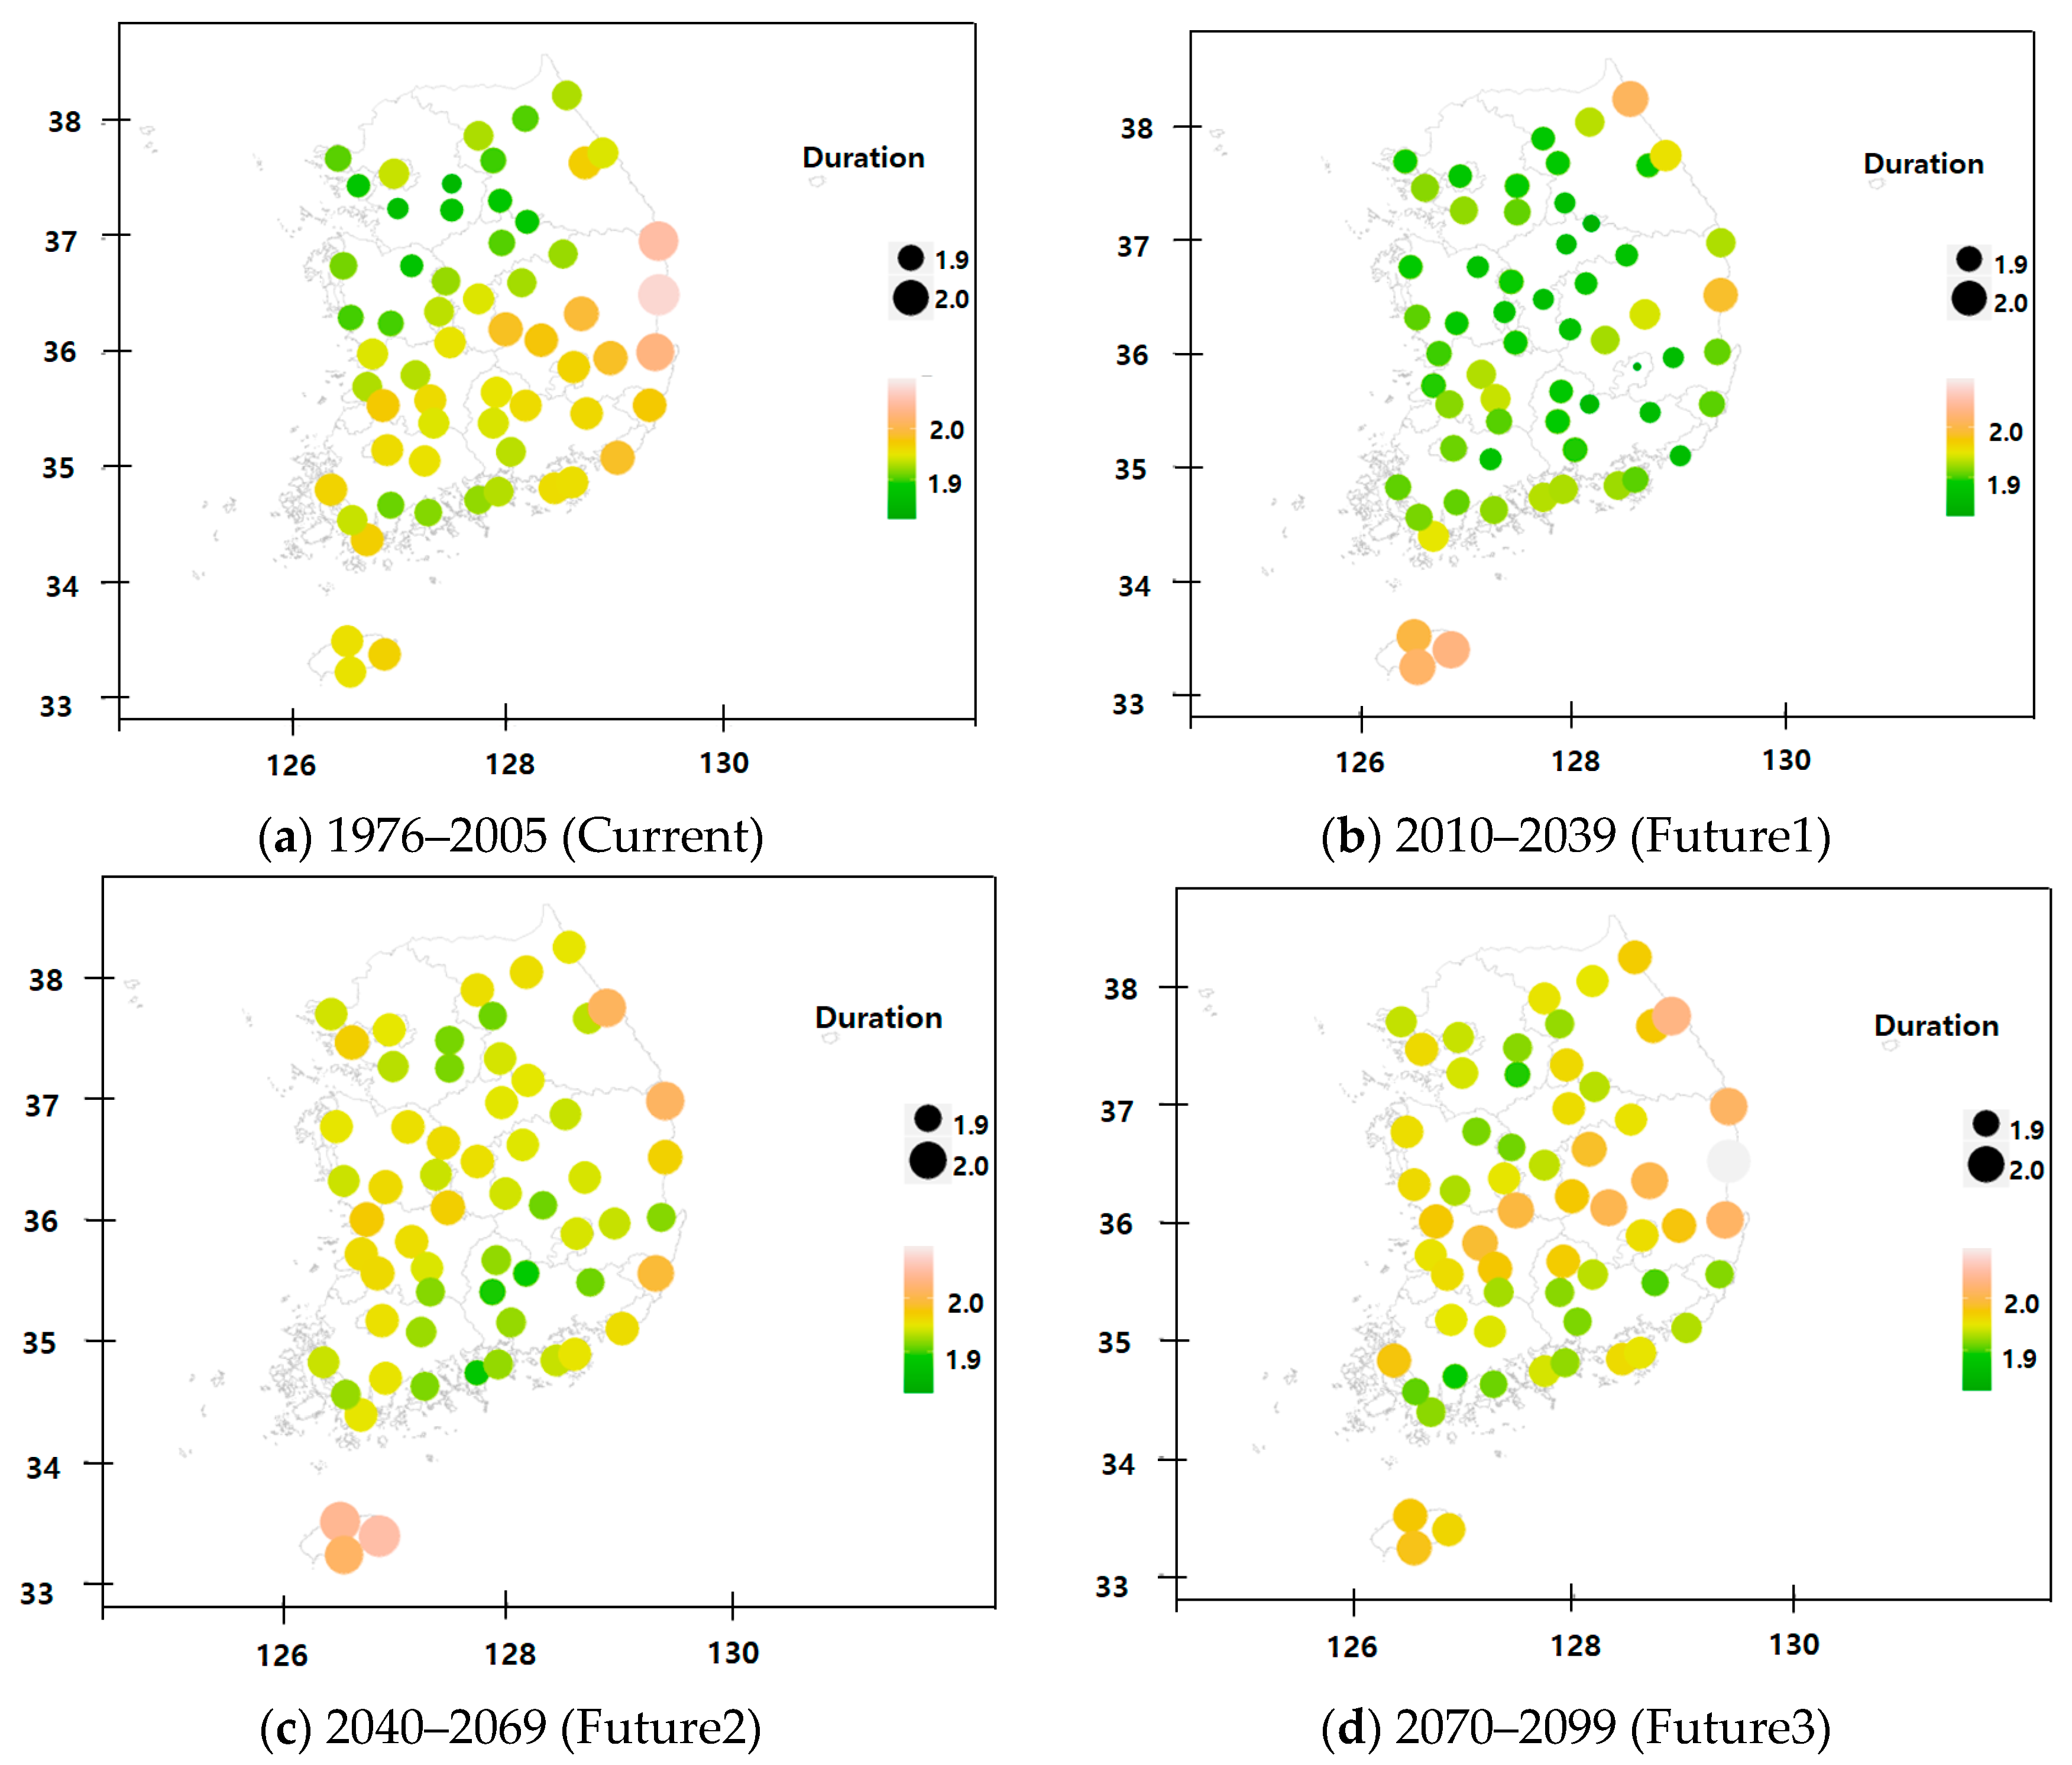
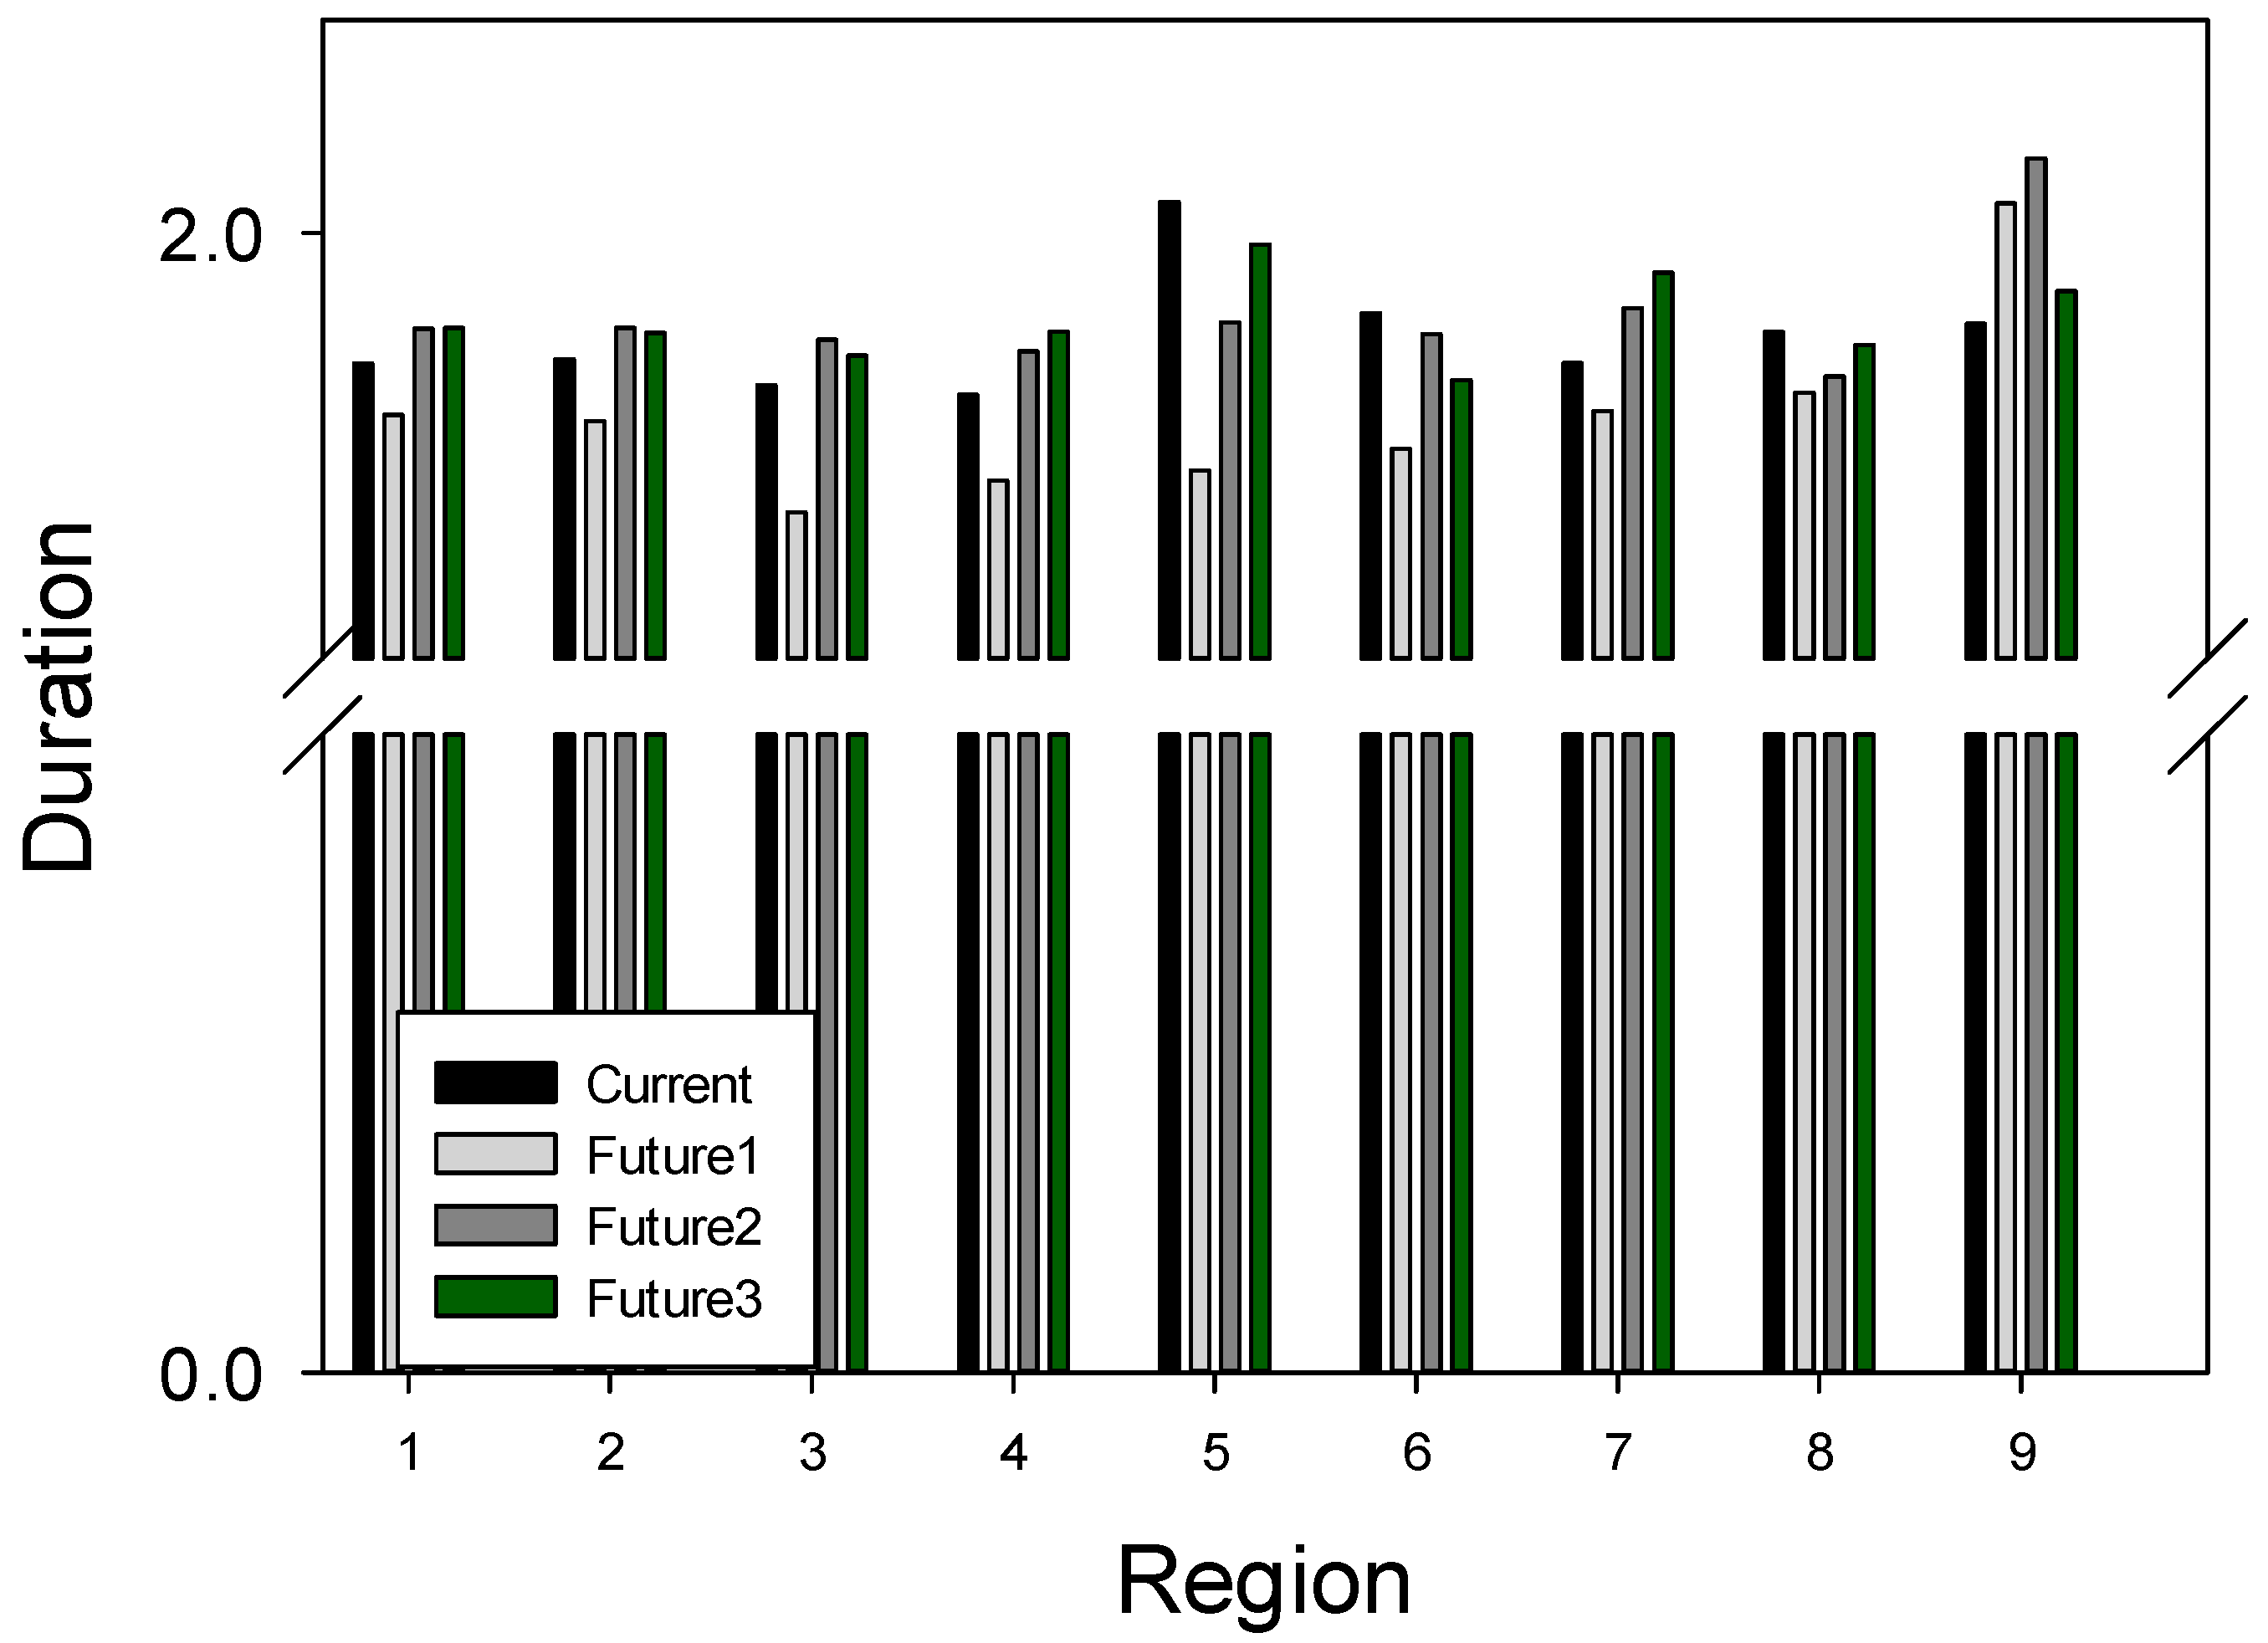
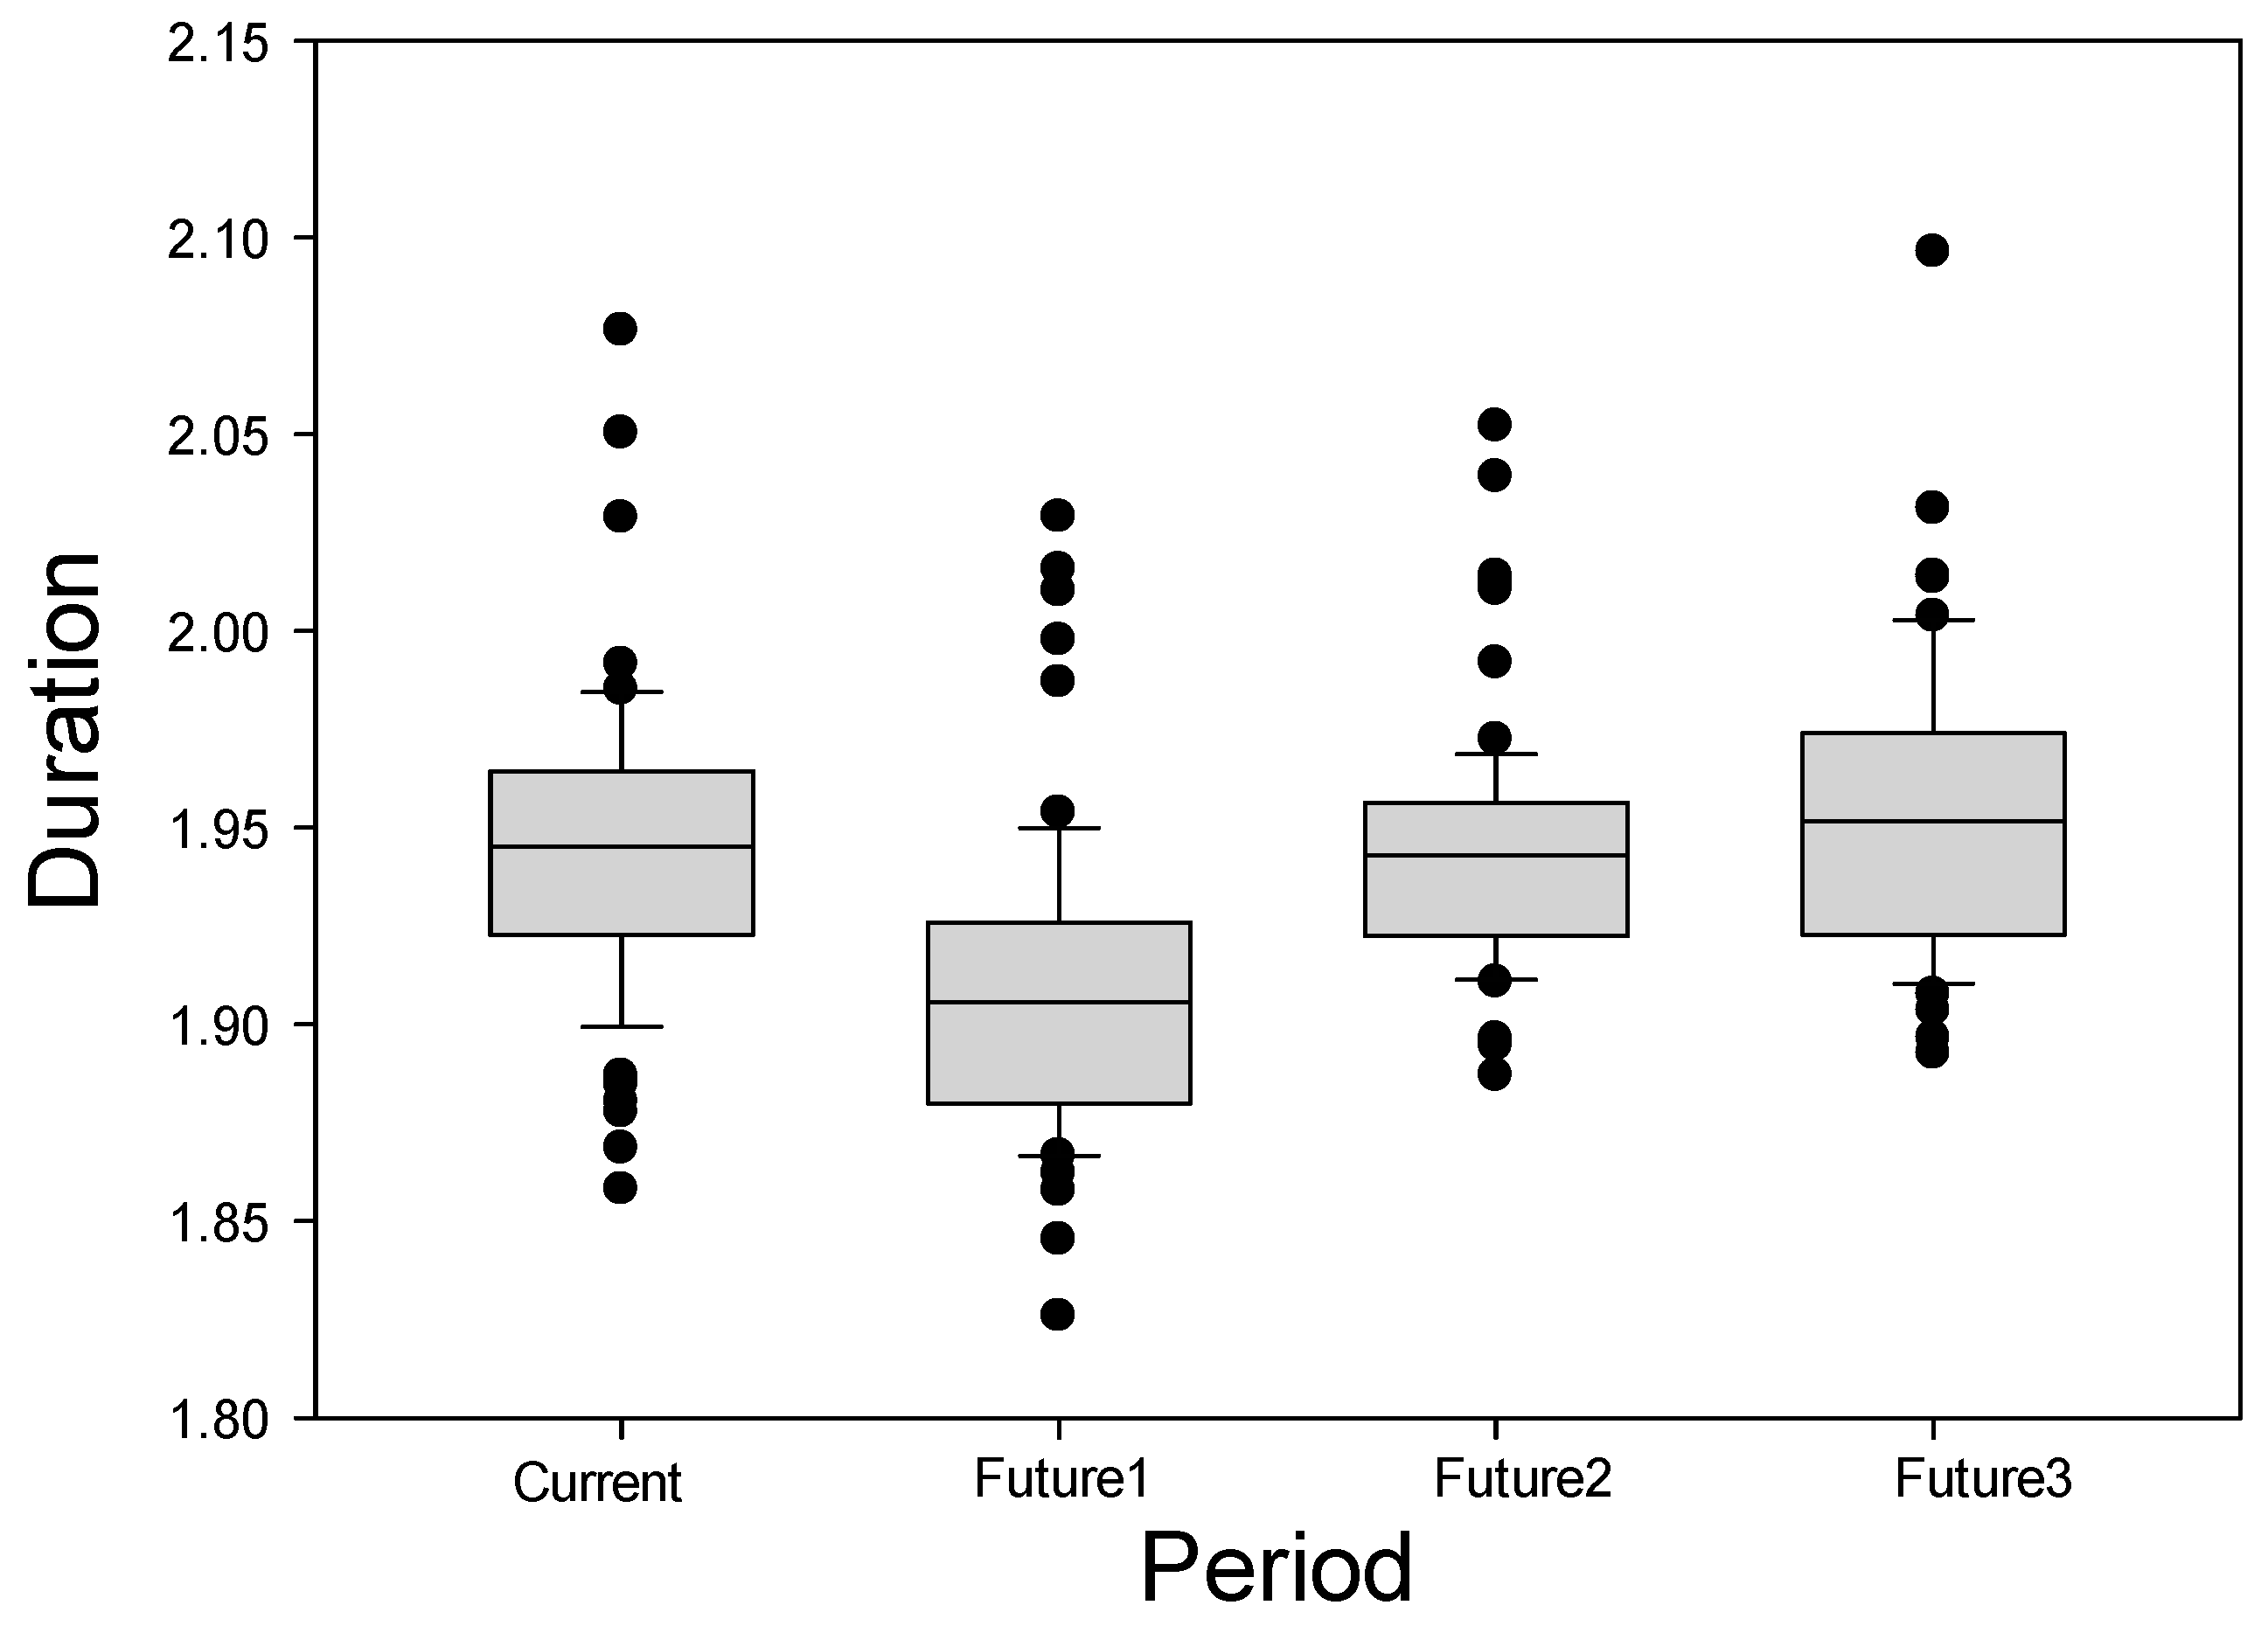
3.1.2. Duration
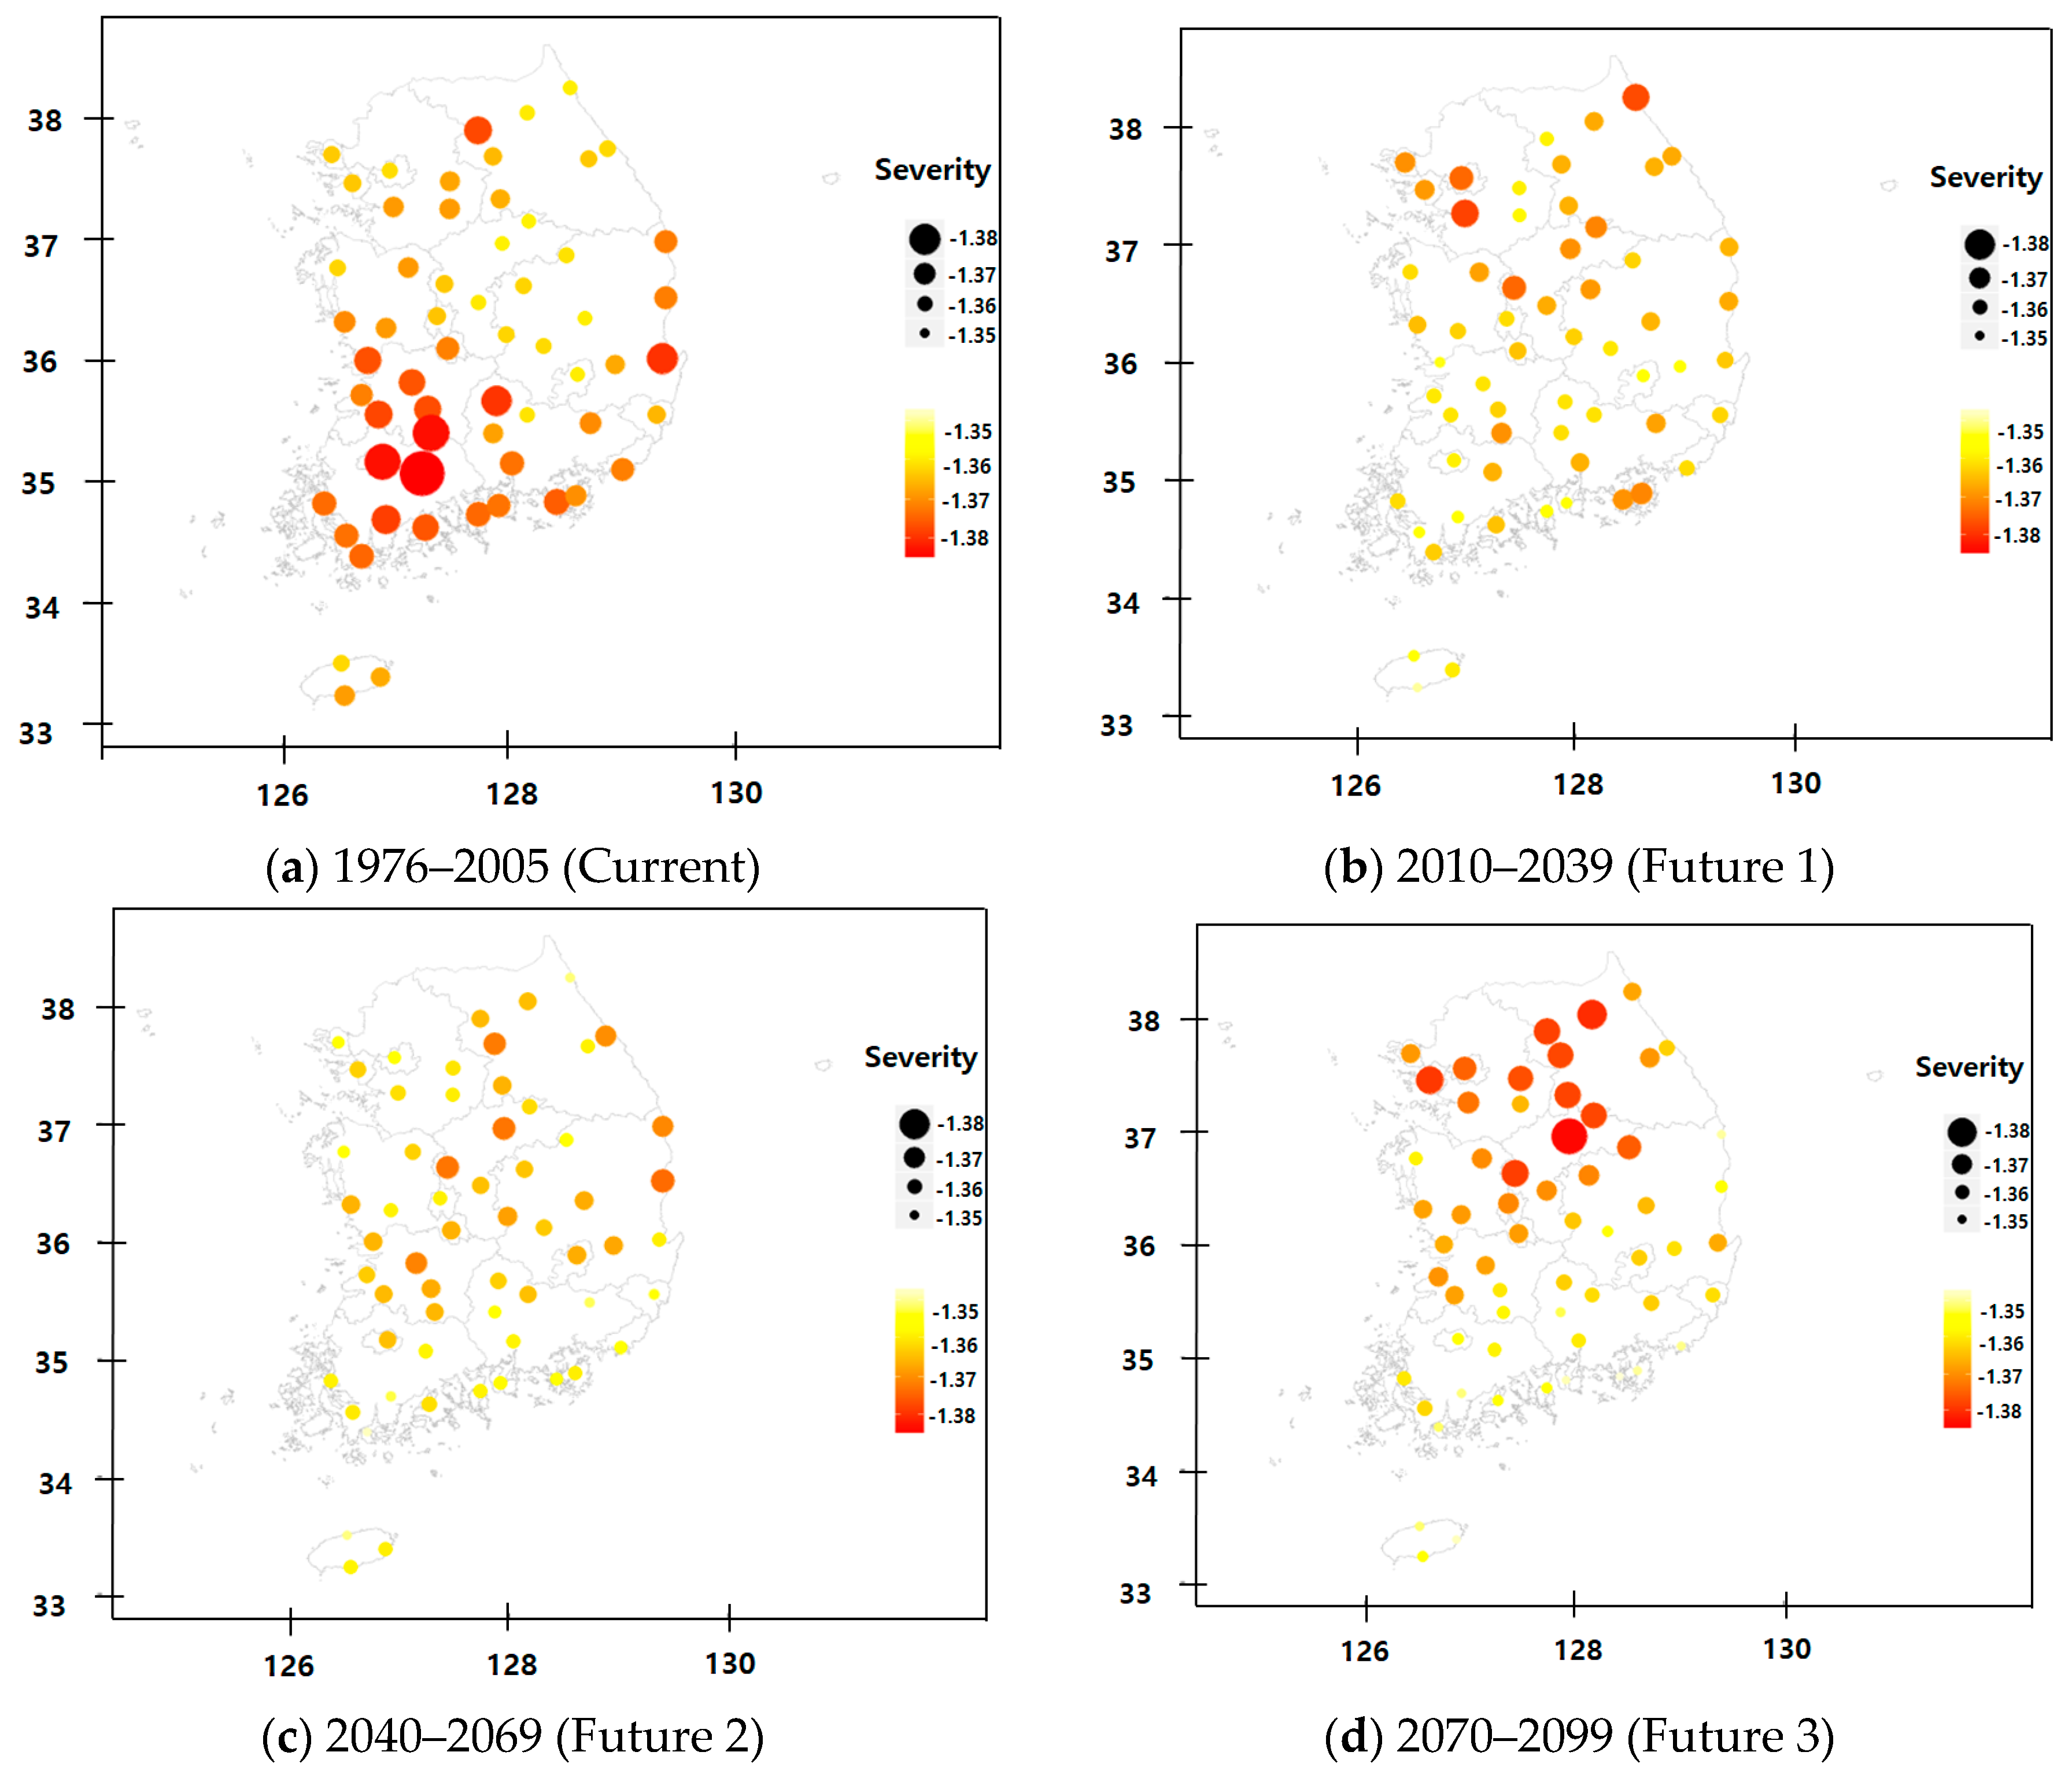
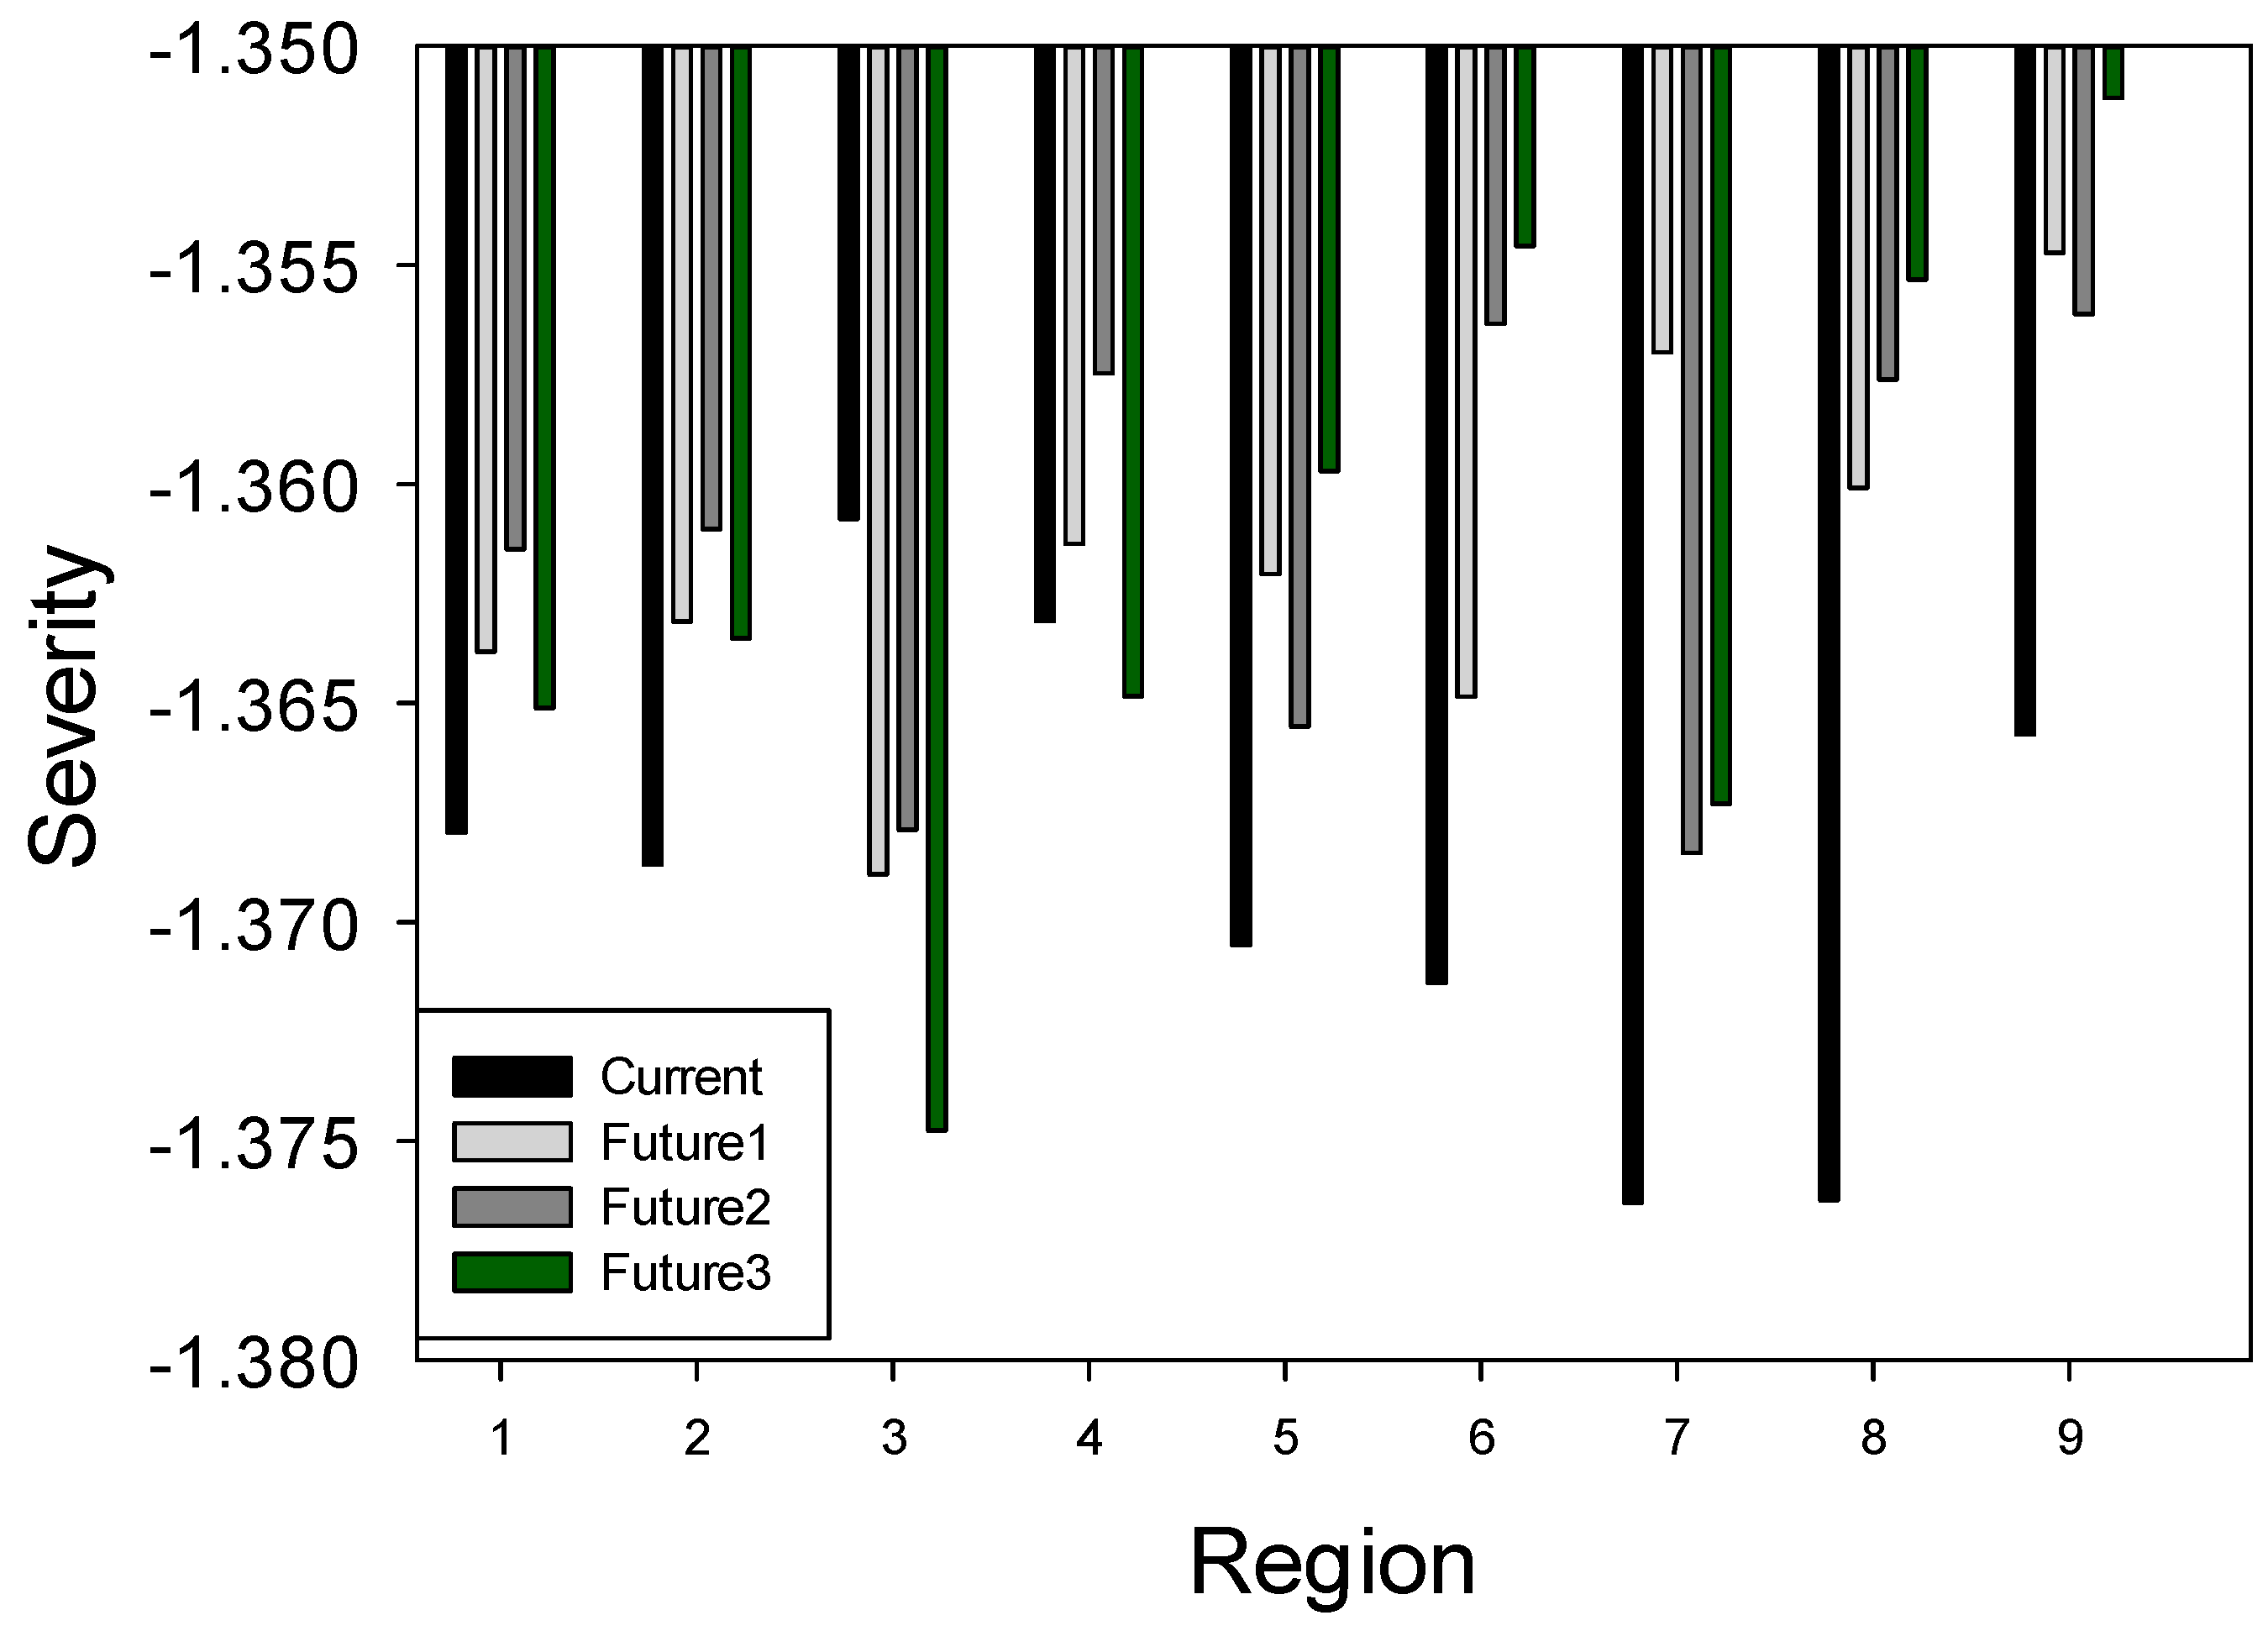
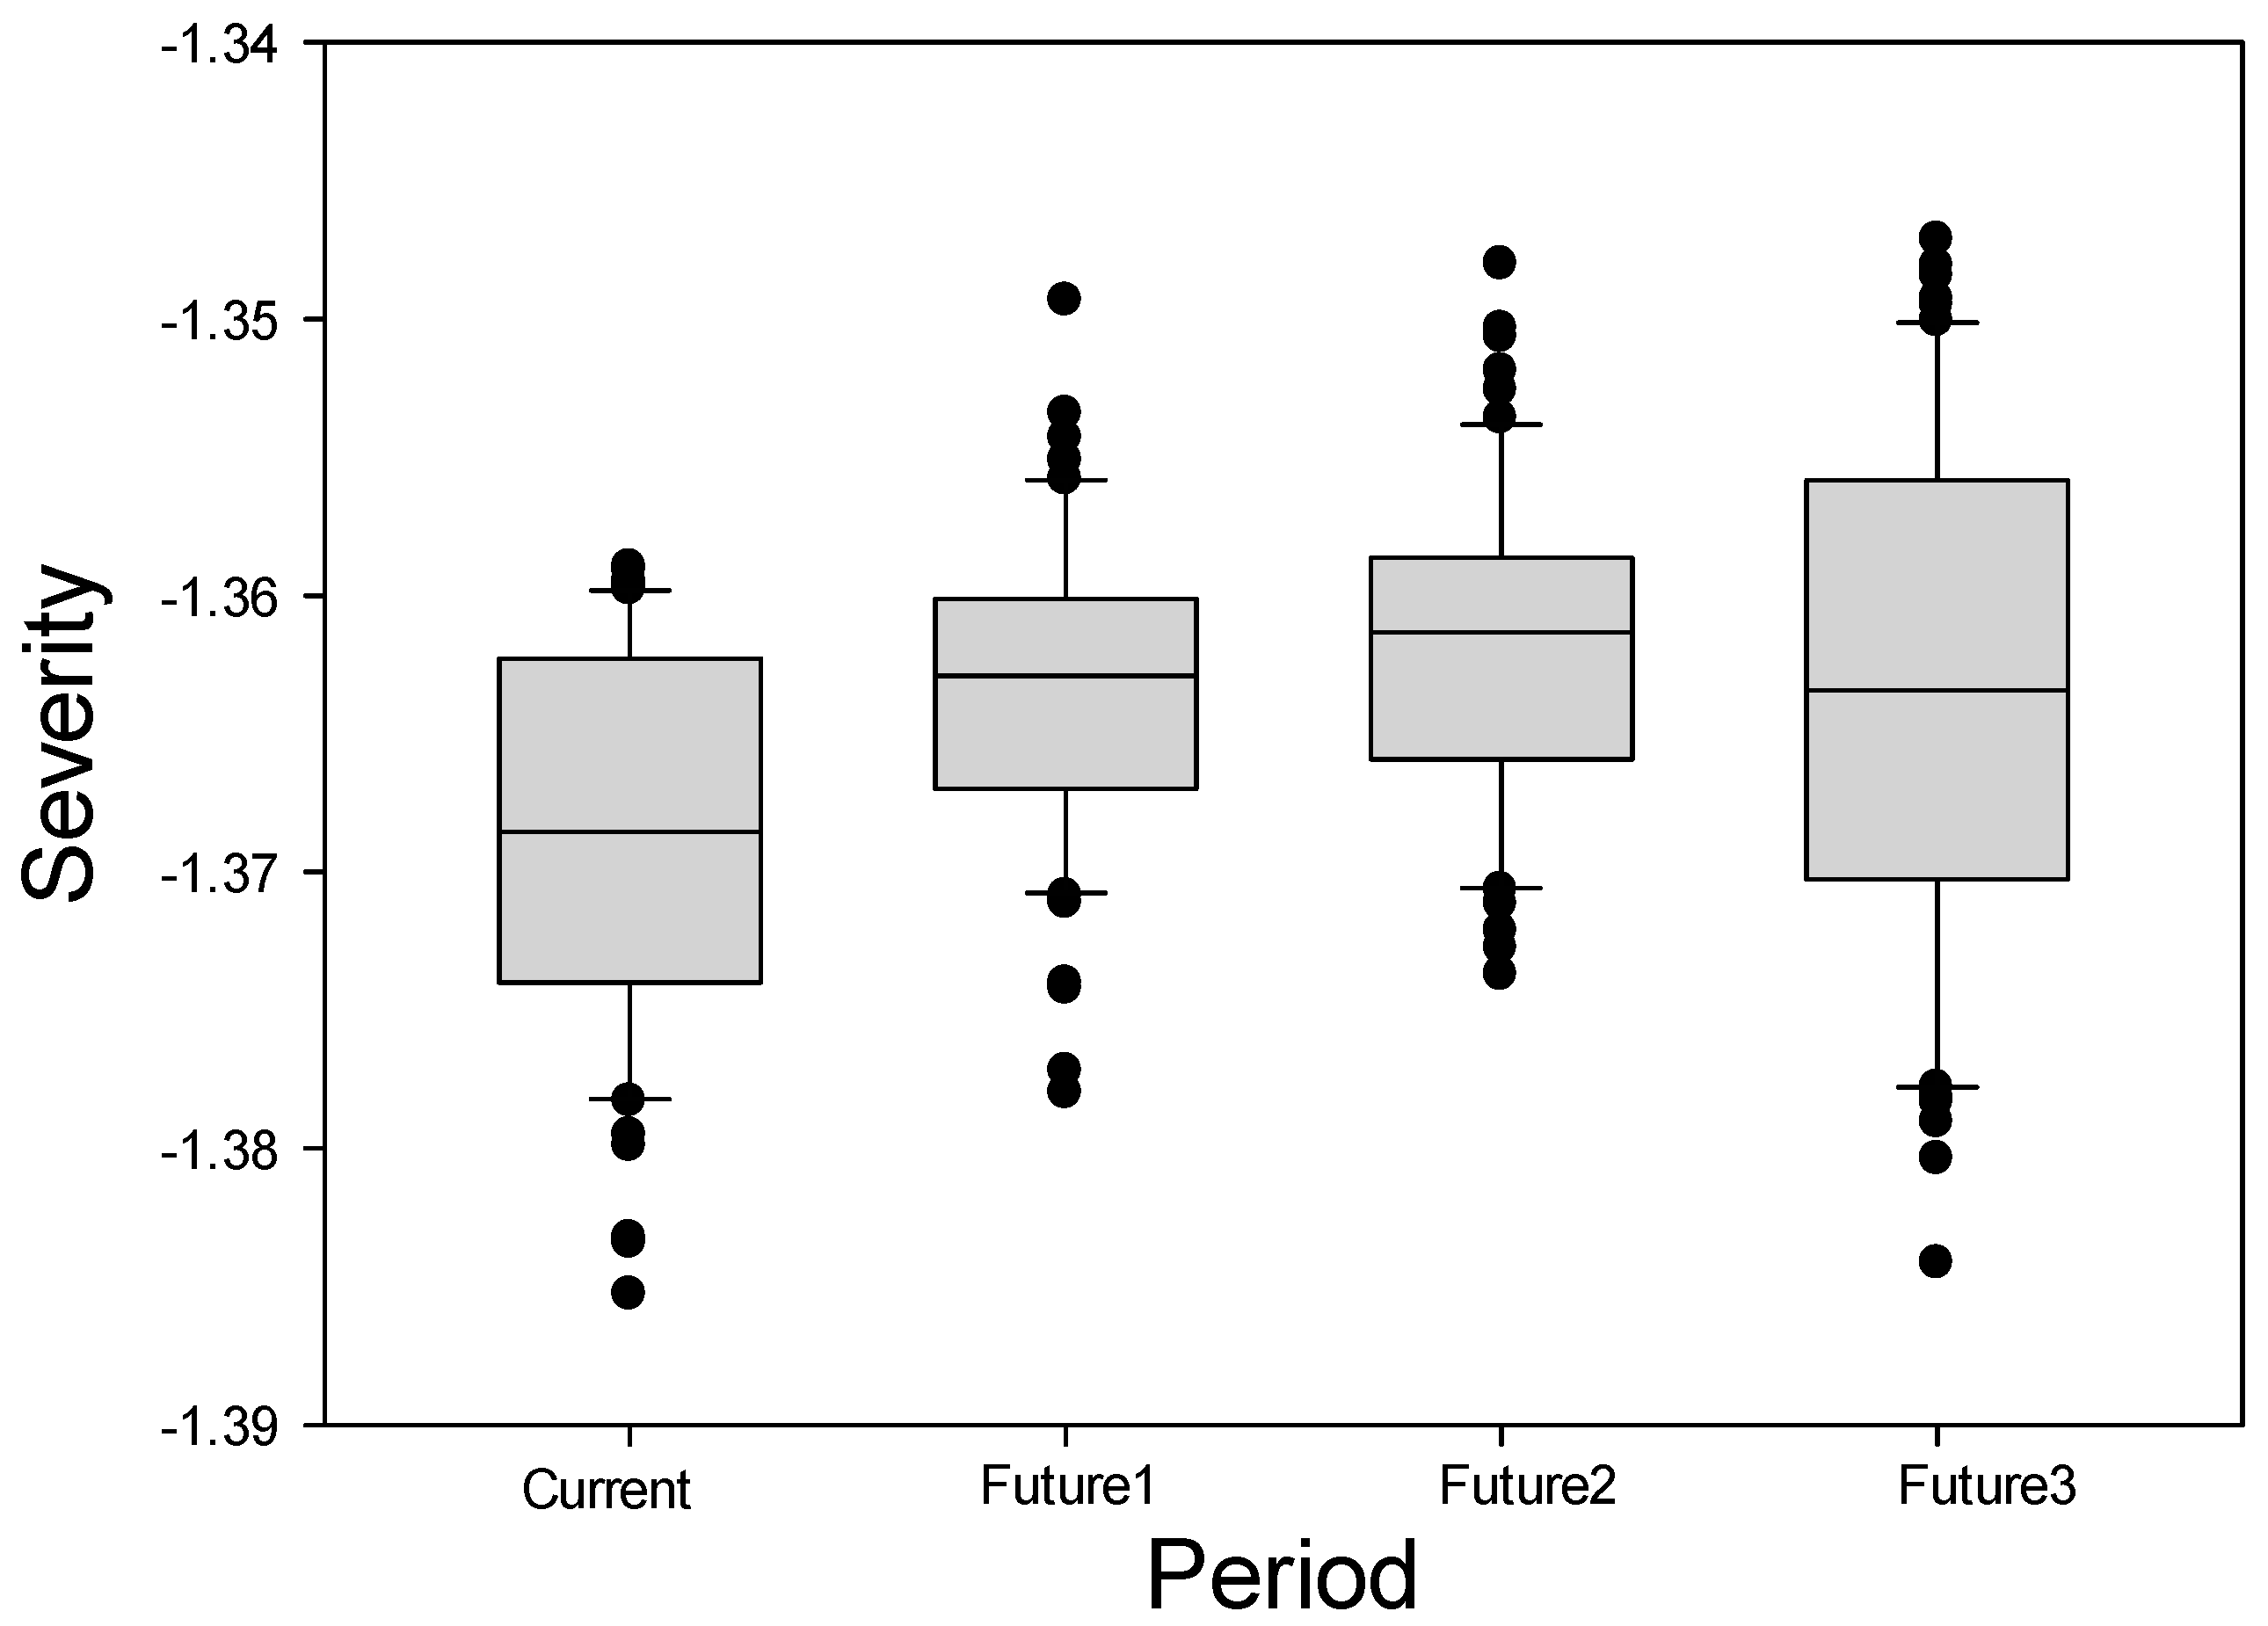
3.1.3. Severity
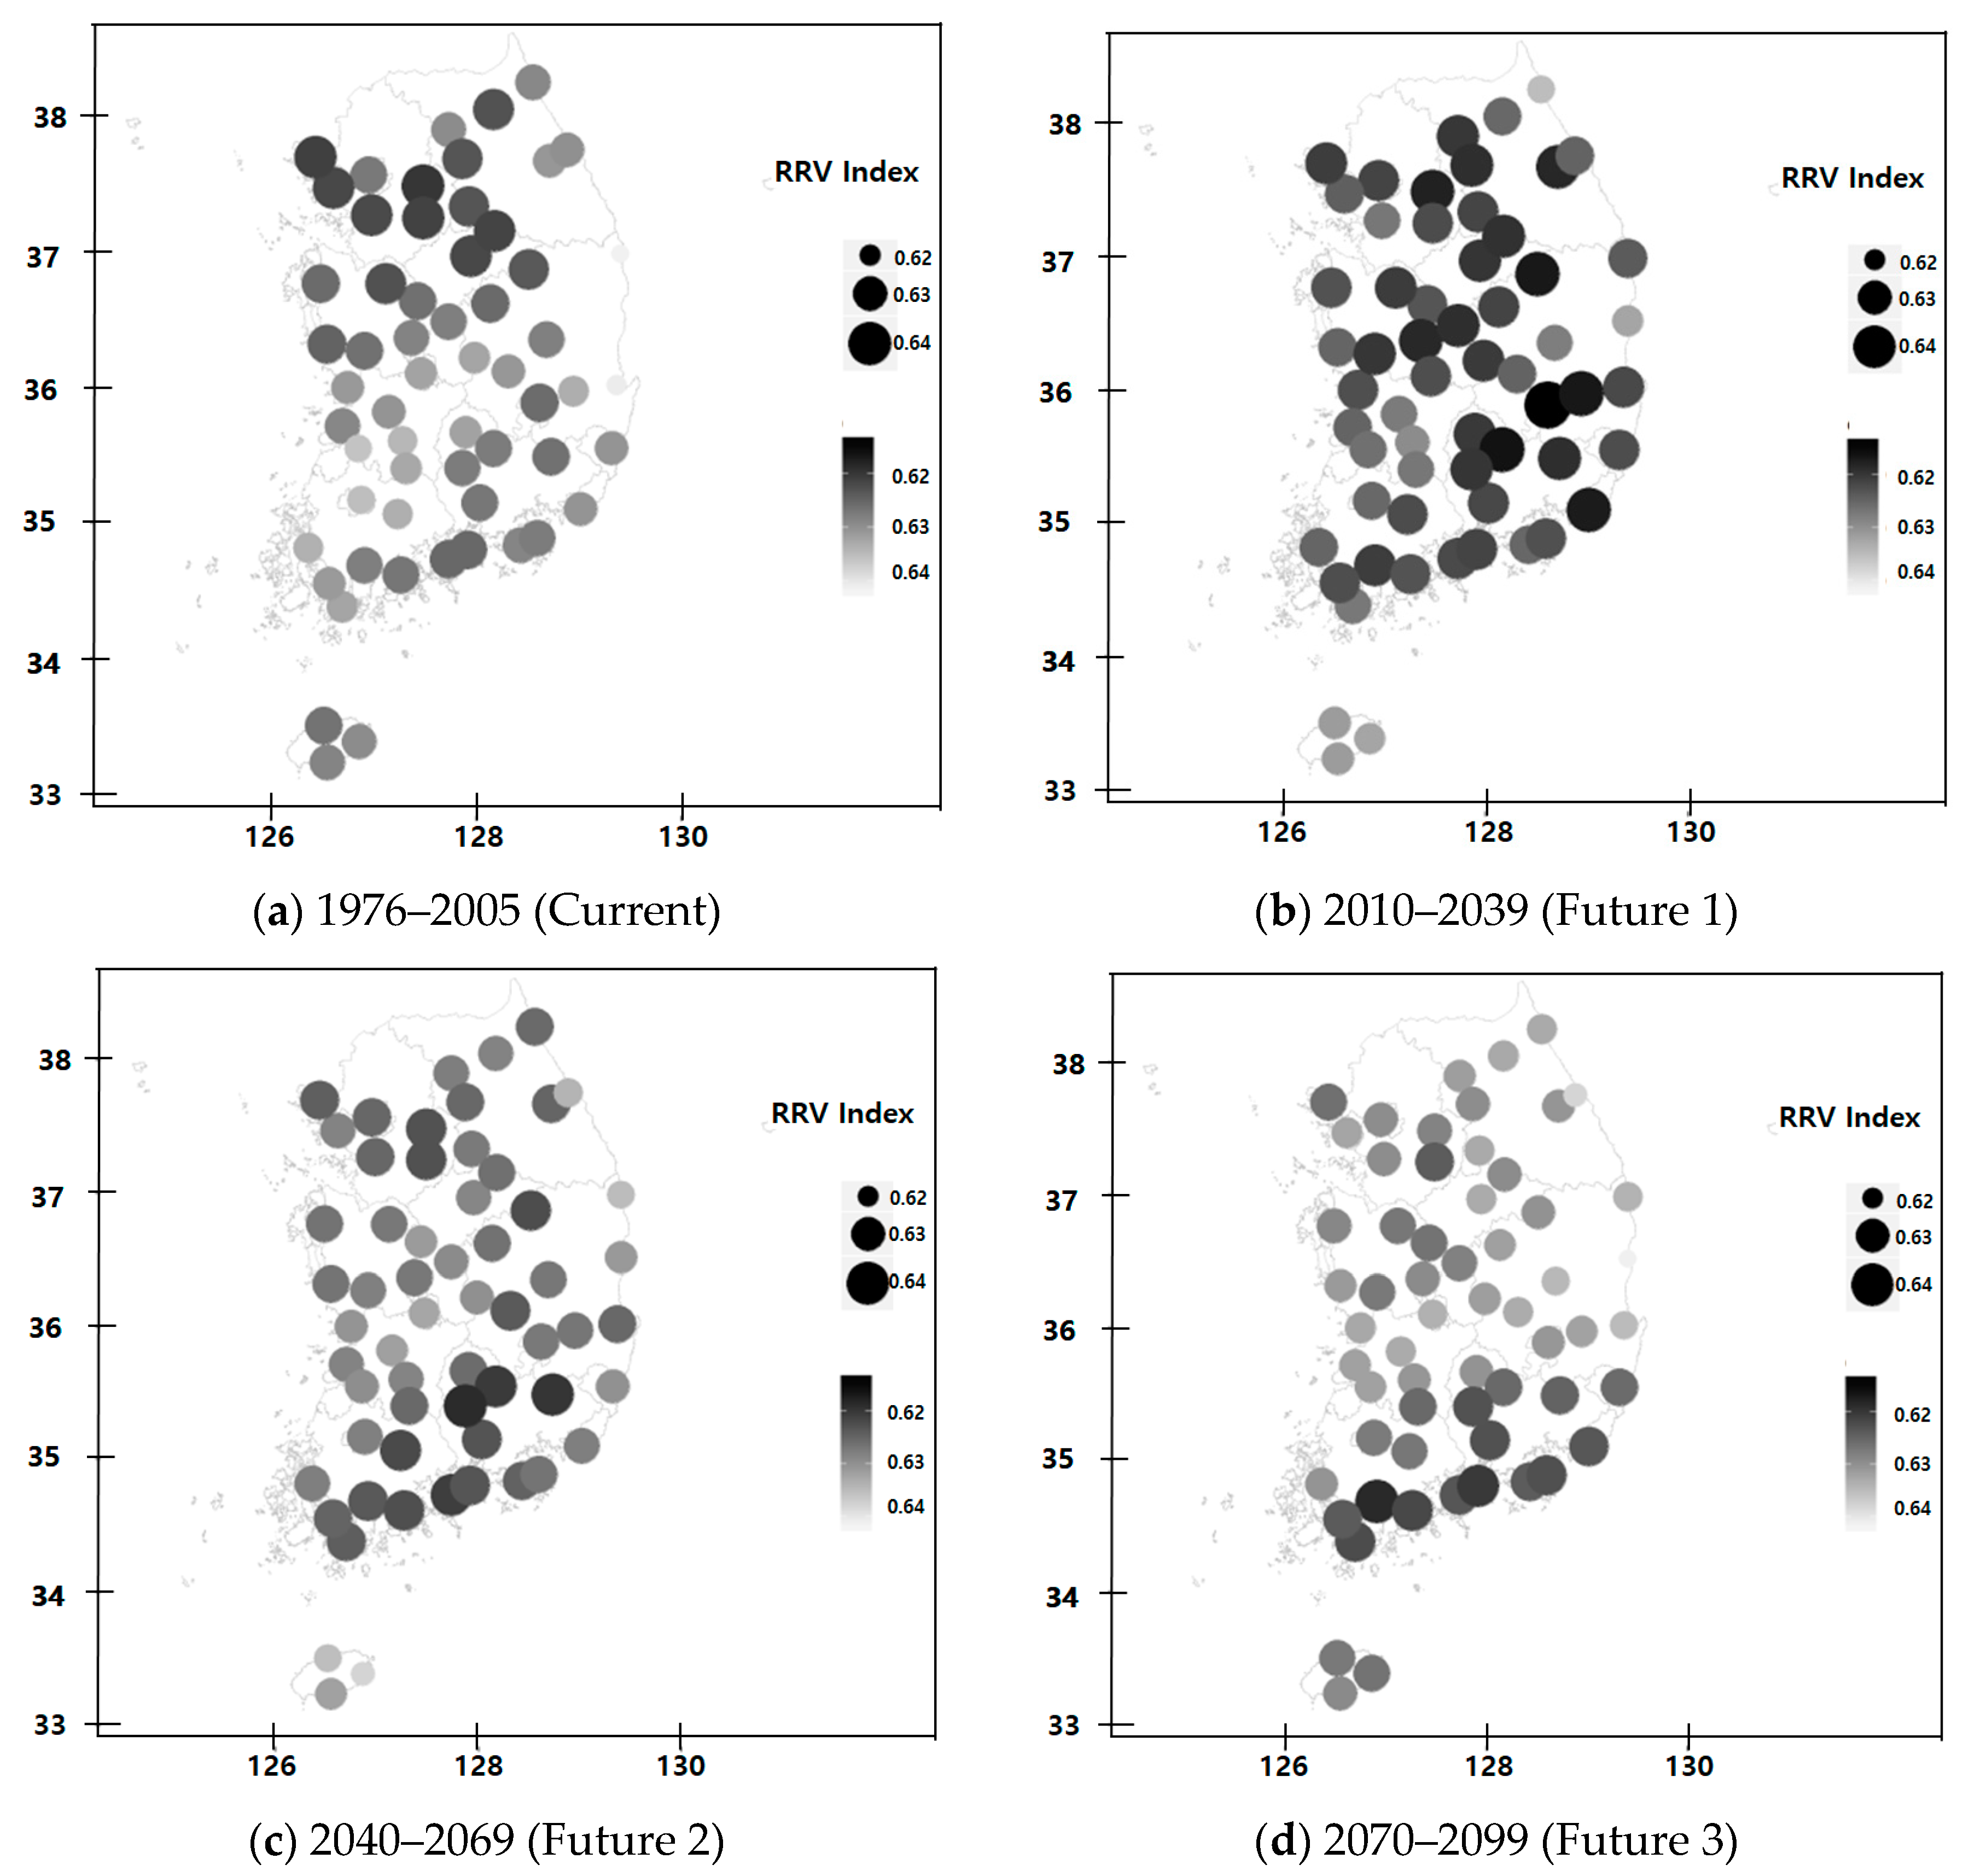
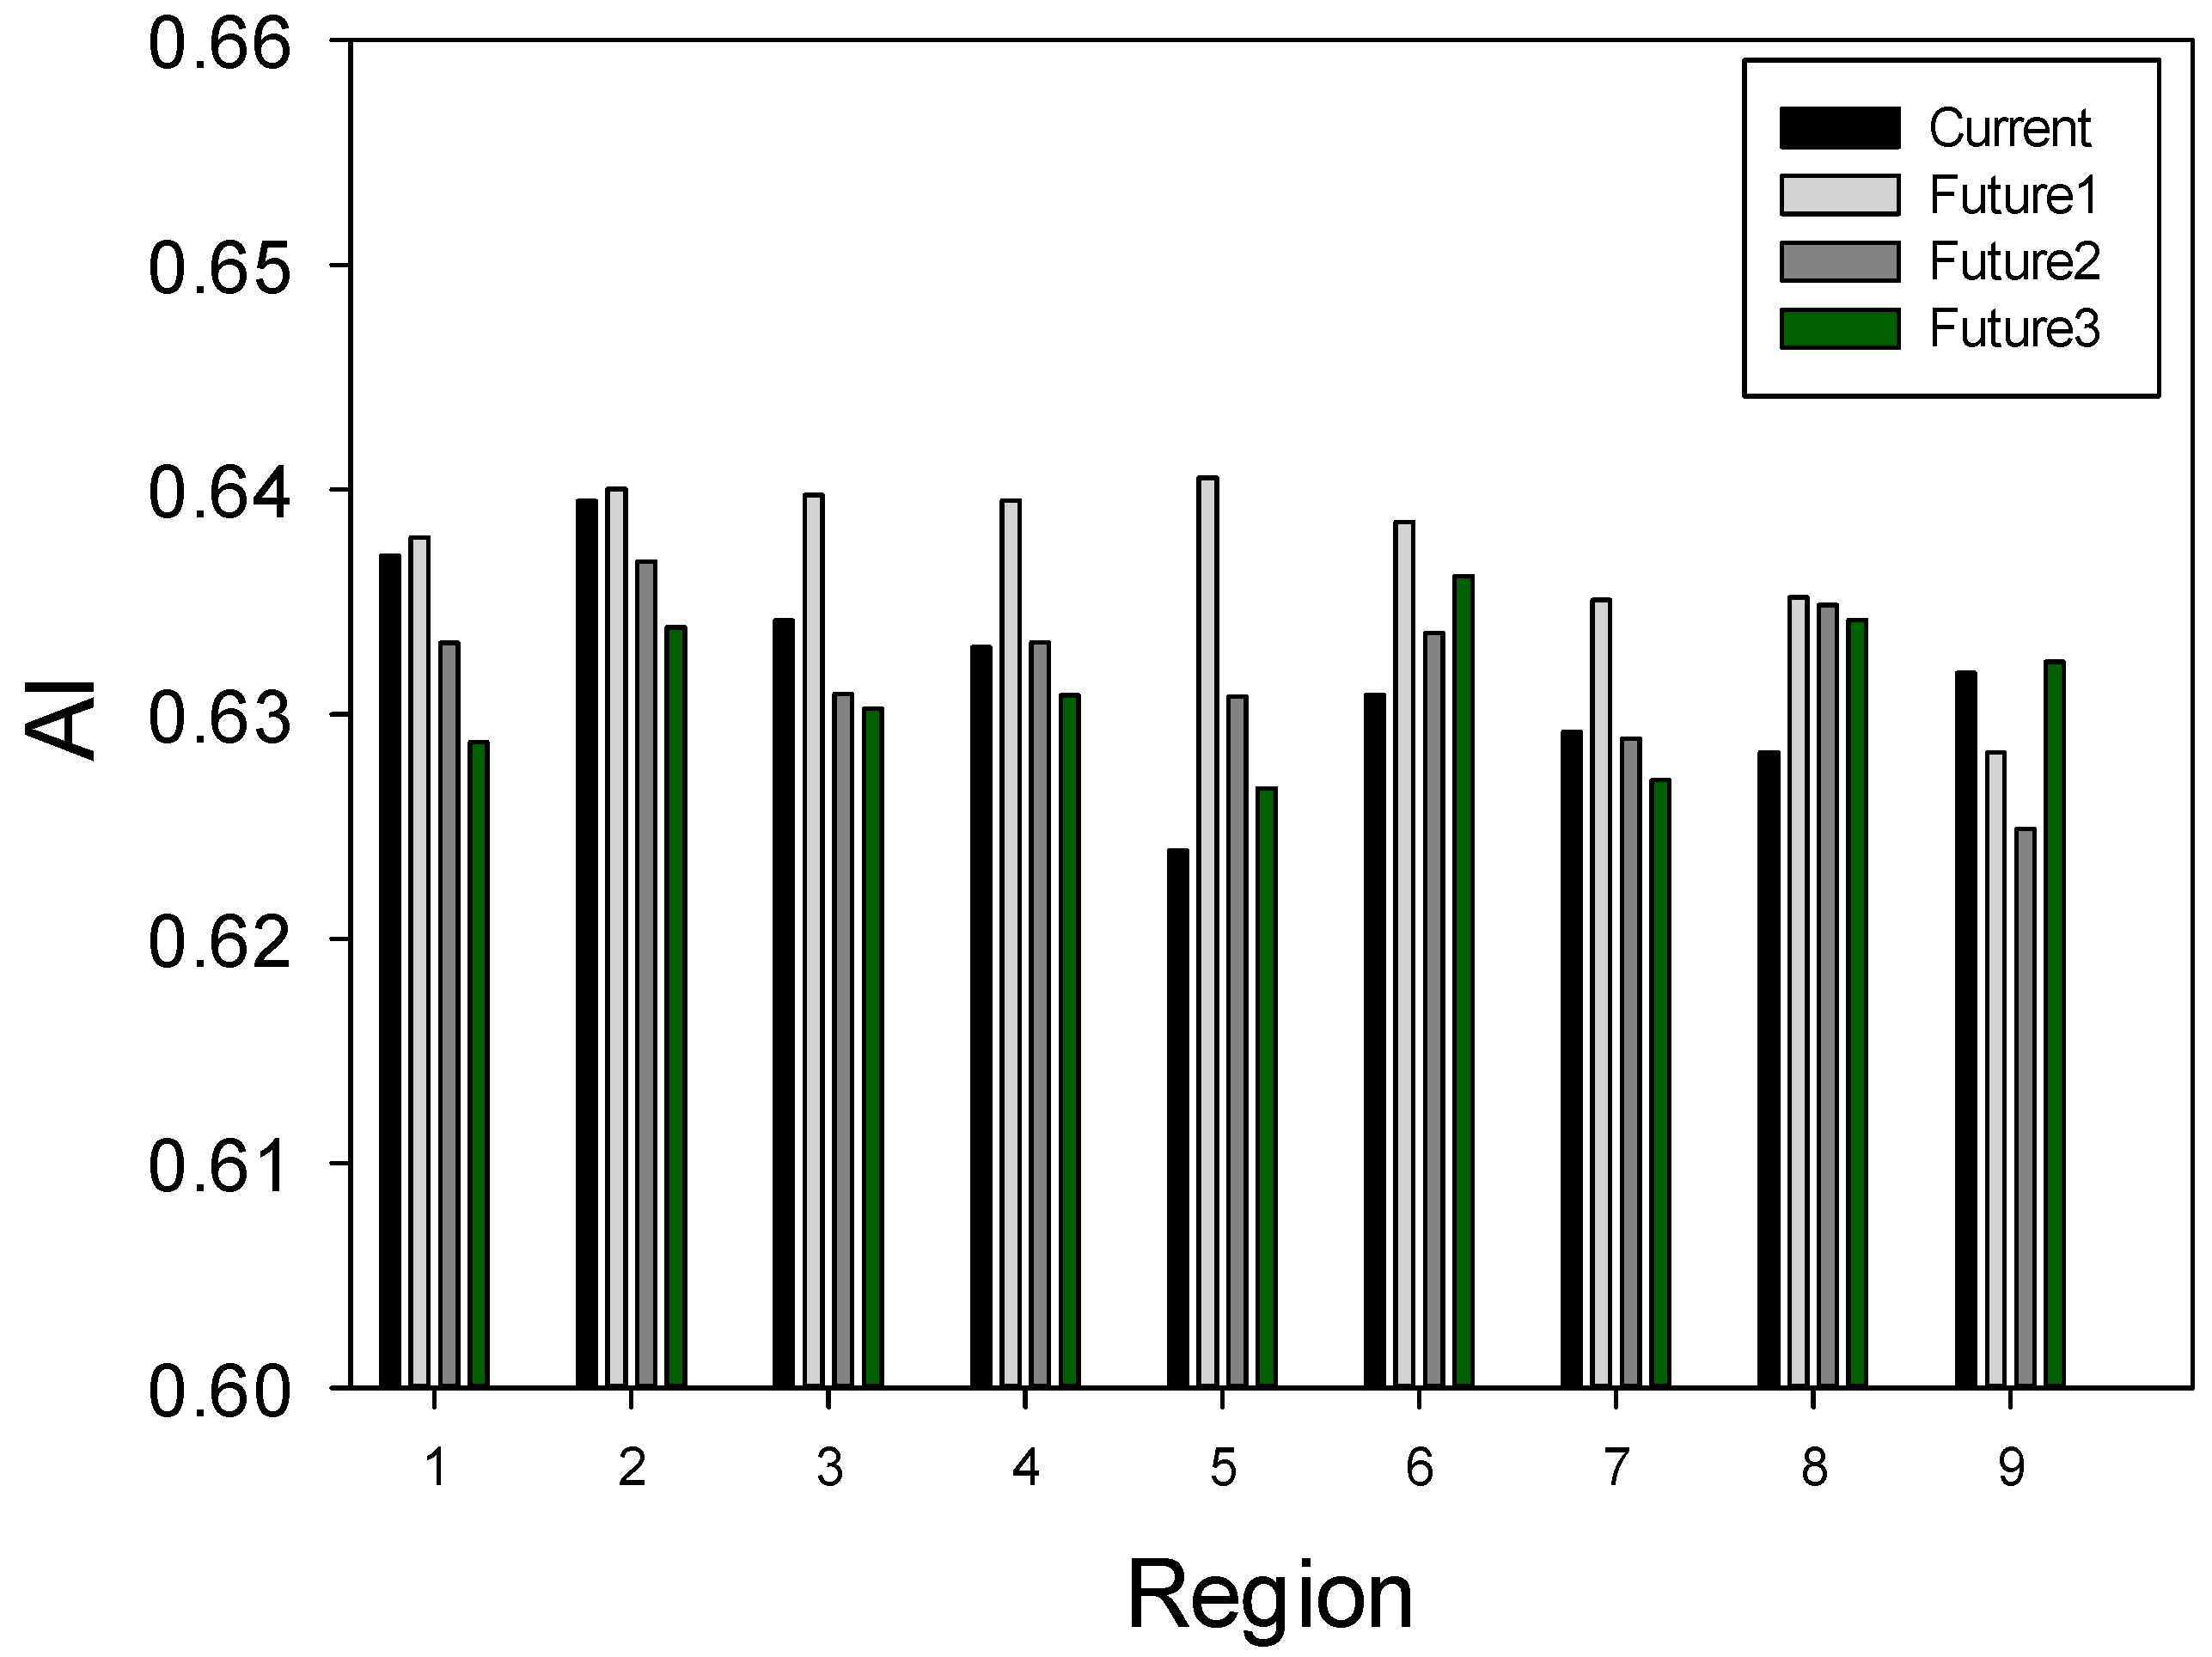
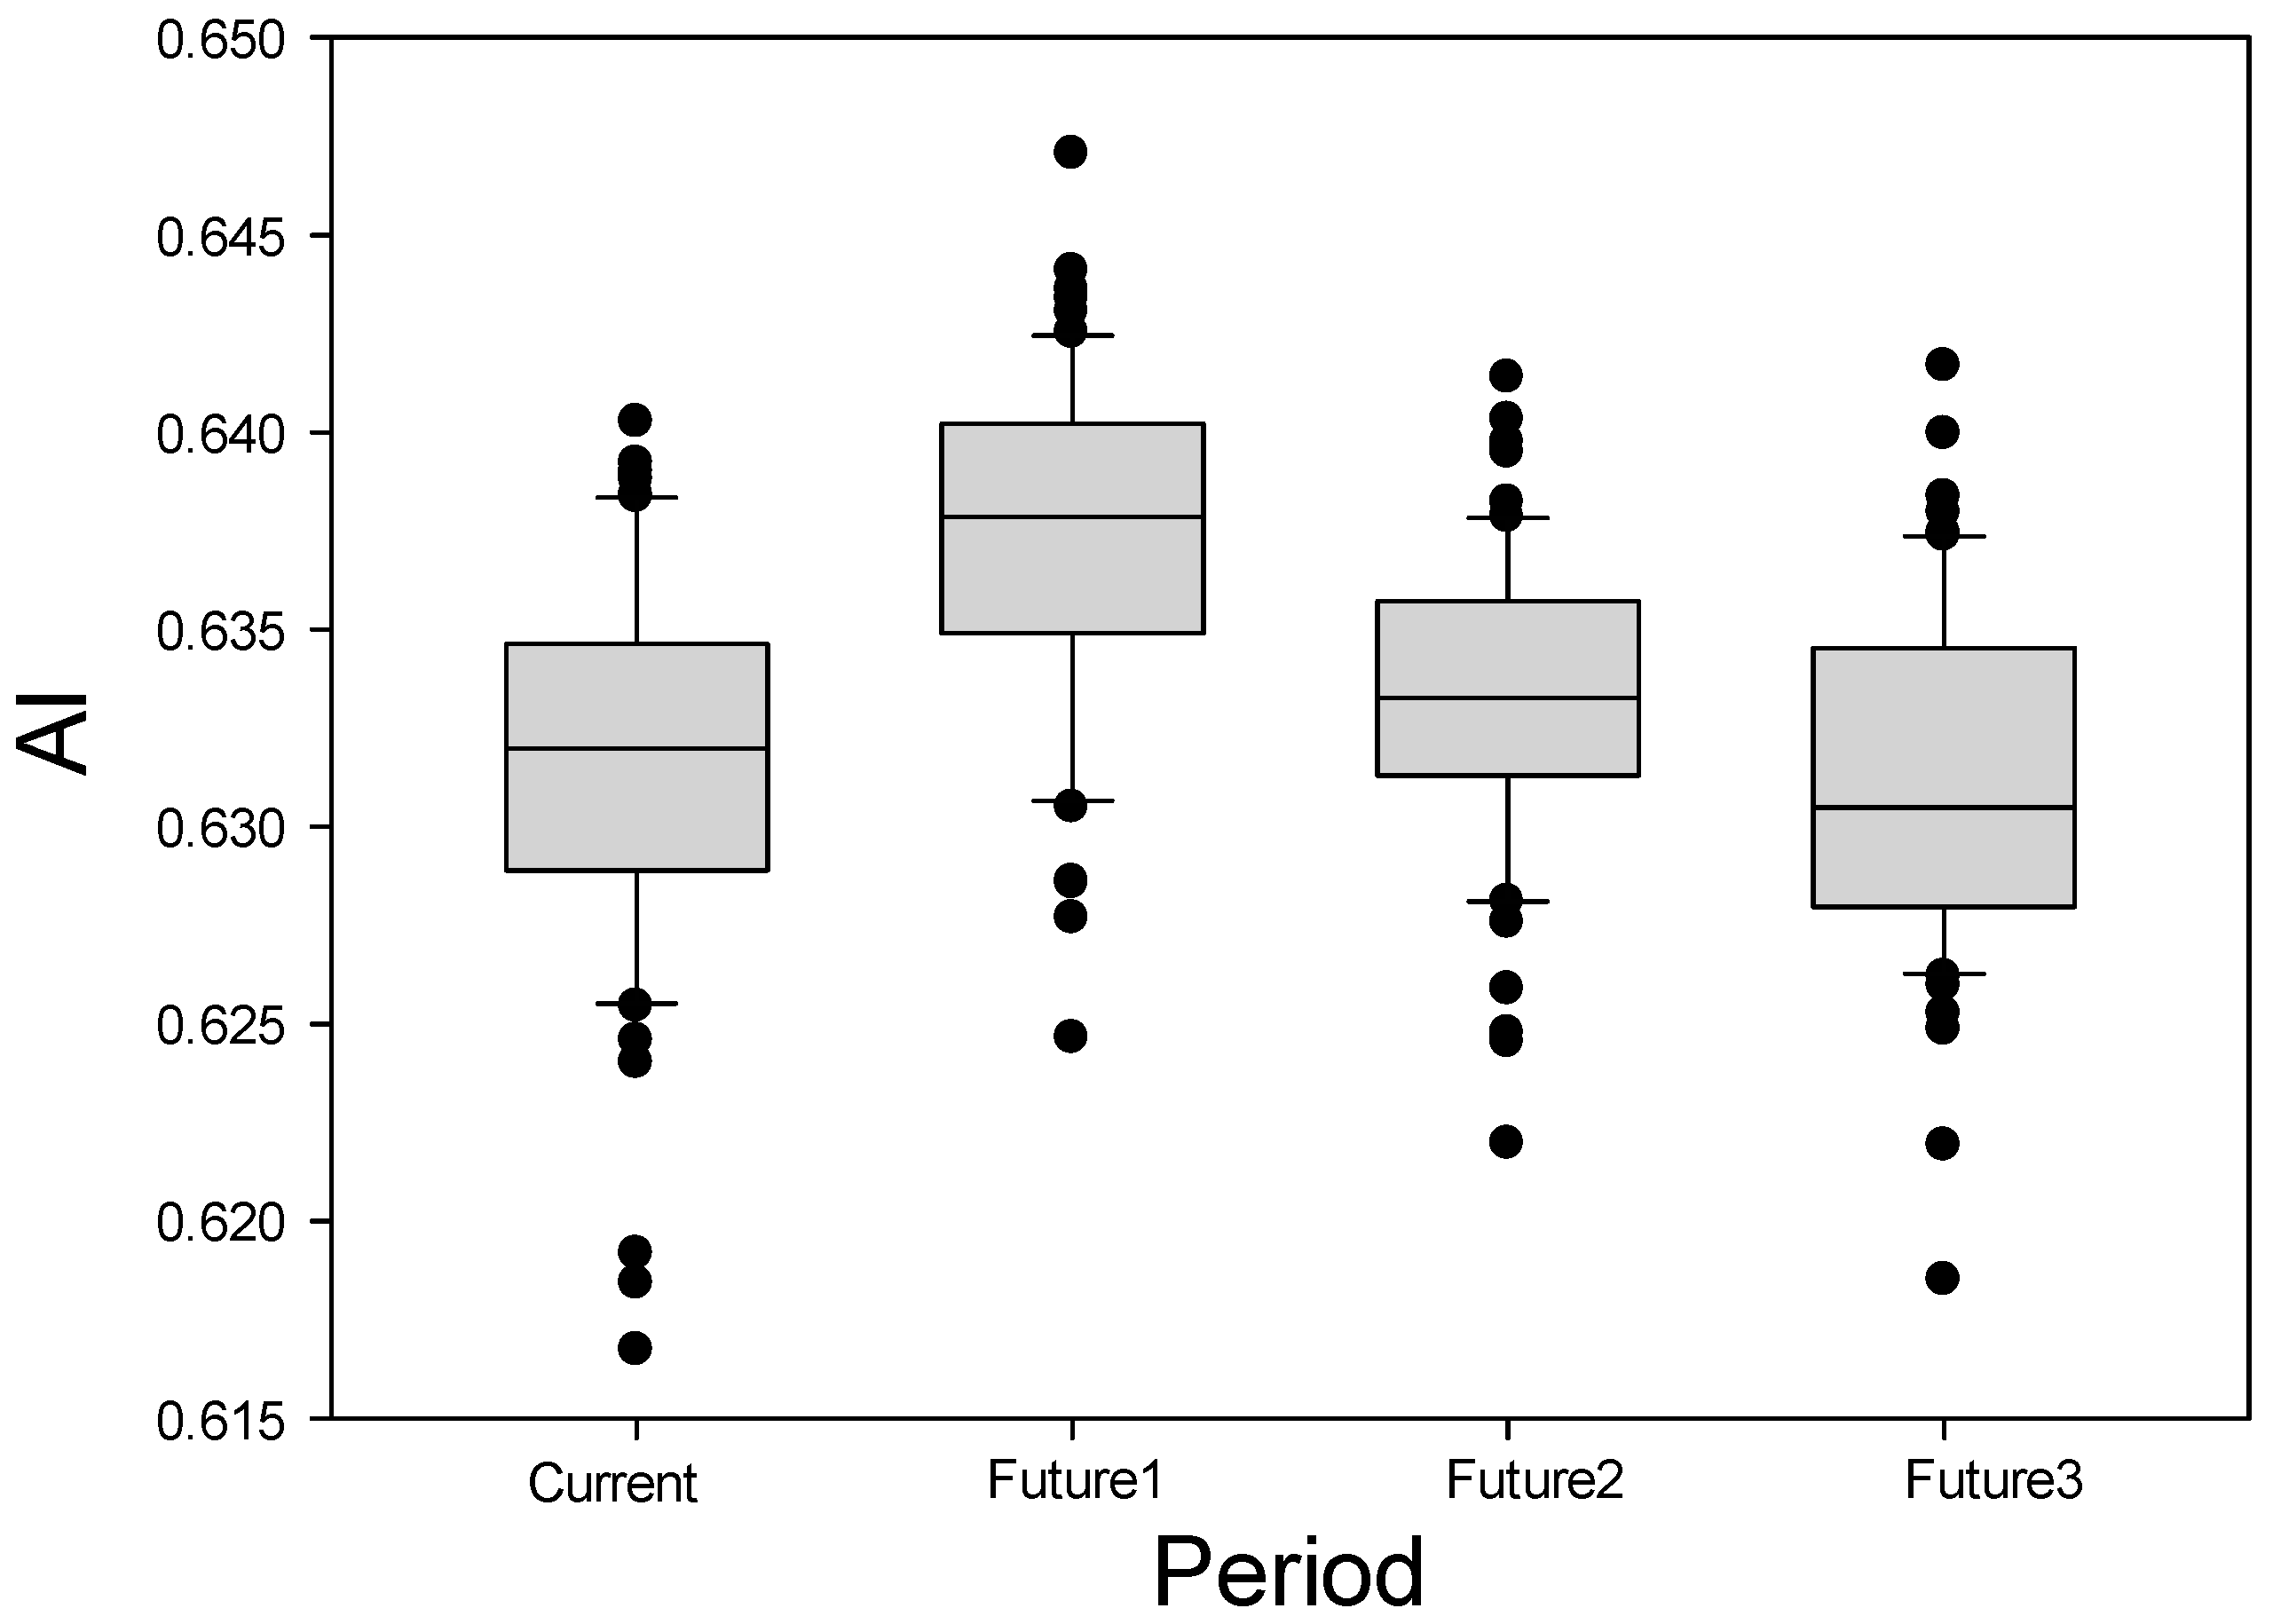
3.2. Projection of Aggregation Index for Future Drought
4. Conclusions
Author Contributions
Funding
Conflicts of Interest
References
- Pew Research Center. Available online: http://www.pewglobal.org/ (accessed on 23 July 2018).
- Giorgi, F.; Mearns, L.O. Calculation of average, uncertainty range and reliability of regional climate changes from AOGCM simulations via the ‘Reliability Ensemble Averaging (REA)’ method. J. Clim. 2002, 15, 1141–1158. [Google Scholar] [CrossRef]
- Doblas-Reyes, F.J.; Hagendorn, R.; Palmer, T.N. The rationale behind the success of multi-model ensembles in seasonal forecasting—II. Calibration and combination. Tellus 2005, 57A, 234–252. [Google Scholar]
- Räisänen, J.; Palmer, T.N. A probability and decision-model analysis of a multi-model ensemble of climate change simulations. J. Clim. 2001, 14, 3212–3226. [Google Scholar] [CrossRef]
- Rajagopalan, B.; Lall, U.; Zebiak, S.E. Categorical climate forecasts through regularization and optimal combination of multiple GCM ensembles. Mon. Weather Rev. 2002, 130, 1792–1811. [Google Scholar] [CrossRef]
- Raftery, A.E.T.; Gneiting, F.; Balabdaoui, F.; Polakowski, M. Using Bayesian model averaging to calibrate forecast ensemble. Mon. Weather Rev. 2005, 133, 1155–1174. [Google Scholar] [CrossRef]
- Im, E.S.; Kwon, W.T.; Ahn, J.B.; Giorgi, F. Multi-decadal scenario simulation over Korea using a one-way double-nested regional climate model system. Part 1: Recent climate simulation (1971–2000). Clim. Dyn. 2007, 38, 759–780. [Google Scholar] [CrossRef]
- Feng, J.M.; Wang, Y.L.; Fu, C.B. Simulation of extreme climate events over China with different regional climate models. Atmos. Ocean. Sci. Lett. 2011, 4, 47–56. [Google Scholar]
- Sung, J.H.; Kang, H.-S.; Park, S.; Cho, C.H.; Bae, D.H.; Kim, Y.-O. Projection of Extreme Precipitation at the end of 21st Century over South Korea based on Representative Concentration Pathways (RCP). Atmosphere 2012, 22, 221–231. [Google Scholar] [CrossRef]
- Sa’adi, Z.; Shahid, S.; Ismail, T.; Al-Abadi, A.M.; Chung, E.S. Long-term trends in daily temperature extremes in Iraq. Atmos. Res. 2017, 187, 97–107. [Google Scholar]
- Wood, A.W.; Leung, L.R.; Sridhar, V.; Lettenmaier, D.P. Hydrologic implications of dynamical and statistical approaches to downscaling climate model outputs. Clim. Chang. 2004, 62, 189–216. [Google Scholar] [CrossRef]
- Burger, G.; Sobie, S.R.; Cannon, A.J.; Werner, A.T.; Murdock, T.Q. Downscaling Extremes: An Intercomparison of Multiple Methods for Future Climate. J. Clim. 2013, 26, 3429–3449. [Google Scholar] [CrossRef]
- Cannon, A.J.; Sobie, S.R.; Murdock, T.Q. Bias correction of GCM precipitation by quantile mapping: How well do methods preserve changes in quantiles and extremes? J. Clim. 2015, 28, 6938–6959. [Google Scholar] [CrossRef]
- Abatzoglou, J.T.; Brown, T.J. A comparison of statistical downscaling methods suited for wildfire applications. Int. J. Clim. 2012, 32, 772–780. [Google Scholar] [CrossRef]
- Eum, H.-I.; Cannon, A.J. Intercomparison of projected changes in climate extremes for South Korea: Application of trend preserving statistical downscaling methods to the CMIP5 ensemble. Int. J. Clim. 2017, 37, 3381–3397. [Google Scholar] [CrossRef]
- Xu, K.; Yang, D.W.; Xu, X.Y.; Lei, H.M. Copula based drought frequency analysis considering the spatio-temporal variability in Southwest China. J. Hydrol. 2015, 527, 630–640. [Google Scholar] [CrossRef]
- Reddy, M.J.; Ganguli, P. Application of copulas for derivation of drought severity-duration-frequency curves. Hydrol. Process. 2011, 26, 1672–1685. [Google Scholar] [CrossRef]
- Zongxue, X.; Jinno, K.; Kawanura, A.; Takesaki, S.; Ito, K. Performance risk analysis for Fukuoka watersupply system. Water Resour. Manag. 1998, 12, 13–30. [Google Scholar] [CrossRef]
- Loucks, D.P. Quantifying trends in system sustainability. Hydrol. Sci. 1997, 42, 513–530. [Google Scholar] [CrossRef] [Green Version]
- Thomson, A.M.; Calvin, K.V.; Smith, S.J.; Kyle, G.P.; Volke, A.; Patel, P.; Delgado-Arias, S.; Bond-Lamberty, B.; Wise, M.A.; Clarke, L.E. RCP4.5: A pathway for stabilization of radiative forcing by 2100. Clim. Chang. 2011, 109, 77. [Google Scholar] [CrossRef]
- Kim, J.; Kim, S.; Joo, J. Analysis of drought characteristics depending on RCP scenarios at Korea. J. Korea Water Resour. Assoc. 2016, 49, 293–303. [Google Scholar] [CrossRef]
- Gwak, Y.; Cho, J.; Jung, I.; Kim, D.; Jang, S. Downscaled climate change scenarios data for Korean Peninsula Projection of Future Changes in Drought Characteristics in Korea Peninsula Using Effective Drought Index. J. Clim. Chang. Res. 2018, 9, 31–45. [Google Scholar] [CrossRef]
- Thornthwaite, C.W.; Mather, J.R. The water balance. Publ. Climatol. 1955, 8, 1–104. [Google Scholar]
- Vicente-Serrano, S.M.; Begueria, S.; Lopez-Moreno, J.I. A multiscalar droughtindex sensitive to global warming: The Standardized Precipitation Evapotranspiration Index. J. Clim. 2010, 23, 1696–1718. [Google Scholar] [CrossRef]
- Tallaksen, L.M.; Madsen, H.; Clausen, B. On the definition and modelling of streamflow drought duration and deficit volume. Hydrol. Sci. J. 1997, 42, 15–33. [Google Scholar] [CrossRef] [Green Version]
- Sung, J.H.; Chung, E.-S. Development of streamflow drought severity-duration-frequency curves using the threshold level method. Hydrol. Earth Syst. Sci. 2014, 18, 3341–3351. [Google Scholar] [CrossRef]
- Kim, Y.; Chung, E.; Jun, S.; Kim, S.U. Prioritizing the best sites for treated wastewater instream use in an urban watershed using fuzzy TOPSIS. Resour. Conserv. Recycl. 2014, 73, 23–32. [Google Scholar] [CrossRef]
- Klemes, V.; Srikanthan, R.; McMahon, T.A. Long-memory flow models in reservoir analysis: What is their practical value? Water Resour. Res. 1981, 17, 737–751. [Google Scholar] [CrossRef]
- Hashimoto, T.; Stedinger, J.R.; Loucks, D.P. Reliability, resiliency and vulnerability criteria for water resource system performance evaluation. Water Resour. Res. 1982, 18, 14–20. [Google Scholar] [CrossRef]
- Loucks, D.P.; van Beek, E. Water Resources Systems Planning and Management; United Nations Educational, Scientific and Cultural Organization (UNESCO): Paris, France, 2005. [Google Scholar]
- Sandoval-Solis, S.; McKinney, D.C.; Loucks, D.P. Sustainability index for water resources planning and management. J. Water Resour. Plan. Manag. 2011, 137, 381–390. [Google Scholar] [CrossRef]
- Kim, B.S.; Sung, J.H.; Lee, B.H.; Kim, D.J. Evaluation on the impact of extreme droughts in South Korea using the SPEI and RCP8.5 climate change scenario. J. Korean Soc. Hazard Mitig. 2013, 13, 97–109. [Google Scholar] [CrossRef]
- Nam, W.H.; Hayes, M.J.; Svoboda, M.D.; Tadesse, T.; Wilhite, D.A. Drought hazard assessment in the context of climate change for South Korea. Agric. Water Manag. 2015, 160, 106–117. [Google Scholar] [CrossRef]


| No. | General Circulation Models | Atmospheric Grid [Latitude × Longitude] |
|---|---|---|
| 1 | BCC-CSM1.1 | 2.7906 × 2.8125 |
| 2 | BCC-CSM1.1(m) | 2.7906 × 2.8125 |
| 3 | CanESM2 | 2.7906 × 2.8125 |
| 4 | CCSM4 | 0.9424 × 1.25 |
| 5 | CESM1(BGC) | 0.9424 × 1.25 |
| 6 | CESM1(CAM5) | 0.9424 × 1.25 |
| 7 | CMCC-CM | 0.7484 × 0.75 |
| 8 | CMCC-CMS | 3.7111 × 3.75 |
| 9 | CNRM-CM5 | 1.4008 × 1.40625 |
| 10 | CSIRO-Mk3.6.0 | 1.8653 × 1.875 |
| 11 | FGOALS-g2 | 2.7906 × 2.8125 |
| 12 | FGOALS-s2 | 1.6590 × 2.8125 |
| 13 | GFDL-ESM2G | 2.0225 × 2 |
| 14 | GFDL-ESM2M | 2.0225 × 2.5 |
| 15 | HadGEM2-AO | 1.25 × 1.875 |
| 16 | HadGEM2-CC | 1.25 × 1.875 |
| 17 | HadGEM2-ES | 1.25 × 1.875 |
| 18 | INM-CM4 | 1.5 × 2 |
| 19 | IPSL-CM5A-LR | 1.8947 × 3.75 |
| 20 | IPSL-CM5A-MR | 1.2676 × 2.5 |
| 21 | IPSL-CM5B-LR | 1.8947 × 3.75 |
| 22 | MIROC5 | 1.4008 × 1.40625 |
| 23 | MIROC-ESM | 2.7906 × 2.8125 |
| 24 | MIROC-ESM-CHEM | 2.7906 × 2.8125 |
| 25 | MPI-ESM-LR | 1.8653 × 1.875 |
| 26 | MPI-ESM-MR | 1.8653 × 1.875 |
| 27 | MRI-CGCM3 | 1.12148 × 1.125 |
| 28 | NorESM1-M | 1.8947 × 2.5 |
| Region | Future 1 | Future 2 | Future 3 | |||||||||
|---|---|---|---|---|---|---|---|---|---|---|---|---|
| Fr | Dr | Sv | R–R–V | Fr | Dr | Sv | R–R–V | Fr | Dr | Sv | R–R–V | |
| 1 | 100.2 | 100.5 | 100.3 | 100.1 | 97.2 | 101.6 | 100.4 | 99.4 | 96.9 | 101.8 | 101.2 | 98.7 |
| 2 | 99.8 | 101 | 99.7 | 100.1 | 97.8 | 102.3 | 99.4 | 99.6 | 98.2 | 102 | 100.3 | 99.1 |
| 3 | 102.1 | 96.9 | 100.6 | 100.9 | 98.5 | 101.1 | 100.5 | 99.5 | 99.6 | 100.7 | 101 | 99.4 |
| 4 | 103.1 | 97.9 | 99.9 | 101 | 100.8 | 101.1 | 99.6 | 100 | 100.2 | 101.6 | 100.1 | 99.7 |
| 5 | 107.3 | 93.7 | 99.4 | 102.7 | 105 | 97.2 | 99.6 | 101.1 | 103.7 | 99 | 99.2 | 100.4 |
| 6 | 103.9 | 96.8 | 99.5 | 101.2 | 102.8 | 99.5 | 98.9 | 100.4 | 103.5 | 98.4 | 98.8 | 100.8 |
| 7 | 104 | 98.8 | 98.6 | 100.9 | 100.1 | 101.3 | 99.4 | 99.9 | 100.5 | 102.2 | 99.3 | 99.7 |
| 8 | 102.3 | 98.5 | 98.8 | 101.1 | 101 | 98.9 | 98.6 | 101 | 101.3 | 99.7 | 98.5 | 100.9 |
| 9 | 98.3 | 102.9 | 99.2 | 99.4 | 97 | 104 | 99.3 | 98.9 | 99.5 | 100.8 | 98.9 | 100.1 |
| Average | 102.4 | 98.3 | 99.6 | 100.9 | 100.6 | 100.3 | 99.5 | 100.3 | 100.6 | 100.6 | 99.6 | 99.9 |
© 2018 by the authors. Licensee MDPI, Basel, Switzerland. This article is an open access article distributed under the terms and conditions of the Creative Commons Attribution (CC BY) license (http://creativecommons.org/licenses/by/4.0/).
Share and Cite
Sung, J.H.; Chung, E.-S.; Shahid, S. Reliability–Resiliency–Vulnerability Approach for Drought Analysis in South Korea Using 28 GCMs. Sustainability 2018, 10, 3043. https://doi.org/10.3390/su10093043
Sung JH, Chung E-S, Shahid S. Reliability–Resiliency–Vulnerability Approach for Drought Analysis in South Korea Using 28 GCMs. Sustainability. 2018; 10(9):3043. https://doi.org/10.3390/su10093043
Chicago/Turabian StyleSung, Jang Hyun, Eun-Sung Chung, and Shamsuddin Shahid. 2018. "Reliability–Resiliency–Vulnerability Approach for Drought Analysis in South Korea Using 28 GCMs" Sustainability 10, no. 9: 3043. https://doi.org/10.3390/su10093043