Psychosocial Traits Characterizing EV Adopters’ Profiles: The Case of Tenerife (Canary Islands)

 , ,
, ,
Abstract
:1. Introduction
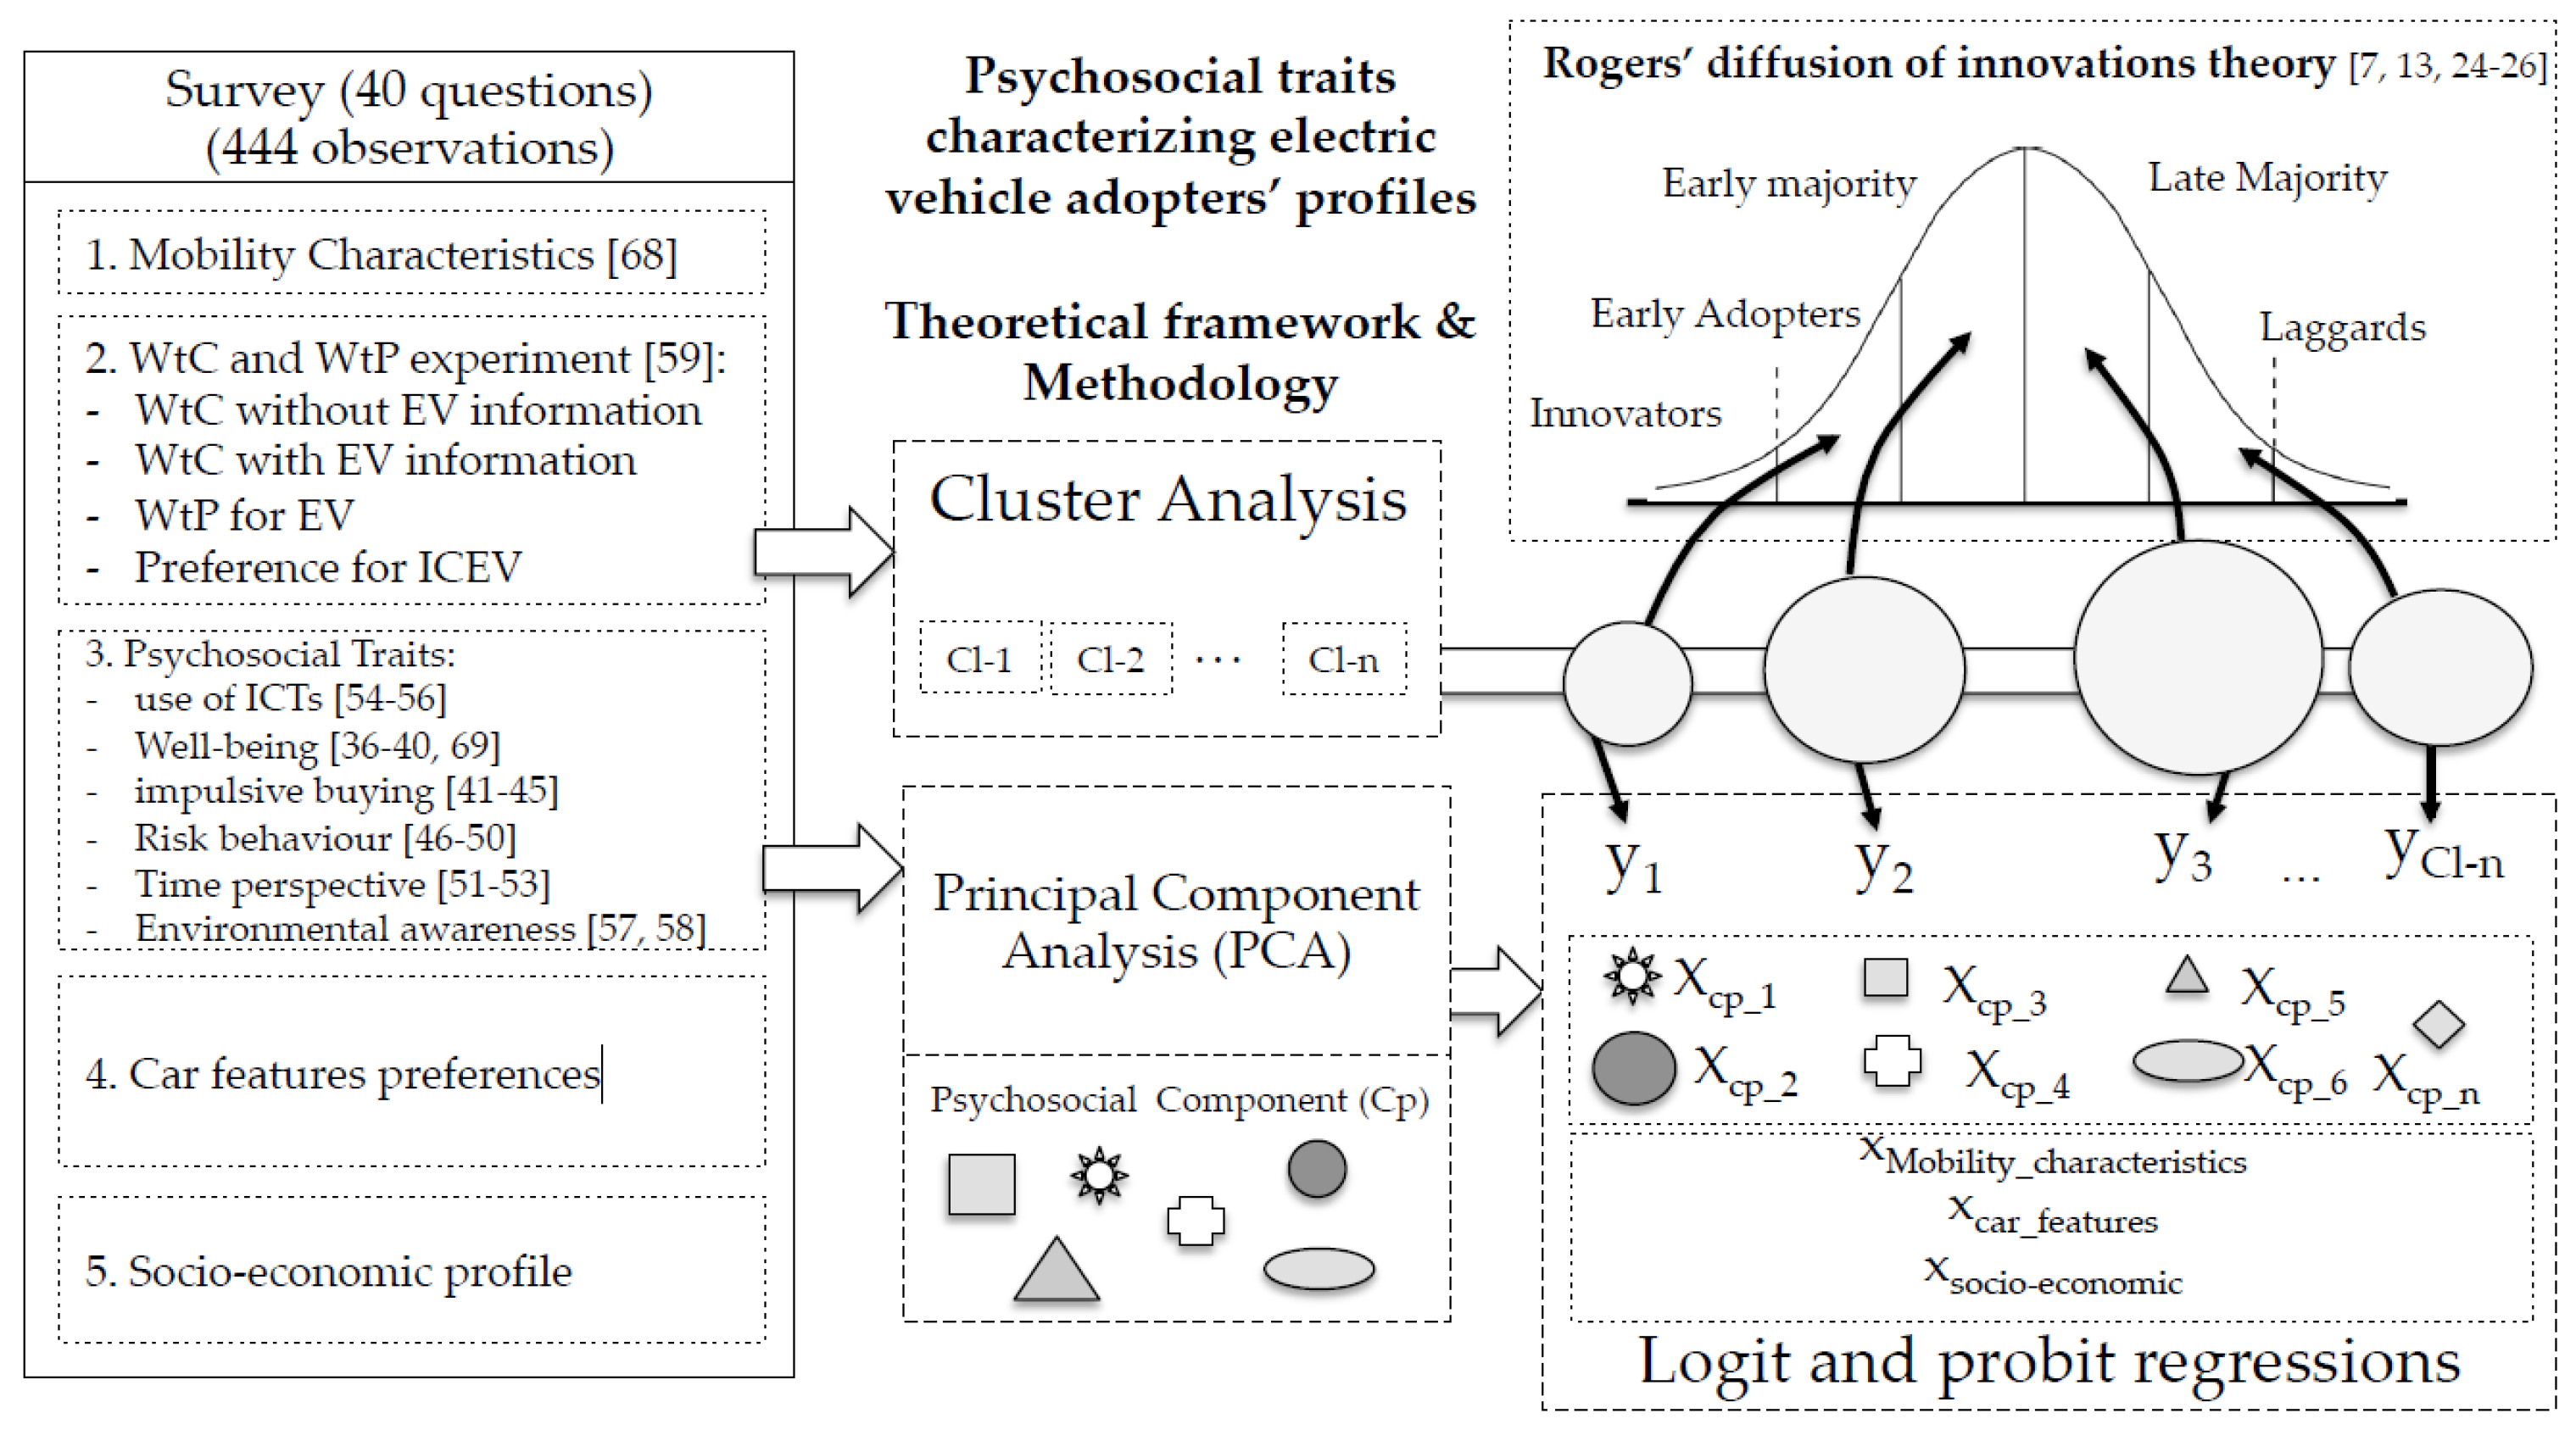
2. Theoretical Framework
- Subjective well-being, whose influence on economic decisions has been established in several studies [35,36]. Subjective well-being can be understood as satisfaction with life as a whole and with specific areas of life (work, money, family, and social) and approached, following Diener and Lucas [37], through satisfaction, which we can assess in three dimensions: psychological, social, and physical [38,39,40].
- Compulsive buying, understood in terms of non-planned buying [41], emotional buying [42] or chronic and repetitive buying behavior [43]. Other authors have analyzed the weight of social determinants in compulsive buying, highlighting the symbolic meaning of purchased products in order to conform a positive social identity [44,45].
- Risk attitude, understood as the personality feature that determines a consumer’s tendency and willingness to take risks. Following Das and Teng [46] and Rohrmann [47], risk-averse consumers will avoid the alternatives that may have results that vary far from their expectations. Other authors argue that tendency to take risk, together with proactivity and innovation, are three psychological features that characterize decision-makers [48,49,50].
- Future time perspective, which, according to Zimbardo and Boyd [51], is the process through which consumers arrange their personal and social experiences in time intervals. Authors highlighted the fact that the time valuation made by consumers is a factor that significantly shapes behavior: future-oriented consumers think about the effects of their future acts, their objectives are clear, and they are ready to tolerate the tensions that achieving their goals may entail [52,53].
- According to Rogers, tendency to buy and use information and communication technologies (ICT) affects the adoption of any kind of innovations entering the market. Rosen et al. [54] produced empirical work showing that the incorporation of variables such as use of social media improves traditional scales measuring technology usage. New technological paradigms and the impact of the adoption of new ICT devices on consumer life habits mean that the scales have to be constantly updated [55,56].
- Increasing environmental awareness has driven growing demand for environmentally-friendly products such as EVs. Ham et al. [57], analyzed and discussed the main results of the measurement of consumers’ environmental awareness and commitment. Likewise, Culiberg and Rojšek [58] stressed the importance of studying the connection that exists between environmental awareness and degree of adoption of new technologies.
3. Methodology
3.1. Survey
- Mobility Characteristics (Q1–Q3)
- Willingness to change and willingness pay for the EV (Q4–Q9)
- Psychosocial traits (Q10–Q27)
- Car feature preferences (Q28–Q35)
- Socio-economic profile (Q35–Q40)
- EVs pollute 95% less locally
- EVs cost 85% less in fuel
- EVs do not produce noise
- EVs have 25% higher acceleration
- EVS cost approximately 60% less in maintenance
- EVs have between 150–200 km autonomy under the island’s orographic and climate conditions.
- Charging time is 3–6 h for a basic charge (usual residence) and 30–60 min for a quick charge.
- Three questions addressed the use and purchase of ICTs according to Rosen and coworkers’ [54] Media and Technology Usage and Attitudes Scale (MTUAS). The questions were on assiduity with acquiring technological novelties (Q10); possession and use of accounts in social networks (Q11); and possession of home electronics devices with Internet access (Q12).
- The cognitive aspects of well-being were evaluated through an adapted version of LISAT-8 (Fulg–Meyer’s Life Satisfaction survey) [69]. This scale measures three essential aspects of life (family, social, work and money). Three questions were included to evaluate work and money situation (Q13); family and social life (Q14); and achievement of goals in life (Q15).
- Following the scale proposed by Valence et al. [45], three questions were included to evaluate impulsive buying: degree of impulsiveness when replacing the vehicle (Q16); buyer’s remorse (Q17); and analysis of market alternatives (Q18).
- The consumer’s propensity and willingness to take risks was approached via three questions adapted from a short version of Rohrmann’s Risk Orientation Questionnaire [47]: tendency to imagine unfavorable situations from their actions (Q19); self-perception of the degree of risk from their actions (Q20); and evaluation of the consequences from their actions (Q21).
- An adaptation of the Time Perspective Inventory by Zimbardo and Boyd [51] was used to consider the consumer’s attitude towards future time preferences. Three questions were included polling inability to change the future with present actions (Q22); work hard to achieve goals in life (Q23); and sacrifice present well-being for future well-being (Q24).
- Finally, to complete the block of psychosocial questions, and following Ham et al. [57], three questions were included on environmental awareness: knowledge on the effects of greenhouse gas emissions from energy consumption (Q25); willingness to buy low-energy-consumption devices (Q26); and commitment to rational use of energy (Q27).
- Design and aesthetics both interior and exterior
- Low emissions level and low fuel consumption
- Functional, versatile, and adaptable to daily use needs
- Connectivity with devices and advanced technological equipment
- Excellent quality-to-price ratio
- High reliability and low maintenance
- A unique driving experience offered by a renowned automaker.
3.2. Data Collection
4. Results
4.1. Psycho-Sociological Components
- Cp-1.
- Predisposition to new technologies. Ownership of a higher number of ICT devices (Q12), active use of social media (Q11), and regular acquisition of the latest technologies (Q10).
- Cp-2.
- Environmental awareness. Commitment to buy energy-efficient products (Q26) and use energy rationally (Q27).
- Cp-3.
- Subjective well-being. Well-being through satisfaction with work and money (Q13) and achievement of goals set by the individuals (Q15).
- Cp-4.
- Predisposition to change vehicles. The need to urgently replace the vehicle when financing is available (Q16), individual priority to purchase the desired vehicle (Q23), and awareness of the impact of emissions on the environment (Q25).
- Cp-5.
- Future hedonistic. The individuals plan actions that allow them to experience future pleasure, showing a positive attitude towards it (Q22), and a willingness to sacrifice current well-being for future well-being (Q24).
- Cp-6.
- Aversion to risk. The individual cognitively evaluates the consequences of his/her decisions (Q21) and imagines unfavorable situations from them (Q19).
- Cp-7.
- Propensity to impulsiveness. Shows a tendency to make purchases without rational analysis on the future consequences of the actions (Q23), and activation of emotional conflict producing a feeling of guilt (Q17).
- Cp-8.
- Satisfaction with family and social life. Expresses the degree of satisfaction with affective relations, both with family and other social relations (Q14).
- Cp-9.
- Reflexive behavior. A reflexive behavior is where the individual cautiously learns and evaluates the features of the product in the market (Q18), thus reducing the uncertainty in the purchasing process (Q20).
4.2. Cluster Analysis
- The individuals of Cl-1 and Cl-2, who represent 32.4% of the sample, are willing to switch to an EV without receiving specific information on EV characteristics (Q8). In addition, individuals of Cl-1 would be willing to pay €34,739 on average for an EV (Q12).
- The individuals of Cl-3 and Cl-4, who represent 16.7% of the sample, would only adopt this type of technology after receiving basic information about EVs (Q9). Moreover, Cl-3 individuals would be willing to pay €39,125 on average for an EV.
- Most individuals of Cl-5 and Cl-6, who represent 50.9% of the sample, would not buy an EV as they prefer a conventional vehicle (56% in Cl-5 and 78% in Cl-6). Some of them would actually be willing to pay less for an EV (33.41% in Cl-5 and 40.37% in Cl-6), whereas others would acquire an EV if its price was lower than the ICEV (Q11).
4.3. The Determinants of the Clusters
- Cl-1.
- Show a high degree of impulsiveness and low reflexive behavior. Moreover, they are inclined to acquire technological innovations and show strong environment consciousness. In contrast, mobility routines, car features and socio-economic variables appear non-significant impacts.
- Cl-2.
- Show a lower degree of impulsiveness than members of Cl-1. They require less kilometers of range given their mobility routines, and have a high economic status, whereas car features are still non-significant in this cluster.
- Cl-3.
- Show a good predisposition to new technologies, as well as environmental consciousness. They are individuals who take risks, but under a reflexive behavior. They are not very impulsive, and so do not have any imperative need to change vehicles. They live outside the urban areas, drive many kilometers daily, but do not require a huge range. They show a preference for top-end vehicles—medium, large, and luxury segment—and look for versatility, reliability and a good quality-to-price ratio. Overall, they are men of advanced age and education.
- Cl-4.
- Members are not risk-averse, have a high subjective well-being, and do not drive many kilometers, but they do need versatility and adaptability in a vehicle. In terms of socio-economic features, they are usually self-employed and do not have children.
- Cl-5.
- Show a high aversion to risk and no predisposition to new technological innovations. In terms of mobility routines, these are individuals who live in rural areas and require a higher range in their vehicle. In terms of car features, they are not loyal to any one automaker. No relevant socio-economic factors emerge.
- Cl-6.
- The individuals in this cluster are not impulsive. They seek versatility, interior and exterior design, and a unique driving experience in a vehicle. For that reason, they show a certain loyalty to prestigious makes. They also target vehicles within the all-terrain vehicles segment, i.e., SUV, crossover, pick-up, and van. In terms of educational attainment, non-university-educated individuals predominate.
4.4. The EV Innovation Adopters
5. Conclusions
- Early adopters (6.98%) show two clear psychosocial profiles. Both groups stand out for their high WtP for EVs, and may be the first candidates for buying an EV. The first (5.18%) stands out as having a tendency to a behavior that is impulsive, not reflective, and guided by emotions and feelings, whereas the second group (1.8%) has a more reflective behavior but with a certain predisposition to risk. Due to their willingness to pay, both types of individuals could buy premium-class vehicles.
- The first group of early adopters must be the target of marketing campaigns that provoke satisfaction in the purchase through specific promotions that highlight the innovative aspect of the EV technology. To attract the individuals of the second group, it is very important to let them know the characteristics of the vehicle so that they can take the purchase decision. In this case, the information should be provided by both companies and public administrations.
- However, the early majority group is the one that should be paid more attention because it supposes 42.11% of the market; at the same time, it is possible to attract them to buy an EV: these individuals are predisposed to buy an EV and have an intermediate WtP, but not enough to acquire an EV in the current market. For this reason, price discounts and the existence of medium-class EVs would allow that these consumers could acquire the product.
- There are also two profiles in this group that differ from each other, similar to the case of the early adopters: the first one (27.25%) is more impulsive while the second one (14.85%) takes the decision to buy when receiving the information. For this reason, the marketing campaigns that encourage impulse buying for the first case, and the disclosure of the characteristics of the EV highlighting its environmental benefits are fundamental for the sale of the product in this segment of the market.
- Individuals in the late majority group (37.39%) stand out as having a certain aversion to risk, a lower degree of impulsivity, and reject the adoption of innovations. These individuals would not acquire an EV until the earlier adopters have penetrated the market.
- Laggards (13.51% of the sample) show a preference towards conventional vehicles for reasons qualified as “taste”, and categorically refuse to change for an EV. They stand out as lending high importance to vehicle attributes (design, versatility, driving experience and prestige), which differentiates them from all the other groups.
Supplementary Materials
Author Contributions
Acknowledgments
Conflicts of Interest
Appendix A. Survey
| Questionnaire code: |
| 1. Own a vehicle, or have a vehicle available and use it assiduously | |
| 2. Hold a valid car driver’s license | |
| 3. Intend to acquire a new vehicle before 2021 |
| Adeje | Granadilla de Abona | Puerto de la Cruz | |||
| Arafo | Guía de Isora | San Cristóbal La Laguna | |||
| Arico | Güimar | San Miguel de Abona | |||
| Arona | Icod de los Vinos | San Juan de la Rambla | |||
| Buenavista del Norte | La Guancha | Santa Cruz de Tenerife | |||
| Candelaria | La Matanza | Santa Úrsula | |||
| El Rosario | La Orotava | Santiago del Teide | |||
| El Sauzal | La Victoria | Tacoronte | |||
| El tanque | Los Realejos | Tegueste | |||
| Fasnia | Los Silos | Vilaflor | |||
| Garachico |
| A. | Weekday | B. | Weekend |
| Less than 10 km | Less than 10 km | ||
| Between 11 and 20 km | Between 11 and 20 km | ||
| Between 21 and 40 km | Between 21 and 40 km | ||
| Between 41 and 60 km | Between 41 and 60 km | ||
| Between 61 and 80 km | Between 61 and 80 km | ||
| Between 81 and 100 km | Between 81 and 100 km | ||
| More than 100 km | More than 100 km |
| Kilometers |
| Euros |
| Yes, I would pay more or the same for an electric vehicle to replace my conventional car. | |
| No, I prefer a conventional vehicle. |
| Yes, I would pay more or the same for an equivalent electric vehicle to replace my conventional car. | |
| No, I would prefer a conventional vehicle. |
| Complex charging system | |
| Serious doubts over the maturity of the electric vehicle technology | |
| Does not have sufficient range to cover my mobility routines | |
| Matter of individual preferences | |
| Other: |
| I’d never buy an electric vehicle | |
| I would buy for 10% less | |
| I would buy for 20% less | |
| I would buy for 30% less | |
| I would buy for 40% less | |
| I would buy for 50% less |
| Only for the respondents who say YES, I would pay more or the same for an equivalent electric vehicle to replace my conventional car (Q6) | |
| Q9. Considering the attributes and the assumptions described above, what is the most you would be willing to pay for an electric vehicle compared with the price of your preferred conventional vehicle? | |
| Euros | |
| A. Predisposition to technological innovations | 1 | 2 | 3 | 4 | 5 | 6 | 7 |
| Q10. You would say that you assiduously acquire technological novelties as soon as they go on the market. | |||||||
| Q11. You would say that you have numerous accounts on social networks and actively use them. | |||||||
| Q12. You have a large number of electronic communication and information devices with access to internet (Smartphone, Smart TV, computer, gaming console, Smartwach, etc.) |
| B. Degree of well-being | 1 | 2 | 3 | 4 | 5 | 6 | 7 |
| Q13. Your work and money situation is satisfactory | |||||||
| Q14. Your family and social relationships are satisfactory | |||||||
| Q15. You achieve the goals and dreams that you set in your life |
| C. Impulsive behaviour | 1 | 2 | 3 | 4 | 5 | 6 | 7 |
| Q16. When you have enough money saved up to buy a new vehicle, do you feel an urgent need to renew the old one? | |||||||
| Q17. After acquiring a vehicle, you wonder whether you made the right decision. | |||||||
| Q18. When you decide to buy a vehicle, you take your time to learn and evaluate the technical characteristics of each one on option and you compare a series of models or technologies. |
| D. Tendency to take risk | 1 | 2 | 3 | 4 | 5 | 6 | 7 |
| Q19. You tend to imagine your actions have unfavourable results. | |||||||
| Q20. You would say that you are a person who likes to take risks in the acts, investments or expenses that you make. | |||||||
| Q21. You would say that your behaviour is influenced by the immediate consequences of your actions. |
| E. Time preference | 1 | 2 | 3 | 4 | 5 | 6 | 7 |
| Q22. It’s not worth worrying about the future, because there’s nothing you can do about it. | |||||||
| Q23. When you want to buy the vehicle I want, I set it as a goal and work hard to acquire it. | |||||||
| Q24. You would readily sacrifice your current welfare to have a more prosperous future. |
| F. Awareness of the environment | 1 | 2 | 3 | 4 | 5 | 6 | 7 |
| Q25. You are fully aware of the greenhouse gas emissions caused when producing the electric energy you usually use. | |||||||
| Q26. When you acquire electrical and electronic equipment, you look as closely as possible at their energy efficiency (appliances, light bulbs, etc.) | |||||||
| Q27. You make rational use of electrical energy and you drive in the most efficient way possible. |
| Loyalty (from 1 to 7, where 1 means you totally agree and 7 means you totally disagree with the assertions presented). | 1 | 2 | 3 | 4 | 5 | 6 | 7 |
| Q28. You have total confidence in and loyalty to a specific brand of automobiles when you are going to purchase a vehicle. |
| No brand preferences | Hyundai | Peugeot | |||
| Alfa Romeo | Jaguar | Renault | |||
| Audi | Kia | Seat | |||
| BMW | Land Rover | Skoda | |||
| Citroën | Mazda | Smart | |||
| Dacia | Mercedes | Toyota | |||
| Fiat | Mitsubishi | Volkswagen | |||
| Ford | Nissan | Volvo | |||
| Honda | Opel | Other automaker not listed here |
| Design and aesthetics, both inside and outside. | |
| Low emissions level and low fuel consumption. | |
| Utilitarian, versatile and adaptable to the needs of daily use. | |
| Connectivity with devices and advanced technological equipment. | |
| Excellent price-performance ratio | |
| Reliability and low maintenance. | |
| Unique driving experience and prestige brand. |
| Model | Segment |
| Model | Segment |
| Male | |
| Female |
| Primary education | |
| Secondary education | |
| Sixth form | |
| University |
| Student | |
| Self-employed | |
| Paid-employed | |
| Retired | |
| Unemployed | |
| Other |
| Less than €8000 per year | |
| Between €8001 and €16,000 per year | |
| Between €16,001 and €22,000 per year | |
| Between €22,001 and €35,000 per year | |
| More than €35,000 per year |
Appendix B. Descriptive Results of Clusters

| Categorical Var. | Question | Sample | Cl-1 | Cl-2 | Cl-3 | Cl-4 | Cl-5 | Cl-6 |
|---|---|---|---|---|---|---|---|---|
| Number of individuals | 444 | 23 | 121 | 8 | 66 | 161 | 60 | |
| Cluster share | 100% | 5.18% | 27.25% | 1.80% | 14.86% | 37.39% | 13.51% | |
| Mobility routines var. | ||||||||
| Residence zone | (Q1) | |||||||
| Urban | 43.02 | 47.83 | 48.76 | 37.50 | 48.48 | 36.14 | 43.33 | |
| Rural | 56.98 | 52.17 | 51.24 | 62.5 | 51.52 | 63.86 | 56.67 | |
| WtC and WtP var. | ||||||||
| WtP for an EV | (Q8) | |||||||
| Yes, I would pay more | 33.56 | 100 | 100 | 0 | 0 | 3.01 | 0 | |
| No, I would pay less/not pay | 66.44 | 0 | 0 | 100 | 100 | 96.99 | 100 | |
| WtC to an EV (with info) | (Q9) | |||||||
| Yes, I pay more | 49.10 | 100 | 100 | 100 | 100 | 0 | 0 | |
| No, I pay less/not pay | 50.90 | 0 | 0 | 0 | 0 | 100 | 100 | |
| Never buy an EV | (Q11) | 31.53 | 0 | 0 | 0 | 0 | 56.02 | 78.33 |
| Car features var. | ||||||||
| Size of the new car | (Q5) | |||||||
| Small segment | 13.74 | 13.04 | 15.70 | 25.00 | 10.61 | 13.86 | 11.67 | |
| Compact segment | 22.07 | 13.04 | 19.01 | 0.00 | 30.30 | 25.90 | 15.00 | |
| SUV segment | 31.08 | 39.13 | 26.45 | 37.50 | 28.79 | 29.52 | 43.33 | |
| Large segment | 10.59 | 17.39 | 13.22 | 12.50 | 10.61 | 9.64 | 5.00 | |
| Socio-economic var. | ||||||||
| Age | (Q38) | |||||||
| Gen Y | 42.79 | 39.13 | 41.32 | 37.50 | 45.45 | 43.98 | 41.67 | |
| Gen X | 52.03 | 56.52 | 51.24 | 37.50 | 50.00 | 53.61 | 51.67 | |
| Gender | (Q39) | |||||||
| Male | 51.35 | 65.22 | 52.07 | 62.50 | 42.42 | 51.81 | 51.67 | |
| Female | 48.65 | 34.78 | 47.93 | 37.50 | 57.58 | 48.19 | 48.33 | |
| University education | (Q40) | 44.14 | 47.83 | 48.76 | 62.50 | 39.39 | 46.99 | 28.33 |
| Children | (Q41) | 57.43 | 60.87 | 61.98 | 50.00 | 50.00 | 54.22 | 65.00 |
| Job | (Q42) | |||||||
| Self-employed | 8.33 | 4.35 | 6.61 | 0.00 | 15.15 | 7.83 | 8.33 | |
| Paid-employed | 77.03 | 82.61 | 76.86 | 75.00 | 69.70 | 80.12 | 75.00 |
| Continuous Var. 2 | Question | Sample | Cl-1 | Cl-2 | Cl-3 | Cl-4 | Cl-5 | Cl-6 |
|---|---|---|---|---|---|---|---|---|
| Number of individuals | 444 | 23 | 121 | 8 | 66 | 161 | 60 | |
| Cluster share | 100% | 5.18% | 27.25% | 1.80% | 14.86% | 37.39% | 13.51% | |
| Mobility Routines var. | ||||||||
| Kilometers covered per week (KCW). | (Q2) | 273.30 | 318.32 | 266.76 | 294.61 | 221.07 | 292.53 | 270.62 |
| Minimum range required (MRR) | (Q3) | 419.46 | 390.87 | 388.92 | 412.50 | 327.12 | 483.30 | 417.91 |
| WtC and WtP var. | ||||||||
| WtP for a new car (€) | (Q6) | 17,438 | 30,826 | 14,508 | 32,750 | 14,598 | 17,403 | 19,391 |
| WtP for an EV (€) | (Q12) | 11,118 | 34,739 | 16,815 | 39,125 | 16.588 | 3350 | 2312 |
| Psychosocial var. | ||||||||
| Pred. new technologies | PCA | 3.623 | 4.856 | 3.635 | 3.842 | 3.577 | 3.390 | 3.790 |
| Environmental awareness. | PCA | 4.814 | 5.419 | 4.812 | 5.108 | 4.978 | 4.699 | 4.442 |
| Subjective well-being | PCA | 4.383 | 4.809 | 4.497 | 4.555 | 4.135 | 4.309 | 3.484 |
| Pred. change vehicle | PCA | 3.507 | 4.200 | 3.472 | 3.171 | 3.492 | 3.466 | 3.484 |
| Future hedonistic | PCA | 4.131 | 4.433 | 4.114 | 4.029 | 3.989 | 4.204 | 4.012 |
| Aversion to risk | PCA | 3.569 | 3.624 | 3.495 | 2.508 | 3.236 | 3.813 | 3.530 |
| Tendency to impulsiveness | PCA | 3.492 | 4.368 | 3.814 | 2.799 | 3.390 | 3.362 | 3.069 |
| Satisfaction with family and social life | PCA | 4.884 | 4.904 | 4.830 | 4.866 | 4.806 | 4.945 | 4.899 |
| Reflexive behavior | PCA | 4.938 | 4.634 | 4.924 | 5.636 | 4.901 | 5.026 | 4.782 |
| Car features var. | ||||||||
| Brand-loyalty | (Q34) | 3.856 | 4.174 | 3.843 | 4.625 | 4.166 | 3.500 | 4.300 |
| Car design | (Q37a) | 3.782 | 3.783 | 3.744 | 3.125 | 4.015 | 3.704 | 3.900 |
| Emissions/consumption | (Q37b) | 4.489 | 4.391 | 4.736 | 4.750 | 4.515 | 4.379 | 4.266 |
| Versatility/adaptability | (Q37c) | 4.427 | 4.000 | 4.554 | 5.625 | 3.969 | 4.385 | 4.800 |
| Technologically advanced | (Q37d) | 3.074 | 3.304 | 3.033 | 2.500 | 3.166 | 3.090 | 3.000 |
| Price-performance | (Q37e) | 4.677 | 4.391 | 4.736 | 5.125 | 4.772 | 4.704 | 4.433 |
| Maintenance/reliability | (Q37f) | 4.518 | 4.478 | 4.380 | 4.875 | 4.590 | 4.626 | 4.383 |
| Drive experience/prestige | (Q37f) | 3.024 | 3.652 | 2.835 | 2.000 | 2.984 | 3.066 | 3.233 |
| Cars in household | (Q46) | 2.21 | 2.26 | 2.23 | 2.37 | 2.24 | 2.18 | 2.18 |
| Age of current car | (Q47) | 11.21 | 11.95 | 11.11 | 14.12 | 11.18 | 11.04 | 11.25 |
| Socio-economic var. | ||||||||
| Age | (Q38) | 40.69 | 41.43 | 41.61 | 46.50 | 40.60 | 39.59 | 40.95 |
| Income | (Q48) | 17,101 | 19,956 | 18,933 | 17,687 | 15,977 | 16,403 | 15,400 |
References
- IEA World Energy Outlook 2016 (Executive Summary). World Energy Outlook. 2016, 1–8. Available online: http://www.iea.org/publications/freepublications/publication/WEB_WorldEnergyOutlook2015ExecutiveSummaryEnglishFinal.pdf (accessed on 13 June 2018).
- Gobierno de Canarias. Anuario Energetico de Canarias 2015; Gobierno de Canarias: Santa Cruz de Tenerife, España, 2015. [Google Scholar]
- Marrero, G.A.; Ramos-Real, F.J. Electricity generation cost in isolated system: The complementarities of natural gas and renewables in the Canary Islands. Renew. Sustain. Energy Rev. 2010, 14, 2808–2818. [Google Scholar] [CrossRef]
- Díaz, A.R.; Ramos-Real, F.J.; Marrero, G.A.; Perez, Y. Impact of Electric Vehicles as Distributed Energy Storage in Isolated Systems: The Case of Tenerife. Sustainability 2015, 7, 15152–15178. [Google Scholar] [CrossRef] [Green Version]
- Ramirez-Diaz, A.; Ramos-Real, F.J.; Marrero, G.A. Complementarity of electric vehicles and pumped-hydro as energy storage in small isolated energy systems: Case of La Palma, Canary Islands. J. Mod. Power Syst. Clean Energy 2016, 4, 604–614. [Google Scholar] [CrossRef]
- Plötz, P.; Schneider, U.; Globisch, J.; Dütschke, E. Who will buy electric vehicles? Identifying early adopters in Germany. Transp. Res. Part A Policy Pract. 2014, 67, 96–109. [Google Scholar] [CrossRef]
- Rogers, E.M. Diffusion of Innovations; Simon and Schuster: New York, NY, USA, 2003; ISBN 0028740742. [Google Scholar]
- McDonald, W.J. Psychological associations with shopping: A moderator variable perspective. Psychol. Mark. 1994, 11, 549–568. [Google Scholar] [CrossRef]
- Dittmar, H. Compulsive buying—A growing concern? An examination of gender, age, and endorsement of materialistic values as predictors. Br. J. Psychol. 2005, 96, 467–491. [Google Scholar] [CrossRef] [PubMed]
- Thiel, C.; Alemanno, A.; Scarcella, G. Attitude of European car drivers towards electric vehicles: A survey. JRC Rep. 2012. [Google Scholar] [CrossRef]
- Carson, R.T.; Hanemann, W.M. Chapter 17 Contingent Valuation. In Handbook of Environmental Economics; FAO: Rome, Italy, 2005; Volume 2, pp. 821–936. [Google Scholar]
- Morimoto, M. Which is the First Electric Vehicle? Electr. Eng. Jpn. 2015, 192, 31–38. [Google Scholar] [CrossRef]
- Beeton, D.; Meyer, G. Electric Vehicle Business Models; Springer: Heidelberg, Germany, 2014; ISBN 978-3-31-912243-4. [Google Scholar]
- Weiller, C.; Shang, A.; Neely, A.; Shi, Y. Competing and Co-existing Business Models for EV: Lessons from International Case Studies. In Proceedings of the 2013 World Electric Vehicle Symposium and Exhibition (EVS27), Barcelona, Spain, 17–20 November 2013; pp. 1–12. [Google Scholar]
- Bohnsack, R.; Pinkse, J.; Kolk, A. Business models for sustainable technologies: Exploring business model evolution in the case of electric vehicles. Res. Policy 2014, 43, 284–300. [Google Scholar] [CrossRef] [Green Version]
- Hidrue, M.K.; Parsons, G.R. Is there a near-term market for vehicle-to-grid electric vehicles? Appl. Energy 2015, 151, 67–76. [Google Scholar] [CrossRef] [Green Version]
- Sioshansi, R.; Denholm, P. The Value of Plug-In Hybrid Electric Vehicles as Grid Resources. Energy J. 2010, 31, 1–23. [Google Scholar] [CrossRef]
- Hosseini, S.S.; Badri, A.; Parvania, M. A survey on mobile energy storage systems (MESS): Applications, challenges and solutions. Renew. Sustain. Energy Rev. 2014, 40, 161–170. [Google Scholar] [CrossRef]
- Borne, O.; Korte, K.; Perez, Y.; Petit, M.; Purkus, A. Barriers to entry in frequency-regulation services markets: Review of the status quo and options for improvements. Renew. Sustain. Energy Rev. 2018, 81, 605–614. [Google Scholar] [CrossRef]
- Kong, D.Y.; Bi, X.H. Impact of social network and business model on innovation diffusion of electric vehicles in China. Math. Probl. Eng. 2014, 2014, 230765. [Google Scholar] [CrossRef]
- Brown, B.; Drew, M.; Erenguc, C.; Hill, R.; Schmith, S.; Gangula, B. Global Automotive Consumer Study. Exploring Consumers’ Mobility Choices and Transportation Decisions; Deloitte: New York, NY, USA, 2014; pp. 1–28. [Google Scholar]
- Pinkse, J.; Bohnsack, R.; Kolk, A. The role of public and private protection in disruptive innovation: The automotive industry and the emergence of low-emission vehicles. J. Prod. Innov. Manag. 2014, 31, 43–60. [Google Scholar] [CrossRef]
- Christensen, C.M. The Innovator’s Dilemma: When New Technologies Cause Great Firms to Fail; Harvard Business Press: Boston, MA, USA, 1997. [Google Scholar]
- Medlin, B.D. The Factors may Influence a Faulty Member’s Decision to Adopt Eletronic Technologies in Instruction. Ph.D. Thesis, Virginia Polytechnic Institute and State University, Blacksburg, VA, USA, 2001. [Google Scholar]
- Erdem, C.; Şentürk, I.; Şimşek, T. Identifying the factors affecting the willingness to pay for fuel-efficient vehicles in Turkey: A case of hybrids. Energy Policy 2010, 38, 3038–3043. [Google Scholar] [CrossRef]
- Rezvani, Z.; Jansson, J.; Bodin, J. Advances in consumer electric vehicle adoption research: A review and research agenda. Transp. Res. Part D Transp. Environ. 2015, 34, 122–136. [Google Scholar] [CrossRef]
- Hidrue, M.K.; Parsons, G.R.; Kempton, W.; Gardner, M.P. Willingness to pay for electric vehicles and their attributes. Resour. Energy Econ. 2011, 33, 686–705. [Google Scholar] [CrossRef]
- Tanaka, M.; Ida, T.; Murakami, K.; Friedman, L. Consumer’s willingness to pay for alternative fuel vehicles: Comparative analysis between US and Japan. Transp. Res. Part A 2013, 70, 1–36. [Google Scholar] [CrossRef]
- Ramos-Real, F.J.; Ramírez-Díaz, A.; Marrero, G.A.; Perez, Y. Willingness to Pay for the EV and Their Attributes. In Proceedings of the International Conference on Electromobility: Challenging Issues, Singapore, 1–4 December 2015. [Google Scholar]
- Nayum, A.; Klöckner, C.A.; Mehmetoglu, M. Comparison of socio-psychological characteristics of conventional and battery electric car buyers. Travel Behav. Soc. 2016, 3, 8–20. [Google Scholar] [CrossRef]
- Van Raaij, W.F. Economic psychology. J. Econ. Psychol. 1981, 1, 1–24. [Google Scholar] [CrossRef]
- Katona, G. Psychological Economics; Elsevier: New York, NY, USA, 1975; ISBN 0444990038. [Google Scholar]
- Maital, S. Minds, Markets, and Money: Psychological Foundations of Economic Behavior; Basic Books: New York, NY, USA, 1982; ISBN 0465046231. [Google Scholar]
- Ortega, V.; Rodríguez-Vargas, J.C. Escala de Hábitos y Conductas de Consumo: Propiedades psicométricas. Int. J. Clin. Health Psychol. 2004, 4, 121–136. [Google Scholar]
- Ajzen, I.; Fishbein, M. Attitudes and the Attitude-Behavior Relation: Reasoned and Automatic Processes. Eur. Rev. Soc. Psychol. 2000, 11, 1–33. [Google Scholar] [CrossRef]
- Diener, E.; Emmons, R.A.; Larsen, R.J.; Griffin, S. The Satisfaction with Life Scale. J. Personal. Assess. 1985, 49, 71–75. [Google Scholar] [CrossRef] [PubMed]
- Diener, E.; Lucas, R.E. Personality and subjective well-being. In Well-Being: The Foundations of Hedonic Psychology; Russell Sage Foundation: New York, NY, USA, 1999; pp. 213–229. ISBN 0-87154-424-5. [Google Scholar]
- Arnold, S.B. Measurement of Quality of Life in the Frail Elderly. In The Concept and Measurement of Quality of Life in the Frail Elderly; Elsevier: New York, NY, USA, 1991; pp. 50–73. ISBN 978-0-12-101275-5. [Google Scholar]
- Kaplan, R.M.; Anderson, J.P. The General Health Policy Model: An Integrated Approach. In Quality of Life and Pharnlacoeconotnic in Clinical; Spilker, B., Ed.; Lippincont-Raven Publisher: Philadelphia, PA, USA, 1996. [Google Scholar]
- Reig, A. Quality of life. In Encyclopedia of Psychological Assessment; Sage: London, UK, 2003; pp. 800–8005. [Google Scholar]
- Stern, H. The Significance of Impulse Buying Today. J. Mark. 1962, 26, 59–62. [Google Scholar] [CrossRef]
- Fisher, D.W.; Rook Robert, J. Normative Influences on Impulsive Buying Behavior. J. Consum. Res. 1995, 22, 305–313. [Google Scholar] [CrossRef]
- Loudon, D.L.; Della Bitta, A.J. Consumer Behavior Concepts and Applications; McGraw-Hill: New York, NY, USA, 1979. [Google Scholar]
- Beattie, L. Consuming Television. Sociology 1997, 31, 829–831. [Google Scholar] [CrossRef]
- Valence, G.; D’Astous, A.; Fortier, L. Compulsive buying: Concept and measurement. J. Consum. Policy 1988, 11, 419–433. [Google Scholar] [CrossRef]
- Das, T.K.; Teng, B.S. Time and Entrepreneurial Risk Behavior. Entrep. Theory Pract. 1998, 22, 69–88. [Google Scholar] [CrossRef]
- Rohrmann, B. Risk Attitude Scales: Concepts, Questionnaires, Utilizations; University of Melbourne: Melbourne, Australia, 2005; p. 21. [Google Scholar]
- Covin, J.G.; Slevin, D.P. Strategic management of small firms in hostile and benign environments. Strateg. Manag. J. 1989, 10, 75–87. [Google Scholar] [CrossRef]
- Kamineni, R. Who is an entrepreneur? A review. Small Enterp. Res. 2002, 10, 88–99. [Google Scholar] [CrossRef]
- Kobia, M.; Sikalieh, D. Towards a search for the meaning of entrepreneurship. J. Eur. Ind. Train. 2010, 34, 110–127. [Google Scholar] [CrossRef]
- Zimbardo, P.G.; Boyd, J.N. Putting time in perspective: A valid, reliable individual-differences metric. J. Personal. Soc. Psychol. 1999, 77, 1271–1288. [Google Scholar] [CrossRef]
- Lang, F.R.; Carstensen, L.L. Time counts: Future time perspective, goals, and social relationships. Psychol. Aging 2002, 17, 125–139. [Google Scholar] [CrossRef] [PubMed]
- Stouthard, M.E.A.; Peetsma, T.T.D. Future-Time Perspective: Analysis of a Facet-Designed Questionnaire. Eur. J. Psychol. Assess. 1999, 15, 99–105. [Google Scholar] [CrossRef]
- Rosen, L.D.; Whaling, K.; Carrier, L.M.; Cheever, N.A.; Rokkum, J. The Media and Technology Usage and Attitudes Scale: An empirical investigation. Comput. Hum. Behav. 2013, 29, 2501–2511. [Google Scholar] [CrossRef] [Green Version]
- Venkatesh, V.; Thong, J.; Xu, X. Consumer acceptance and user of information technology: Extending the unified theory of acceptance and use of technology. MIS Q. 2012, 36, 157–178. [Google Scholar] [CrossRef]
- Jenkins-Guarnieri, M.A.; Wright, S.L.; Hudiburgh, L.M. The relationships among attachment style, personality traits, interpersonal competency, and Facebook use. J. Appl. Dev. Psychol. 2012, 33, 294–301. [Google Scholar] [CrossRef]
- Ham, M.; Horvat, M.; Mrčela, D. Insights for Measuring Environmental Awareness. Ekon. Vjesn. 2016, 29, 159–176. [Google Scholar]
- Culiberg, B.; Rojšek, I. Understanding Environmental Consciousness: A Multidimensional Per-spective. In Vrijednost za Potrošače u Dinamičnom Okruženju; Grbac, B., Meler, M., Eds.; Ekonomski fakultet Sveučilišta u Rijeci: Rijeka, Croatia, 2008; pp. 131–139. ISBN 978-9-53-614873-8. [Google Scholar]
- Carson, R.T. Contingent Valuation: A User’s Guide. Environ. Sci. Technol. 2000, 34, 1413–1418. [Google Scholar] [CrossRef]
- Larson, P.D.; Viáfara, J.; Parsons, R.V.; Elias, A. Consumer attitudes about electric cars: Pricing analysis and policy implications. Transp. Res. Part A 2014, 69, 299–314. [Google Scholar] [CrossRef]
- Liao, F.; Molin, E.; van Wee, B. Consumer preferences for electric vehicles: A literature review. Transp. Rev. 2017, 37, 252–275. [Google Scholar] [CrossRef]
- Afifi, A.; May, S.; Clark, V.A. Practical Multivariate Analysis, 5th ed.; CRC: Boca Raton, FL, USA, 2012; ISBN 978-1-43-981680-6. [Google Scholar]
- Bartlett, M.S. The statistical conception of mental factors. Br. J. Psychol. Gen. Sect. 1937, 28, 97–104. [Google Scholar] [CrossRef]
- Kaiser, H.F. An index of factorial simplicity. Psychometrika 1974, 39, 31–36. [Google Scholar] [CrossRef]
- Gentle, J.E.; Kaufman, L.; Rousseuw, P.J. Finding Groups in Data: An Introduction to Cluster Analysis. Biometrics 1991, 47, 788. [Google Scholar] [CrossRef]
- Ward, J.H., Jr. Hierarchical Grouping to Optimize an Objective Function. J. Am. Stat. Assoc. 2012, 58, 236–244. [Google Scholar] [CrossRef]
- Brooks, C. Introductory Econometrics for Finance, 2nd ed.; Cambridge University Press: Cambridge, UK, 2008; ISBN 978-0-52-187306-2. [Google Scholar]
- Franke, T.; Krems, J.F. What drives range preferences in electric vehicle users? Transp. Policy 2013, 30, 56–62. [Google Scholar] [CrossRef]
- Conway, K.; Chaput, M.; Fugl-Meyer, K.S.; Fugl-Meyer, A.K.M. Linguistic validation of the Fugl-Meyer Life Satisfaction Checklist (LiSat 8) into 8 languages. Qual. Life Res. 2000. Available online: https://scireproject.com/outcome-measures/outcome-measure-tool/life-satisfaction-questionnaire-lisat-9-lisat-11/ (accessed on 15 June 2018).
- Dirección General de Tráfico (DGT) Censo de Conductores. Isla de Tenerife. Available online: https://sedeapl.dgt.gob.es/WEB_IEST_CONSULTA/subcategoria.faces (accessed on 13 June 2018).
- Bočkarjova, M.; Rietveld, P.; Knockaert, J.; Steg, L. Dynamic consumer heterogeneity in electric vehicle adoption. Innovation 2014, 3, 4. [Google Scholar]
- Kim, J.; Rasouli, S.; Timmermans, H.; Kim, J.; Rasouli, S.; Timmermans, H. Expanding scope of hybrid choice models allowing for mixture of social influences and latent attitudes: Application to intended purchase of electric cars. Transp. Res. Part A Policy Pract. 2014, 69, 71–85. [Google Scholar] [CrossRef]
- Achtnicht, M. German car buyers’ willingness to pay to reduce CO2 emissions. Clim. Chang. 2012, 113, 679–697. [Google Scholar] [CrossRef]
- Daziano, R.A.; Bolduc, D. Incorporating pro-environmental preferences towards green automobile technologies through a Bayesian hybrid choice model. Transportmetrica 2011, 1–33. [Google Scholar] [CrossRef]
- Kim, J.; Rasouli, S.; Timmermans, H.; Kim, J.; Rasouli, S.; Timmermans, H. Transportation Research. Part A, Policy and Practice; Pergamon Press: Oxford, UK, 1992; Volume 69. [Google Scholar]
- Rasouli, S.; Timmermans, H. Influence of Social Networks on Latent Choice of Electric Cars: A Mixed Logit Specification Using Experimental Design Data. Netw. Spat. Econ. 2016, 16, 99–130. [Google Scholar] [CrossRef]

| Cp-1 | Cp-2 | Cp-3 | Cp-4 | Cp-5 | Cp-6 | Cp-7 | Cp-8 | Cp-9 | Unexplained Variance | |
|---|---|---|---|---|---|---|---|---|---|---|
| Q10 | 0.395 | 0.373 | ||||||||
| Q11 | 0.575 | 0.321 | ||||||||
| Q12 | 0.580 | 0.256 | ||||||||
| Q13 | 0.718 | 0.264 | ||||||||
| Q14 | 0.788 | 0.226 | ||||||||
| Q15 | 0.543 | 0.387 | ||||||||
| Q16 | 0.633 | 0.325 | ||||||||
| Q17 | 0.733 | 0.289 | ||||||||
| Q18 | 0.797 | 0.166 | ||||||||
| Q19 | 0.406 | 0.429 | ||||||||
| Q20 | −0.452 | 0.362 | ||||||||
| Q21 | 0.790 | 0.228 | ||||||||
| Q22 | -0.683 | 0.301 | ||||||||
| Q23 | 0.448 | -0.392 | 0.253 | |||||||
| Q24 | 0.609 | 0.287 | ||||||||
| Q25 | 0.543 | 0.306 | ||||||||
| Q26 | 0.670 | 0.210 | ||||||||
| Q27 | 0.635 | 0.257 |
| Categorical Var. | Question | Sample | Cl-1 | Cl-2 | Cl-3 | Cl-4 | Cl-5 | Cl-6 |
|---|---|---|---|---|---|---|---|---|
| Number of individuals | 444 | 23 | 121 | 8 | 66 | 161 | 60 | |
| Cluster share (%) | 100 | 5.18 | 27.25 | 1.80 | 14.86 | 37.39 | 13.51 | |
| WtC for an EV (%) | (Q8) | |||||||
| Yes, I would pay more | 33.56 | 100 | 100 | 0 | 0 | 3.01 | 0 | |
| No, I would pay less/not pay | 66.44 | 0 | 0 | 100 | 100 | 96.99 | 100 | |
| WtC to EV (EV info) (%) | (Q9) | |||||||
| Yes, I would pay more | 49.10 | 100 | 100 | 100 | 100 | 0 | 0 | |
| No, I would pay less | 13.51 | 0 | 0 | 0 | 0 | 29.81 | 20.00 | |
| No, I would not pay for EV | (Q10) | 26.35 | 0 | 0 | 0 | 0 | 70.19 | 80.00 |
| ICEV preferences (%) | (Q11) | 31.53 | 0 | 0 | 0 | 0 | 56.02 | 78.33 |
| WtP for a new car (€) | (Q6) | 17,438 | 30,826 | 14,508 | 32,750 | 14,598 | 17,403 | 19,391 |
| WtP for a an EV (€) | (Q12) | 17,821 | 34,739 | 16,815 | 39,125 | 16,588 | 11,588 | 11,562 |
| Difference in WtP (%) | - | +2.15 | +11.26 | +13.72 | +16.29 | +12.00 | −33.41 | −40.37 |
| Dichotomous Model 3 | CL-1 | CL-2 | CL-3 | CL-4 | CL-5 | CL-6 | |||||||
|---|---|---|---|---|---|---|---|---|---|---|---|---|---|
| Logit | Probit | Logit | Probit | Logit | Probit | Logit | Probit | Logit | Probit | Logit | Probit | ||
| Mob. rout | Minimum range req. | 0.436 * | 0.254 * | 3.084 * | 1.650 *** | 1.010 *** | 0.532 *** | −1.190 *** | −0.701 *** | ||||
| Km covered per week | 0.0116 *** | 0.0101 *** | −0.00253 ** | −0.00125 ** | |||||||||
| Capital | −5.711 *** | −4.740 *** | −0.402 * | −0.239 * | |||||||||
| Psychosocial components | Predisp. new technologies | 0.535 *** | 0.253 *** | 1.839 *** | 1.669 *** | −0.184 *** | −0.111 *** | ||||||
| Environmental awareness | 0.596 *** | 0.304 *** | 1.598 ** | 0.700 ** | |||||||||
| Subjective well-being | −0.103 * | ||||||||||||
| Predisp. change vehicle | −1.258 ** | −0.862 ** | |||||||||||
| Aversion to risk | −2.498 *** | −1.965 *** | −0.273 ** | −0.149 ** | 0.278 *** | 0.163 *** | |||||||
| Tendency to impulsiveness | 0.580 *** | 0.297 *** | 0.274 *** | 0.160 *** | −1.353 ** | −1.052 *** | −0.386 *** | −0.212 *** | |||||
| Reflexive behavior | −0.359 ** | −0.197 ** | 2.506 *** | 2.138 *** | |||||||||
| Car features variables | Loyalty to a brand | 0.0707 * | −0.163 *** | −0.0971 *** | 0.146 * | 0.0811 ** | |||||||
| Car design | 0.160 * | 0.0853 * | |||||||||||
| Versatility and adaptability | 1.784 *** | 1.363 *** | −0.203 *** | −0.0948 ** | 0.227 ** | 0.125 ** | |||||||
| Technological equipment | 0.458 ** | ||||||||||||
| Price-performance | 0.796 ** | 0.720 *** | |||||||||||
| Low maintenance | 0.940 ** | 0.781 *** | |||||||||||
| Prestige and unique experience | 0.126 * | 0.0736 ** | |||||||||||
| Small car | 2.702 *** | ||||||||||||
| Large car | 3.620 * | 4.510 *** | |||||||||||
| All-terrain car | 0.696 ** | 0.405 ** | |||||||||||
| Number of cars in household | 1.508 *** | 1.242 *** | |||||||||||
| Age of current car | 0.313 *** | 0.273 *** | |||||||||||
| Socio-economic variables | Millennial (under 38 years old) | −12.62 *** | −10.41 *** | ||||||||||
| Gen_X (from 39 to 58 years old) | −11.21 *** | −8.375 *** | |||||||||||
| Gender (women) | −4.305 *** | −3.960 *** | |||||||||||
| High income | 0.731 *** | 0.439 *** | −3.650 ** | −2.613 *** | |||||||||
| Education | 4.256 *** | 2.864 *** | −0.887 *** | −0.479 *** | |||||||||
| Paid-employed | 3.926 *** | 2.008 *** | |||||||||||
| Self-employed | 1.166 *** | 0.661 ** | |||||||||||
| Children | −0.523 * | −0.302 * | |||||||||||
| _cons | −3.702 *** | −1.996 *** | −1.336 *** | −0.808 *** | −30.88 *** | −25.30 *** | −0.513 | −0.721 ** | 0.559 ** | 0.328 ** | −4.473 *** | −2.541 *** | |
| Nagelkerke R² | 0.180 | 0.1857 | 0.043 | 0.043 | 0.546 | 0.595 | 0.103 | 0.113 | 0.094 | 0.093 | 0.090 | 0.092 | |
| Wald Chi² | 28.280 | 26.750 | 20.290 | 20.600 | 40.760 | 57.380 | 28.450 | 30.550 | 41.630 | 45.120 | 32.480 | 34.040 | |
| Rogers’ Adopters | Clusters (Sample) | Main Characteristics | By Cluster |
|---|---|---|---|
| Innovators and early adopters (16%) | 1, 3 (6.98%) | —High WtP for an EV | Cl-1 and Cl-3 |
| —Frequently car usage but low minimum range required | Cl-1 and Cl-3 | ||
| —Predisposition to new technologies | Cl-1 and Cl-3 | ||
| —Risk behavior | Cl-3 | ||
| —Impulsive behavior | Cl-1 vs. but no Cl-3 | ||
| —Reflexive behavior | Cl-3 | ||
| —Environmental awareness | Cl-1 and Cl-3 | ||
| —High educational attainment | Cl-1 and Cl-3 | ||
| —Gen X or better | Cl-3 | ||
| Early Majority (34%) | 2, 4 (42.11%) | —Moderate WtP for an EV | Cl-2 and Cl-4 |
| —Few kilometers covered | Cl-4 | ||
| —Low minimum range required | Cl-2 and Cl-4 | ||
| —Risk behavior | Cl-4 | ||
| —Impulsive behavior | Cl-2 | ||
| —High socio-economic status | Cl-2 | ||
| —No children | Cl-4 | ||
| —Self-employed | Cl-4 | ||
| Late Majority (34%) | 5 (37.39%) | —Low WtP for an EV | Cl-5 |
| —Live in rural areas | Cl-5 | ||
| —Cover large distances | Cl-5 | ||
| —Reject new technologies | Cl-5 | ||
| —Highly risk-averse behavior | Cl-5 | ||
| Laggards (16%) | 6 (13.51%) | —No WtC to an EV due to preference for a conventional vehicle as a matter of taste | Cl-6 |
| —Not impulsive behavior | Cl-6 | ||
| —Design, versatility and driving experience are important | Cl-6 | ||
| —Large vehicles (SUV, crossover, …) | Cl-6 | ||
| —Loyalty to a prestigious make | Cl-6 | ||
| —Low educational level | Cl-6 |
© 2018 by the authors. Licensee MDPI, Basel, Switzerland. This article is an open access article distributed under the terms and conditions of the Creative Commons Attribution (CC BY) license (http://creativecommons.org/licenses/by/4.0/).
Share and Cite
Rodríguez-Brito, M.G.; Ramírez-Díaz, A.J.; Ramos-Real, F.J.; Perez, Y. Psychosocial Traits Characterizing EV Adopters’ Profiles: The Case of Tenerife (Canary Islands). Sustainability 2018, 10, 2053. https://doi.org/10.3390/su10062053
Rodríguez-Brito MG, Ramírez-Díaz AJ, Ramos-Real FJ, Perez Y. Psychosocial Traits Characterizing EV Adopters’ Profiles: The Case of Tenerife (Canary Islands). Sustainability. 2018; 10(6):2053. https://doi.org/10.3390/su10062053
Chicago/Turabian StyleRodríguez-Brito, Maria Gracia, Alfredo J. Ramírez-Díaz, Francisco J. Ramos-Real, and Yannick Perez. 2018. "Psychosocial Traits Characterizing EV Adopters’ Profiles: The Case of Tenerife (Canary Islands)" Sustainability 10, no. 6: 2053. https://doi.org/10.3390/su10062053