1. Introduction
With the acceleration of economic globalization, the marine transport industry is growing rapidly. In the current doldrums of the international shipping market, the prices for ship repairs are not picking up, so the ship repair business should consider how to reduce costs and to improve corporate profits. Due to the limited resources of berths in a harbor, it is the key to maximizing the efficiency of the allocation of resources and efficiently allocating resources when undertaking multiple ships. The optimal allocation of port resources is an important guarantee for the sustainable development of marine transportation industry, involves the optimal operation of berths, and the rational allocation of quay cranes.
The optimization of ship berth scheduling is of much significance and practical value to improving the efficiency of a shipyard. At present, the theoretical research on the optimal dispatching of berths at a shipyard has become a hot spot. Many scholars have studied the port-scheduling problem from the sustainable perspective. Kang et al. [
1] constructed environmental technology, process quality improvement, monitoring and upgrading, communication cooperation, and actively participates in the five factor analysis model, which was committed to the sustainability of port operation as a descriptive and diagnostic management tool. Han et al. [
2] considered the rational utilization of resources and the sustainable development of port operation and management, and then proposed a multi-objective optimization model to minimize the consumption of resources and the minimum moving distance of the shore bridge. From the perspective of environmental sustainability, Hu et al. [
3] established a nonlinear multi-objective mixed integer programming model, which considered the fuel consumption and the emission of ships, and analyzed the effects of the wharf cranes number on the port operation cost, the fuel consumption of ships, and the emission of pollution gas. Di et al. [
4] systematically reviewed the literature on environmental sustainability of green ports; the Balanced Scorecard and Tableau de Bord are identified and proposed as managerial accounting instruments for assessing, monitoring, measuring, controlling, and reporting the organizational processes. In addition, some scholars have discussed the comprehensive evaluation of green port [
5,
6,
7] and the sustainable development of the port from the perspective of supply chain sustainability [
8,
9,
10,
11,
12].
Generally, ship berth scheduling is proved to be an NP (Non-deterministic Polynomial) problem with multiple objectives and multi-faceted factors that affect each other [
13], thus it is also a multi-objective decision-making (MODM) problem and the MODM method can be applied to solve specific sustainability problems [
14,
15,
16,
17,
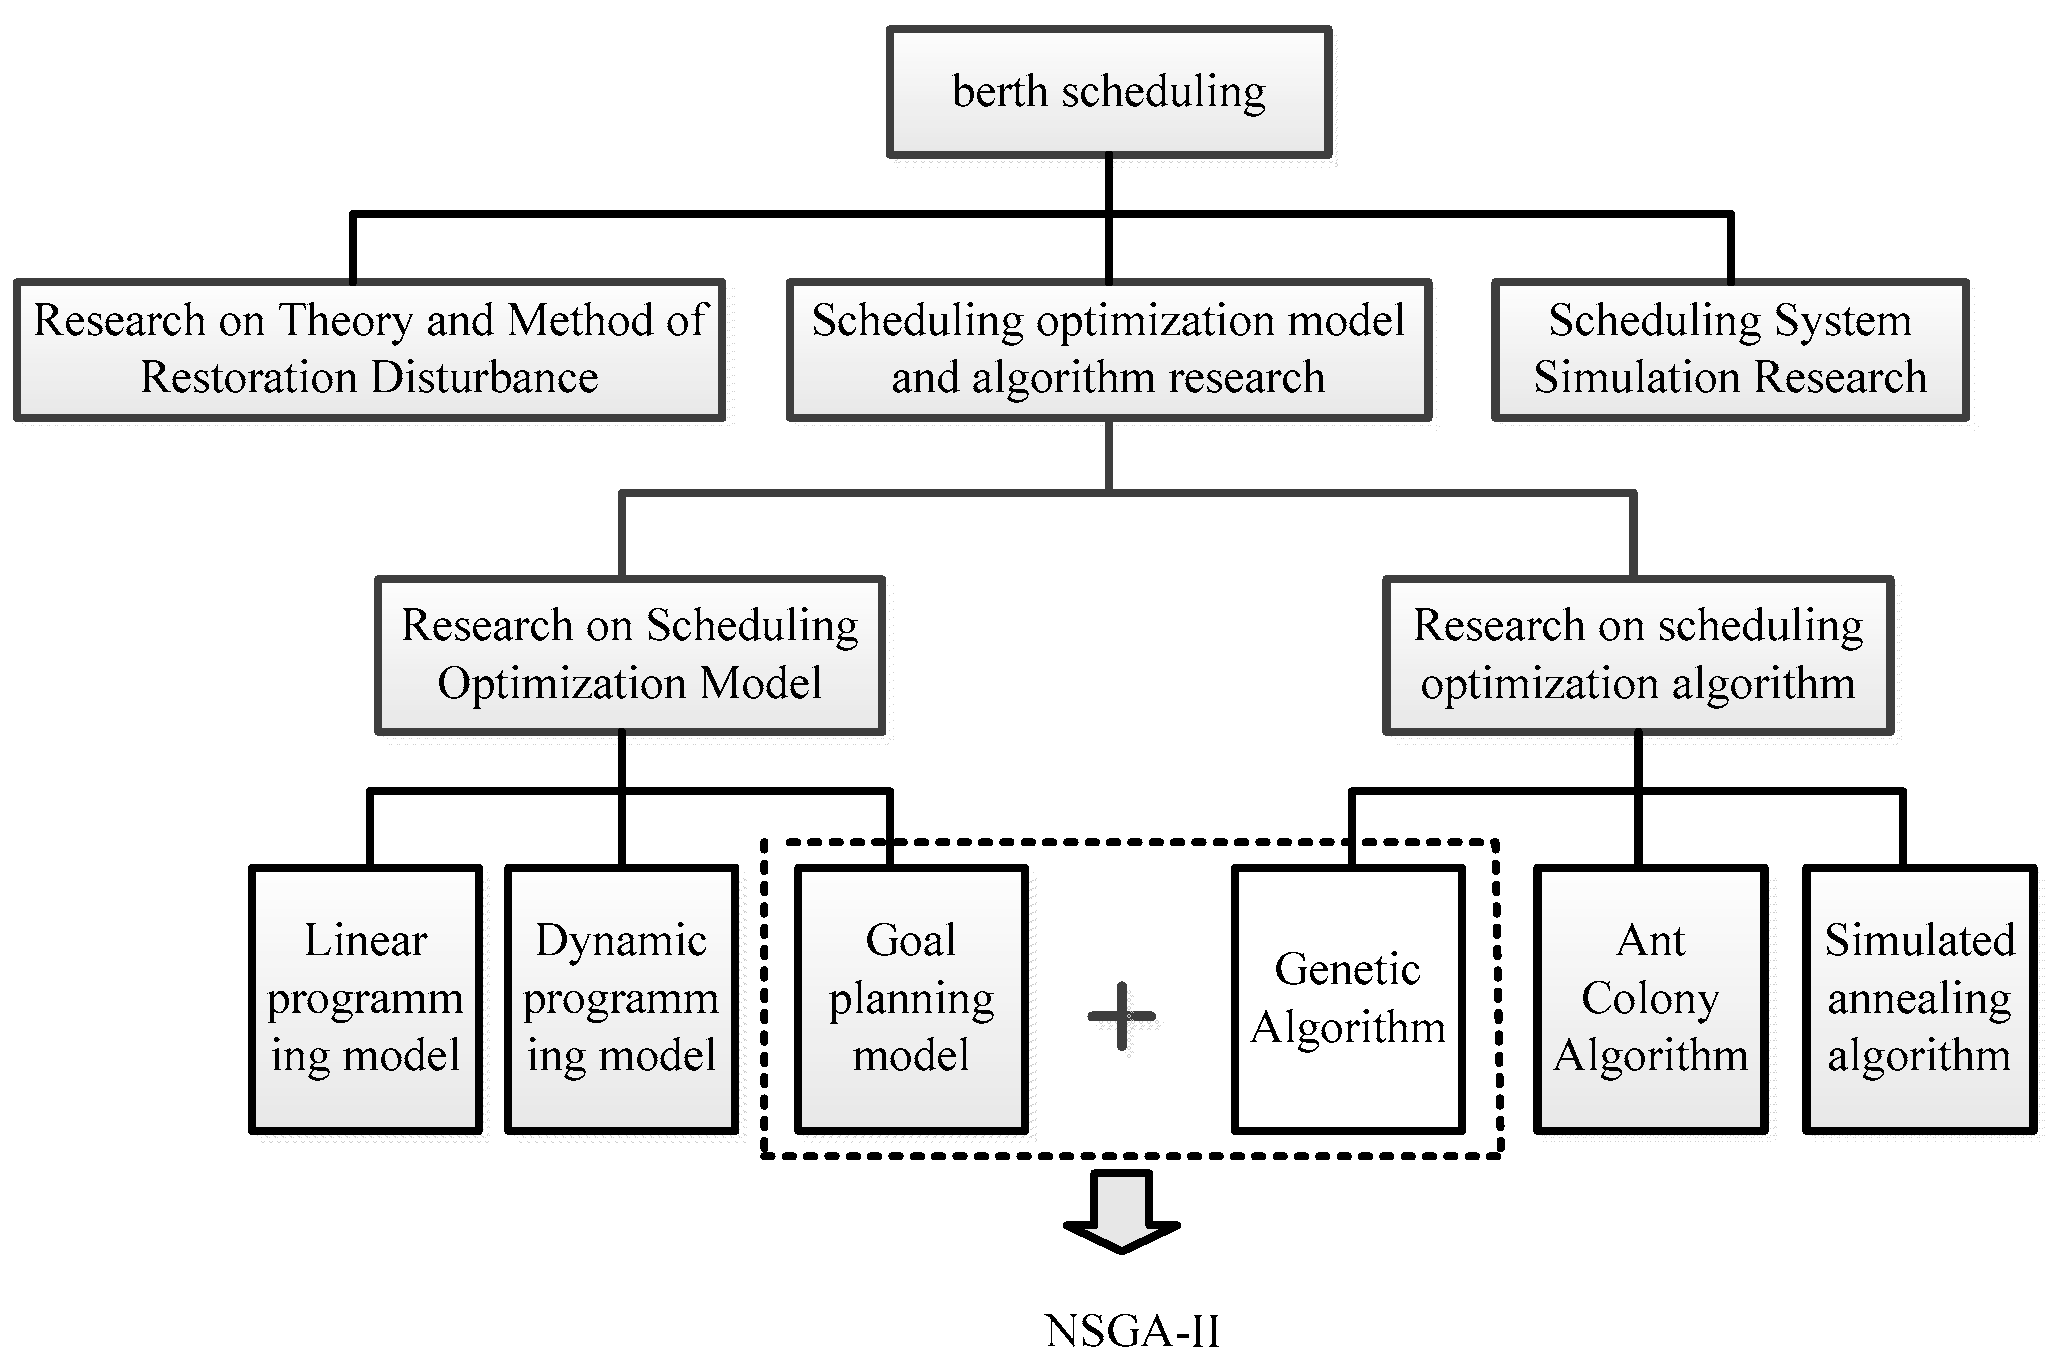
18]. The research on berth scheduling can be summarized by the following three aspects (
Figure 1): (l) Terminal berth scheduling optimization model and algorithm research. Golias et al. [
19] established a two-objective optimization mathematical model to minimize the average time and range of a ship’s total service and proposed a heuristic algorithm to solve the problem of robust berth scheduling. To solve the problem of berth and yard allocation, Robenek et al. [
20] proposed an exact algorithm that was based on the branch and price framework to solve the integration problem, and used the mixed integer programming method; (2) Study of the theory and method of berth disturbance recovery. Xu et al. [
21] studied the location and time costs of berth deviations based on the theory of interference management and established the interference management model. The multi-objective genetic algorithm was used to solve the model and to obtain a more efficient berth allocation plan; (3) Simulations of terminal berth dispatching systems. Taking into account the randomness of the discharge/loading operations, Legato et al. [
22] constructed a strategy-based mathematical programming model and an operational-level simulation model using an event-based Monte Carlo simulator to study the Berth Allocation Decision Problem (BAP). To minimize ship loading and unloading times, Al-Dhaheri et al. [
23] considered the transit times between the terminals and the yards during the entire container loading and unloading process, then proposed a stochastic mixed integer programming model for the Quay Cranes Scheduling Problem (QCSP), and established a container scheduling simulation model that was based on a genetic algorithm to reveal the dynamics and uncertainty. In general, research on scheduling optimization models and algorithms is the basis of the study of the problem of berth scheduling, which has stimulated the interest of many scholars.
The remainder of this paper is organized as follows.
Section 2 is the review of the literature about berth scheduling.
Section 3 describes the problem and offers several hypotheses.
Section 4 explains the berth and the quay crane joint dispatching model.
Section 5 demonstrates a numerical example and compares the results of different algorithms. Finally,
Section 6 presents the conclusions.
2. Literature Review
A growing consensus recognizes the need to shift society products and services towards more sustainable models [
24,
25,
26,
27]. In recent years, green ports have become the mainstream of sustainable development of the global ports. The competition among container terminals becomes more and more fierce, and almost all of the container terminals bear the pressure to attract more customers. How to rationally scheduling port resources to improve the service level of container terminals and improve customer satisfaction has aroused wide attention of scholars at home and abroad. This review of the literature about port scheduling covers the scheduling models first, and then the optimization algorithms.
To maximize the berth throughput and reliability of berth scheduling, Robenek et al. [
20] proposed a mixed integer programming model based on branch and price framework to solve the two key optimization problems of berth distribution and distribution of cargo ports in bulk cargo ports. Xu et al. [
28] proposed an expression for solving the berth scheduling problem by introducing a delayed buffer concept to simulate the ship’s delay and the uncertainty of the processing time. However, this expression is assumed under the continuous berth space hypothesis, but not for discrete berths. When considering the uncertainties of ship arrival and running times, Zhen et al. [
29] explored the uncertainty in the port scheduling problem and constructed a two-stage decision model. Then, he conducted some computational analysis of the performance of the berth allocation process in an uncertain environment. The author used the rescheduling strategy to deal with the initial plan, but the reality of the environment did not match because the proposed model was too complex. Monaco et al. [
30] transformed the discrete berth problem into a dynamic scheduling problem and obtained the best scheme by using an improved Lagrangian heuristic algorithm. Lee et al. [
31] formally described the discrete berth and the quay crane scheduling problem by mixing the integer programming model. To solve the berth allocation problem of a multi-user container terminal, Imai et al. [
32] introduced the Lagrangian slack variable when solving the minimum waiting time of a ship and turned the static berth scheduling problem into a dynamic berth scheduling problem. Han et al. [
33] used the probability density function to represent the uncertainty of the arrival and the processing time of a ship. This method does not require the probability distribution of the arrival and processing times of a ship, but it does not comprehensively consider the optimization objectives, while only a few people take the impact of unfair psychological factors into account.
Regarding optimization algorithms, Kim et al. [
34] proposed a simulated annealing method for solving the problem of additional costs incurred when a ship is at an inappropriate location and resolved the problem of port fines that were incurred when detained ships depart later than scheduled. Hsu [
35] when combined with improved particle swarm optimization and event based heuristic algorithm, a hybrid particle swarm optimization (HPSO) algorithm is proposed to solve the problem of discrete and dynamic berth and wharf crane distribution. To solve the problem of berth allocation, Oliveira et al. [
36] proposed a hybrid clustering search method that was based on a simulated annealing algorithm to improve the terminal space distribution logistics by reducing the total service time of each ship. To solve the problem of discrete and dynamic berth allocation, more specifically, to allocate the discrete berth positions of ships while minimizing both the total waiting and processing times of all ships, Ting et al. [
37] proposed a particle swarm optimization solution that effectively improves the efficiency of the solution and reduces the computational time. To make berths more flexible, Imai et al. [
38] proposed a dynamic scheduling problem of jagged berths, studied the problem of berth scheduling with realistic constraints, and introduced a heuristic algorithm to solve the problem of continuous berth allocation. Finally, a large number of experiments have shown this heuristic algorithm to be superior and proven the feasibility of using a genetic algorithm to solve berth scheduling in a dynamic environment. Umang et al. [
39] used precise and heuristic algorithms for berth allocation in discrete ports. Lee et al. [
31] proposed an improved genetic algorithm in order to obtain an approximate optimal solution.
The problem of port scheduling is already complex and uncertain, and there has been little research on unfair psychological factors, proposed models are very different from how ports actually work. Therefore, based on the actual work processes of ports, this paper constructs a multi-objective mathematical model with five objective functions, and proposes a port berth-shore bridge joint dispatching method to deal with the problem of berth scheduling and the rational distribution of berths. Then, the model is solved by using a fast and unpredictable improved genetic algorithm (NSGA-II), which was based on Pareto optimality.
3. Problem Description and Assumptions
The joint scheduling of berths and shore bridges can be described as follows. Assume that A is a collection of ships at a port, M is the port berth collection, a is the ship number, and
i is the berth number, where
and
. A ship arrives at a port, then moves to the best working berth (each vessel has one or more best working berths to enable the system to achieve a multi-objective Pareto optimality), discharges, and finally leaves the port. If there is no free berth when the ship arrives, then there will be a certain waiting time. After the ship has been unloaded, there must be a certain staying time for the loading of goods. For loading or unloading a ship, there needs to be a reasonable distribution of shore bridges, because it is necessary to have the equitable allocation and the highest utilization of shore bridge resources [
32,
33].
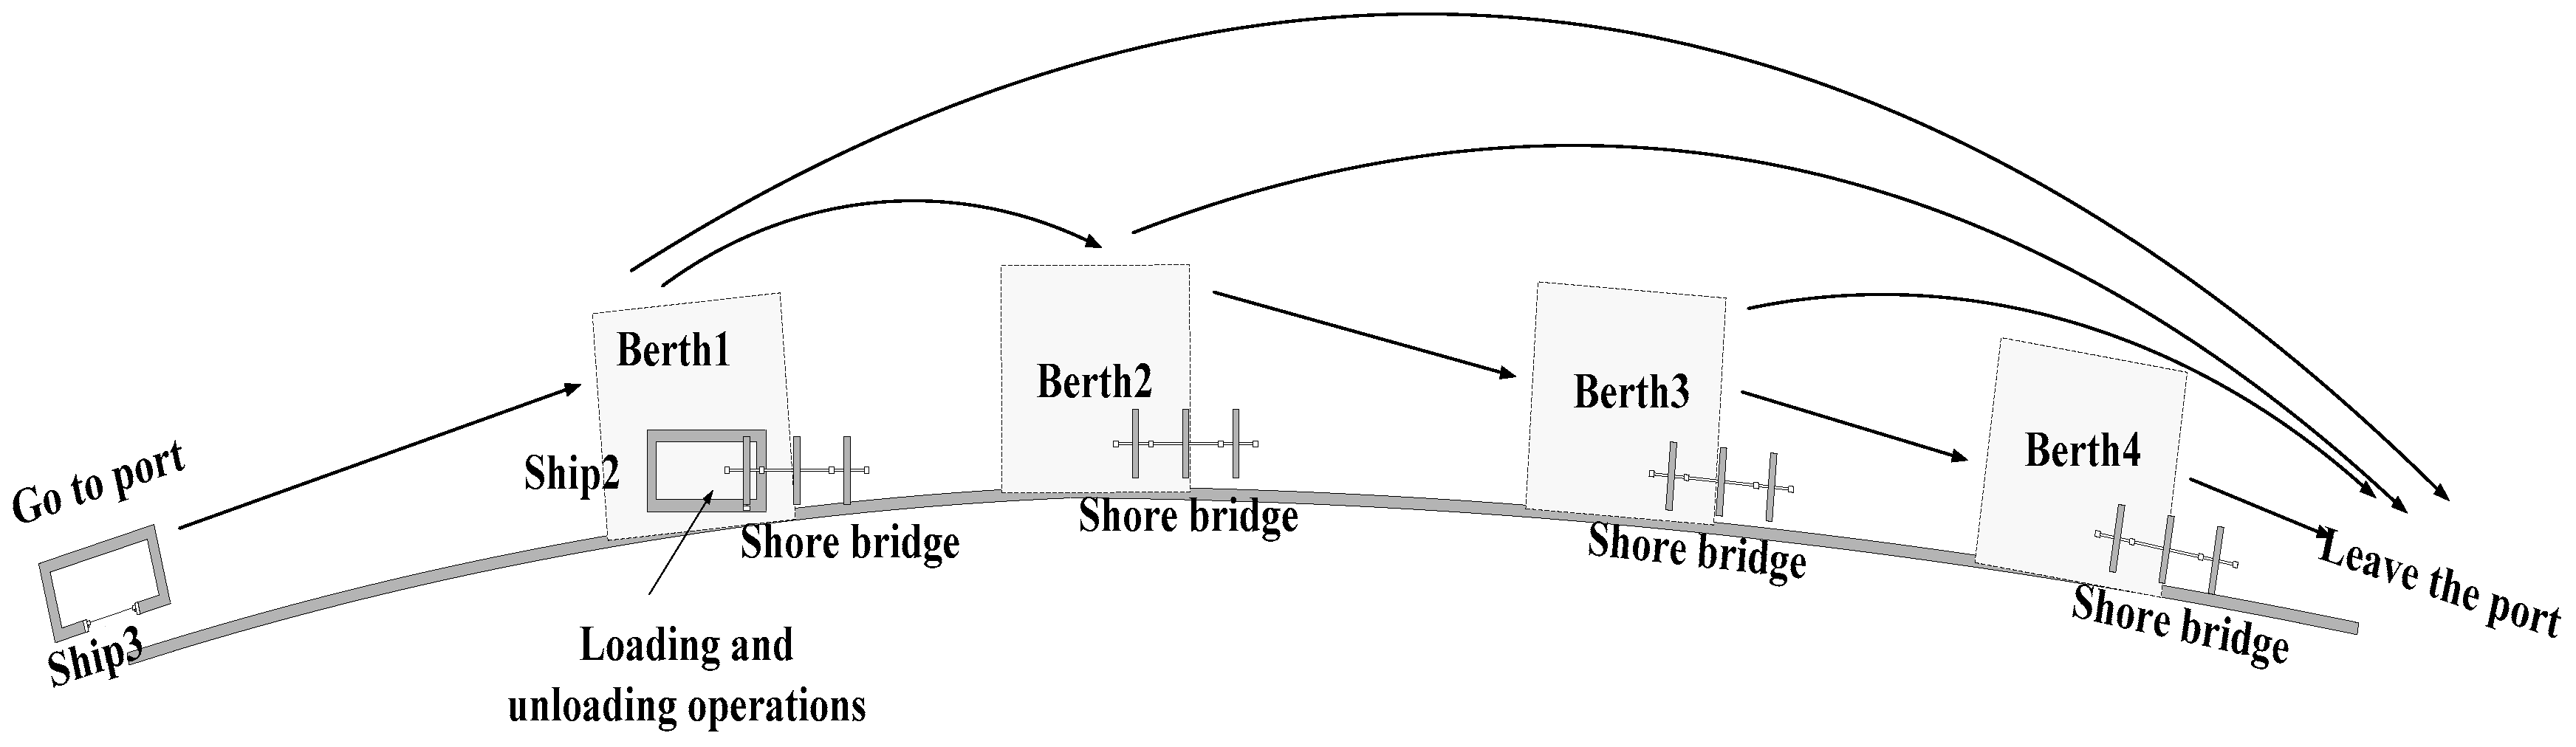
The main content of this paper is about the joint optimization of the berth-shore bridges of a port. The diagram of the joint operation of berths-store bridges is shown in
Figure 2. Suppose that Berths 1, 2, 3, and 4 are available to Ship 3, which enters the port as Ship 2 is loading/unloading in Berth 1. Ship 3 has two options, one of which is to enter Berth 1 for loading/unloading after Ship 2 has left, while the other option is to find the best available working berth.
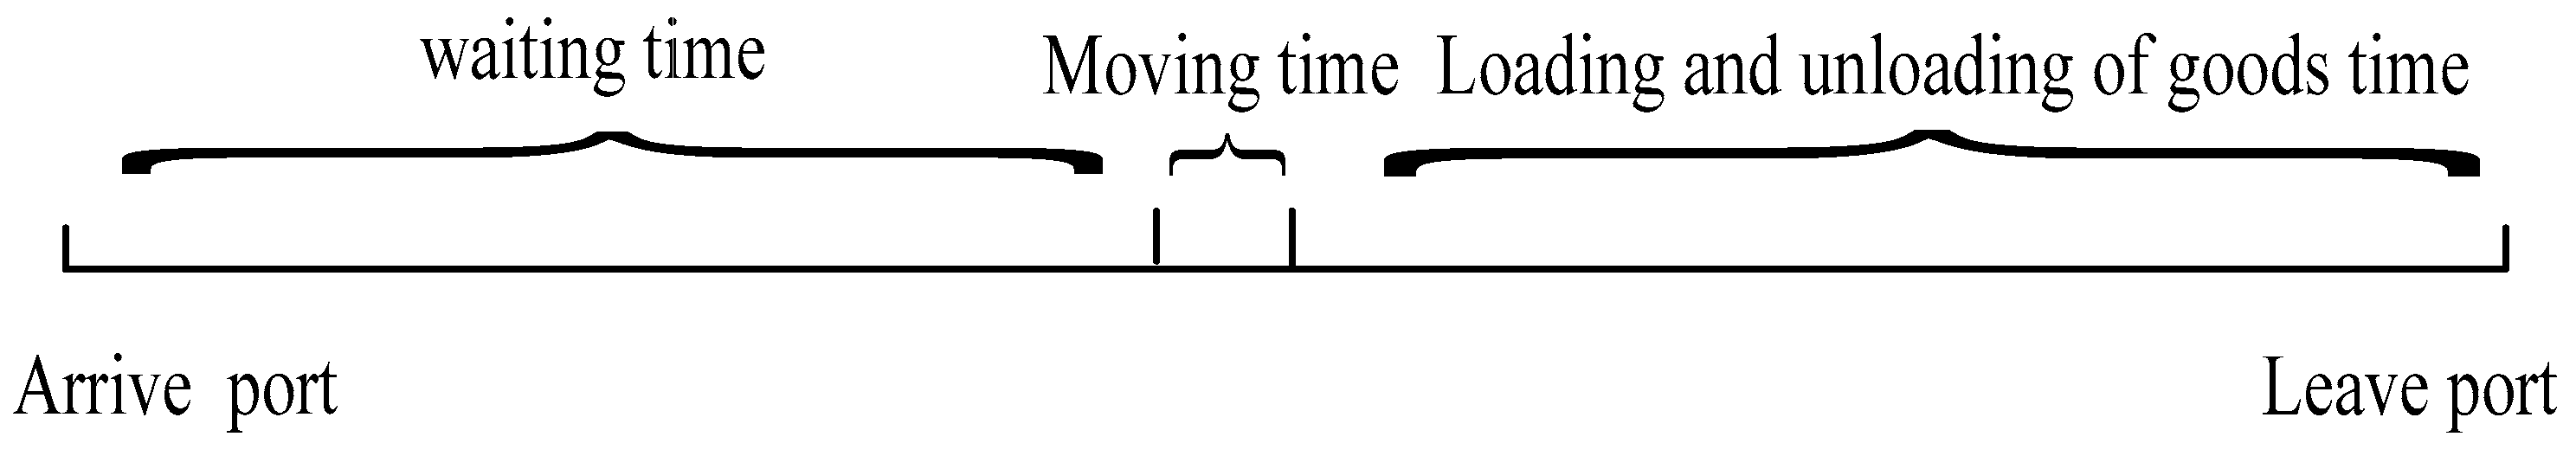
As shown in
Figure 3, the time during which a ship is parked at the port is mainly composed of waiting for a particular berth to become available (waiting time), moving to the best working berth (moving time), and time for loading/unloading of the ship.
Since the distances among the berths are short, the shift and waiting times can be ignored. It is:
t0 is the actual time in port for ship a, t1 is the waiting time, t2 is the remaining unloading time of the previous vessel before ship a, is the unloading time, t3 is the stay time mainly for loading, and t4 is the total loading and unloading time of the system. Formula (1) represents the required time for ship a to wait for the loading/unloading of the previous ship (remaining unloading and stay time). Formulas (2) and (3) are the unloading times of the ship. Formula (4) represents the required time to load and unload cargo (unloading and stay time) of ship a. Formula (5) is the actual formula for the calculation of ship a in port.
The problem of berth allocation that is discussed in this chapter is based on the following assumptions: (1) Each ship has an ideal berth for unloading and loading; (2) Each berth formulate a minimum and maximum number of distributable shore bridges; (3) Due to the short distances among berths, the moving time is negligible compared to the waiting time; (4) The subsequent migration distance of the ship can be obtained directly (the distances among the berths is approximated instead); (5) The costs of use and labor service of the same berth’s shore bridge are the same, but those for different berths are not necessarily the same; (6) The water depth of each berth can meet the requirements of any ship’s docking; (7) Each berth serves only one ship at a time; and, (8) The stay time of each ship is the same.
4. Construction of Joint Scheduling Model of the Port and Quay Cranes
According to the actual production characteristics of shipyard terminals, this paper creatively considers the influencing factors of customer unfairness and establishes a multi-objective mathematical model with the objective of shortest time in port, minimum system cost, and minimum unfairness. The parameters and meanings that are associated with the model are shown in
Table 1.
4.1. Model Building
(1) Minimum stay time in port: .
The optimized time in port for a ship is the difference between the departure and arrival times.
(2) Minimum system cost:
The total cost, including shifting process cost (mainly related to the shifting distance), artificial services costs, such as berth maintenance and use of quay crane (including the manufacture, operation, and maintenance), of the system is incurred while a ship is in port.
(3) Minimum unfairness:
According to the theory of justice in management, only when the ratio of pay and effort is equal to the proportion of the pay and effort of others will fairness be produced. Similarly, we believe that it is necessary to consider the ratio of the loading and unloading quantity and the number of the matched quay crane in the distribution, so as to minimize the sense of the unfairness of the customers. Therefore:
where
;
.
Based on the above analysis, a multi-objective optimization model is constructed, as follows:
Formula (10) means that the arrival time of ship a is less than its departure time. Formula (11) means that the length of ship a is less than the length of the berth where it parks. Formula (12) means that the total length of the berth is less than the total length of the quay. Formula (13) signifies the quantity constraint of the quay bridge that is allocated by each berth. Formula (14) means that the number of quay cranes used by every ship on berth i cannot exceed the total number of cranes allocated to the berth.
4.2. Algorithm Flow and Steps for Problem-Solving
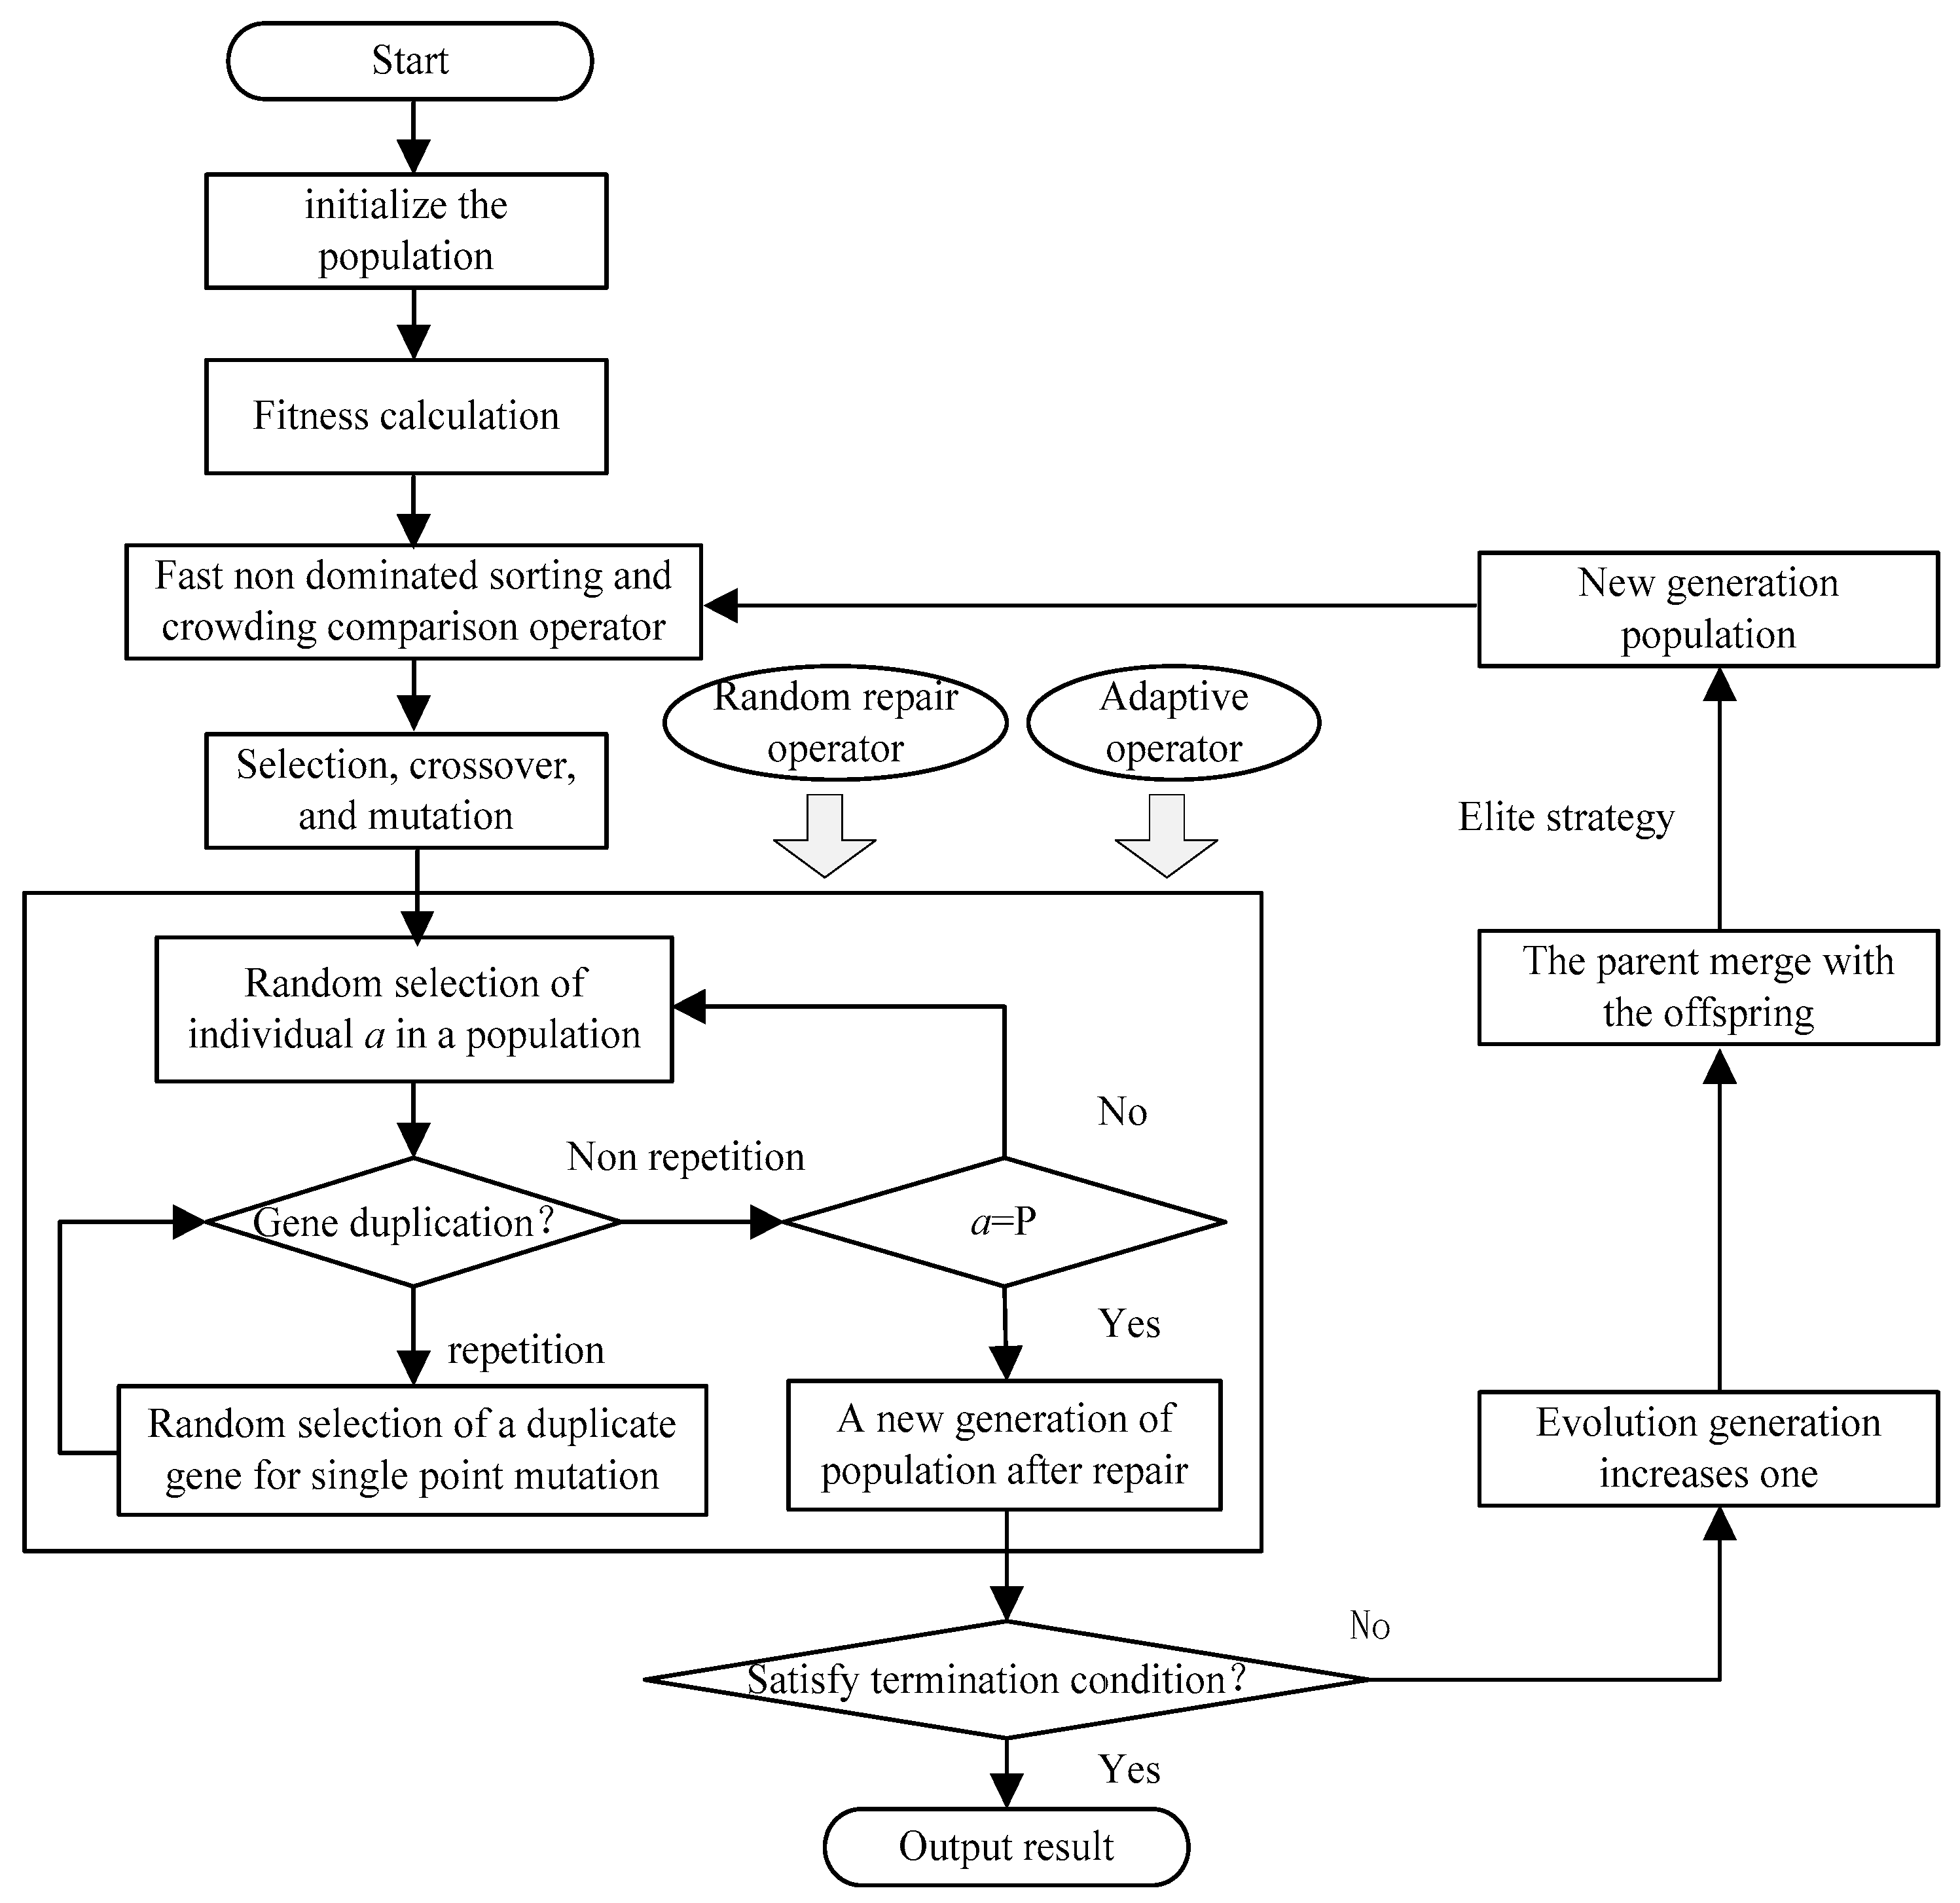
The algorithm flow of the improved NSGA-II algorithm is based on random repair and self-adaptive operators, as shown in
Figure 4.
The steps for the solution are as follows:
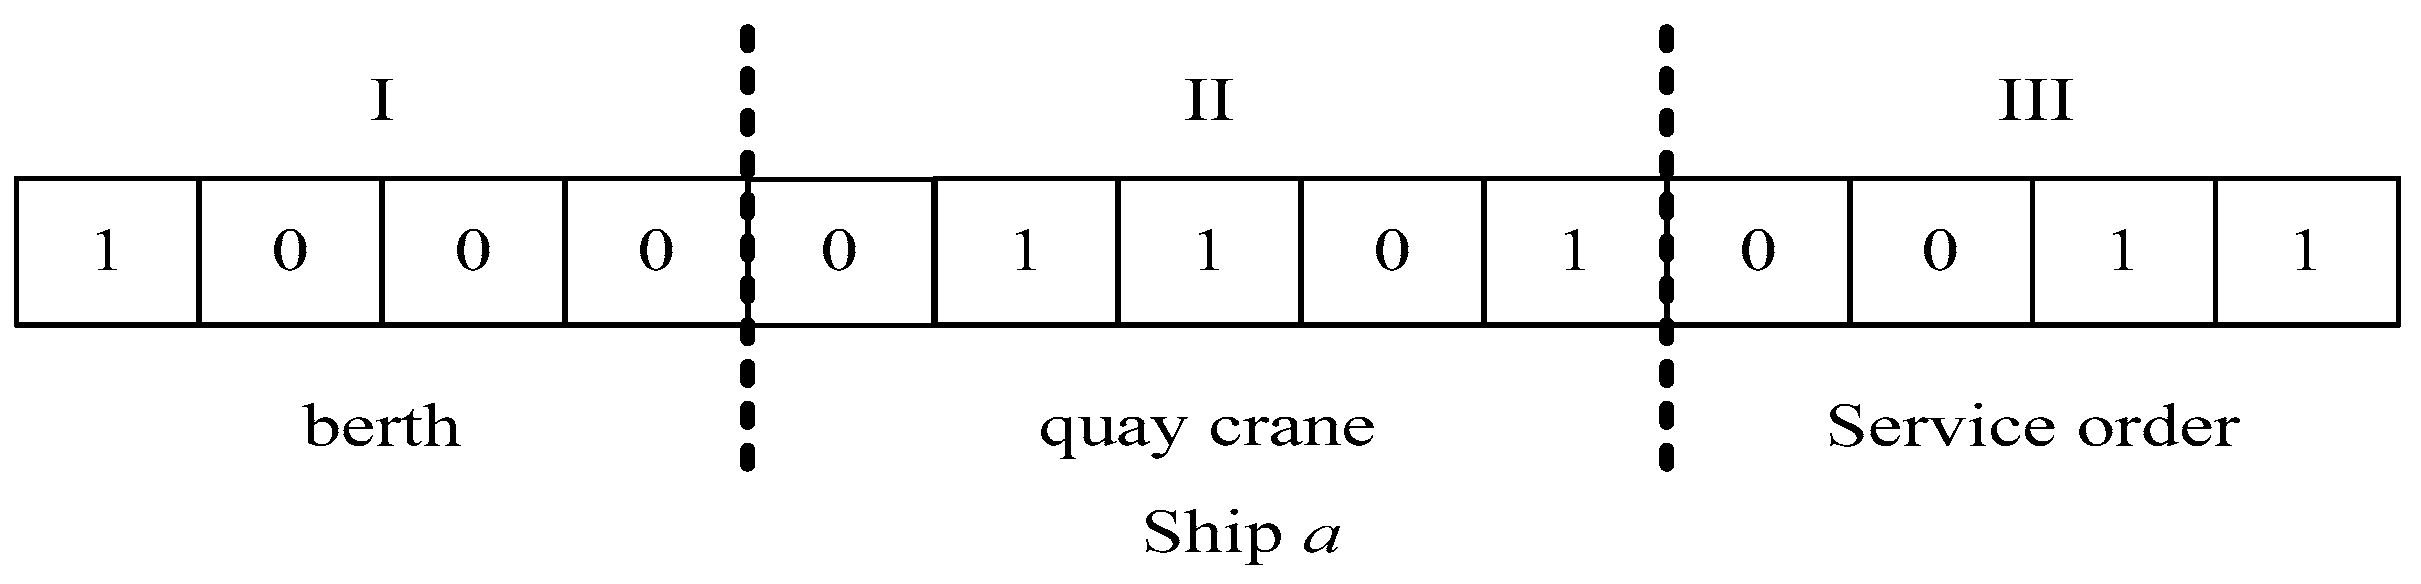
(1) According to the objective function and constraints, the initial population is generated randomly. The population size is set as
P, then the individual ships are coded with the three-tier coding form as 0, 1. The first tier represents the berth. The corresponding code is 1 if the ship stays in the berth; otherwise, the code is 0. The second tier is the number of berths that is matched to the berth. The third is the service sequence, which indicates how many vessels are served at the berth. As shown in
Figure 5, the order indicates the first ship to be served by the third on Berth 1, on which Bridges 2, 3, and 5 are selected.
(2) Improvement strategy.
① Random repair operator. To prevent the duplication of individuals in the genetic process, gene repair was performed on individuals that did not meet the principle of mutual exclusion in the population.
(3) According to Equation (9), calculate target fitness.
(4) Use fast non-dominated sorting and crowding comparison operators (Formula (18)). To evaluate the fitness of the parent, the first filial generation is generated by genetic manipulation, such as selection, crossover, and mutation, while genetic repair is performed with the random repair operator.
where
represents the (
λ + 1)th objective function value of the
tth individual. Similarly,
represents the
tth objective function value of the (
λ − 1)th individual.
(5) The termination condition judgment. If the maximum evolution generation is reached, then the evolutionary is terminated. Otherwise, the evolution generation increases one.
(6) The parent and progeny populations are combined to form a new combined population with a scale of 2P. The fast, non-dominated sorting algorithm and the crowding comparison operator are used to evaluate all of the individuals in the merged population. The best individuals are chosen as the parent population of the iteration to achieve elite protection.
(7) Return to Step (3).
5. Case Study
In the container freight port in city Z of China, there are only four discrete berths and 15 quay cranes. The efficiency of the quay crane is 30 t/min, and the ship’s stay time (mainly loading) is 30 min. The port is busy, the waiting times are long, there is an unreasonable number of quay cranes under different berths causing a serious waste of resources, and unfairness occurs regarding berth-shore bridges, causing customer and employee dissatisfaction. To better solve the above problems, the data recorded from the ship to the port in the day of the port (as shown in
Table 2,
Table 3,
Table 4 and
Table 5) are simulated. By using the method that is given in this paper, the population size of the improved NSGA-II algorithm is set to 200 individuals and the maximum iteration number is set to 200 times,
,
,
,
. The simulation was run on Windows 2007 MATLAB 2016b software and compared to GA and standard (original) NSGA-II. The results are shown in
Figure 6,
Figure 7,
Figure 8,
Figure 9 and
Figure 10. In GA and standard NSGA-II, the cross-probability is set to 0.8 and the mutation probability is set to 0.1.
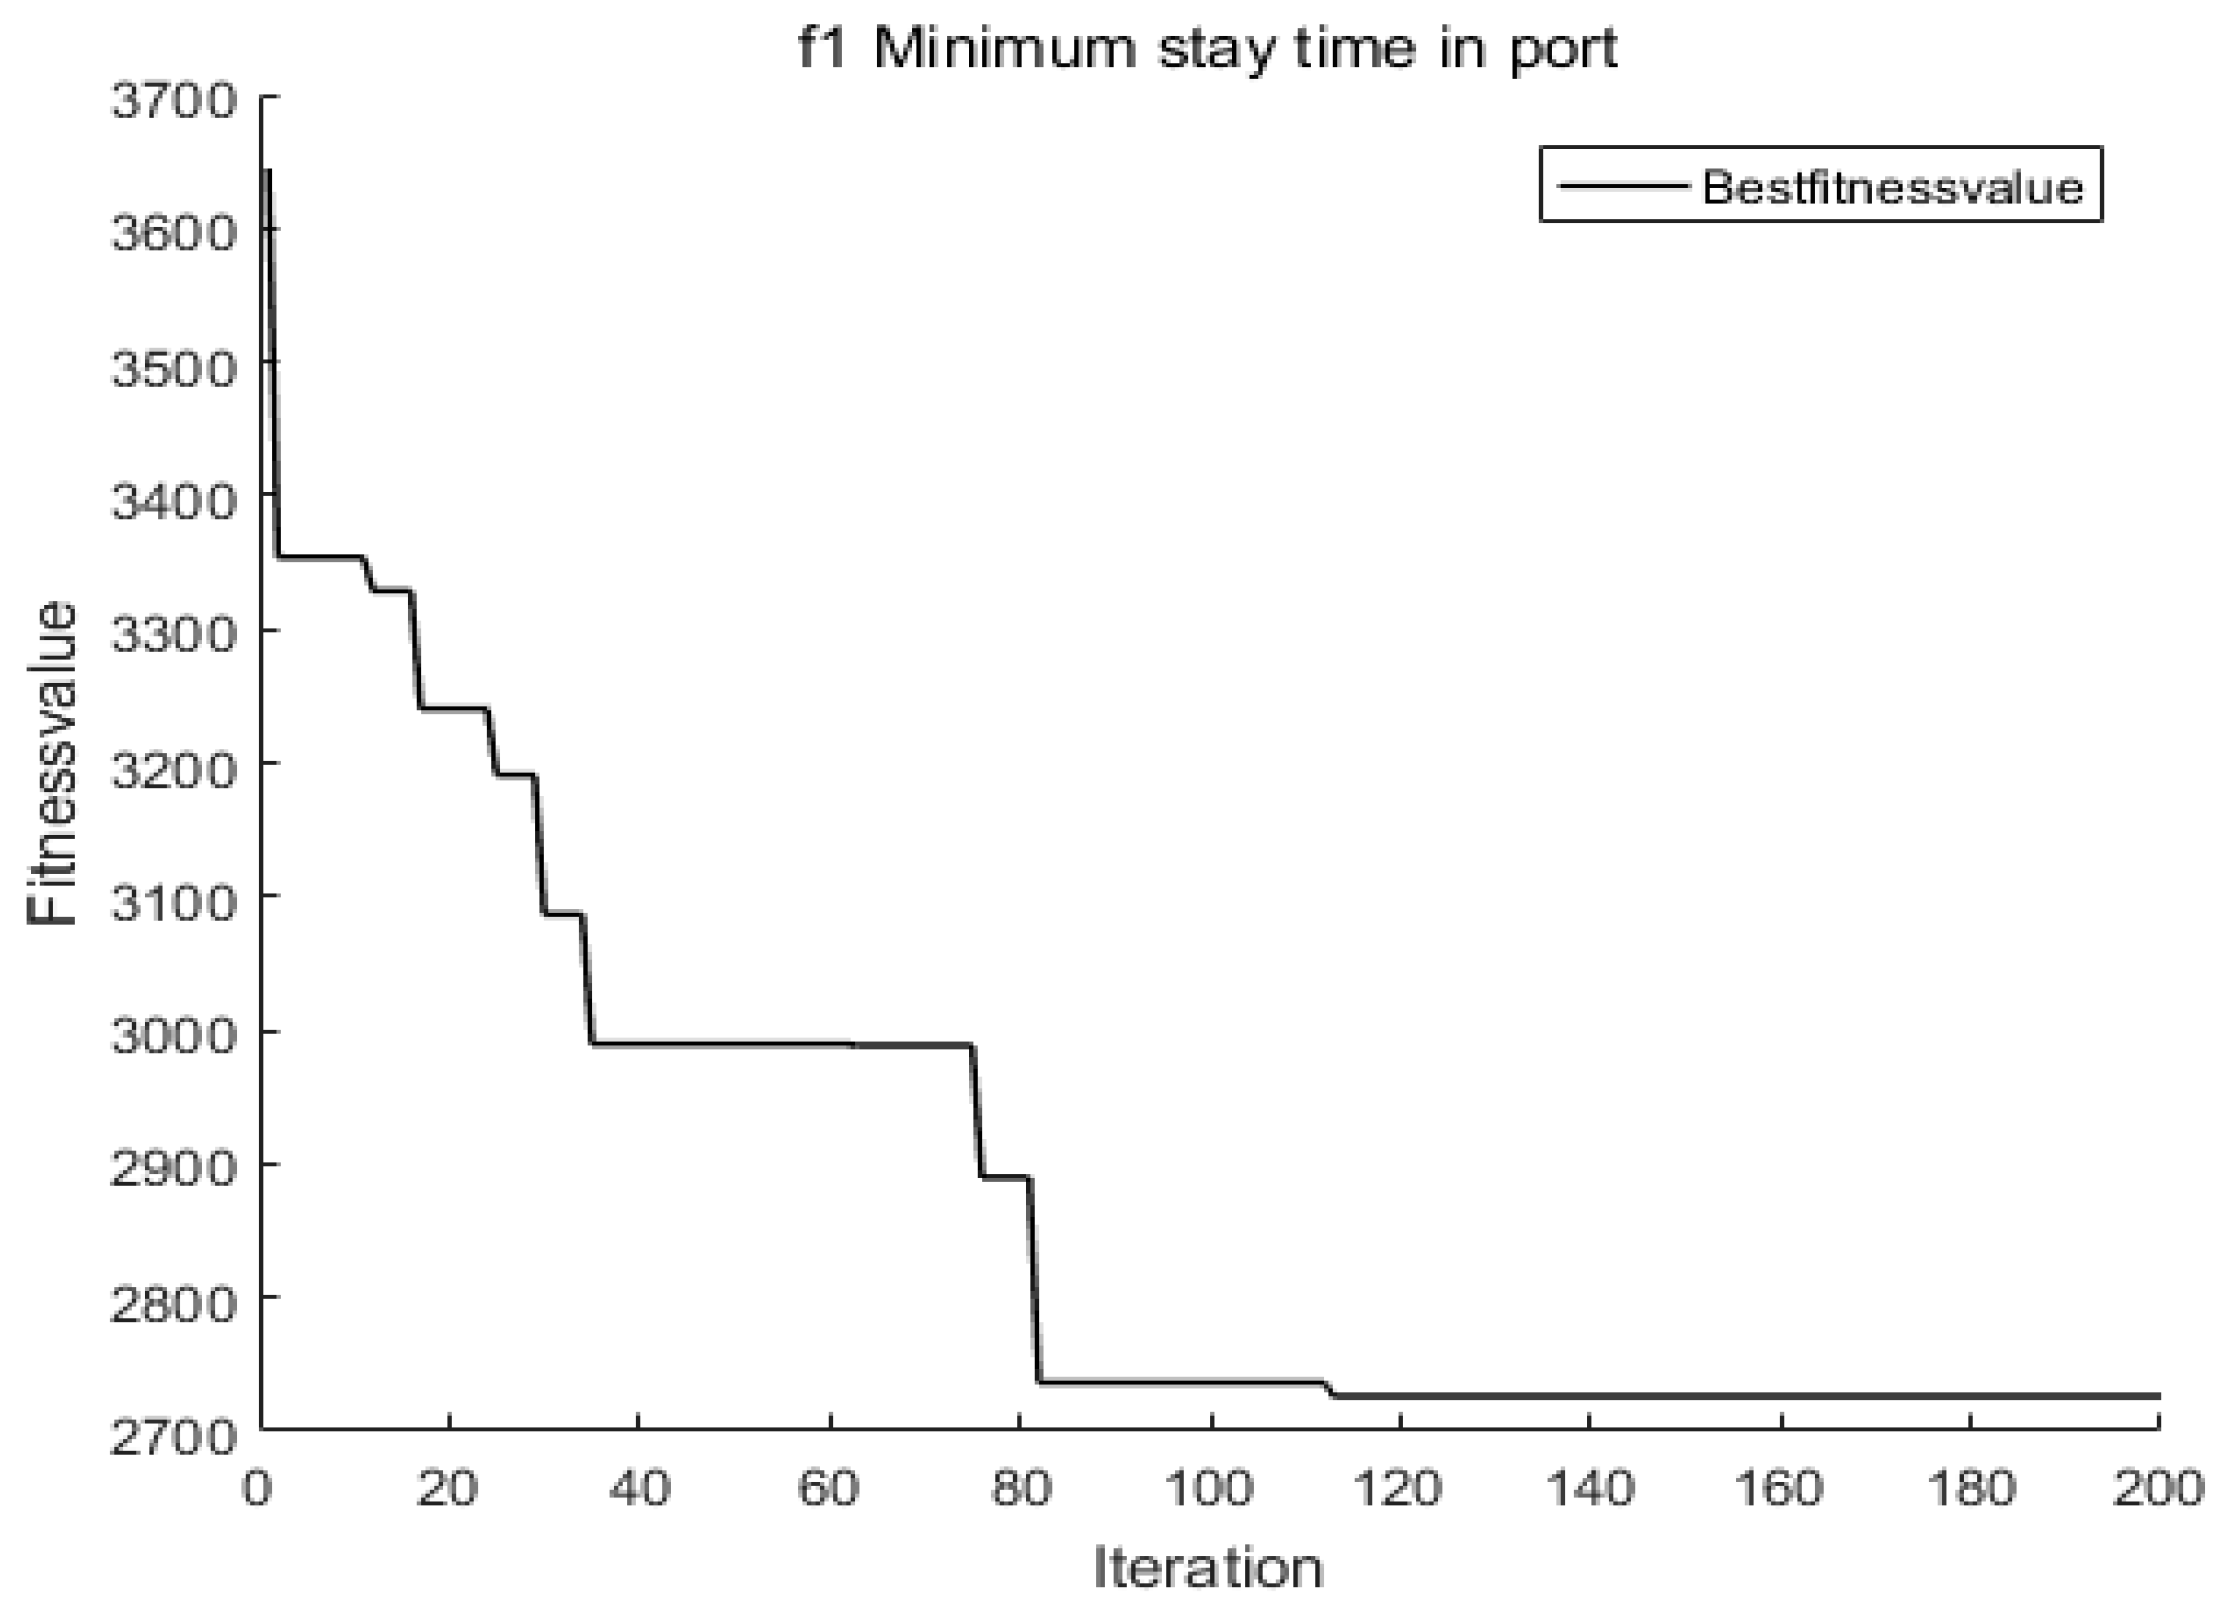
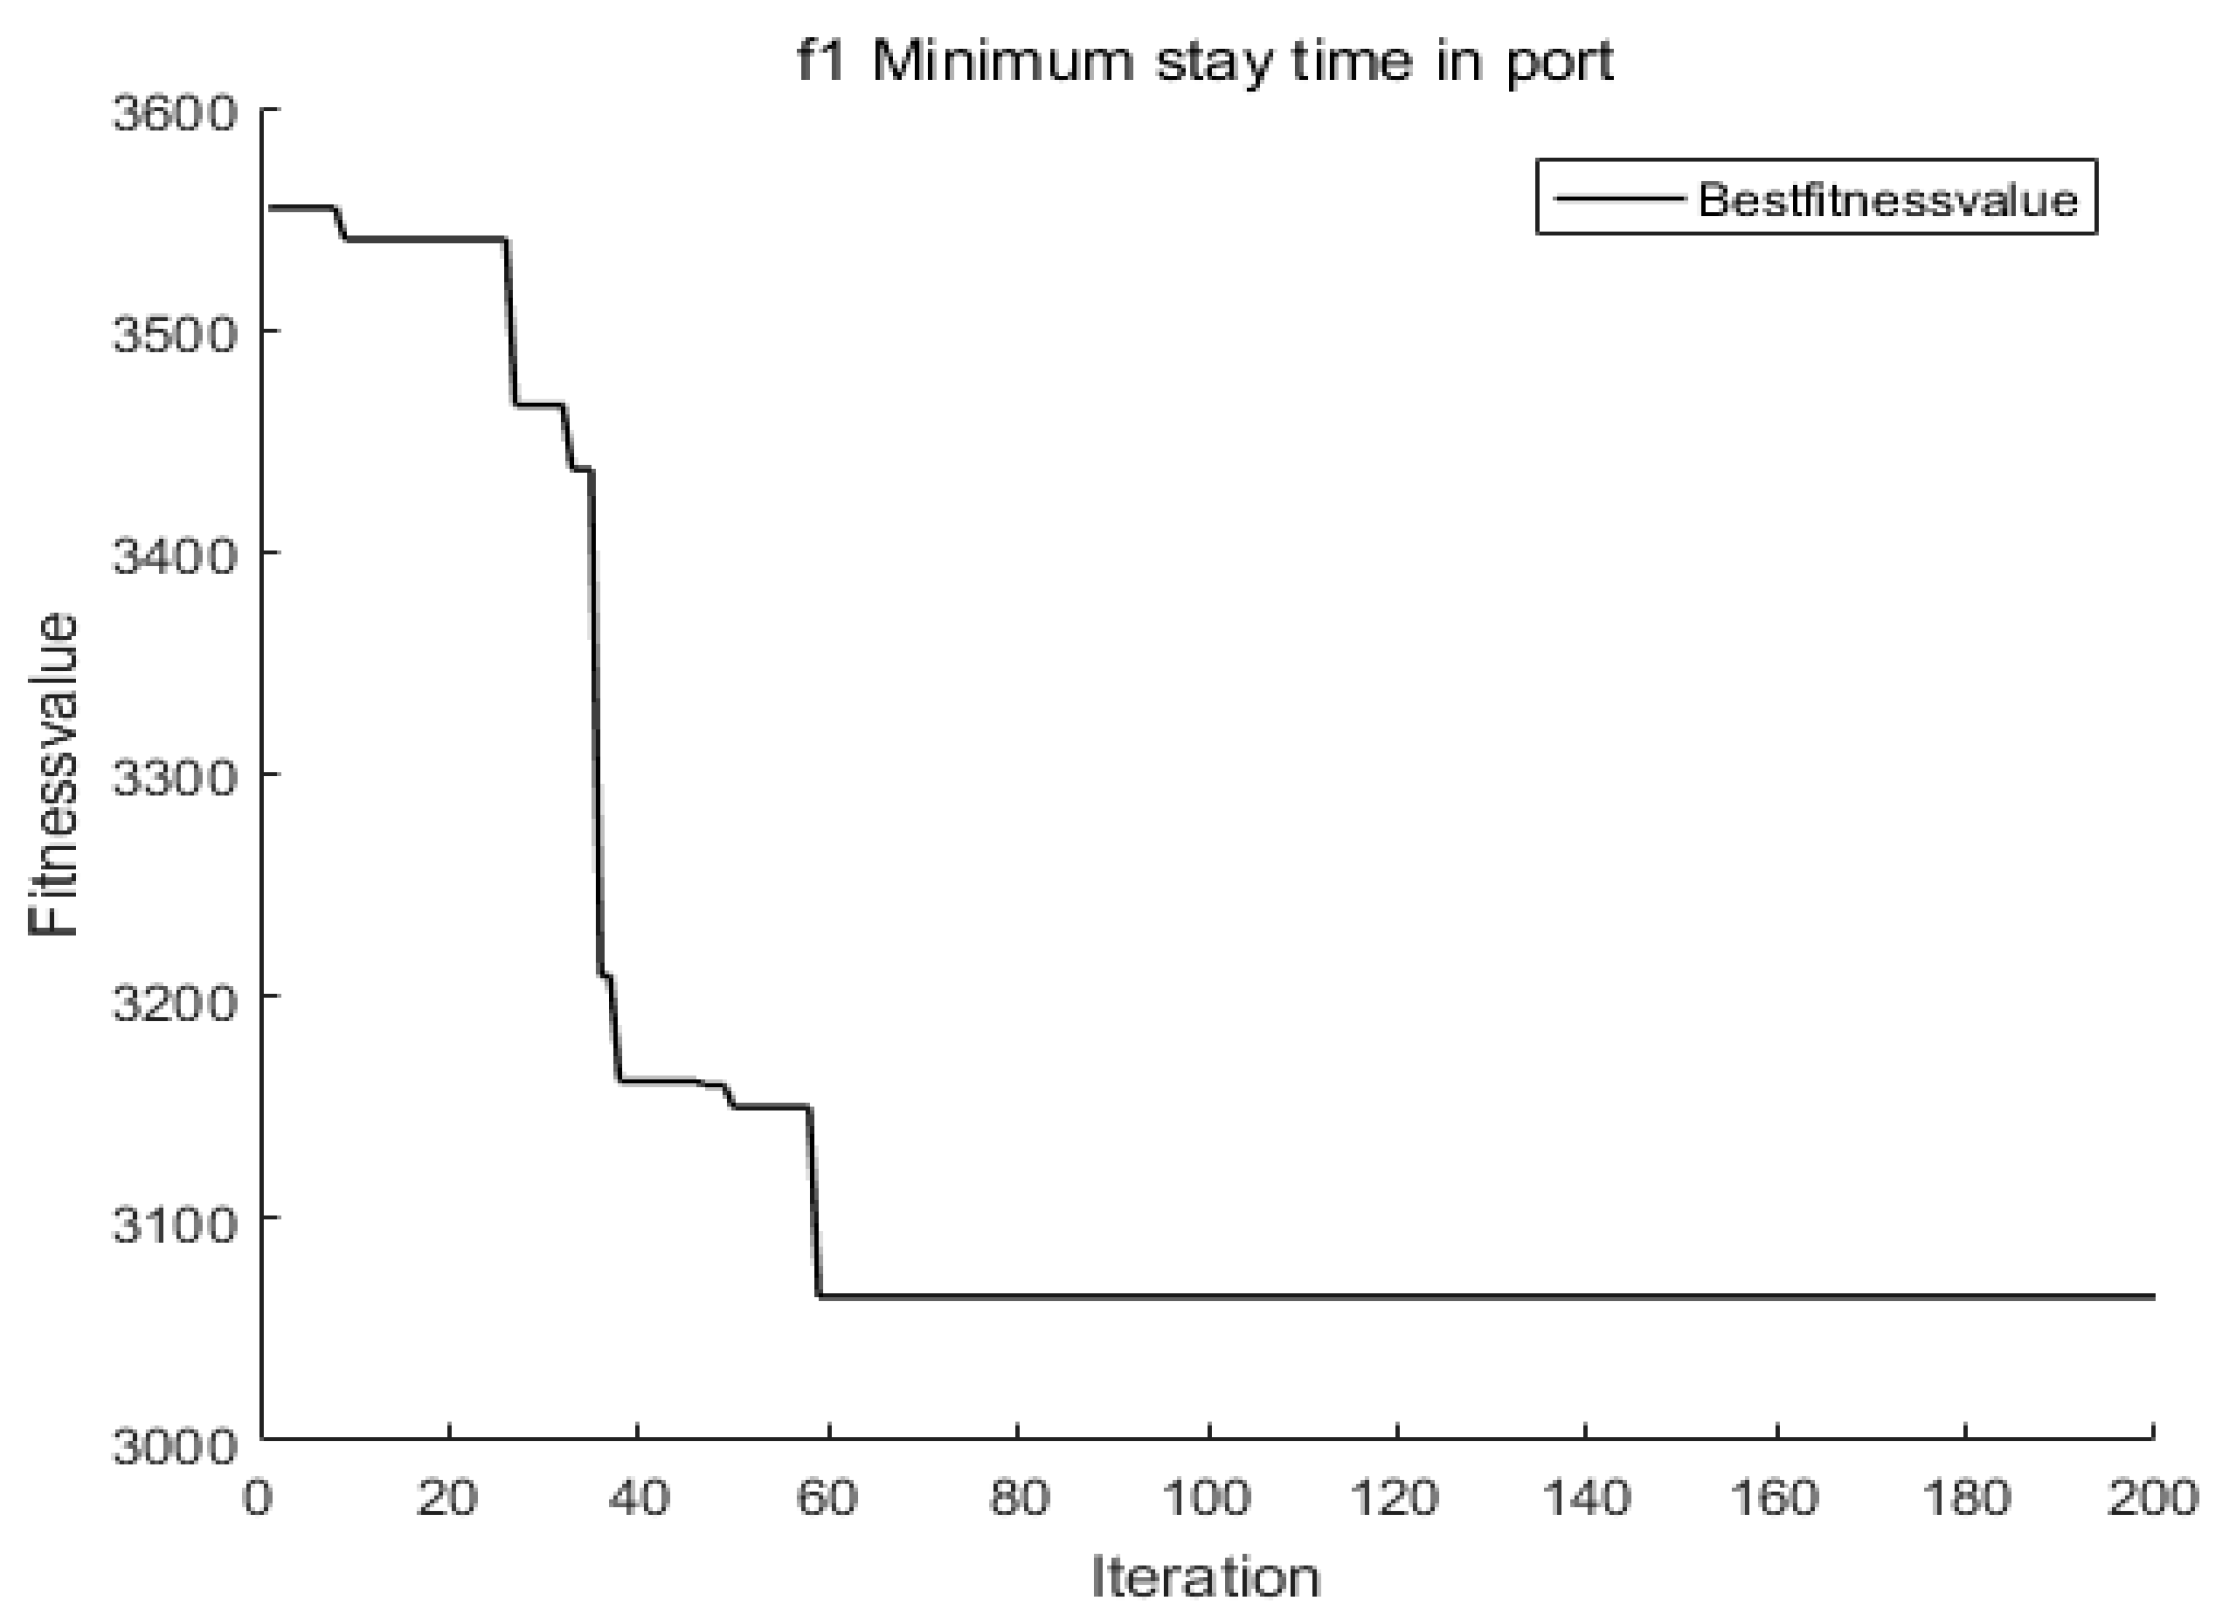
Using the improved NSGA-II and standard NSGA-II algorithms for the simulation, the shortest arrival time of the ship is obtained, as shown in
Figure 6 and
Figure 7. As the number of iterations increases, the shortest time converges to a constant minimum value in port time.
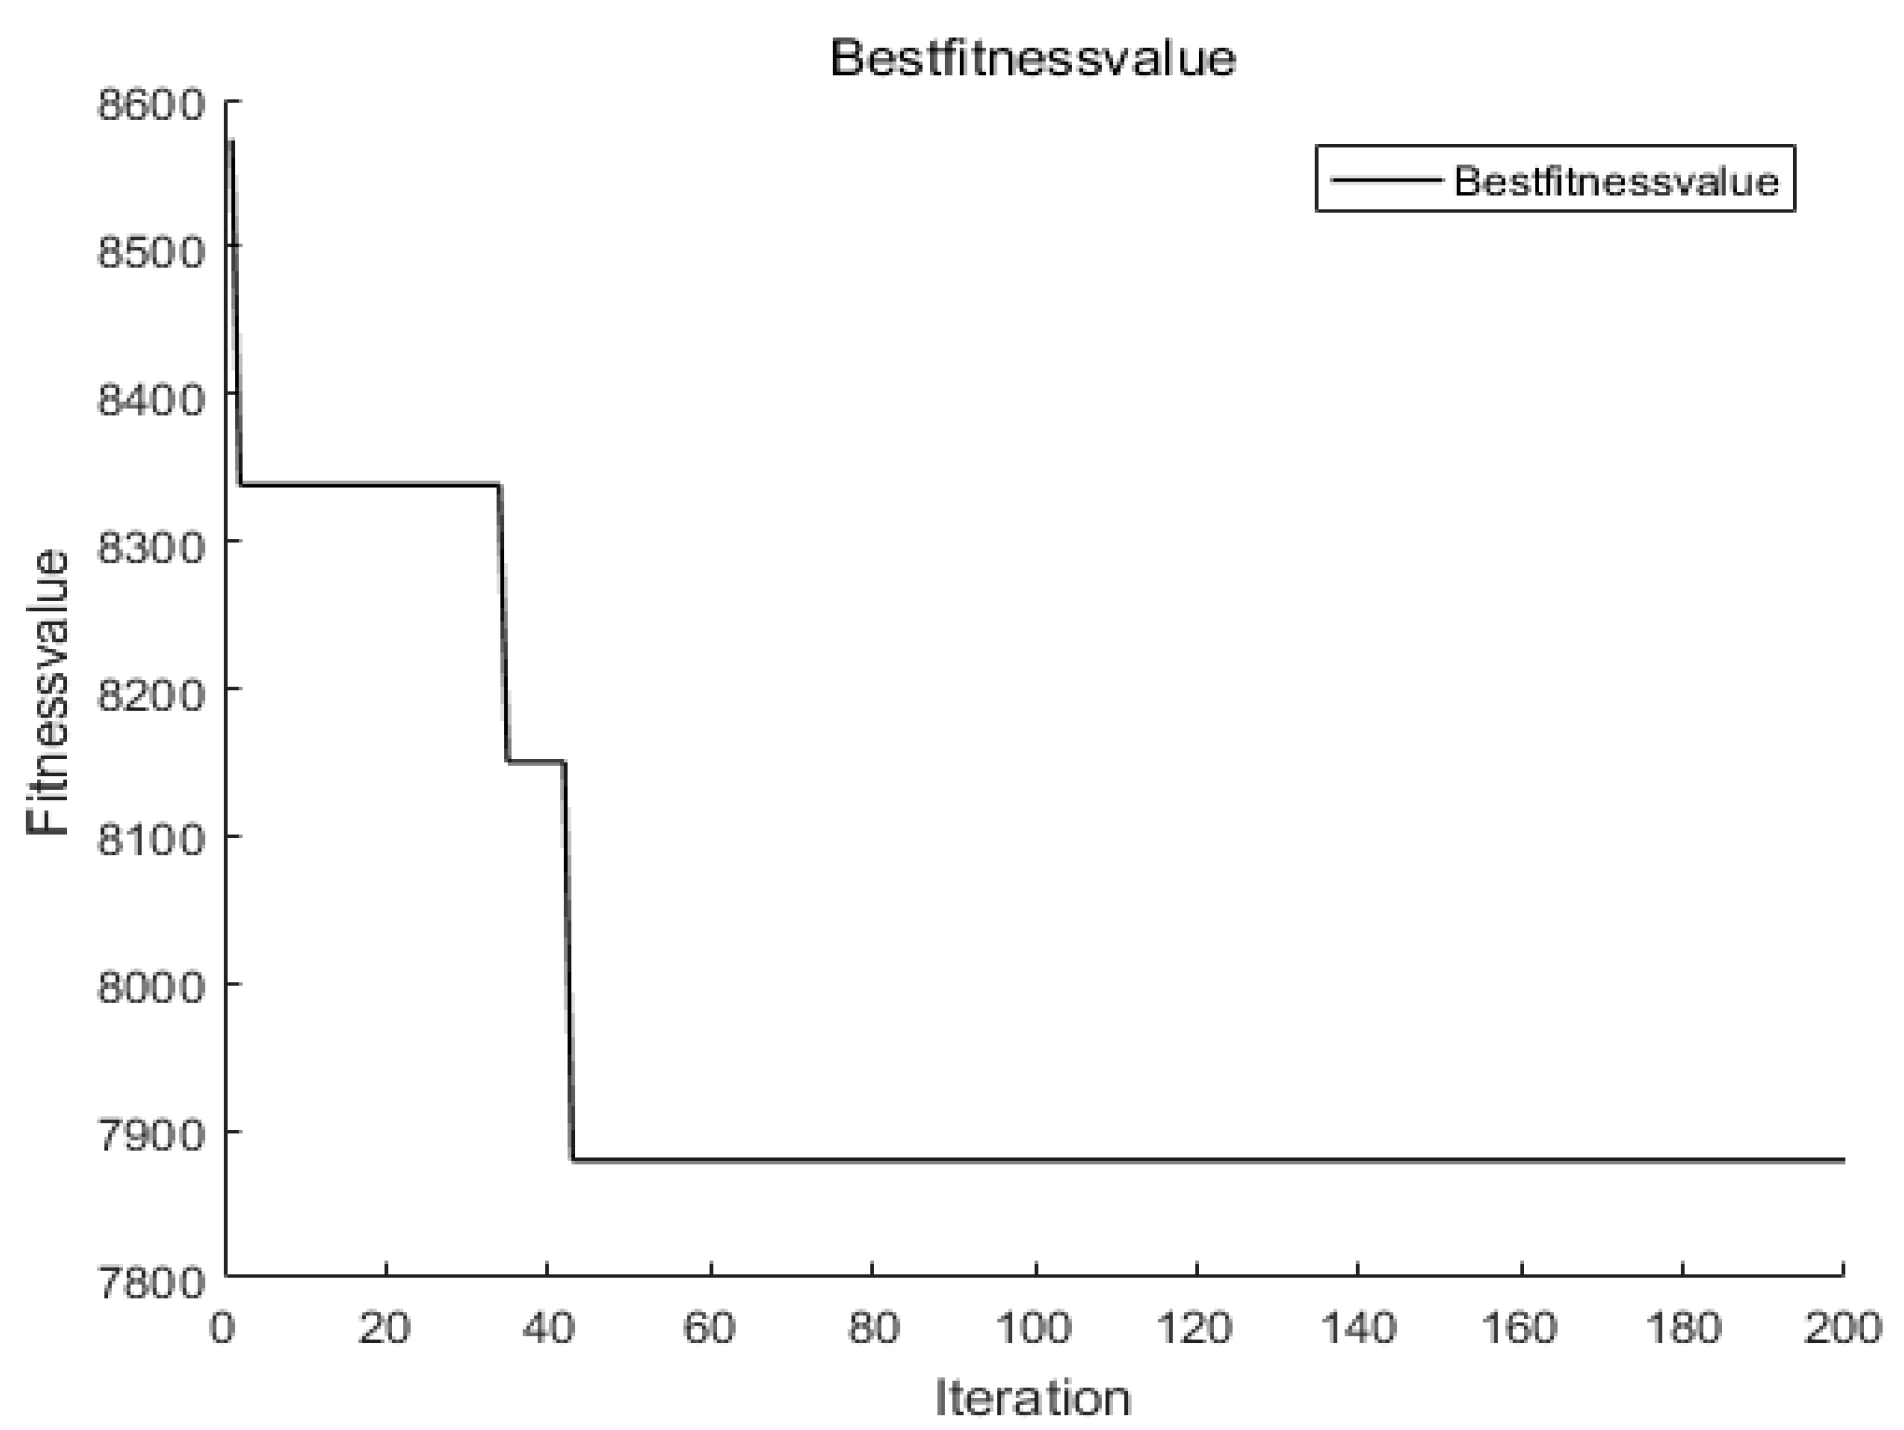
At the same time, in the GA algorithm, we let the fitness function
f =
f1 +
f2 +
f3. The result is shown in
Figure 8.
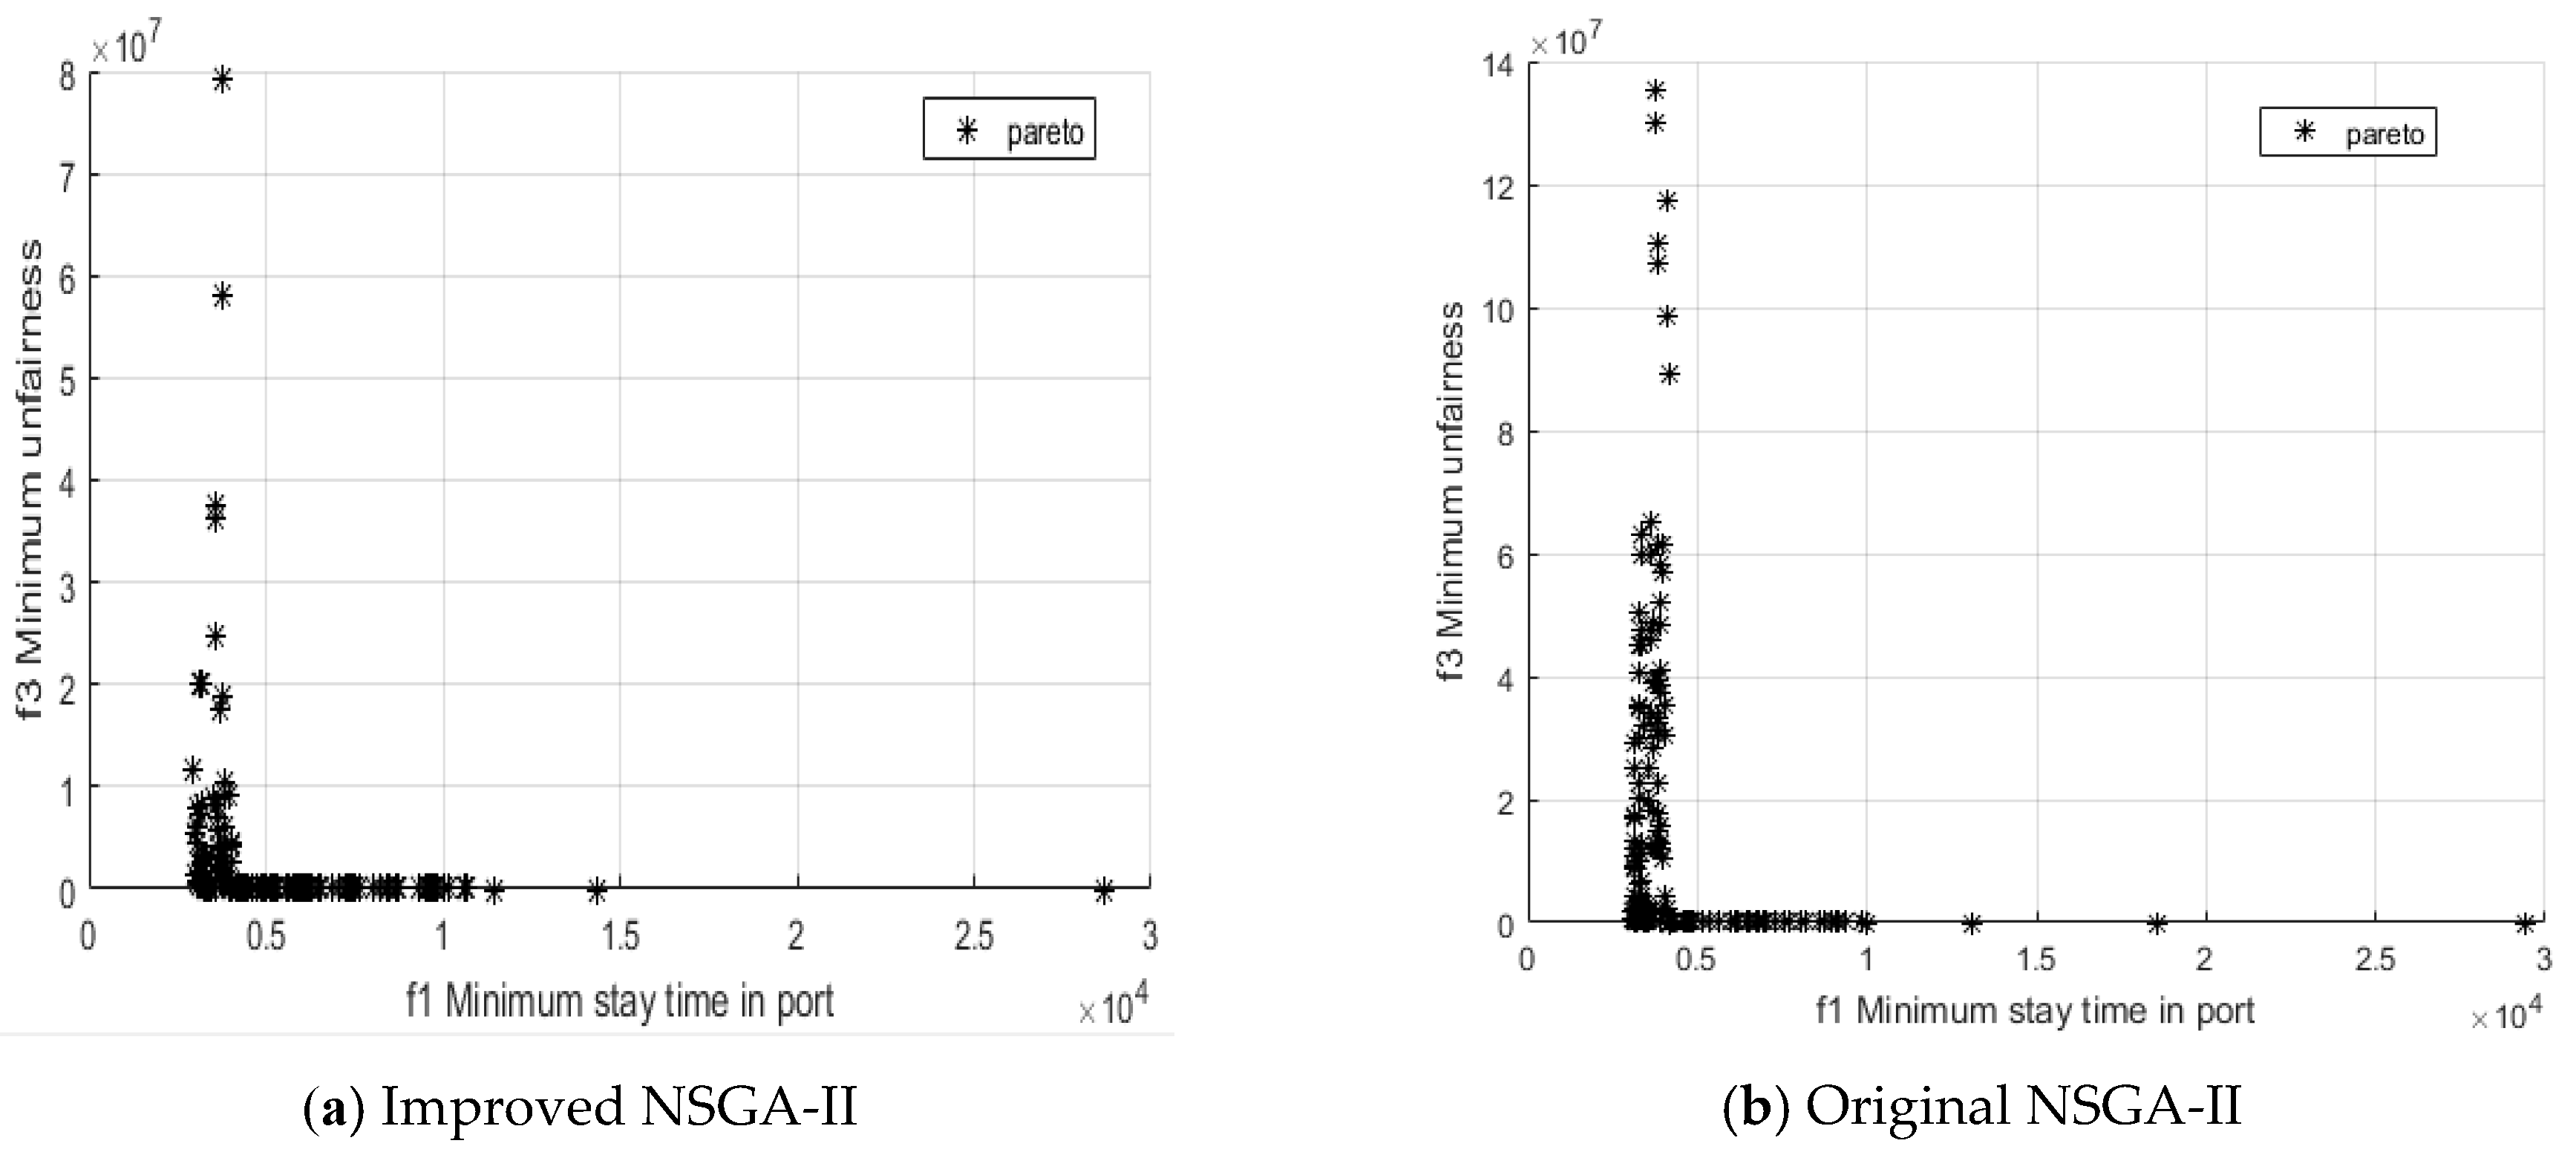
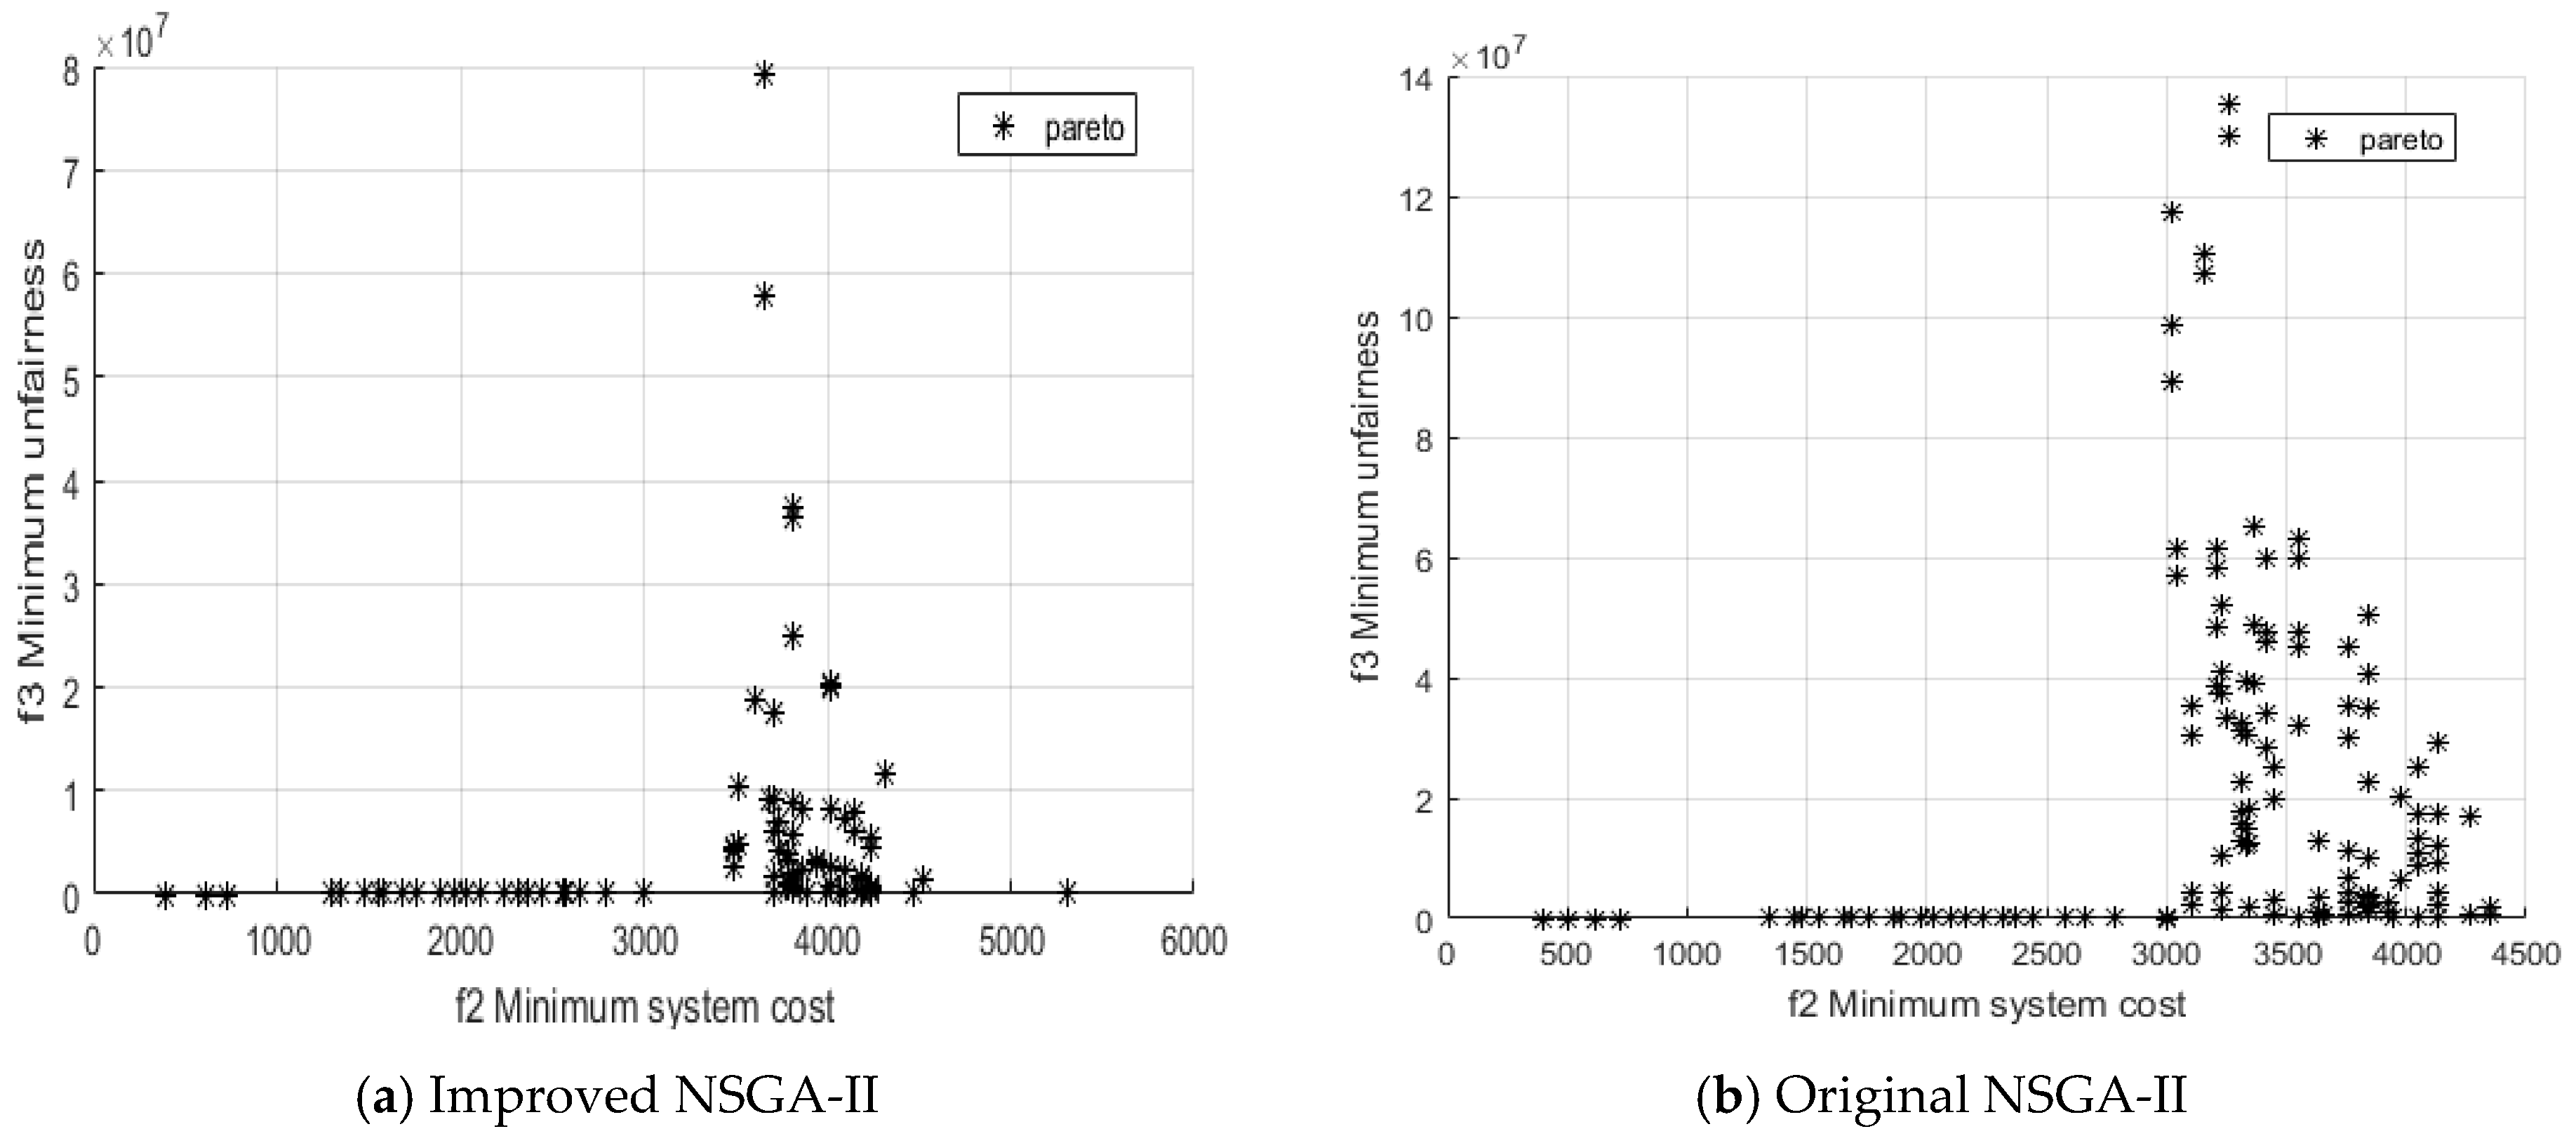
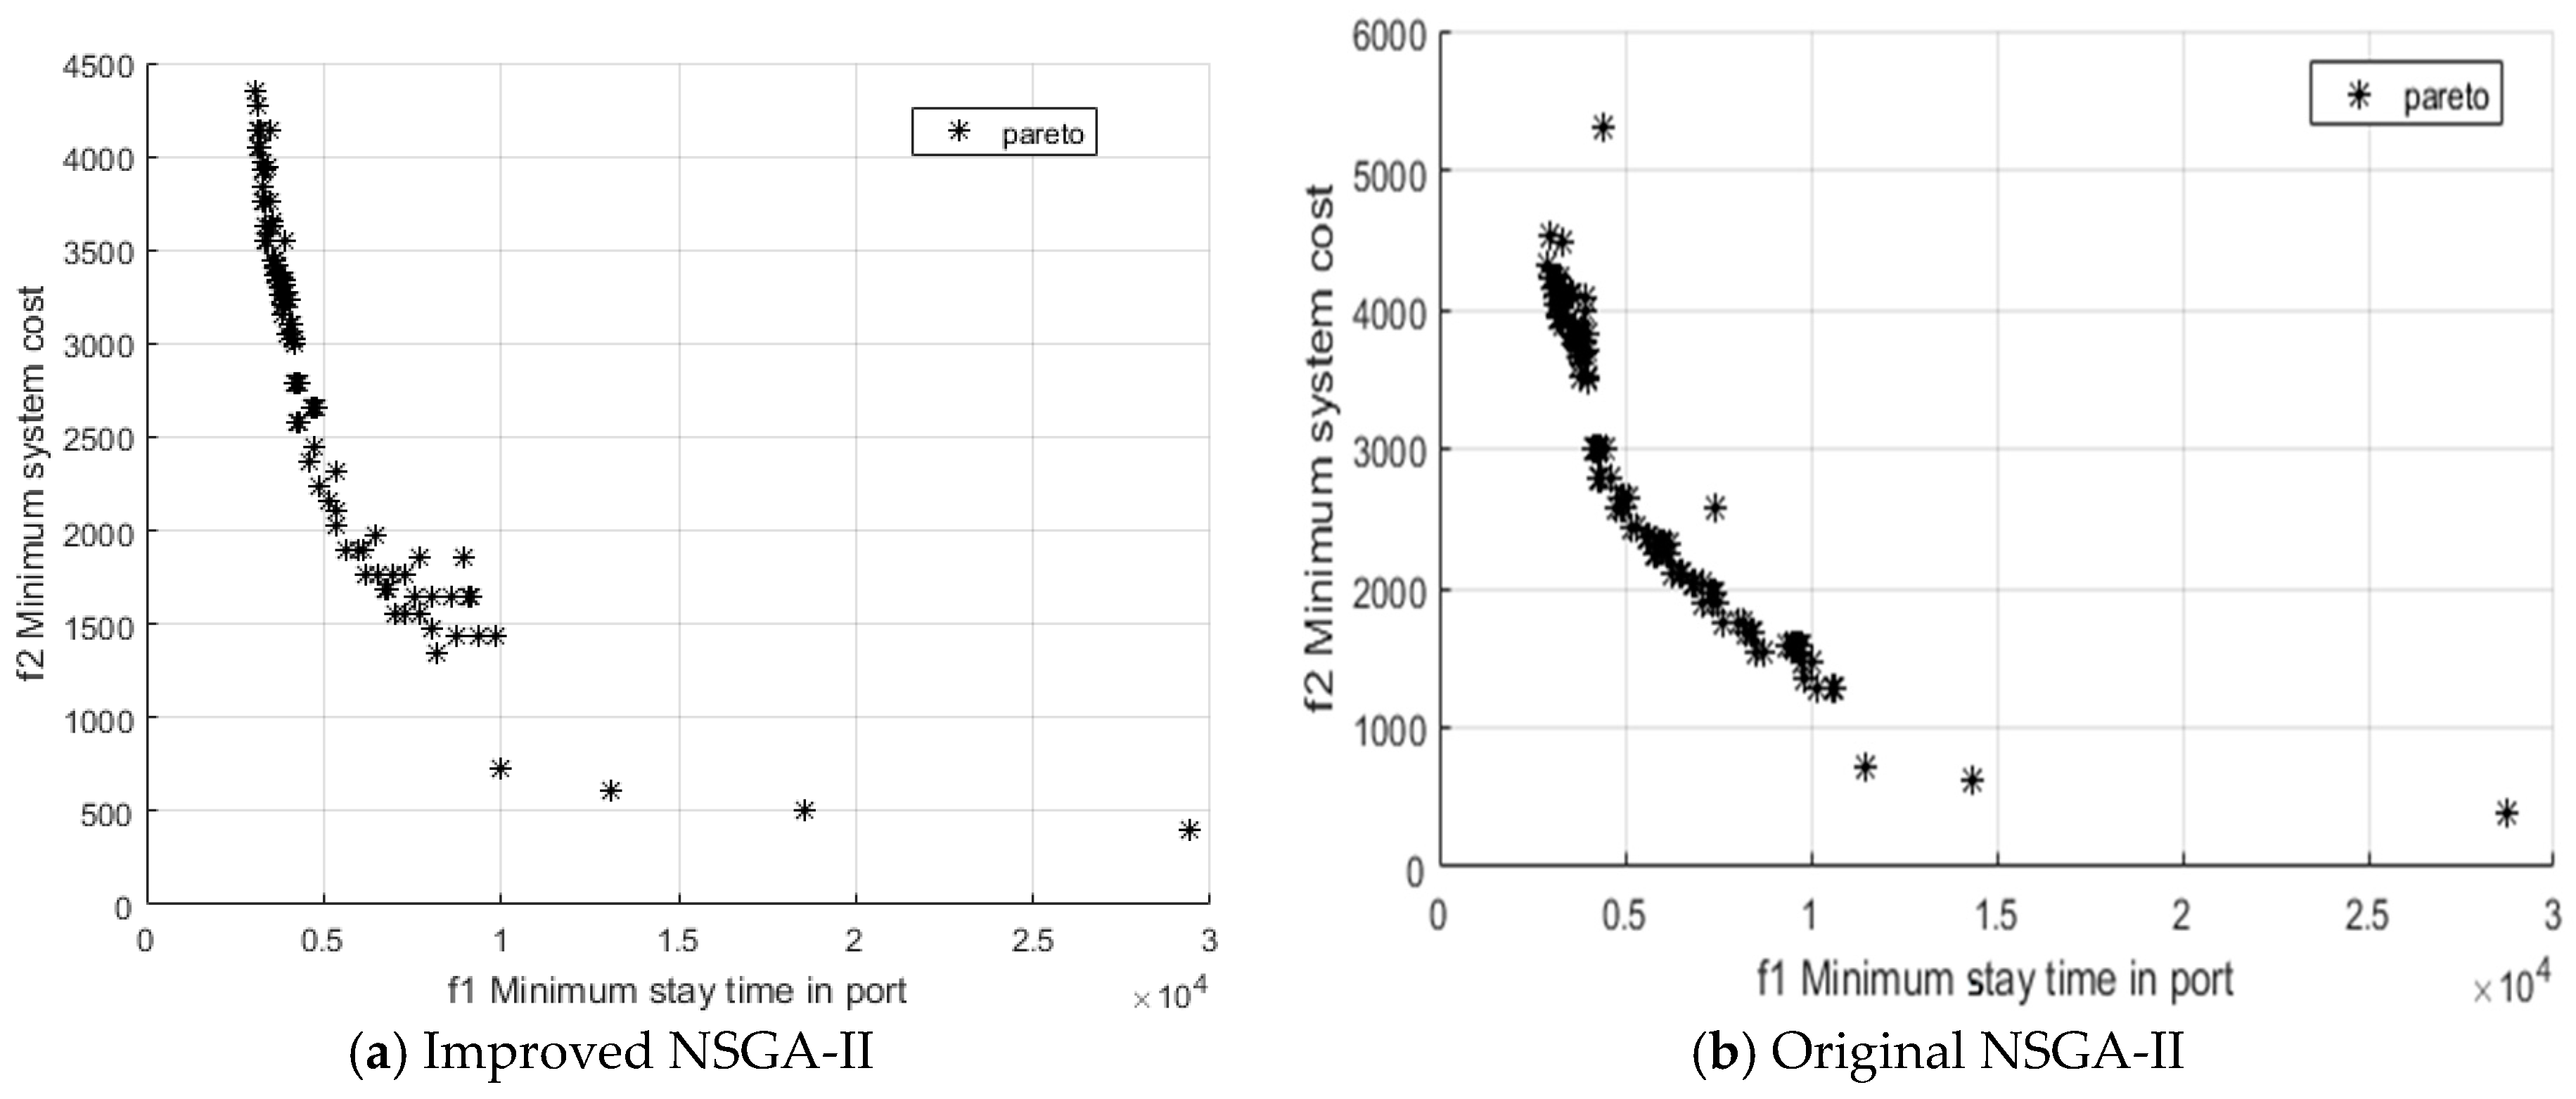
The comparative diagrams of the outputs of the proposed adaptive improved NSGA-II method and the original NSGA-II are shown in
Figure 9,
Figure 10 and
Figure 11.
As can be seen from
Figure 6,
Figure 7 and
Figure 8, the improved NSGA-II method, though declining in convergence rate, has been greatly improved in terms of optimization objectives. For example, for the shortest time in port, the proposed method converges at 2720 and the calculation result of the general (Original) NSGA-II is 3060. In order to illustrate the solution performance of our proposed method is stable, 20 times simulations on Windows 2007 MATLAB 2016b software were run. As far as the objective function f
1 is concerned, the statistical data and results show that there are 17 times of the improved NSGA-II method converge to 2720 ± 20, and the other three times are in the range of 2720 ± 50, which proves that the solution performance of our method is stable.
As can be seen from the comparison of
Figure 9,
Figure 10 and
Figure 11, the non-inferior solution set obtained by the proposed method is more likely to fall into the local optimum and the quality of the solution has also been greatly improved. When considering that the berths should be maximized and utilized, only the five groups of non-inferior solutions that were obtained by this method are listed below. The results of the joint allocation of berth-shore quays by GA are shown in
Table 6.
From
Table 6 and
Table 7, we can see that the method proposed in this paper can make the berths more effective (this paper considers three berths but only two berths are obtained by GA), while considering the comprehensive optimization of each objective. The shore bridge distribution is more balanced and reasonable.
6. Conclusions
To solve the problem of long waiting times for ships, the serious waste of resources that are caused by the unreasonable matching of the quayside and the unfair allocation of wharfs to berths, this paper discusses the joint scheduling problem of berthing and shore quays, and makes the following main contributions.
(1) A multi-objective mathematical model with the shortest time in port, minimum system total cost, and minimum inequity is constructed to provide a multi-objective optimization solution to the port problem.
(2) The introduction of random repair and adaptive operators to improve NSGA-II can effectively avoid falling into the local optimal and premature convergence problems, while improving the understanding of the search performance to ensure the diversity of the population.
(3) By comparing the results with the original NSGA-II and the GA algorithms with the actual example of a port terminal, the feasibility and effectiveness of the proposed method have been verified.
This paper proposes a joint berth-shore quay scheduling model to solve the problem of matching dock berths and shore quaysides by adopting the improved NSGA-II with random repair and adaptive operators. A Pareto frontier was obtained. Five sets of representative Pareto non-inferior solutions were selected in order to provide decision-making support to shipyard managers.
Author Contributions
Writing: A.L., H.L.(Haiyang Liu), S.-B.T.; Providing case and idea: A.L., H.L.(Haiyang Liu); Providing revised advice: S.-B.T., H.L.(Hui Lu), X.Z., J.W.
Funding
The study was supported by “Central University Science Research Foundation of China” (JB170609), “Research Fund from Key Laboratory of computer integrated manufacturing in Guangdong Province” (CIMSOF2016002), “State Key Laboratory for Manufacturing Systems Engineering (Xi’an Jiaotong University)” (sklms2017005), “China Postdoctoral Science Foundation funded project”(2016M590929), and “Shaanxi Natural Science Foundation Project” (2017JM7004) and Zhongshan City Science and Technology Bureau Project (No. 2017B1015).
Conflicts of Interest
The authors declare no conflict of interest.
References
- Kang, D.; Kim, S. Conceptual model development of sustainability practices: The case of port operations for collaboration and governance. Sustainability 2017, 9, 2333. [Google Scholar] [CrossRef]
- Han, X.L.; Gong, X.; Jo, J. A new continuous berth allocation and quay crane assignment model in container terminal. Comput. Ind. Eng. 2015, 89, 15–22. [Google Scholar] [CrossRef]
- Hu, Q.M.; Hu, Z.H.; Du, Y. Berth and quay-crane allocation problem considering fuel consumption and emissions from vessels. Comput. Ind. Eng. 2014, 70, 1–10. [Google Scholar] [CrossRef]
- Di Vaio, A.; Varriale, L. Management innovation for environmental sustainability in seaports: Managerial accounting instruments and training for competitive green ports beyond the regulations. Sustainability 2018, 10, 783. [Google Scholar] [CrossRef]
- Papaefthimiou, S.; Maragkogianni, A.; Andriosopoulos, K. Evaluation of cruise ships emissions in the Mediterranean basin: The case of Greek ports. Int. J. Sustain. Transp. 2016, 10, 985–994. [Google Scholar] [CrossRef]
- Chen, Z.; Pak, M. A Delphi analysis on green performance evaluation indices for ports in China. Marit. Policy Manag. 2017, 44, 537–550. [Google Scholar] [CrossRef]
- Schipper, C.A.; Vreugdenhil, H.; de Jong, M.P.C. A sustainability assessment of ports and port-city plans: Comparing ambitions with achievements. Transp. Res. Part D-Transp. Environ. 2017, 57, 84–111. [Google Scholar] [CrossRef]
- Asgari, N.; Hassani, A.; Jones, D.; Nguye, H.H. Sustainability ranking of the UK major ports: Methodology and case study. Transp. Res. Part E-Logist. Transp. Rev. 2015, 78, 19–39. [Google Scholar] [CrossRef] [Green Version]
- Frojan, P.; Correcher, J.F.; Alvarez-Valdes, R.; Koulouris, G.; Tamarit, J.M. The continuous berth allocation problem in a container terminal with multiple quays. Expert Syst. Appl. 2015, 42, 7356–7366. [Google Scholar] [CrossRef]
- Lun, Y.V.; Lai, K.H.; Wong, C.W.; Cheng, T.C. Environmental governance mechanisms in shipping firms and their environmental performance. Transp. Res. Part E-Logist. Transp. Rev. 2015, 78, 82–92. [Google Scholar]
- Rodrigues, V.S.; Pettit, S.; Harris, I.; Beresford, A.; Piecyk, M.; Yang, Z.; Ng, A. UK supply chain carbon mitigation strategies using alternative ports and multimodal freight transport operations. Transp. Res. Part E-Logist. Transp. Rev. 2015, 78, 40–56. [Google Scholar] [CrossRef] [Green Version]
- Yang, L.; Cai, Y.; Zhong, X.; Shi, Y.; Zhang, Z. A carbon emission evaluation for an integrated logistics system—A case study of the port of Shenzhen. Sustainability 2017, 9, 462. [Google Scholar] [CrossRef]
- Tang, M.; Gong, D.; Liu, S.; Zhang, H. Applying multi-phase particle swarm optimization to solve bulk cargo port scheduling problem. Adv. Prod. Eng. Manag. 2016, 11, 299. [Google Scholar] [CrossRef]
- Li, Q.; Huang, J.; Wang, C.; Lin, H.; Zhang, J.; Jiang, J.; Wang, B. Land development suitability evaluation of Pingtan island based on scenario analysis and landscape ecological quality evaluation. Sustainability 2017, 9, 1292. [Google Scholar] [CrossRef]
- Baiocchi, V.; Lelo, K.; Polettini, A.; Pomi, R. Land suitability for waste disposal in metropolitan areas. Waste Manag. Res. 2014, 32, 707–716. [Google Scholar] [CrossRef] [PubMed]
- Hamzeh, S.; Mokarram, M.; Haratian, A.; Bartholomeus, H.; Ligtenberg, A.; Bregt, A.K. Feature selection as a time and cost-saving approach for land suitability classification (case study of Shavur Plain, Iran). Agriculture 2016, 6, 52. [Google Scholar] [CrossRef]
- Azadnia, A.H.; Saman, M.Z.M.; Wong, K.Y. Sustainable supplier selection and order lot-sizing: An integrated multi-objective decision-making process. Int. J. Prod. Res. 2015, 53, 383–408. [Google Scholar] [CrossRef]
- Bai, C.; Fahimnia, B.; Sarkis, J. Sustainable transport fleet appraisal using a hybrid multi-objective decision making approach. Ann. Oper. Res. 2017, 250, 309–340. [Google Scholar] [CrossRef]
- Golias, M.; Portal, I.; Konur, D.; Kaisar, E.; Kolomvos, G. Robust berth scheduling at marine container terminals via hierarchical optimization. Comput. Oper. Res. 2014, 41, 412–422. [Google Scholar] [CrossRef]
- Robenek, T.; Umang, N.; Bierlaire, M.; Ropke, S. A branch-and-price algorithm to solve the integrated berth allocation and yard assignment problem in bulk ports. Eur. J. Oper. Res. 2014, 235, 399–411. [Google Scholar] [CrossRef] [Green Version]
- Xu, R.; Wu, W. Study on disruption management models of continuous berth allocation at Shipyard Jetties. J. Residuals Sci. Technol. 2016, 13. [Google Scholar] [CrossRef]
- Legato, P.; Mazza, R.M.; Gullì, D. Integrating tactical and operational berth allocation decisions via Simulation–Optimization. Comput. Ind. Eng. 2014, 78, 84–94. [Google Scholar] [CrossRef]
- Al-Dhaheri, N.; Jebali, A.; Diabat, A. A simulation-based Genetic Algorithm approach for the quay crane scheduling under uncertainty. Simul. Model. Pract. Theory 2016, 66, 122–138. [Google Scholar] [CrossRef]
- Tsai, S.B.; Yu, J.; Ma, L.; Luo, F.; Zhou, J.; Chen, Q.; Xu, L. A study on solving the production process problems of the photovoltaic cell industry. Renew. Sustain. Energy Rev. 2018, 82, 3546–3553. [Google Scholar] [CrossRef]
- Tsai, S.B.; Zhou, J.; Gao, Y.; Wang, J.; Li, G.; Zheng, Y.; Ren, P.; Xu, W. Combining FMEA with DEMATEL models to solve production process problems. PLoS ONE 2017. [Google Scholar] [CrossRef] [PubMed]
- Liu, W.; Wei, Q.; Huang, S.Q.; Tsai, S.B. Doing good again? A multilevel institutional perspective on corporate environmental responsibility and philanthropic strategy. Int. J. Environ. Res. Public Health 2017, 14, 1283. [Google Scholar] [CrossRef] [PubMed]
- Du, P.; Xu, L.; Chen, Q.; Tsai, S.B. Pricing competition on innovative product between innovator and entrant imitator facing strategic customers. Int. J. Prod. Res. 2016. [Google Scholar] [CrossRef]
- Xu, Y.; Chen, Q.; Quan, X. Robust berth scheduling with uncertain vessel delay and handling time. Ann. Oper. Res. 2012, 192, 123–140. [Google Scholar] [CrossRef]
- Zhen, L.; Lee, L.H.; Chew, E.P. A decision model for berth allocation under uncertainty. Eur. J. Oper. Res. 2011, 212, 54–68. [Google Scholar] [CrossRef]
- Monaco, M.F.; Sammarra, M. The berth allocation problem: A strong formulation solved by a lagrangean approach. Trans. Sci. 2007, 41, 265–280. [Google Scholar] [CrossRef]
- Lee, D.H.; Qiu Wang, H. Integrated discrete berth allocation and quay crane scheduling in port container terminals. Eng. Optim. 2010, 42, 747–761. [Google Scholar] [CrossRef]
- Imai, A.; Nishimura, E.; Papadimitriou, S. The dynamic berth allocation problem for a container port. Transp. Res. Part B 2005, 39, 401–417. [Google Scholar] [CrossRef]
- Han, X.; Lu, Z.; Xi, L. A proactive approach for simultaneous berth and quay crane scheduling problem with stochastic arrival and handling time. Eur. J. Oper. Res. 2010, 207, 1327–1340. [Google Scholar] [CrossRef]
- Kim, K.H.; Moon, K.C. Berth scheduling by simulated annealing. Transp. Res. Part B 2003, 37, 541–560. [Google Scholar] [CrossRef]
- Hsu, H.P. A HPSO for solving dynamic and discrete berth allocation problem and dynamic quay crane assignment problem simultaneously. Swarm Evol. Comput. 2016, 27, 156–168. [Google Scholar] [CrossRef]
- Oliveira, R.D. Clustering search for the berth allocation problem. Expert Syst. Appl. 2012, 39, 5499–5505. [Google Scholar] [CrossRef]
- Ting, C.J.; Wu, K.C.; Chou, H. Particle swarm optimization algorithm for the berth allocation problem. Expert Syst. Appl. 2014, 41, 1543–1550. [Google Scholar] [CrossRef]
- Imai, A.; Sun, X.; Nishimura, E.; Papadimitriou, S. Berth allocation in a container port: Using a continuous location space approach. Transp. Res. Part B 2008, 39, 199–221. [Google Scholar] [CrossRef]
- Umang, N.; Bierlaire, M.; Vacca, I. Exact and heuristic methods to solve the berth allocation problem in bulk ports. Transp. Res. Part E-Logist. Transp. Rev. 2013, 54, 14–31. [Google Scholar] [CrossRef] [Green Version]
© 2018 by the authors. Licensee MDPI, Basel, Switzerland. This article is an open access article distributed under the terms and conditions of the Creative Commons Attribution (CC BY) license (http://creativecommons.org/licenses/by/4.0/).


