Article

Key Features of Electric Vehicle Diffusion and Its Impact on the Korean Power Market

1
Korea Information Society Development Institute (KISDI), 18 Jeongtong-ro, Deoksan-myeon, Jincheon-gun, Chungchengbuk-do 27872, Korea
2
Department of Electrical and Computer Engineering, Seoul National University, 1 Gwanak-ro, Gwanak-gu, Seoul 08826, Korea
3
Department of Industrial Engineering, Graduate Program of Technology Management Economics and Policy (TEMEP), Seoul National University, 1 Gwanak-ro, Gwanak-gu, Seoul 08826, Korea
4
Graduate School of Business, Seoul National University, 1 Gwanak-ro, Gwanak-gu, Seoul 08826, Korea
*
Author to whom correspondence should be addressed.
Sustainability 2018, 10(6), 1941; https://doi.org/10.3390/su10061941
Submission received: 10 April 2018 / Revised: 21 May 2018 / Accepted: 7 June 2018 / Published: 10 June 2018
(This article belongs to the Section Economic and Business Aspects of Sustainability)

Abstract

:
The market share of electric vehicles is growing and the interest in these vehicles is rapidly increasing in industrialized countries. In the light of these circumstances, this study provides an integrated policy-making package, which includes key features for electric vehicle diffusion and its impact on the Korean power market. This research is based on a quantitative analysis with the following steps: (1) it analyzes drivers’ preferences for electric or traditional internal combustion engine (ICE) vehicles with respect to key automobile attributes and these key attributes indicate what policy makers should focus on; (2) it forecasts the achievable level of market share of electric vehicles in relation to improvements in their key attributes; and (3) it evaluates the impact of electric vehicle diffusion on the Korean power market based on an achievable level of market share with different charging demand profiles. Our results reveal the market share of electric vehicles can increase to around 40% of the total market share if the key features of electric vehicles reach a similar level to those of traditional vehicles. In this estimation, an increase in the power market’s system generation costs will reach around 10% of the cost in the baseline scenario, which differs slightly depending on charging demand profiles.

1. Introduction

Electric vehicles are a critical part of a sustainable society development, but the interest in electric vehicles in Korea until a few years ago was low due to their limited availability. However, electric vehicles have experienced increasing popularity recently and are now considered an important substitute for the internal combustion engine (ICE) vehicles [1]. In the wake of the release of Tesla’s Model 3, the increasing attention paid to electric vehicles is threatening the traditional ICE vehicle market. The dramatic changes in the car-making industry are often interpreted as realization of disruptive innovation, since the emergence of electric vehicles is creating a new market and value chain that could eventually disrupt the existing car market and value network [2]. The electric vehicle market growth could thus influence related industries or markets in a variety of forms that cannot easily be prejudged. However, even though this expectation might come true in the future, the real market share of electric vehicles until now falls short of anticipations.
Policy makers on environmental issues are grappling with the disappointing market share of electric vehicles. In this regard, there are research streams dealing with the demand forecasting of electric vehicles using stated preference data or substitution pattern analysis between electric and ICE vehicles [3]. However, experts have been arguing that the impact of electric vehicle diffusion would reach other related markets, as well as the traditional ICE car market [4]. For instance, the popularization of electric vehicles significantly influences the power market [5,6], as well as environmental issues [7,8]. In other words, the inter-industry effects of electric vehicle diffusion can be substantial both quantitatively and qualitatively, and this aspect should not be neglected in policy making for electric vehicle diffusion. However, despite its practical importance, few attempts have been made to determine the inter-industry impact of changes in the automobile industry caused by the emergence of electric vehicles and energy-related industries.
Electric vehicles use electricity to charge a battery as their energy source, whereas ICE vehicles use petroleum-based fossil fuels. This major difference between electric and traditional vehicles implies that electric vehicle diffusion is likely to lead to higher energy consumption, which inevitably impacts electricity demand on the power market. Although it is obvious that the popularization of electric vehicles affects power generation and the wholesale power market, little is known of the relationship between changes in the number of drivers who adopt electric vehicles and the power market equilibrium through increased electricity demand.
To understand the ripple effects of electric vehicle diffusion on the power market and prepare for unforeseen circumstances, quantitative analyses on the relationship between electric vehicle diffusion and increased electricity demand due to vehicle charging is vital, particularly for policy makers. Without clear government schemes and detailed plans to address the dramatic changes in electricity demand, a sudden increase in the power demand due to the need to charge electric vehicles is likely to cause confusion and, ultimately, lead to market failure.
This study thus provides an integrated policy making package that includes the key features for electric vehicle diffusion and its impact on the Korean power market based on quantitative analysis. The analysis steps are as follows: (1) this study analyzes drivers’ preferences for electric or traditional ICE vehicles with respect to key automobile attributes, such as maximum driving distance and charging station accessibility. These key attributes indicate what is to be focused on by policy makers. (2) The study also forecasts the achievable level of market share of electric vehicles in relation to improvements in the key attributes of electric vehicles. (3) Finally, the study evaluates the impact of electric vehicle diffusion on the Korean power market according to multiple scenarios of charging demand distribution. Methodologically, we adopt a discrete choice experiment using conjoint design and simulate an optimal power market operation model for the Korean power system with real generation data, which accurately replicates the practical Korean wholesale power market operation.
This study contributes to the literature in a number of ways. First, we analyze a random-coefficient logit model using a discrete choice experiment, which allows us to estimate the consumer utility function at the individual level and observe a realistic substitution pattern. Second, based on the conjoint analysis and market simulation, an optimal power market operation model successfully derives the net impact on the power industry of electric vehicle diffusion. We specify and implement a dozen scenarios according to charging time and season and conduct a simulation for each scenario. This approach to providing a policy making package for electric vehicle diffusion can be useful for policy makers in other countries that have conditions similar to Korea.

2. Literature Review

Various empirical studies have been conducted on consumer preferences for alternative fuel vehicles (AFVs) including electric vehicles. Particularly, discrete choice models using stated preference data are frequently adopted in previous studies, since AFVs are not sufficiently established in the automobile market to provide revealed preference data. As a pioneering study on demand forecasting of AFVs and its economic impact, Brownstone and Train [9] elicited customers’ preferences among gas, electric, methanol, and compressed natural gas (CNG) vehicles using various attributes: price, range, acceleration, top speed, pollution, size, luggage space, operating cost, and charging station availability. The authors noted the number of miles the vehicles can travel between recharging and the number of stations that have the capability to recharge the vehicles when capturing electric vehicle consumer preferences. However, such attributes remain major bottlenecks in electric vehicle diffusion both technologically and economically. Ewing and Sarigöllü [10] assessed consumer preferences for clean-fuel vehicles (CFVs) versus conventional ICE vehicles using a discrete choice experiment and applying a multinomial logit model. The results show that, although consumers evaluate environmental impacts positively, vehicle performance characteristics are critical to car selection. The authors also found that regulation was not sufficient to create a market for CFVs, and identified three market segments to which CFVs should be positioned and targeted. Horne et al. [11] empirically derived discrete choice models to identify key behavioral vehicle and commuting decision parameters from a survey of 1150 Canadian respondents. Using discrete choice models, the authors conducted simulations with carbon taxes, gasoline vehicle disincentives, and single occupancy vehicle disincentives to show how different policy levers can motivate technological change. The authors also used empirically-based choice models to portray uncertainty in technological change, costs, and emissions.
While computationally convenient, multinomial logit models exhibit a well-known and restrictive property-independence of irrelevant alternatives (IIA) [12]. This property states that the ratio of the probabilities for any two alternatives is independent of the existence and attributes of any other alternative. As a result of this property, the models necessarily predict that the introduction of a new alternative or elimination of an existing one changes the probabilities of other alternatives proportionately, such that the ratios of probabilities remain constant. This restriction has been noted as a major limitation of multinomial logit models because the results show unreliable substitution patterns between alternatives. In recent decades, studies have attempted to overcome the IIA property limitations and estimate consumer preferences in electric vehicle diffusion studies. For instance, Kim et al. [13] analyzed five fuel-type vehicles in their study using a mixed logit model to overcome IIA property restrictions. The estimation results show that preferences regarding fuel and body types are heterogeneous across consumers, while preferences for cost variables and horsepower are relatively homogeneous. The results also show that an indirect network effect exists, influencing automobile demand. The simulation results also indicate that diesel and hybrid vehicles will compete in the future for market share, with lower costs being the main source of competitiveness. Elasticity results show that fuel and maintenance costs are the most important factors influencing choice among alternative fuel vehicles and that the indirect network effect is also important. Ahn et al. [14] analyzed how adding alternative fuel passenger cars to the existing market will affect demand patterns for passenger cars. In their study, the authors applied a multiple discrete–continuous extreme value (MDCEV) model to successfully recover consumer heterogeneity by considering vehicle consumer choice and usage behaviors. The results showed gasoline-fueled cars would still be the first choice for most consumers, but alternative fuel passenger cars would offer a substitute to the purchase and use of gasoline-fueled or diesel-fueled cars. Finally, the results showed that adding alternative fuel cars to the market would lower gasoline and diesel fuel consumption and the emission of pollutants.
Recently, scholars have begun to show interest in inter-industry impacts triggered by electric vehicle diffusion, because electric vehicles have emerged as substitutes to ICE vehicles among AFVs. Shin et al. [15] studied the environmental impact following the introduction of electric vehicles and government initiatives using survey data on 250 households in South Korea. Their conclusion was that the market potential for electric vehicles is greater than that for hybrid, diesel, or gasoline vehicles and the impact of electric vehicle on CO2 emissions is greater than that of hybrid vehicles.
Increasing the charging demand of electric vehicles can however create issues related to a significant increase in power demand for the entire system and negative impacts on the local distribution network. Weiller [16] studied how different charging behaviors of plug-in hybrid electric vehicles (PHEVs) affect the electricity demand profile in the US. He developed a simulation algorithm for estimating the charging profiles with plug-in times and initial state-of-charge of batteries, finding that PHEV charging may increase the power system load by 560–910 W per vehicle, based on the developed estimation algorithm. Kiviluoma and Meiborn [17] estimated the costs and benefits of plug-in electric vehicles (PEVs) with consideration of their smart charging for the Finland power system. Detailed unit commitment and the economic dispatch model were used, based on the assumed power plants’ portfolios for the future system. Additionally, the authors focused on the elaborate modelling of PEVs’ charging patterns under various charging strategies, finding that the dumb charging of PEVs without any smart charging strategy can result in a new peak in net load and increase the need for reserve margin and generation flexibility. Wang et al. [18] simulated the total operating cost of the Illinois power system with different PHEV charging strategies, using a unit commitment model considering PHEV units. This study verified that smart controlled charging strategies by the central system operator can effectively reduce the total operating cost compared to unconstrained charging strategies. Foley et al. [19] evaluated the impact of electric vehicle charging on the Ireland power market with peak and off-peak time charging scenarios, based on a power market simulation model. The results showed that an off-peak charging strategy is more beneficial than peak charging, and charging 213,561 electric vehicles will increase the energy supply by 1.45%. Bozic and Pantos [20] investigated the impact of PEVs on the reliability of power systems, especially for reliability indices such as loss of load expectation (LOLE) and expected energy not served (EENS). The assessment was conducted based on an optimization model for charging and discharging decisions of PEVs. The results showed PEVs can be utilized to system reserve with suitable charging and discharging strategies, although increased system loading from uncontrolled PEVs may weaken system reliability. Dharmakeerthi et al. [21] further evaluated the impact of PEVs on voltage stability in a distribution network based on an original static load model. They discovered that PEV fast-charging stations may substantially aggravate steady-state voltage stability on some local nodes. Gray and Morsi [22] assessed the impact of electric vehicles on power quality in the distribution network. Under- and over-voltage deviations and transformer overloads were quantified using Monte Carlo simulation for different electric vehicle penetration scenarios. The results revealed the following key findings with certain simulation configurations: some buses in the secondary distribution network may experience under-voltage problems with increased penetration of electric vehicles and distribution transformers can be overloaded by the charging demand of electric vehicles.

3. Methodology

3.1. Model to Forecast the Market Share of Electric Vehicles and Willingness to Pay

3.1.1. Random–Coefficient Logit Model

To derive consumer utility function and estimate the willingness to pay (WTP) with conjoint data, this study uses a random–coefficient logit model based on a random utility framework among discrete choice models. Typically, a logit model presumes an unrealistic substitution pattern over alternatives and posits all consumers have the same preference structure for a certain alternative. To overcome this limitation, some studies introduced discrete point masses [23,24], which is a well-known latent class approach. A latent class logit model allows for separate subgroups or classes, each with its own set of coefficients, but all consumers in the same class are assumed to have the same regression coefficient vectors, which is also an unrealistic assumption. We use a random-coefficient logit model in this study because this model is successful in recovering heterogeneity by estimating the individual-level utility structure.
The random-coefficient logit model considers a choice model for individual i choosing one from among the j alternatives in each t choice occasion using a random utility framework [25]. The individual i ’s utility from alternative j in a choice occasion t that can be represented as follows:
U i j t = β i T x i j t + ε i j t
where x i j t is vector of covariates characterizing alternative j , β i a vector of the regression coefficients, and ε i j t a random term representing the unobserved portion of random utility assumed to have a type I iid extreme value distribution [26].
In a random-coefficient logit model, the individual level coefficient vector β i is assumed to follow a normal distribution, with mean vector b and variance–covariance matrix W . However, an unbounded normal distribution can be unrealistic for some attributes when all respondents have similar preferences. For instance, it is implausible to think consumers prefer to pay more to purchase a car if all other things including engine type, mileage, and available charging stations are equal. Thus, it is natural to assume that, ceteris paribus, consumers prefer cost-efficient products. When an attribute has such a characteristic, it is rational to assume another bounded distribution [27,28]. For instance, the coefficients on desirable and undesirable attributes can be forced to have a log-normal distribution. The log-normal distribution can be obtained from a transformation of normal β i using C = e x p ( β i ) and then changing the utility specification as follows:
U i j t = C ( β i ) T x i j t + ε i j t
Therefore, in a random-coefficient logit model, the probability of representative consumer choosing alternative j can be written as:
P j = ( exp ( β i x i j ) j exp ( β i x i j ) ) f ( β ) d β

3.1.2. Parameter Estimation Using Bayesian Gibbs Sampling

We estimate the above random-coefficient logit model using the Bayesian tradition based on Gibbs sampling, following previous studies [27,28]. Based on the model specification of utility function, assumption of error distribution, and individual level coefficients of attributes, full posterior as a multiplication of likelihood and prior distribution can be represented as follows:
p ( b , W , β i ,   i | Y ) = i L ( y i | β i ) p ( β i | b ,   W ) p ( b ,   W ) = i L ( y i | β i ) p ( β i | b ,   W ) p ( b ) p ( W )
where L ( y i | β i ) = i e x p ( β i T x i y i t ) j e x p ( β i T x i j t ) and prior distribution for β i is a multivariate normal distribution: p ( β i | b ,   W ) ~ M N ( b , W ) and the prior distributions of b and W are assumed to be p ( b ) ~ M N ( b 0 ,   s 0 ) and p ( W )   ~   I W ( v 1 ,   s 1 ) , where M N is a multivariate normal distribution with mean vector b 0 and variance-covariance matrix s 0 and I W is the inverse-Wishart distribution with scale matrix v 1 and degrees of freedom s 1 .
Since the full posterior p ( b , W , β i ,   i | Y ) does not have an analytic solution, Gibbs sampling can be applied to estimate parameters for β i , b , and W . These parameters are easily obtained through conjugate distribution, except β i . Using Gibbs sampling, we can easily determine the posterior distribution of each parameter. The detailed procedure for Bayesian random-coefficient logit estimation was described by Shim et al. and Jeong and Lee [27,28].
The estimated coefficients for the above model provide information on consumer preferences for a given attribute based on the random utility structure; that is, coefficients cannot directly provide information on marginal WTP (MWTP) or relative importance that has economic meaning. The median MWTP, by applying compensating variation theory, can be calculated as:
M e d i a n   M W T P k = M e d i a n   [ U i / x k U i / x p r i c e ] = M e d i a n   [ β i , k β i , p r i c e ]
where x k and x i , p r i c e represent attributes other than price and price attribute, respectively. Similarly, β i k and β i , p r i c e represent individual specific regression coefficients, excluding price and individual-specific coefficients other than price, respectively.
Undoubtedly, each attribute has a different impact when choosing an alternative, which is known as relative importance (RI). The average RI of attribute k can be calculated using the part-worth of each attribute as per Equation (6):
A v e r a g e   R I k = 1 N k = 1 N p a r t w o r t h k k p a r t w o r t h k × 100
where N is the total number of respondents and p a r t w o r t h k is the interval of attribute k ’s level β i .
Consequently, we can conduct a simulation on the market share of electric vehicles with estimated coefficients β i . As previously mentioned, the choice probability of customer i choosing alternative j is calculated using Equation (3). As a result, the average choice probability for an alternative across all customers is considered the market share of electric vehicles.

3.2. Model to Analyze the Impact on the Korean Power Industry

The diffusion of electric vehicles can increase total power system demand. To quantitatively analyze how the increase in power demand impacts the Korean power industry, the structure of the Korean power industry and operation mechanism of the power market should be understood. On the background of this understanding, an optimal power market operation model can be formulated with real generator data based on the practical rule of the Korean power market.

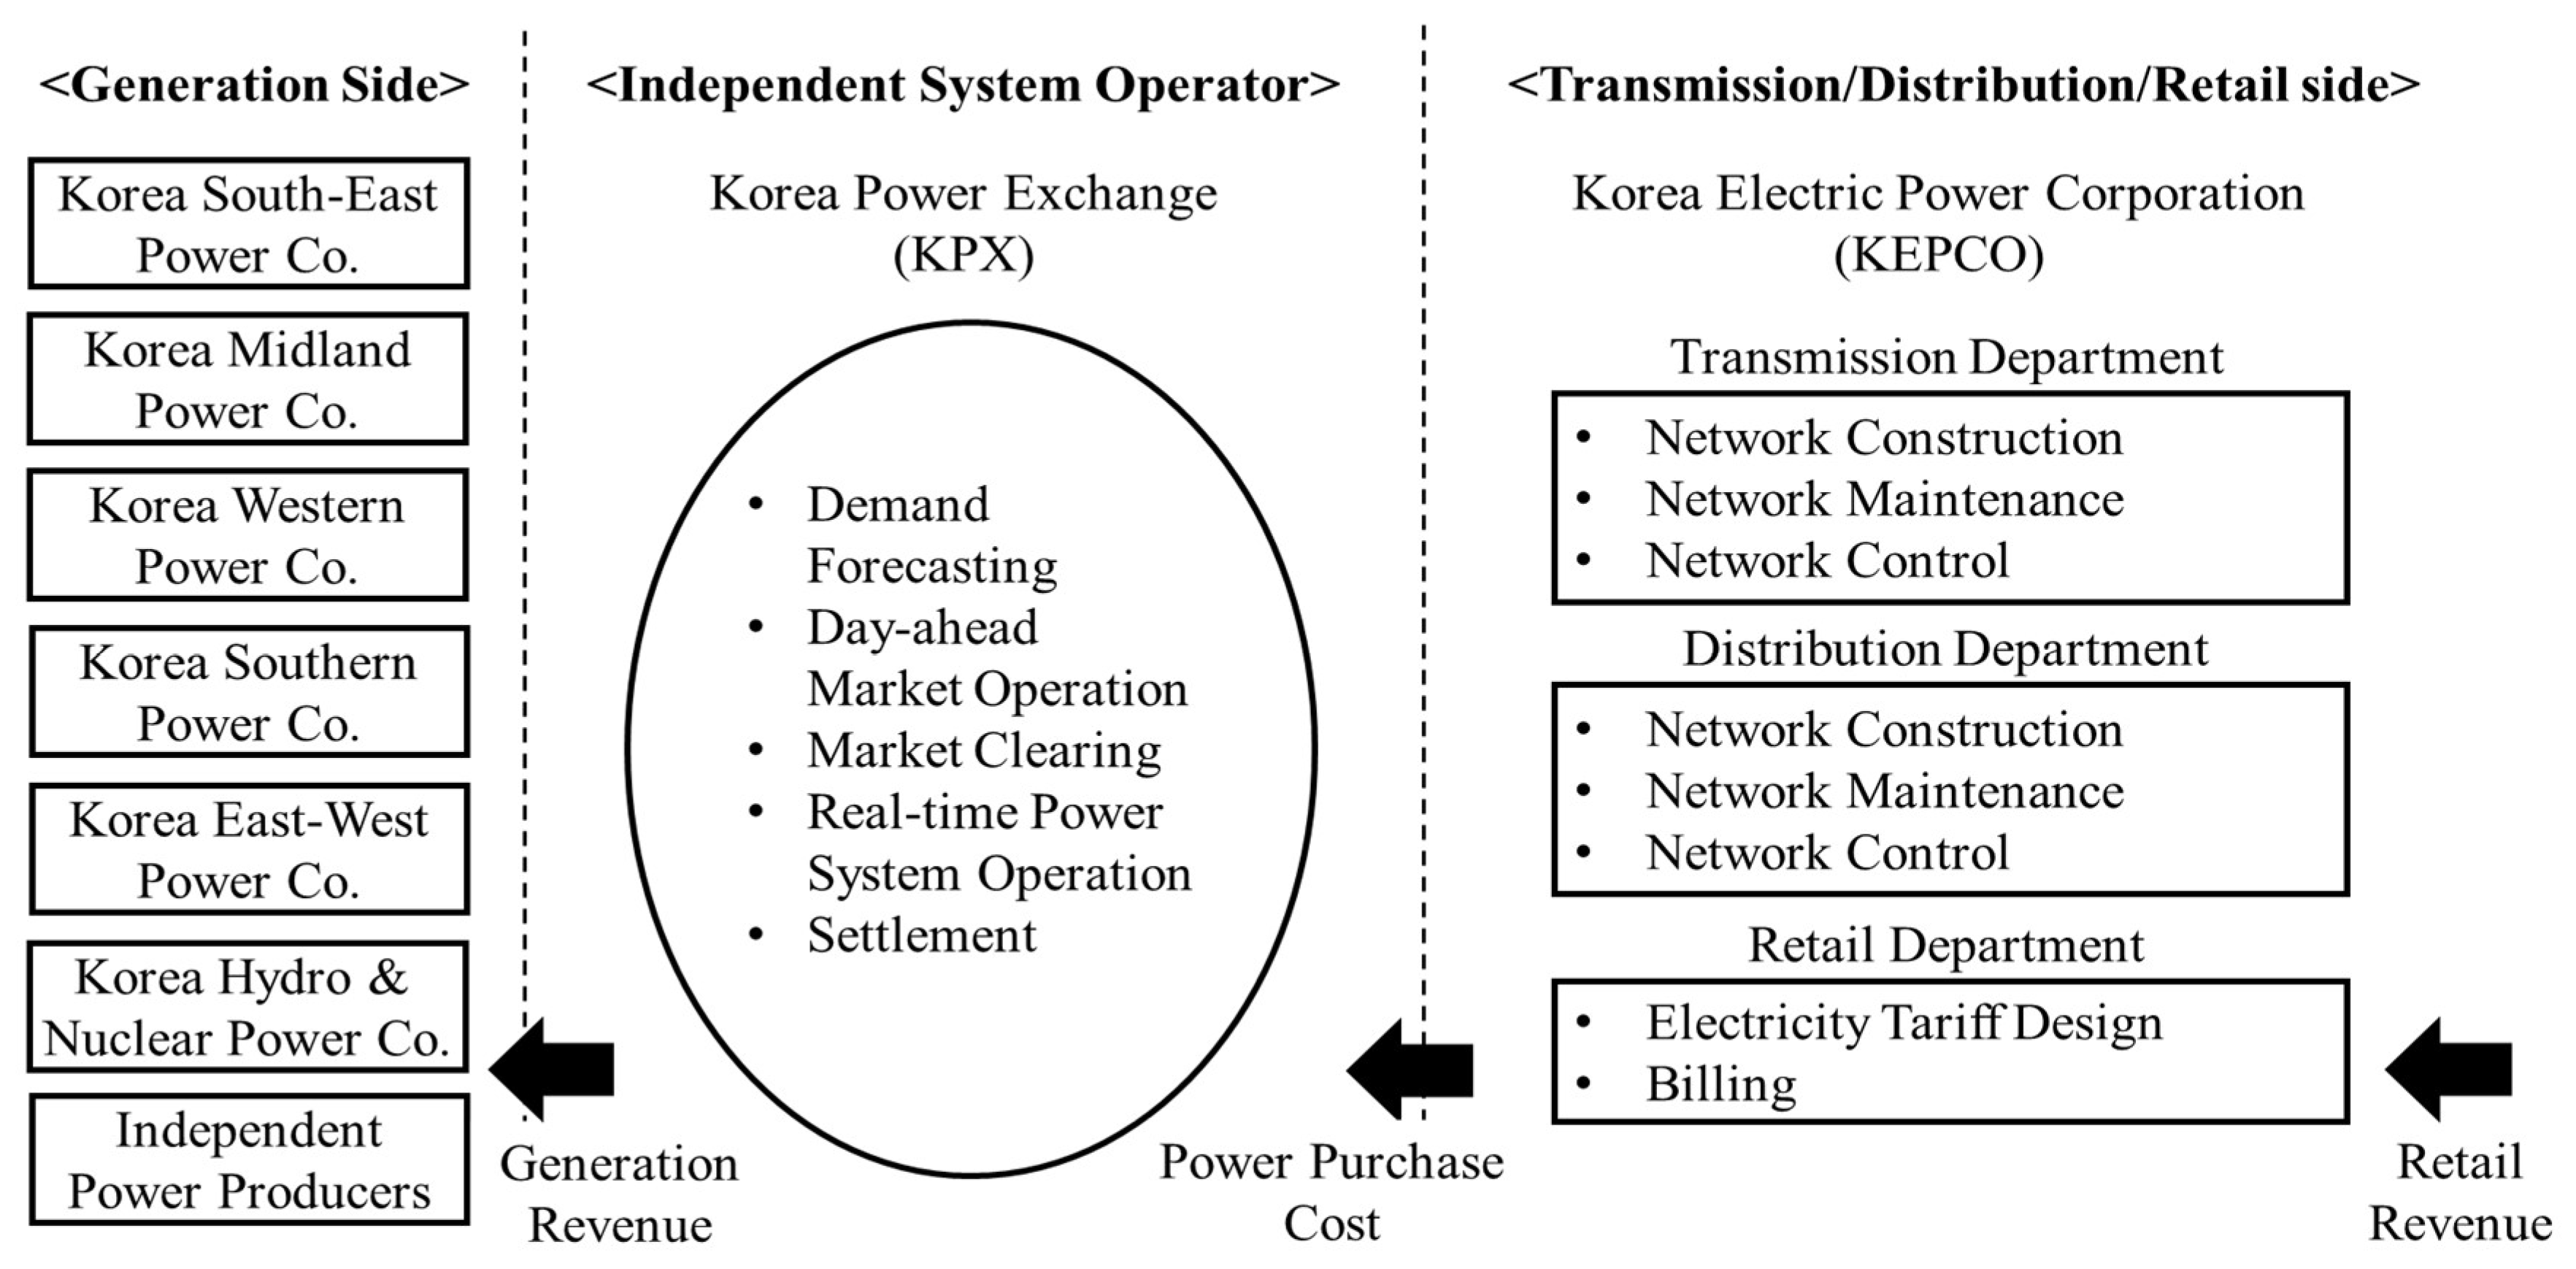
3.2.1. Structure of the Korean Power Industry

In May 2017, the total generation capacity of the Korean power system was 109,493 MW, which consisted of 23,116 MW nuclear generation, 32,708 MW coal generation, 4150 MW oil generation, 35,172 MW liquefied natural gas generation, 4700 MW hydro-pump, and the remaining 9648 MW includes renewable generation. The peak demand of 2016, excluding the demand of Jeju Island, was recorded as 79,940 MW in August [29].
After generation competition in the Korean power industry was introduced in early 2000, the structure of the Korean power industry has been shaped as shown in Figure 1. There are now six major public generation companies with base-load generations and several independent power producers mostly with on-peak generations on the generation side. The Korea Electric Power Corporation (KEPCO) is a vertically integrated monopolistic public company that owns transmission, distribution, and the retail side. Additionally, the Korea Power Exchange (KPX) is an independent system operator in charge of the power market and system operations. The generation companies participate in the wholesale power market of KPX as sellers of electricity. KEPCO, district electric power companies, and other large industrial customers purchase electricity through the power market. Because the retail department of KEPCO purchases an estimated 97% of exchange volume in KPX’s power market, we can state KEPCO holds a monopolistic position on the demand side of the market. KEPCO’s retail rate of electricity is determined under Korean government regulations, considering economic growth, consumer protection, and other political factors. Therefore, it is rational to assume the changes in the cost of generation are not instantly reflected in retail rates.

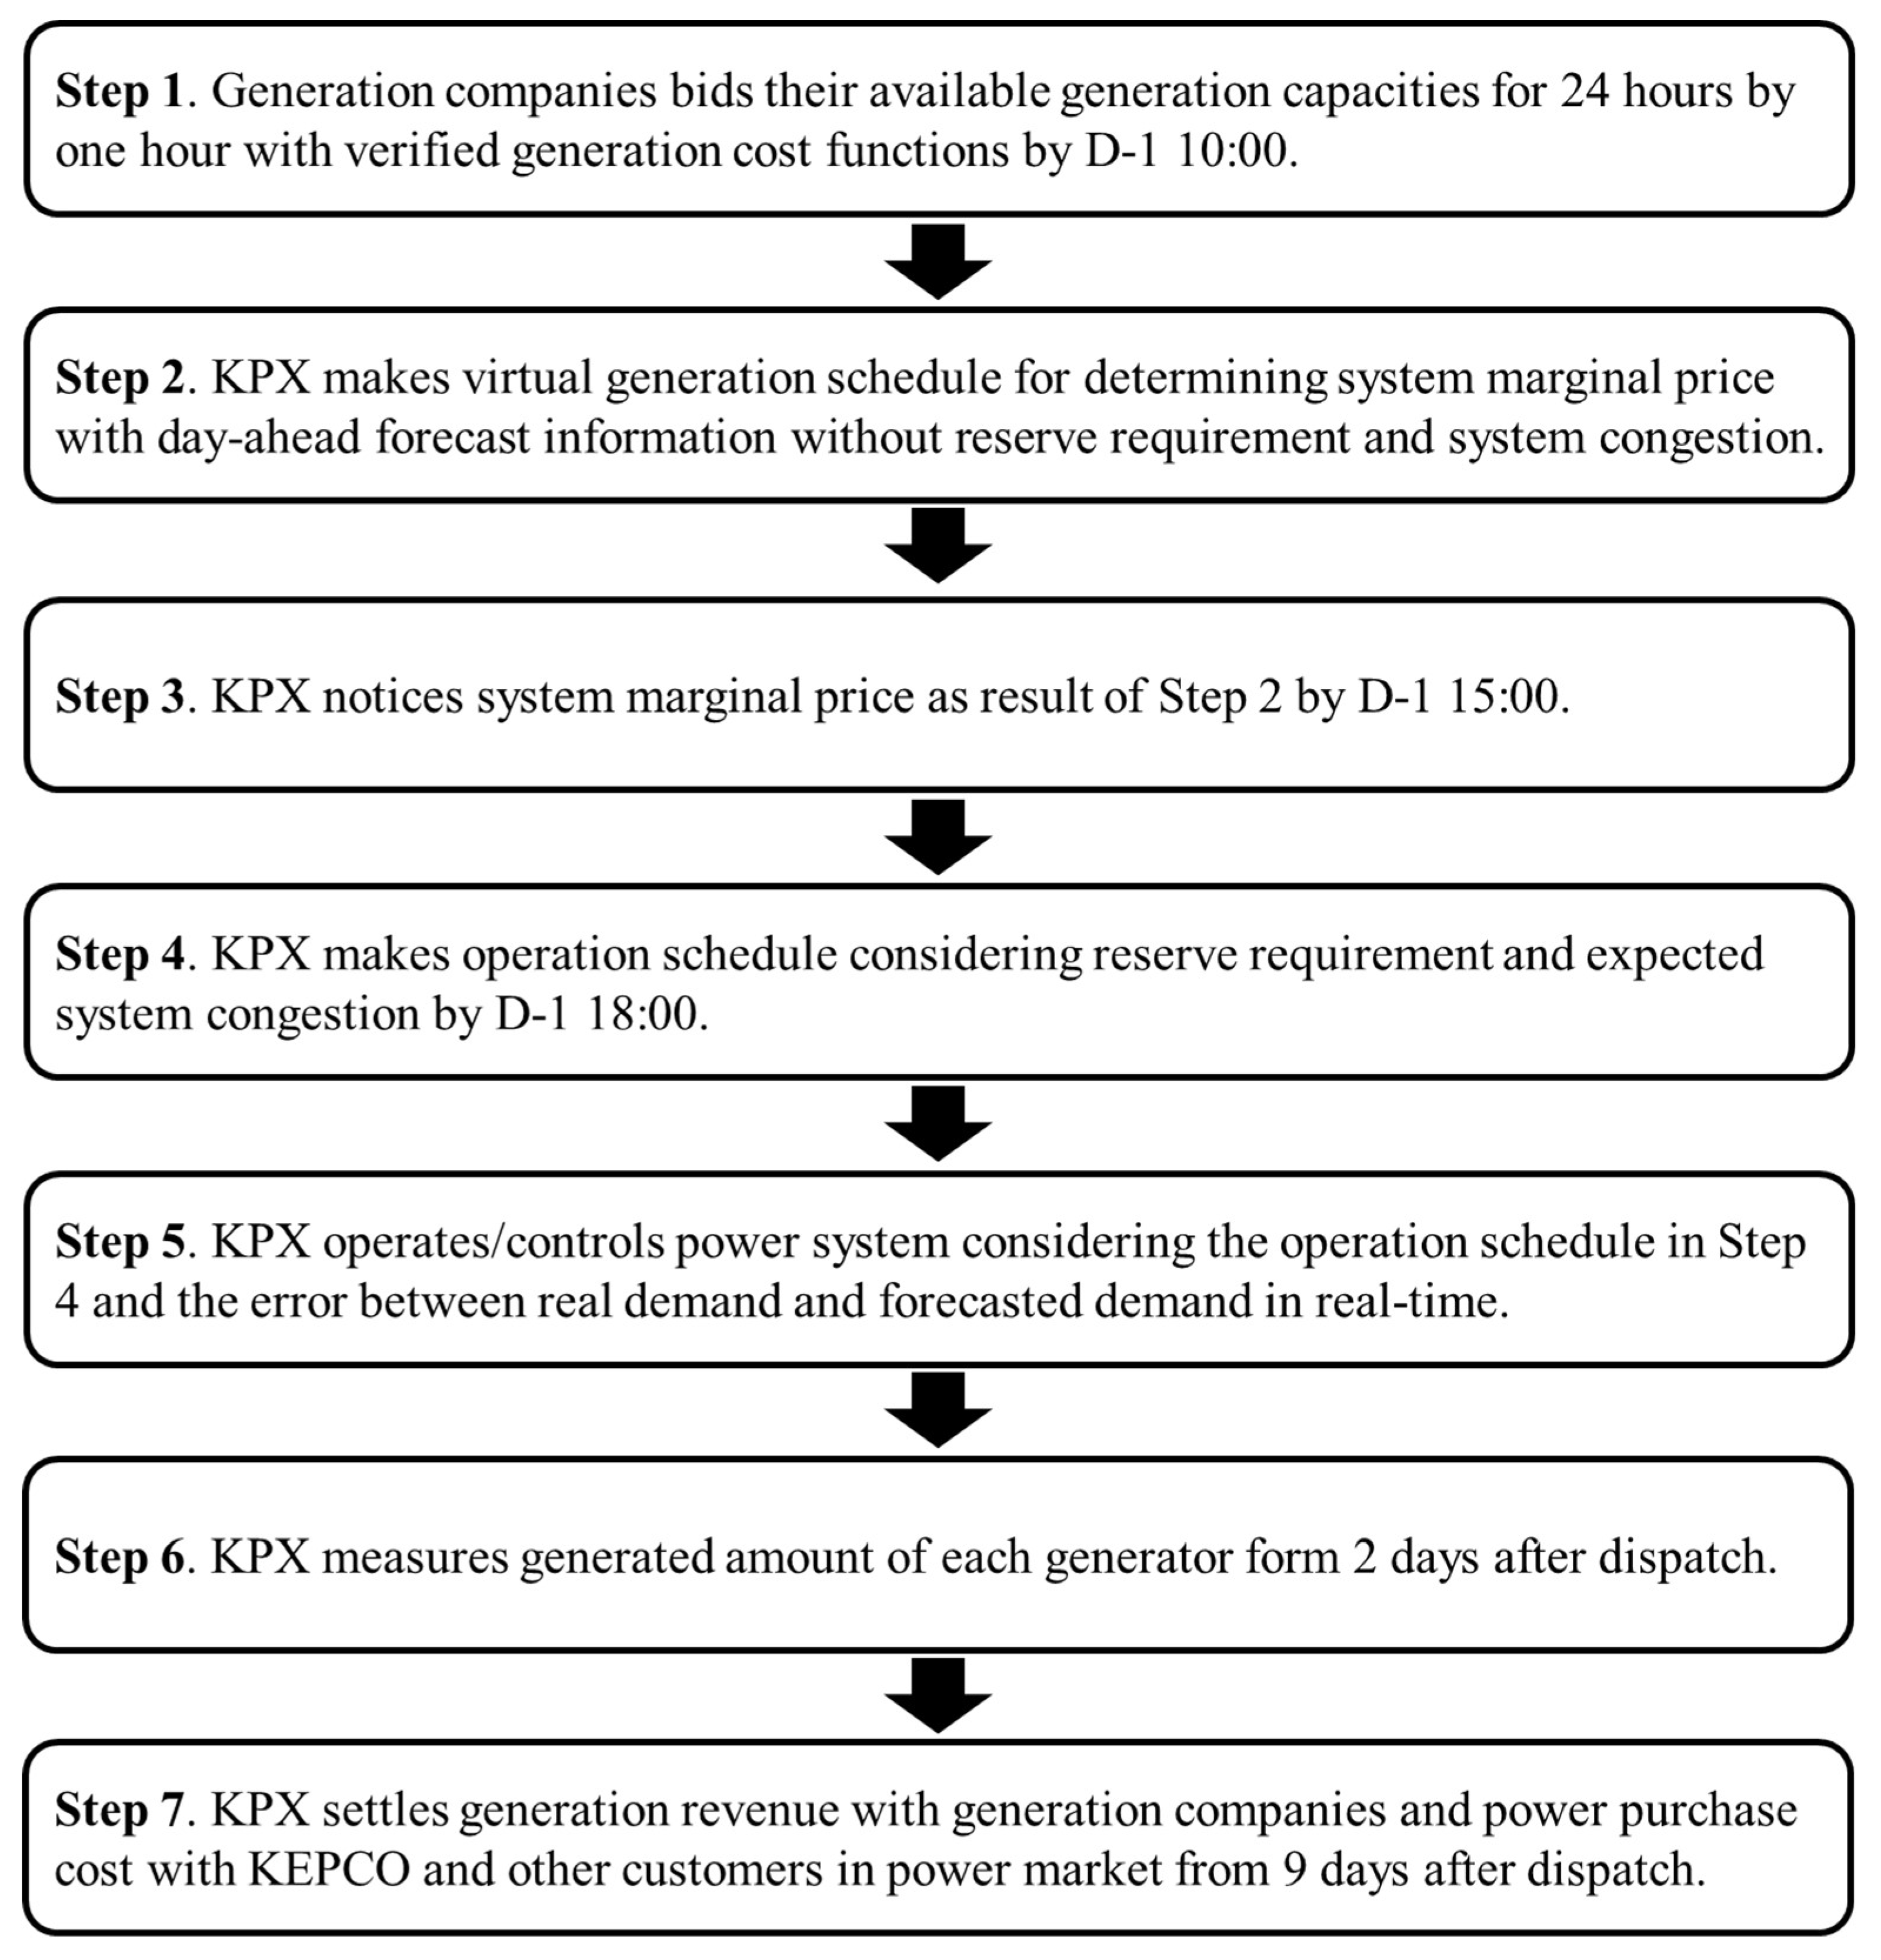
3.2.2. Korean Power Market Operation Mechanism

There is only a day-ahead market, operated by KPX, and the real-time system operation is conducted at the discretion of KPX instead of market mechanisms. The day-ahead market is operated according to a process based on cost-based pool (CBP) mechanisms as follows.
Under the CBP mechanism, generation companies only bid their available capacities by submitting verified generation cost functions, instead of bidding prices in Step 1 in Figure 2. By creating a virtual generation schedule in Step 2, KPX finds an optimal generation schedule for minimizing system generation cost according to the economic dispatch principle based on the submitted available capacities of generators and day-ahead forecasted demand. As a result of Step 2, the stacks of generators starting from the one with the lowest to the one with the highest marginal costs are determined for each hour. The generator located on the top of the stack for each hour is called the marginal generator and its marginal cost is equal to the system marginal price in Step 3 for each hour. Additionally, the optimal virtual system generation cost is also determined in Step 2. In Step 4, the virtual generation schedule is adjusted considering the reserve requirement and potential system congestion. Some generators, ordered to secure a generating margin to provide reserves, decrease their scheduled generation volume during this step. Because the shortage of scheduled generation volume occurs from this adjustment process, KPX optimally secures more generators with higher marginal cost than the system marginal price to meet the forecasted demand on the stack for each hour. The final operation schedule after this adjustment is used for real system operation. Therefore, to estimate the exact system generation cost, the cost in Step 4 should be calculated rather than the cost in Step 2, in principle.
To conduct a simulation for the optimal operation of the Korean power market, the use of the unit commitment technique is required, which can be modeled using the mixed integer linear programming problem as in the study of Frangioni et al. [30].

3.2.3. Impact Measurement of Electric Vehicle Diffusion on the Korean Power Market

Electric vehicle diffusion can affect some layers in the value chain of the power industry by increasing power demand. An increase in power demand can increase the total net revenue on the generation side and the yearly increment, R G E N , can be calculated as follows:
R G E N = d = 1 365 h = 1 24 [ S M P ( d , h ) ( D S Y S ( d , h ) + D E V ( d , h ) C S Y S ( d , h ) ] d = 1 365 h = 1 24 [ S M P ( d , h ) D S Y S ( d , h ) C S Y S ( d , h ) ]
where S M P ( d , h ) and S M P ( d , h ) are system marginal prices calculated based on the market and system operation process on the Korean power market with/without electric vehicles at the h -th hour of the d -th day, respectively; C S Y S ( d , h ) and C S Y S ( d , h ) are system generation costs with/without electric vehicles at the h -th hour of the d -th day, respectively; D S Y S ( d , h ) is the total power demand in the power system without any electric vehicles at the h -th hour of the d -th day; and D E V ( d , h ) is total charging demand of electric vehicles at the h -th hour of the d -th day. KEPCO, as a monopoly retail company, purchases power from generation companies on the wholesale market and sells power to customers at retail rates. The power purchase cost of KEPCO on the power market can be increased by electric vehicle diffusion. This increment in KEPCO’s yearly power purchase cost, C P P , can be modelled as follows:
C P P = d = 1 365 h = 1 24 [ S M P ( d , h ) ( D S Y S ( d , h ) + D E V ( d , h ) ) S M P ( d , h ) D S Y S ( d , h ) ]
The yearly industry-wise incremental cost, C I N D , caused by electric vehicle diffusion can be obtained from the net summation of changes in the net revenue of the generation side and power purchase cost of KEPCO as follows:
C I N D = C P P R G E N = d = 1 365 h = 1 24 [ S M P ( d , h ) ( D S Y S ( d , h ) + D E V ( d , h ) ) S M P ( d , h ) D S Y S ( d , h ) ] d = 1 365 h = 1 24 [ S M P ( d , h ) ( D S Y S ( d , h ) + D E V ( d , h ) C S Y S ( d , h ) ] + d = 1 365 h = 1 24 [ S M P ( d , h ) D S Y S ( d , h ) C S Y S ( d , h ) ] = d = 1 365 h = 1 24 [ C S Y S ( d , h ) C S Y S ( d , h ) ] = C S Y S
According to Equation (8), the yearly industry-wise incremental cost by the diffusion of electric vehicles equals the increment in the system operation cost. Therefore, the impact of electric vehicle diffusion can be measured by calculating the changes in the system generation cost, C S Y S . However, although C S Y S should be calculated exactly by obtaining the system generation cost in Step 4 in Figure 2, the virtual system generation cost can be used for simplicity, to estimate the change under the assumption that electric vehicle diffusion does not affect reserve requirements and system congestion.

4. Empirical Analysis

The empirical analysis is composed of two steps. The first step estimates the random-coefficient logit model using conjoint survey data to understand the consumer preference structure and predict the achievable level of vehicle market shares, including the market share for electric vehicles. The second step estimates the net impact of electric vehicle diffusion on the Korean power market by calculating the change in system generation cost of the Korean power market according to the electric vehicle diffusion scenarios.

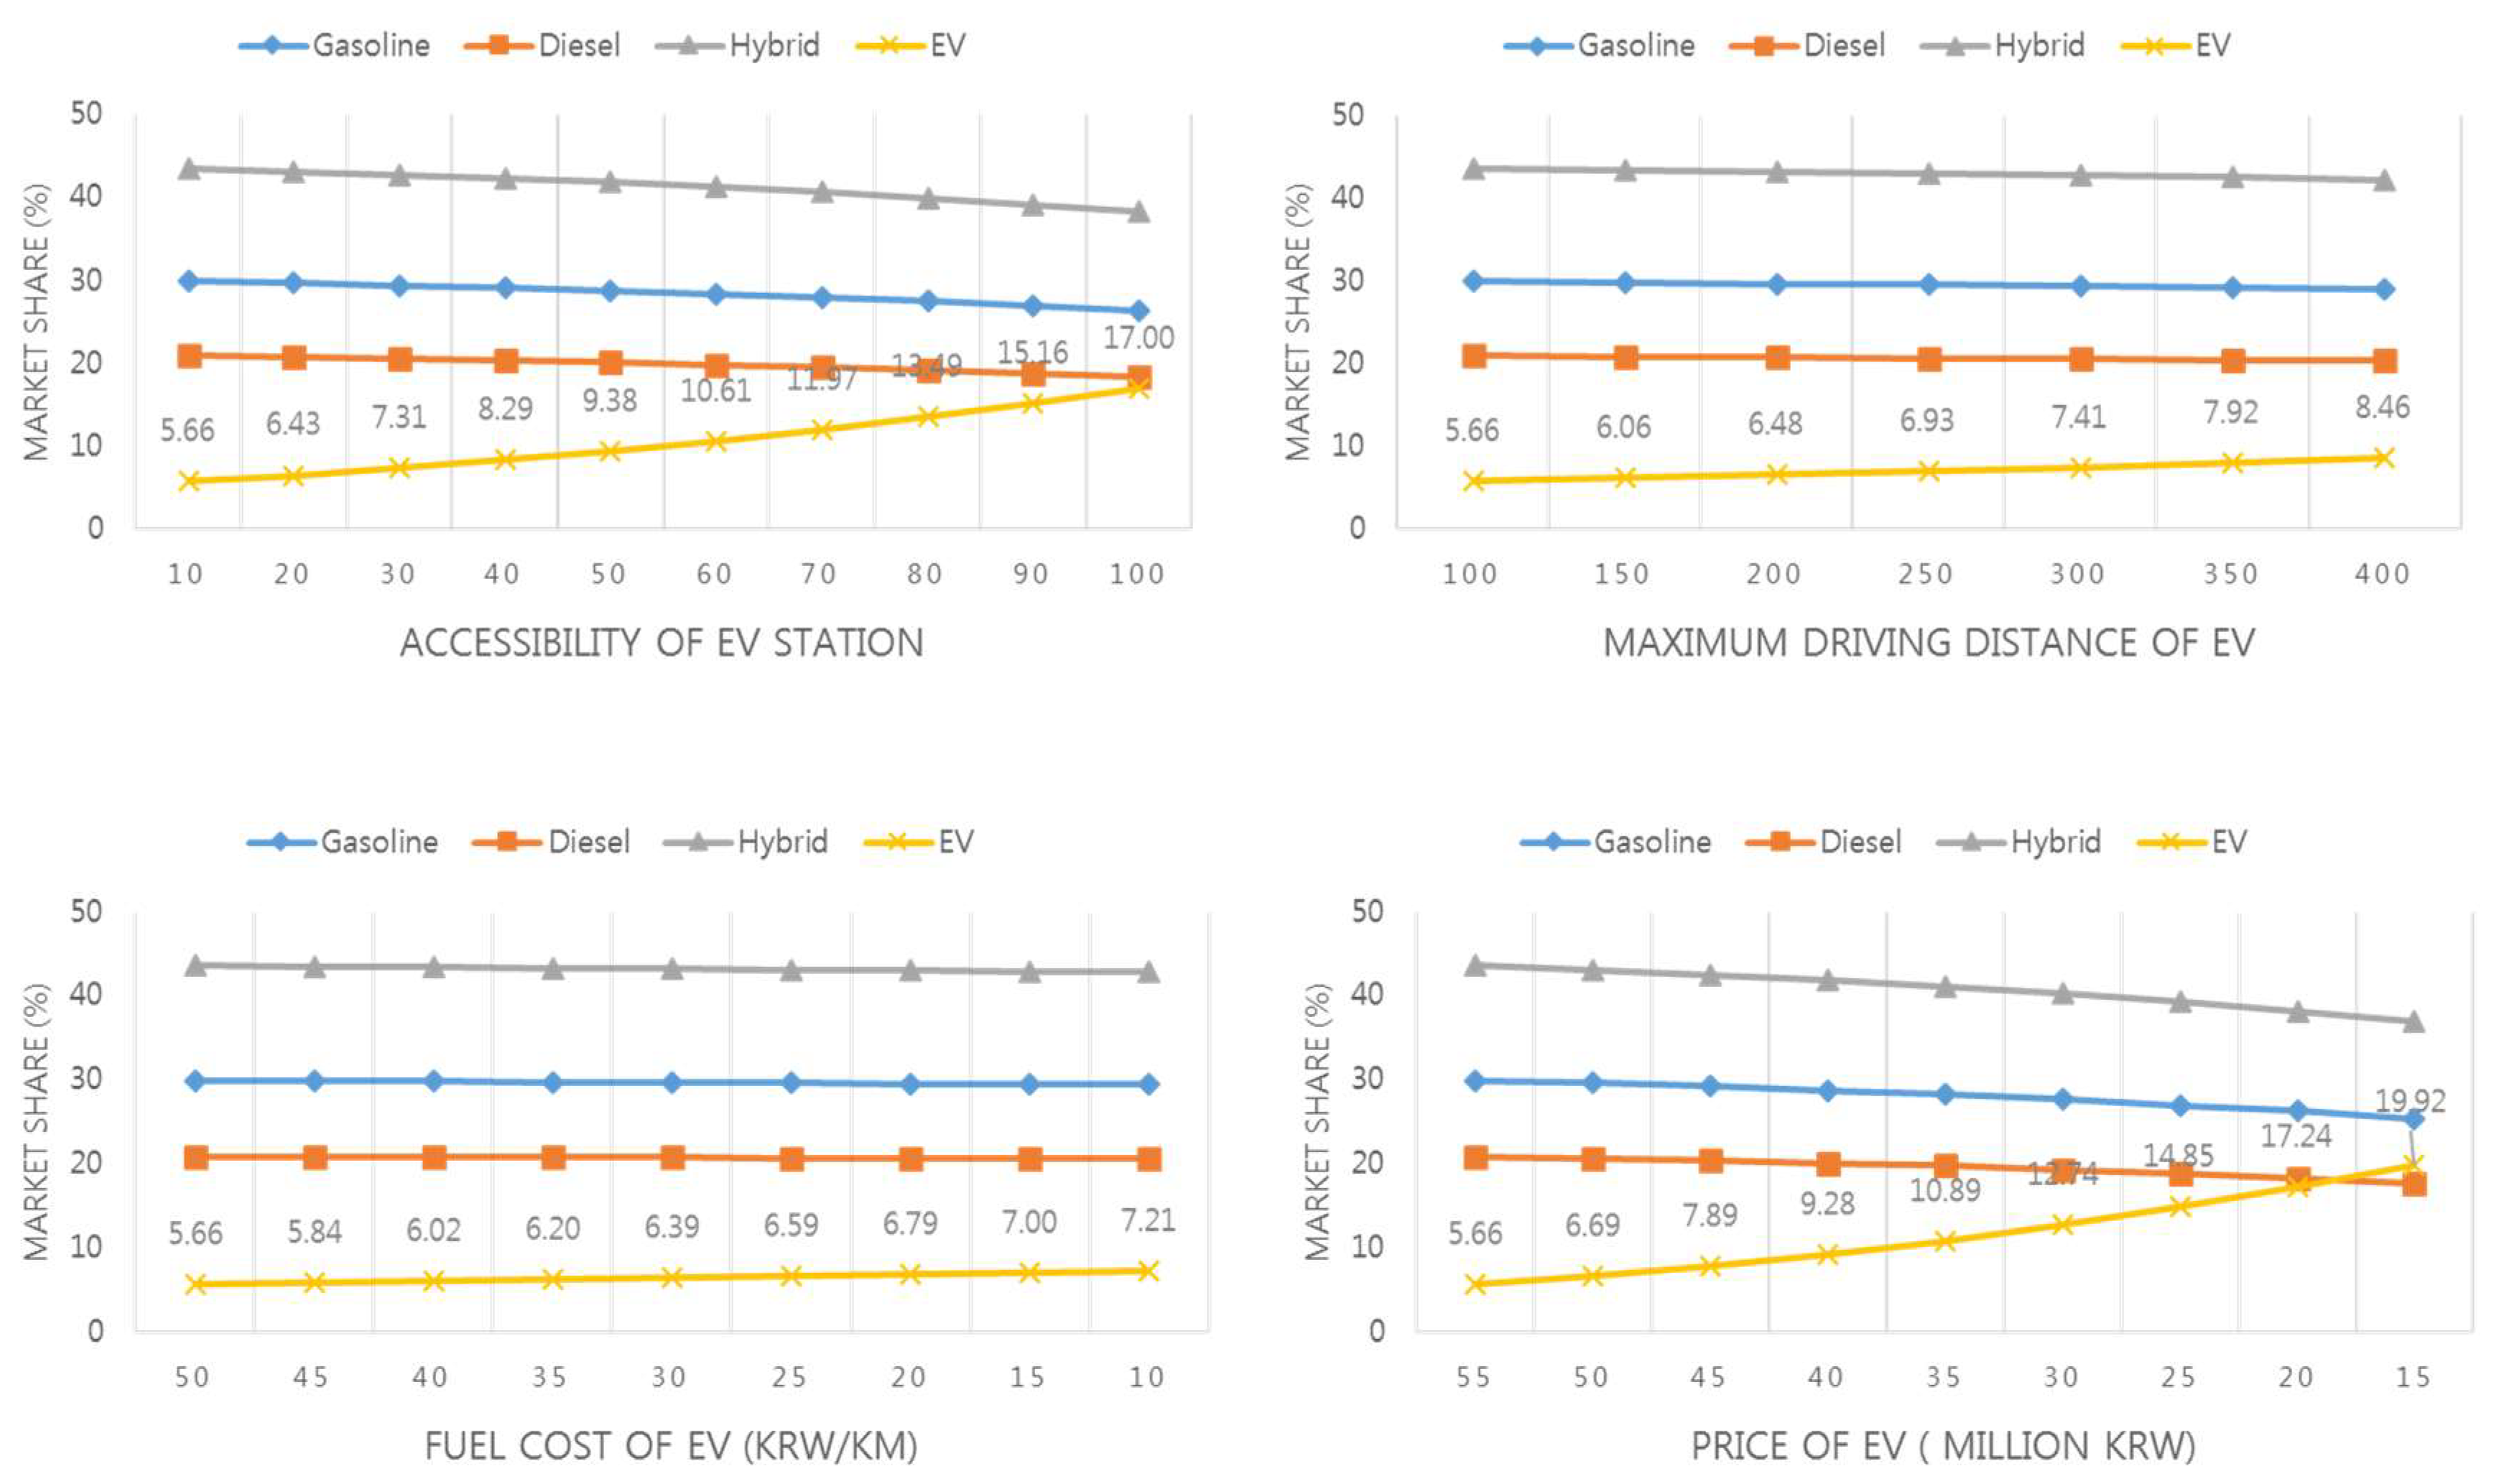
4.1. Consumer Preference Analysis and Automobile Market Simulation

The conjoint data were collected during February 2017 by a specialized research company from 724 households that owned at least one vehicle and the respondent had a driving license. The sample was selected using purposive quota sampling for each region, age, and income level. Table 1 represents the socio-demographics characteristics of respondents.
Based on the McFadden’s random utility theory [25], the individual consumer utility function can be described as follows:
U i = β i , 1 x D I E S E L + β i , 2 x H Y B R I D + β i , 3 x E V + β i , 4 x A C C E S S + β i , 5 x D I S T A N C E + β i , 6 x F U E L + β i , 7 x P R I C E
where x D I E S E L , x H Y B R I D and x E V are dummy variables representing fuel types for diesel, hybrid, and electric vehicles, respectively. The coefficients of these fuel type dummy variables represent the relative preference over a gasoline vehicle. For instance, if the estimated value of β 1 is positive and significant, it shows consumers prefer diesel over gasoline vehicles. x A C C E S S , x D I S T A N C E , x F U E L and x P R I C E represent accessibility of charging stations, maximum driving distance per refueling, fuel cost, and price of vehicle, respectively. Table 2 shows more specific information on each attribute and level.
Section 3.1 shows that the coefficients of some variables are forced to follow log-normal or negative log-normal distributions when it is natural to assume that all consumers prefer or do not prefer to increase the level of a certain attribute. For instance, all consumers would appreciate an increase in the accessibility of charging stations and in maximum driving distances, but dislike an increase in fuel cost or vehicle price. For parameter estimation, we conducted Gibbs sampling and drew 20,000 samples. We discarded the first 10,000 samples as a burn-in period and used the subsequent 10,000 samples for parameter inference. Table 3 represents the estimation results of consumer preference for key attributes.
In terms of beta means, all parameters are statistically significant. The results related to fuel types show consumers prefer gasoline to diesel vehicles and hybrid and electric to gasoline vehicles. These results are similar to the findings of Hong et al. [31], except for our finding that electric vehicles are preferable to gasoline vehicles. The explanation of Hong et al. [31] was that most consumers had no experience with electric vehicles in 2009. However, our results imply consumers perceive a clear distinction between an electric and a gasoline vehicle, and prefer electric vehicles. The means of coefficients on accessibility to charging stations and maximum driving distance are positive, as expected, while fuel cost and vehicle price carry a negative value.
For relative importance, we found consumers consider the price of vehicles and accessibility to charging stations to be the most important factors. Given that accessibility to electric vehicle charging stations in Korea is still insufficient compared to the number of gas stations, this result suggests building the infrastructure for electric vehicle charging stations could become a key factor in promoting the purchase of electric vehicles. In addition to car price and accessibility, the consumers in this study considered fuel cost and maximum driving distance to be almost equally important. For fuel type, the relative importance of electric, hybrid, and diesel vehicles is 13.02%, 11.69%, and 10.97%, respectively. Therefore, this study suggests the price and number of electric vehicle charging stations are the most important factors in securing the electric vehicle market share on the future automobile market.
For MWTP, the results reveal consumers are willing to pay 4.698 million KRW more to purchase electric instead of gasoline vehicles. In addition, when accessibility to charging stations increases by 1% compared to current accessibility to gasoline stations, the consumer MWTP was 400,000 KRW on average. Moreover, consumers are willing to pay 50,000 KRW on average for a 1 km increase in maximum driving distance. Estimated consumer MWTP can be used as basic reference to establish reasonable pricing policies, depending on technological improvements.
As a second step, we conducted market simulations based on the preceding estimation results for forecasting the future demand for electric vehicles. Table 4 shows a specification of vehicles close to reality and their choice probability. Regarding the high choice probability of a hybrid vehicle, the issue is whether the figure is different from the current market status. We note that hybrid vehicles were introduced on the Korean market and, moreover, ICE vehicles remain more of a focus than hybrid vehicles for major Korean automobile manufacturers, such as Hyundai Motors or KIA Motors. Thus, there can be a difference between the choice probability of hybrid vehicles and real market shares at present. (The real market share of hybrid vehicles was only 2.1%, 3.4%, and 4.6% in 2015, 2016, and 2017, respectively, but the growth rate has been recently increasing.) Under identical conditions related to brand variety, promotion, company’s market power, and others, the choice probabilities are as shown in Table 4.
Additionally, we observe the change in the market share of electric vehicles according to the improvement of key attributes associated with these vehicles. The assumptions for improvement come from the experimental setups in similar studies [15,31]. Figure 3 shows how the market share of electric vehicles changes depending on accessibility of charging stations, and maximum driving distance, fuel cost, and price of electric vehicles.
Next, we conduct a market simulation for the situation when more than two key attributes are improved jointly, which is a more realistic assumption for the near future. Table 5 shows the expected market share for each scenario.
In scenario 4 (denoted S.4), the infrastructure and technological level of electric vehicles are improved to the same level as for ICE vehicles, that is, the accessibility of charging stations reaches the current status of gasoline stations, maximum driving distance also becomes similar to that of ICE vehicles, and price of vehicles drops to the level of ICE vehicles. Then, our simulation shows the market share for electric vehicles on the Korean automobile market would be 39.14%.

4.2. Simulation for an Impact Assessment of Electric Vehicle Diffusion on the Korean Power Market

The simulation for impact assessment of electric vehicle diffusion on the Korean power industry was conducted according to the following process:
(1)
Develop an optimal market operation model with commercial optimization software, general algebraic modeling system (GAMS) [32], under the practical rule of the Korean power market operation with real data for 241 generators composing the Korean power system.
(2)
Estimate four representative daily electricity demand patterns for four seasons in 2016. These representative power demand patterns are used to reduce simulation time compared to the case where the simulation is conducted for 365-day demand patterns. The results of the system generation cost for each representative daily demand pattern can be multiplied by the number of days in the corresponding season and summed to calculate the total cost for one year. The season classification criteria of KEPCO in Table 6 is used to sort the 365 days.
A multivariate adaptive regression splines (MARS) technique was used to estimate representative the daily power demand patterns for 24 h. MARS is a non-parametric regression technique that can automatically model data nonlinearities [33,34,35]. The representative daily power demand patterns for the four seasons were obtained through the MARS technique that can be represented as the following functions for each hour:
D S Y S S P R I N G ( h ) = 49521.2 + 2219.1 M A X ( 0 , h 6 ) 4779 M A X ( 0 , h 11 ) + 3754.4 M A X ( 0 , h 13 ) 1180.1 M A X ( 0 , h 15 ) 602.3 M A X ( 0 , h 20 ) ,
D S Y S S U M M E R ( h ) = 28950.8 + 4753.5 M A X ( 0 , h 5 ) 2804.3 M A X ( 0 , h 11 ) + 1533.4 M A X ( 0 , 16 h ) 2734.6 M A X ( 0 , h 16 ) 1604.6 M A X ( 0 , h 21 ) ,
D S Y S A U T U M N ( h ) = 30508.4 + 4410.4 M A X ( 0 , h 5 ) 2480.3 M A X ( 0 , h 10 ) + 1365.9 M A X ( 0 , 16 h ) 2305.5 M A X ( 0 , h 16 ) 1487.3 M A X ( 0 , h 20 ) ,
D S Y S W I N T E R ( h ) = 52717.5 + 3063.5 M A X ( 0 , h 6 ) + 386.8 M A X ( 0 , 11 h ) 5974.5 M A X ( 0 , h 11 ) + 3615.1 M A X ( 0 , h 13 ) 1759.4 M A X ( 0 , h 18 ) 1561.3 M A X ( 0 , h 22 ) ,
where D S Y S S P R I N G ( h ) , D S Y S S U M M E R ( h ) , D S Y S A U T U M N ( h ) and D S Y S W I N T E R ( h ) are the functions for representative daily electricity demand patterns at the h -th hour, respectively.
(3)
Assume electric vehicle basic data. The number of registered passenger vehicles in Korea in 2016 was 17,338,000 according to Statistics Korea [36]. The average electric power consumption of an electric vehicle per kilometer is assumed to be 0.183 kWh/km [37]. The average driving distance in Korea has been estimated to be 39.7 km according to the Korea Transportation Safety Authority [38].
(4)
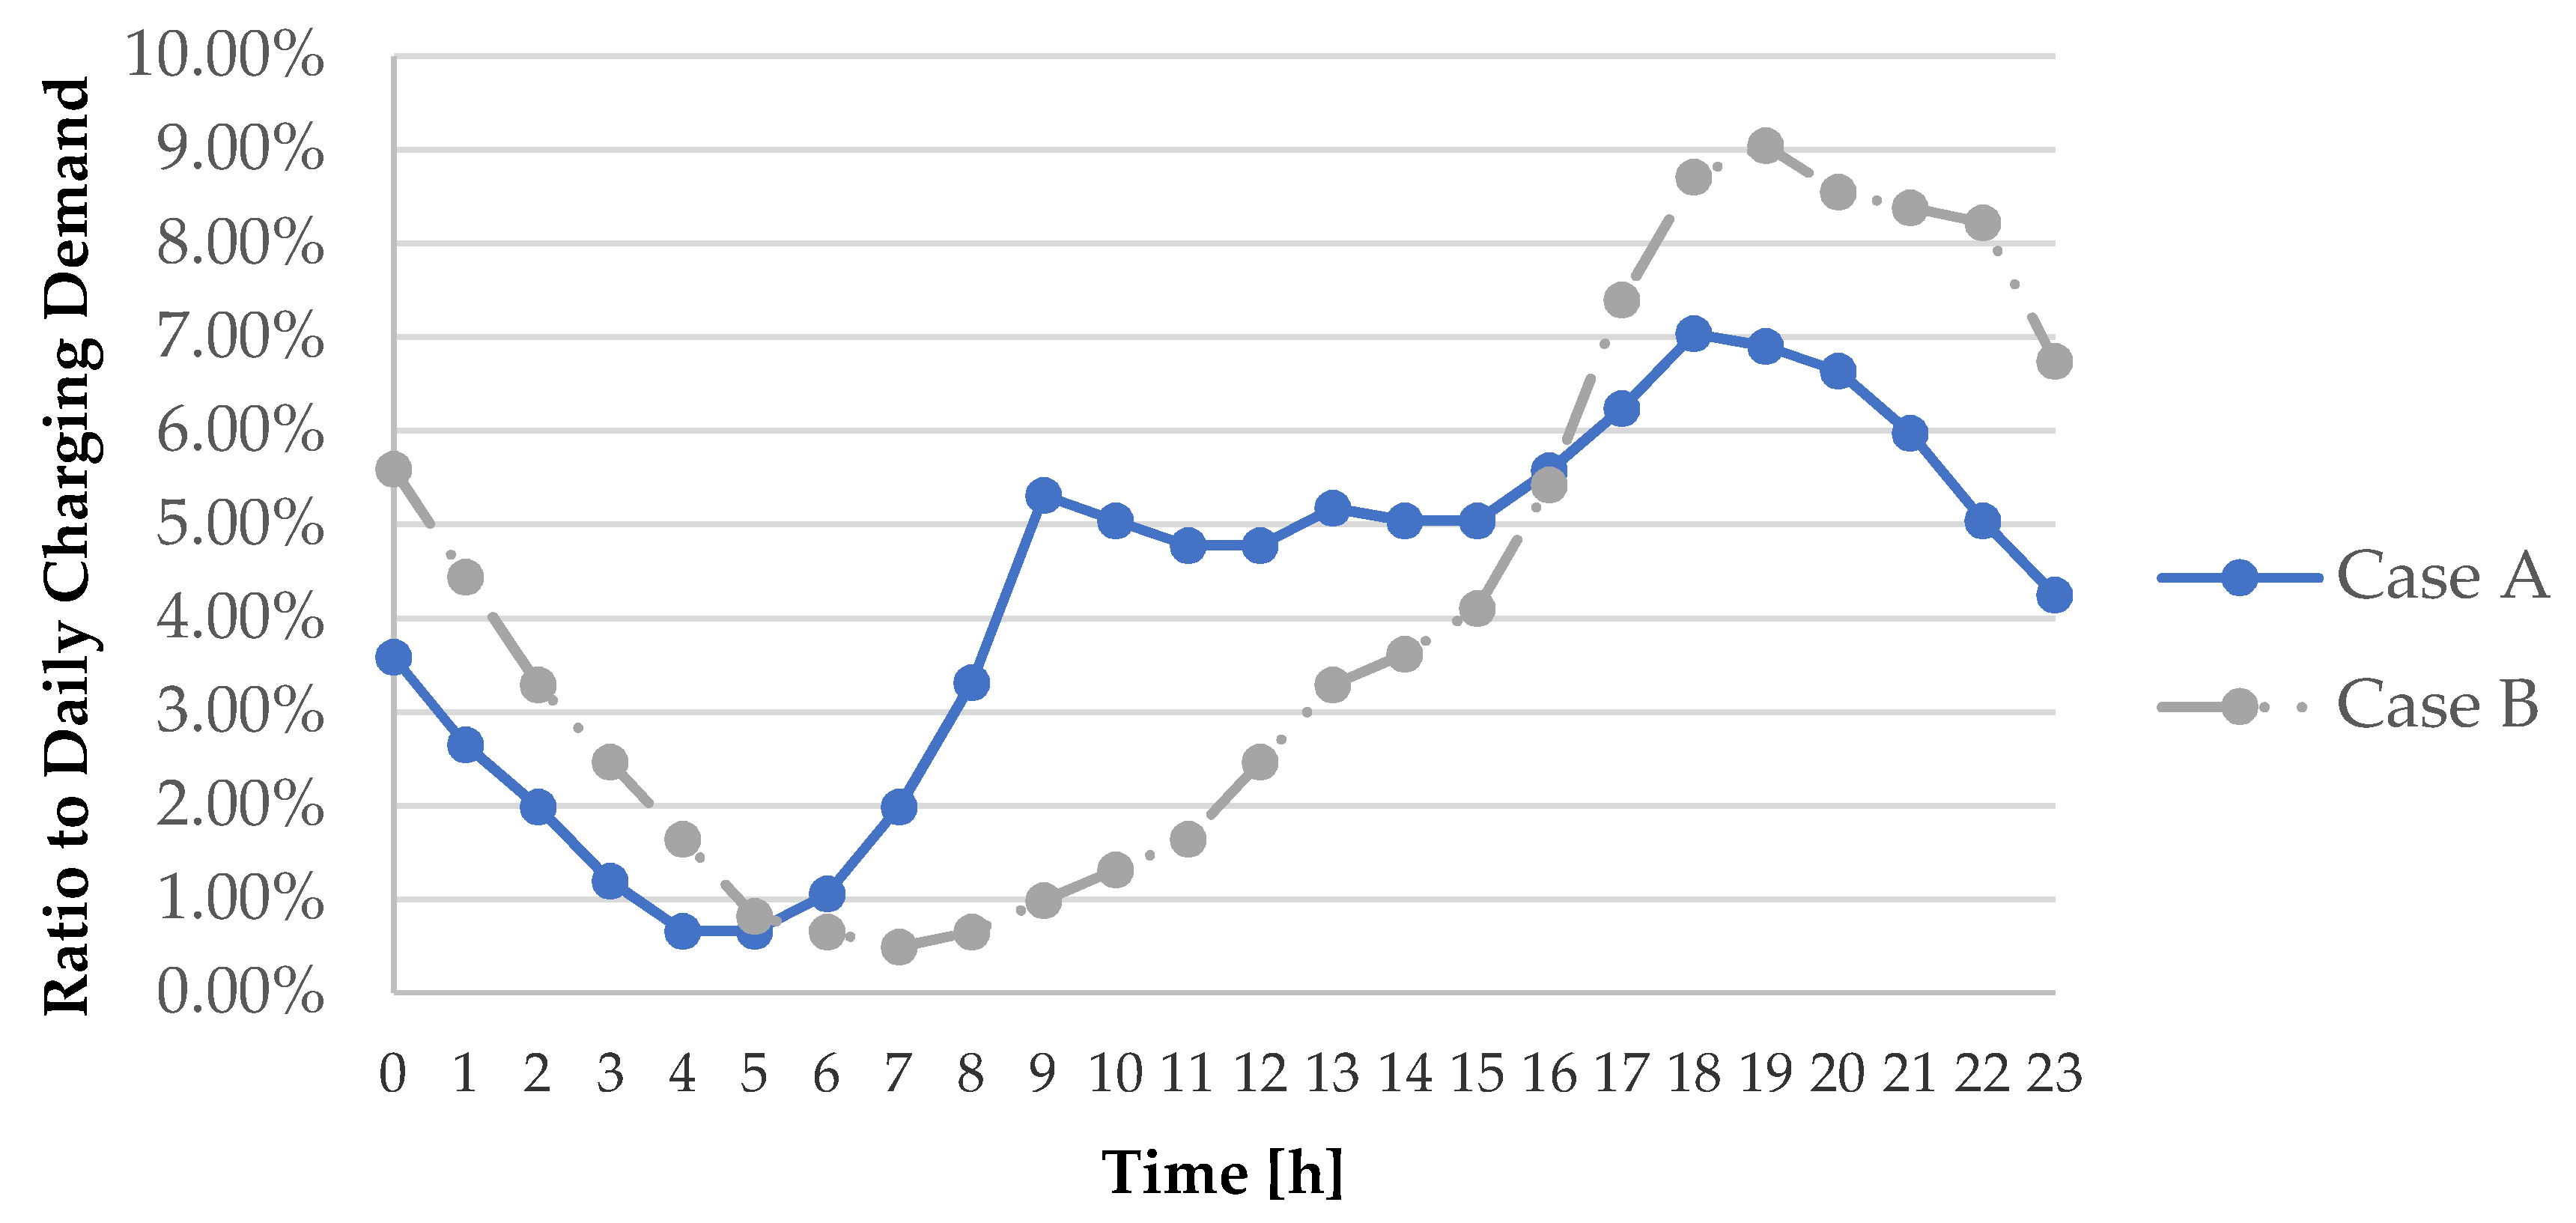
Assume several cases for the charging demand distribution of the electric vehicle over 24 h. The total daily charging demand for electric vehicles changes depends on the penetration ratio of electric vehicles multiplied by the total number of passenger vehicles in Korea. Additionally, the impact of this total daily charging demand can also be changed depending on how the charging demand would be distributed over 24 h. We assumed two different cases for the charging demand profile in Figure 4 by benchmarking the empirically obtained profiles of Weiller [16].
Table 7 shows the simulation results for the market operation model of the Korean power market. The system generation cost of the baseline case without consideration of electric vehicles is 36,395,537,380 KRW. As expected, given the same profile of charging demand, system generation costs increase as the penetration ratio of electric vehicles increases. In particular, the 39.14% penetration of electric vehicles can increase system generation costs by more than 10% compared to that of the baseline scenario on the Korean power market in both charging profile cases. However, a shortage of supply was not observed for this simulation.
From the comparison of the two cases designed to investigate the impact of charging demand distribution, the costs of Case B are somewhat larger than those of Case A in all electric vehicle penetration scenarios. Further, there is no dramatic difference between the results of the two cases because the difference in hourly increased charging demand is still insignificant compared to the system demand. This study assumes the electric vehicle charging demand is not concentrated over a certain time interval but is well-distributed over several time intervals, as depicted in Figure 4.

5. Conclusions and Policy Implications

This study explored the net impact of electric vehicle diffusion on the Korean power industry by specifying achievable market shares for electric vehicles based on customers’ preferences. To do this, we first estimated the consumer utility function by applying a random-coefficient logit model using conjoint data and then simulated the power market operation with real generation data, which accurately replicates the Korean wholesale power market.
According to the results of consumer preference analysis and demand forecasting, Korean customers were found to prefer electric vehicles over diesel or gasoline cars. However, limited access to charging stations, limited maximum driving distance, and a high vehicle price negatively influence the consumer choice of electric vehicles on the automobile market. However, scenario-based demand forecasting showed the market share of electric vehicles can reach approximately 40% of the total passenger car market in the event that the key attributes of electric vehicles become similar to those of ICE vehicles. This finding implies that an increase in the demand for electricity to charge electric vehicles cannot be neglected in the near future and would impact Korea’s power industry.
In the view of the government or regulatory agencies, the national impact of electric vehicle diffusion should be quantitatively estimated in advance. To analyze this impact, we quantitatively calculated the net impact of electric vehicle diffusion on the power market by estimating changes in system generation costs for the Korean power market using an optimal power market operation model, which KPX applies daily. From the simulation, we learned there would be an increase in system generation costs when a certain penetration ratio of electric vehicles is realized. Our results further revealed that the system generation cost increases up to 10.88% compared to the cost of the baseline scenario when the market share of electric vehicles becomes 39.14% of the total automobile market share, whereas the system generation cost will increase 1.95% in the current status, where the expected market share of electric vehicles is 7.36%.
Our empirical results have two policy implications. First, regarding the impacts on the electric vehicle and power industries, the diffusion of electric vehicles will not have a substantial effect on the power industry in the short term until the total market share of electric vehicles reaches a certain tipping point, but may have significant impact after that. Given that the speed of technological innovation related to electric vehicles is rapid, the tipping point for the demand of electric vehicles can be hastened to surpass that of ICE vehicles. However, the impact of electric vehicle diffusion is not that simple when we additionally consider the synergism with the expansion of renewable generation. In particular, there is a unified view towards a solar boom throughout the world [39]. The new Korean government has also announced they will do their best to increase the share of renewable energy in the annual power generation volume. Therefore, as mentioned by Albanese [40], it is obvious that the interaction between increasing electric vehicle demand and renewable energy expansion should not be neglected. Specifically, on markets with cost-based pool mechanisms like the Korean market, renewable energy sources with zero marginal cost may push conventional generators out of dispatch, which can decrease the system marginal price and system generation cost but increase the balancing cost for managing their intermittency simultaneously. If all these factors are tangled up with one other, it is difficult to simply forecast the consequences. As such, this issue will be covered in further research.
Second, the difference in system generation cost depending on the charging profiles of electric vehicles is not significant in our simulation results. However, if the charging demands are concentrated at certain peak times, it can threaten the reliability of the supply power system and cause shortage problems through ramping capabilities to cover up the sudden increased demand. If the charging demand throngs into certain nodes in the power system, there can be overload problems on transformers and other equipment. Additionally, exacerbating peak demand due to increased charging may also increase demand for peak-generation fuels such as oil and gas and can lead to increasing their import prices dramatically. Based on the views of Tverberg [41] and Kallis [42], it is expected their prices have the potential to be boosted in the long-term because of scarcity. This problem may be critical especially in Korea, which has very limited importing routes for these fuels. We should note the situation is not simple to predict on consideration of the rapidly changing international situation for Korea [43,44,45].
This study contributes to the literature on policy and strategy on electric vehicle diffusion by quantitatively estimating the market share of electric vehicles and its impact on the power industry. The study provides policymakers with directions for incentives and penalties for electric vehicle promotion and battery charging, respectively. However, further research should be conducted, because there are still some issues not covered in this study. For instance, other costs caused by the diffusion of electric vehicles must be identified. For instance, upgrading electricity transmission and the distribution network for hosting a significant number of electric vehicles is another important inter-industry impact of the diffusion of electric vehicles on the power industry. In addition, the issue of how to share and distribute the incremental cost from the diffusion of electric vehicles to the power industry should be discussed among stakeholders such as transmission companies, distribution companies, retail service companies, electric vehicle owners, and authorities.

Author Contributions

D.S. conducted demand forecasting with mixed logit model for the Korean automobile market; S.W.K. assessed the impact of electric vehicle charging based on power market simulation; J.A., Y.T.Y., and J.G.K. reviewed the logical structure and simulation results of this work.

Acknowledgments

This work was supported by the Seoul National University Research Grant in 2016.

Conflicts of Interest

The authors declare no conflict of interest.

References

  1. Kihm, A.; Trommer, S. The new car market for electric vehicles and the potential for fuel substitution. Energy Policy 2014, 73, 147–157. [Google Scholar] [CrossRef]
  2. Hardman, S.; Steinberger-Wilckens, R.; van der Horst, D. Disruptive innovations: The case for hydrogen fuel cells and battery electric vehicles. Int. J. Hydrog. Energy 2013, 38, 15438–15451. [Google Scholar] [CrossRef]
  3. Rezvani, Z.; Jansson, J.; Bodin, J. Advances in consumer electric vehicle adoption research: A review and research agenda. Transp. Res. Part D Transp. Environ. 2015, 34, 122–136. [Google Scholar] [CrossRef]
  4. Lu, C.; Rong, K.; You, J.; Shi, Y. Business ecosystem and stakeholders’ role transformation: Evidence from Chinese emerging electric vehicle industry. Expert Syst. Appl. 2014, 41, 4579–4595. [Google Scholar] [CrossRef]
  5. Hadley, S.W.; Tsvetkova, A.A. Potential impacts of plug-in hybrid electric vehicles on regional power generation. Electr. J. 2009, 22, 56–68. [Google Scholar] [CrossRef]
  6. Harris, C.B.; Webber, M.E. An empirically-validated methodology to simulate electricity demand for electric vehicle charging. Appl. Energy 2014, 126, 172–181. [Google Scholar] [CrossRef]
  7. Brady, J.; O’Mahony, M. Travel to work in Dublin. The potential impacts of electric vehicles on climate change and urban air quality. Transp. Res. Part D Transp. Environ. 2011, 16, 188–193. [Google Scholar] [CrossRef] [Green Version]
  8. Ma, H.; Balthasar, F.; Tait, N.; Riera-Palou, X.; Harrison, A. A new comparison between the life cycle greenhouse gas emissions of battery electric vehicles and internal combustion vehicles. Energy Policy 2012, 44, 160–173. [Google Scholar] [CrossRef]
  9. Brownstone, D.; Train, K. Forecasting new product penetration with flexible substitution patterns. J. Econom. 1998, 89, 109–129. [Google Scholar] [CrossRef] [Green Version]
  10. Ewing, G.; Sarigöllü, E. Assessing consumer preferences for clean-fuel vehicles: A discrete choice experiment. J. Public Policy Mark. 2000, 19, 106–118. [Google Scholar] [CrossRef]
  11. Horne, M.; Jaccard, M.; Tiedemann, K. Improving behavioral realism in hybrid energy-economy models using discrete choice studies of personal transportation decisions. Energy Econ. 2005, 27, 59–77. [Google Scholar] [CrossRef]
  12. Hausman, J.; McFadden, D. Specification tests for the multinomial logit model. Econometrica 1984, 52, 1219–1240. [Google Scholar] [CrossRef]
  13. Kim, Y.; Jeong, G.; Ahn, J.; Lee, J.-D. Consumer preferences for alternative fuel vehicles in South Korea. Int. J. Automot. Technol. Manag. 2007, 7, 327–342. [Google Scholar] [CrossRef]
  14. Ahn, J.; Jeong, G.; Kim, Y. A forecast of household ownership and use of alternative fuel vehicles: A multiple discrete-continuous choice approach. Energy Econ. 2008, 30, 2091–2104. [Google Scholar] [CrossRef]
  15. Shin, J.; Hong, J.; Jeong, G.; Lee, J. Impact of electric vehicles on existing car usage: A mixed multiple discrete–continuous extreme value model approach. Transp. Res. Part D Trans. Environ. 2012, 17, 138–144. [Google Scholar] [CrossRef]
  16. Weiller, C. Plug-in hybrid electric vehicle impacts on hourly electricity demand in the United States. Energy Policy 2011, 39, 3766–3778. [Google Scholar] [CrossRef]
  17. Kiviluoma, J.; Meiborn, P. Methodology for modelling plug-in electric vehicles in the power system and cost estimates for a system with either smart or dumb electric vehicles. Energy 2011, 36, 1758–1767. [Google Scholar] [CrossRef]
  18. Wang, J.; Liu, C.; Ton, D.; Zhou, Y.; Kim, J.; Vyas, A. Impact of plug-in hybrid electric vehicles on power systems with demand response and wind power. Energy Policy 2011, 39, 4016–4021. [Google Scholar] [CrossRef]
  19. Foley, A.; Tyther, B.; Calnan, P.; Gallachoir, B.O. Impacts of electric vehicle charging under electricity market operations. Appl. Energy 2013, 101, 93–102. [Google Scholar] [CrossRef]
  20. Bozic, D.; Pantos, M. Impact of electric-drive vehicles on power system reliability. Energy 2015, 83, 511–520. [Google Scholar] [CrossRef]
  21. Dharmakeerthi, C.H.; Mithulananthan, N.; Saha, T.K. Impact of electric vehicle fast charging on power system voltage stability. Int. J. Electr. Power Energy Syst. 2014, 57, 241–249. [Google Scholar] [CrossRef]
  22. Gray, M.K.; Morsi, W.G. Power quality assessment in distribution systems embedded with plug-in hybrid and battery electric vehicles. IEEE Trans. Power Syst. 2015, 30, 663–671. [Google Scholar] [CrossRef]
  23. Chintagunta, P.K.; Jain, D.C.; Vilcassim, N.J. Investigating heterogeneity in brand preferences in logit models for panel data. J. Mark. Res. 1991, 28, 417–428. [Google Scholar] [CrossRef]
  24. Kamakura, W.A.; Russell, G.J. A probabilistic choice model for market segmentation and elasticity structure. J. Mark. Res. 1989, 26, 379–390. [Google Scholar] [CrossRef]
  25. McFadden, D. Econometric models for probabilistic choice among products. J. Bus. 1980, 53, S13–S29. [Google Scholar] [CrossRef]
  26. Train, K.E. Discrete Choice Methods with Simulation, 2nd ed.; Cambridge University Press: Cambridge, UK, 2009. [Google Scholar]
  27. Shim, D.; Kim, S.W.; Altmann, J. Strategic management of residential electric services in the competitive market: Demand-oriented perspective. Energy Environ. 2018, 29, 49–66. [Google Scholar] [CrossRef]
  28. Jeong, G.; Lee, J. Estimating consumer preferences for online music services. Appl. Econ. 2010, 42, 3885–3893. [Google Scholar] [CrossRef]
  29. Korea Electric Power Corporation (KEPCO)-Electric Power Big Data Center. Available online: http://home.kepco.co.kr/kepco/BD/bigData/main/bigDataMain.do (accessed on 20 June 2017).
  30. Frangioni, A.; Gentile, C.; Lacalandra, F. Tighter approximated MILP formulations for unit commitment problems. IEEE Trans. Power Syst. 2009, 24, 105–113. [Google Scholar] [CrossRef]
  31. Hong, J.; Koo, Y.; Jeong, G.; Lee, J. Ex-ante evaluation of profitability and government’s subsidy policy on vehicle-to-grid system. Energy Policy 2012, 42, 95–104. [Google Scholar] [CrossRef]
  32. Soroudi, A. Power System Optimization Modeling in GAMS; Springer: Berlin, Germany, 2017. [Google Scholar]
  33. Friedman, J.H. Multivariate adaptive regression splines. Ann. Stat. 1991, 19, 1–67. [Google Scholar] [CrossRef]
  34. Kim, J.G.; Menzefricke, U.; Feinberg, F.M. Capturing flexible heterogeneous utility curves: A Bayesian spline approach. Manag. Sci. 2007, 53, 340–354. [Google Scholar] [CrossRef]
  35. Shim, D.; Kim, J.G.; Altmann, J. Strategic management of R&D and marketing integration for multi-dimensional success of new product developments: An empirical investigation in the Korean ICT industry. Asian J. Technol. Innov. 2016, 24, 293–316. [Google Scholar]
  36. Statistics Korea. The Number of Automobiles Registered by Year in Korea. Available online: http://www.index.go.kr/potal/stts/idxMain/selectPoSttsIdxSearch.do?idx_cd=1257&stts_cd=125702&clas_div=&idx_sys_cd= (accessed on 20 June 2017).
  37. Fetene, G.M.; Kaplan, S.; Mabit, S.L.; Jensen, A.F.; Prato, C.G. Harnessing big data for estimating the energy consumption and driving range of electric vehicles. Transp. Res. Part D Transp. Environ. 2017, 54, 1–11. [Google Scholar] [CrossRef]
  38. Korea Transportation Safety Authority. Survey on Average Driving Distance. Available online: https://www.ktdb.go.kr/www/selectTrnsportTreeView.do?key=32&idx=6720 (accessed on 6 May 2018).
  39. Meneguzzo, F.; Ciriminna, R.; Albanese, L.; Pagliaro, M. The great solar boom: A global perspective into the far reaching impact of an unexpected energy revolution. Energy Sci. Eng. 2015, 3, 499–509. [Google Scholar] [CrossRef]
  40. Albanese, L.; Ciriminna, R.; Meneguzzo, F.; Pagliaro, M. The impact of electric vehicles on the power market. Energy Sci. Eng. 2015, 3, 300–309. [Google Scholar] [CrossRef] [Green Version]
  41. Tverberg, G.E. Oil supply limits and the continuing financial crisis. Energy 2012, 37, 27–34. [Google Scholar] [CrossRef]
  42. Kallis, G.; Jalel, S. Oil and the economy: A systemic review of the literature for ecological economists. Ecol. Econ. 2017, 131, 561–571. [Google Scholar] [CrossRef]
  43. Rogers, H.V.; Stern, J. Challenges to JCC Pricing in Asian LNG Markets; Oxford Institute for Energy Studies: Oxford, UK, 2014. [Google Scholar]
  44. Rogers, H. Asian LNG Demand: Key Drivers and Outlook; Oxford Institute for Energy Studies: Oxford, UK, 2016. [Google Scholar]
  45. Stern, J. International gas pricing in Europe and Asia: A crisis for fundamentals. Energy Policy 2014, 62, 43–48. [Google Scholar] [CrossRef]
Figure 1. Structure of the Korean power industry.
Sustainability 10 01941 g001
Figure 2. Market and system operation process in the Korean power market.
Sustainability 10 01941 g002
Figure 3. Estimated market share according to the improvements in key attributes.
Sustainability 10 01941 g003
Figure 4. Charging demand profile of three cases [Unit: %]. Note: Case A, and Case B means “Charging at home, work, and commercial places” and “Home charging only,” respectively. Total charging demands are set to be equal in two cases.
Sustainability 10 01941 g004
Table 1. Demographic characteristics of the survey respondents.
FrequencyRatio
Sex
Male36450.27
Female36049.73
Age
20–298511.74
30–3916723.07
40–4919226.52
50–5919326.66
60–8712.01
Sum724100%
Table 2. Attribute and level of conjoint card.
AttributeLevelDescription
Fuel typeGasolineThe vehicle uses gasoline as fuel
DieselThe vehicle uses diesel as fuel
HybridThe vehicle uses both gasoline and electric battery, or diesel and electric battery as fuel
EVThe vehicle uses electric battery as fuel
(EV only needs battery charging in a station)
Accessibility (%)10, 50, 80, 100The ratio of charging stations to gas stations at present
Max driving distance (km)100, 250, 400Maximum driving distance of vehicle per one time refueling
Fuel cost (KRW/km)50, 100, 150The cost required to drive 1 km
Price of vehicle (million KRW)25, 24, 45, 55The initial price of vehicle
Note: “KRW” refers to the South Korean Won. According to the Bank of Korea (http://www.bok.or.kr), USD 1 equaled 1119.50 KRW as of May 2017.
Table 3. Estimation results of consumer preference.
VariableMean
[5%, 95%]
S.D.DistributionC( β )Average Relative ImportanceMWTP
(Million KRW)
Diesel−0.402
[−0.607, −0.211]
0.122Normal−0.4020610.97−5.785
Hybrid0.635
[0.396, 0.882]
0.146Normal0.6350711.697.33
EV0.515
[0.3012, 0.722]
0.128Normal0.5146113.024.698
Accessibility−4.294
[−4.474, −4.134]
0.104log-normal0.0136421.000.4
Distance−6.542
[−6.841, −6.292]
0.169log-normal0.0014410.320.05
Fuel_cost−5.043
[−5.279, −4.855]
0.127Negative log-normal−0.0064511.41−0.187
Price−3.337
[−3.516, −3.173]
0.105Negative log-normal−0.0355621.59
Table 4. Choice probability based on baseline scenario at present.
Baseline ScenarioGasolineDieselHybridEV
Accessibility (%)10010010010
Max driving distance (km)400400400100
Fuel cost (KRW/km)135736550
Price of car (million KRW)25354555
Choice Probability (%)29.8920.9143.525.66
Table 5. Estimated market share of electric vehicles with respect to improvement of key attributes.
Baseline ScenarioGasolineDieselHybridEVS.2GasolineDieselHybridEV
Accessibility10010010020 10010010050
Max Driving Distance400400400200 400400400300
Fuel cost 135736550 135736550
Price of car25354555 25354545
Choice Probability29.3620.5342.757.36 26.4718.5138.5416.47
S.3GasolineDieselHybridEVS.4GasolineDieselHybridEV
Accessibility10010010080 100100100100
Max Driving Distance400400400400 400400400400
Fuel cost 135736550 135736550
Price of car25354545 25354535
Choice Probability23.616.534.3625.54 19.2913.4928.0839.14
Table 6. The season classification criteria of KEPCO.
SeasonDate
Spring1 March–31 May
Summer1 June–31 August
Autumn1 September–31 October
Winter1 November–29 February of next year
Table 7. Simulation results for each charging profile scenario: system generation cost analysis in 2016 [Unit: KRW].
Case A
(Charging at Home, Work, and Commercial Places)
Case B
(Home Charging Only)
Baseline36,395,537,380
EV 7.36%37,105,540,177 (+1.95%)37,082,867,881 (+1.89%)
EV 16.47%38,007,364,082 (+4.43%)37,947,378,525 (+4.26%)
EV 25.54%38,938,146,577 (+6.99%)38,849,006,724 (+6.74%)
EV 39.14%40,356,238,651 (+10.88%)40,233,529,589 (+10.55%)
Note: “KRW” refers to the South Korean Won. According to the Bank of Korea (http://www.bok.or.kr), USD 1 equaled 1119.50 KRW as of May 2017.

